strategies for driving mobile broadband adoption. portio research ltd
DESCRIPTION
Increase non-voice service adoption, raise ARPU, increase consumer adoption of mobile data services.TRANSCRIPT

© 2010, Portio Research. All Rights Reserved 1
Strategies for Driving Mobile Data and Broadband Adoption

2 © 2010, Portio Research. All Rights Reserved
Strategies for Driving Mobile Data and Broadband Adoption
Portio Research Limited. Published June 2010 by Portio Research Limited © Copyright 2010. www.portioresearch.com
If you have any questions about the legal licence conditions under which this document has been distributed, please contact Portio Research on
Disclaimer and Legal Notices
Disclaimer Every care has been taken i n t he preparation of this study to ensure that the i nformation contained herein is accurate, factual and correct to the best of our knowledge, at time of publishing. All opinions, suppositions, estimates and recommendations included in this document are solely the opinions of the authors unless otherwise stated. Portio Research Limited accepts no liability for any loss or damage or unforeseen consequential loss or damage arising from the use of the information contained within this document. The opinions, suppositions, estimates and recommendations within this document cannot be guaranteed, and r eaders use this information at their own r isk. The i nformation published i n this document i s su bject to change w ithout notice at any t ime, and Portio Research L imited accepts no liability or obligation to inform the reader of such changes. Portio Research Limited do not promote or endorse any specific companies or products, the views and opinions we express in this document ar e wholly our own assessments, and i ndependent f rom any external i nterest or influence. Many terms and phrases and t rade names used i n this document are proprietary and P ortio R esearch Li mited recognises and ackn owledges that all trademarks are copyright, b elonging to their r espective o wners. Where p ossible, t his d ocument acco rds such terms and phrases and trade names to their respective owners. All Rights Reserved. No part of this document can be copied, shared, redistributed, transmitted, displayed in the public domain, stored or displayed on any internal or external company or private network or electronic retrieval system, nor reprinted, republished or reconstituted in any way without the express written permission of the publisher. Forwarding of this electronic document without the correct legal licence is theft. It’s unethical, immoral and against the law.
[email protected] If you did not buy this document and a co lleague or associate has sent it to you, do not assume you are l egally entitled to read i t, i t is your responsibility to ensure you have the correct l egal l icence t o read this document.

© 2010, Portio Research. All Rights Reserved 3
Strategies for Driving Mobile Data and Broadband Adoption
Contents Introduction ......................................................................................................................... 9 Worldwide Mobile Market ................................................................................................. 12 Worldwide Data Services Market ...................................................................................... 16
Strategies for Driving Data ARPU ................................................................................................. 16 Strategies for Creating End-User Demand for Mobile Data Services .............................................. 19 Data Services .............................................................................................................................. 20
Worldwide Mobile Messaging ........................................................................................... 22 Worldwide Mobile Messaging ....................................................................................................... 22 Dominance of SMS ...................................................................................................................... 23
Mobile Messaging – Strategy Case Studies ..................................................................... 26 Case Studies ............................................................................................................................... 26
Telkomsel Indonesia .................................................................................................................. 26 China Mobile ............................................................................................................................. 31 SoftBank Japan ......................................................................................................................... 36
Conclusion ................................................................................................................................... 42 Mobile Broadband – Introduction and Basics ................................................................. 45
Evolution of Mobile Broadband – GSM .......................................................................................... 46 UMTS (Universal Mobile Telecommunications System)............................................................... 46 HSPA (High Speed Packet Access) ........................................................................................... 46 HSPA+ (High-Speed Packet Access Plus/ Evolved HSPA) ......................................................... 46 LTE (Long Term Evolution) ........................................................................................................ 47 LTE Advanced (Long Term Evolution Advanced) ........................................................................ 47 EDGE (Enhanced Data Rates for GSM Evolution) ...................................................................... 48 EDGE Evolution or EDGE II ....................................................................................................... 48
Evolution of Mobile Broadband – CDMA ....................................................................................... 50 CDMA2000 1X EV-DO (Evolution-Data Only) Revision 0 ............................................................ 50 CDMA2000 1X EV-DO (Evolution-Data Only) Revision A ............................................................ 50 CDMA2000 1X EV-DO (Evolution-Data Only) Revision B ............................................................ 50
Evolution of Mobile Broadband – WiMAX ...................................................................................... 52 WiMAX (Worldwide Interoperability for Microwave Access) ......................................................... 52
Drivers and Inhibitors – Mobile Broadband .................................................................................... 53 Drivers ...................................................................................................................................... 53 Inhibitors ................................................................................................................................... 54
Mobile Broadband – Hardware ..................................................................................................... 55 USB Modems ............................................................................................................................ 55 Internal Modems ........................................................................................................................ 55 PC Cards .................................................................................................................................. 56
Regional Versions – Mobile Networks ........................................................................................... 57 Mobile Broadband – State of the Markets ........................................................................ 59
Market Size .................................................................................................................................. 59 Mobile Broadband User Base..................................................................................................... 59 Mobile Broadband Revenue ....................................................................................................... 63
Regional Trends ........................................................................................................................... 66 Europe ...................................................................................................................................... 66 Asia Pacific ............................................................................................................................... 68 North America ........................................................................................................................... 70 Latin America ............................................................................................................................ 72 Africa and Middle East ............................................................................................................... 74
Mobile Broadband – Strategy Case Studies .................................................................... 77 Case Studies ............................................................................................................................... 77
Vodafone UK ............................................................................................................................. 77 NTT DOCOMO Japan................................................................................................................ 82 Verizon Wireless US .................................................................................................................. 90 Orange UK ................................................................................................................................ 94
Key Parameters for the Uptake of Mobile Broadband .................................................................... 97 Mobile Applications – Introduction and Market Size ....................................................... 99

4 © 2010, Portio Research. All Rights Reserved
Strategies for Driving Mobile Data and Broadband Adoption
Overview ..................................................................................................................................... 99 Value Chain and Ecosystem ....................................................................................................... 100
Mobile Application Stores ......................................................................................................... 102 Business Model and Revenue Sharing ........................................................................................ 103
App-centric Model .................................................................................................................... 104 Operator-centric Model ............................................................................................................ 106
Market Size ................................................................................................................................ 108 Mobile Applications User Base ................................................................................................. 108 Mobile Applications Revenue ................................................................................................... 111
Mobile Applications – Strategy Case Studies ................................................................ 115 Apple App Store ......................................................................................................................... 115
Business Model ....................................................................................................................... 116 Key Developments .................................................................................................................. 116
Vodafone 360 ............................................................................................................................ 117 Business Model ....................................................................................................................... 119 Key Developments .................................................................................................................. 119
GetJar ....................................................................................................................................... 120 Business Model ....................................................................................................................... 120 Key Partnerships ..................................................................................................................... 121 Downloads .............................................................................................................................. 121
Conclusion ................................................................................................................................. 123 App Stores .............................................................................................................................. 123
Conclusion ...................................................................................................................... 127 Current Scenario ........................................................................................................................ 127 The Big Question ....................................................................................................................... 129
Investment in Mobile Broadband Networks ............................................................................... 130 Growing Demand for Data Services ......................................................................................... 130 Coping with High Data Use ...................................................................................................... 132 AT&T – A Lesson To Be Learnt ................................................................................................ 132
Possible Answers and the Way Forward ..................................................................................... 134 Augmenting Networks .............................................................................................................. 134 Getting the Pricing Models Right .............................................................................................. 135 Future Outlook......................................................................................................................... 137
Appendices ..................................................................................................................... 139 Glossary .................................................................................................................................. 140 Portio Research Classifications ................................................................................................ 153 Companies Mentioned in this Report ........................................................................................ 154 About the Authors .................................................................................................................... 157
Also available from Portio Research Limited................................................................................ 158

© 2010, Portio Research. All Rights Reserved 5
Strategies for Driving Mobile Data and Broadband Adoption
List of Figures Figure 1: Comparison on the basis of Mobile Broadband Parameters – Regional .......................... 10Figure 2: Mobile Subscribers – Worldwide (In Million, 2009 – 2014F) ........................................... 12Figure 3: Worldwide Subscriber Base – Regional Contribution (In Percent, 2009) ......................... 13Figure 4: Worldwide Subscriber Base – Regional Contribution (In Percent, 2014F) ....................... 13Figure 5: Mobile Subscriber Base Growth by Region (In Percent, 2009 – 2014F) .......................... 14Figure 6: Factors Behind a Successful Data Service .................................................................... 17Figure 7: Data Services Covered in Our Reports ‘Strategies for Creating End-User Demand for
Mobile Data Services’, ‘Strategies for Driving Data ARPU’ and ‘Strategies for Driving Mobile Data and Broadband Adoption’ .......................................................................... 20
Figure 8: SMS and MMS Traffic – Worldwide (In Billion, 2009) ..................................................... 22Figure 9: Mobile E-mail and Mobile IM Users – Worldwide (In Million, 2009) ................................. 22Figure 10: Revenue of Mobile Messaging Services (In USD Billion, 2009) ...................................... 23Figure 11: Comparison of Mobile Messaging Services ................................................................... 24Figure 12: SMS Traffic – Telkomsel and Excelcomindo (In Billion, 2007 – 2009) ............................. 26Figure 13: SMS Traffic – Telkomsel (In Billion, Q1 2009 – Q4 2009) ............................................... 27Figure 14: SMS Revenue – Telkomsel (In USD Million, Q1 2009 – Q3 2009) .................................. 27Figure 15: SMS Tariffs and Promotional Plans – Telkomsel ........................................................... 28Figure 16: MMS Users – China Mobile (In Million, End 2007 – End 2009) ....................................... 31Figure 17: MMS Traffic per Active User per Year – China Mobile (2007 – 2009) ............................. 32Figure 18: MMS Revenue – China Mobile (In USD Million, 2007 – 2009) ........................................ 32Figure 19: M-News Paying Subscribers – China Mobile (In Million, End 2006 – End 2009) .............. 34Figure 20: Number of S! Information Channel Applications – SoftBank (January 2010 – April 2010) 36Figure 21: 3G Subscribers as a Percentage of Total Subscriber Base – Japan (In Percent, Q2 2009 –
Q4 2009) ..................................................................................................................... 37Figure 22: Mobile Internet Subscribers – SoftBank (In Million, Q2 2009 – Q4 2009) ....................... 38Figure 23: Data ARPU – SoftBank (In USD, Q2 2009 – Q4 2009) .................................................. 38Figure 24: Revenue CAGR of Mobile Messaging Services (In Percent, 2009 – 2014F) ................... 42Figure 25: UMTS Evolution – Data Transfer Rates ......................................................................... 47Figure 26: LTE Evolution – Data Transfer Rates ............................................................................ 48Figure 27: EDGE Evolution – Data Transfer Rates ......................................................................... 49Figure 28: CDMA2000 Evolution – Data Transfer Rates ................................................................. 51Figure 29: Drivers of Mobile Broadband ......................................................................................... 53Figure 30: Inhibitors of Mobile Broadband ..................................................................................... 54Figure 31: USB Modems/ Dongles ................................................................................................ 55Figure 32: PC and Express Cards ................................................................................................. 57Figure 33: Mobile Broadband User Base – Worldwide (In Million, 2009 – 2014F) ............................ 59Figure 34: Worldwide Mobile Broadband Users – Regional Contribution (In Percent, 2009) ............. 60Figure 35: Worldwide Mobile Broadband Users – Regional Contribution (In Percent, 2014F) ......... 61Figure 36: Mobile Broadband User Base Growth by Region (In Percent, 2009 – 2014F) ................. 61Figure 37: Mobile Broadband Users as a Percentage of Total Mobile Subscribers – Regional (In
Percent, 2009 & 2014F) ............................................................................................... 62Figure 38: Mobile Broadband Revenue – Worldwide (In USD Billion, 2009 – 2014F) ....................... 63Figure 39: Worldwide Mobile Broadband Revenue – Regional Contribution (In Percent, 2009) ........ 64Figure 40: Worldwide Mobile Broadband Revenue – Regional Contribution (In Percent, 2014F) .... 64Figure 41: Mobile Broadband Revenue Growth by Region (In Percent, 2009 – 2014F) .................... 65Figure 42: Technology Forecast — Europe (In Million, End 2009 – End 2014F) .............................. 66Figure 43: Regional Trends — Europe .......................................................................................... 67Figure 44: Technology Forecast — Asia Pacific (In Million, End 2009 – End 2014F) ....................... 68Figure 45: Regional Trends — Asia Pacific .................................................................................... 69Figure 46: Technology Forecast — North America (In Million, End 2009 – End 2014F) ................... 70Figure 47: Regional Trends — North America ................................................................................ 71Figure 48: Technology Forecast — Latin America (In Million, End 2009 – End 2014F) .................... 72Figure 49: Regional Trends — Latin America ................................................................................. 73Figure 50: Technology Forecast —Africa and Middle East (In Million, End 2009 – End 2014F) ........ 74Figure 51: Regional Trends — Africa and Middle East ................................................................... 75
6 © 2010, Portio Research. All Rights Reserved
Strategies for Driving Mobile Data and Broadband Adoption
Figure 52: 3G Subscribers as a Percentage of Total Subscriber Base – The UK (In Percent, December 2009) .......................................................................................................... 78
Figure 53: Increase in 3G Subscribers Percentage – The UK (In Percentage Points, Q1 2009 – Q4 2009) .......................................................................................................................... 78
Figure 54: FOMA Subscribers and Percentage of FOMA Subscribers in Total Subscriber Base – NTT DOCOMO (Q2 2009 – Q4 2009) .................................................................................. 82
Figure 55: Packet ARPU – NTT DOCOMO (In USD, Q2 2009 – Q4 2009) ...................................... 83Figure 56: i-mode ARPU – NTT DOCOMO (In USD, Q2 2009 – Q4 2009) ...................................... 84Figure 57: Subscribers – Bee TV (In Million, Q2 2009 – Q4 2009) .................................................. 85Figure 58: Subscribers – i-concier (In Million, Q2 2009 – Q4 2009) ................................................. 85Figure 59: Number of Content Sites – NTT DOCOMO (Q2 2009 – Q4 2009) .................................. 86Figure 60: Subscribers – Pake-hodai (In Million, Q2 2009 – Q4 2009) ............................................ 86Figure 61: PC Data Communication Devices Sold – NTT DOCOMO (In Million, Q2 2009 – Q4 2009)
..
............................................................................................................................... 87Figure 62: PC Data Communications Flat Rate and Use Based Data Plan Subscriptions – NTT
DOCOMO (In Million, Q2 2009 – Q4 2009) ................................................................... 87Figure 63: Data ARPU – The US (In USD, Q1 2009 – Q4 2009) ..................................................... 90Figure 64: Monthly Data Plans for Mobile Subscribers – Verizon Wireless (March 2010) ................. 92Figure 65: MNOs’ Absolute and Percentage Growth in 3G Subscriber Base – The UK (2009) ......... 94Figure 66: 3G Dongle Subscribers and Percentage of 3G Dongle Subscribers in Total 3G Subscriber
Base – Orange UK (Q2 2009 – Q4 2009) ..................................................................... 95Figure 67: Basic Value Chain of the Mobile Applications Market ................................................... 101Figure 68: App-centric Business Model ....................................................................................... 104Figure 69: Operator-centric Business Model ................................................................................ 106Figure 70: Revenue Sharing in the Case of an Operator-centric Business Model .......................... 107Figure 71: Mobile Applications User Base – Worldwide (In Million, 2009 – 2014F) ........................ 108Figure 72: Worldwide Mobile Applications Users – Regional Contribution (In Percent, 2009) ......... 109Figure 73: Worldwide Mobile Applications Users – Regional Contribution (In Percent, 2014F) ..... 110Figure 74: Mobile Applications User Base Growth by Region (In Percent, 2009 – 2014F) .............. 110Figure 75: Mobile Applications Revenue – Worldwide (In USD Billion, 2009 – 2014F) ................... 111Figure 76: Worldwide Mobile Applications Revenue – Regional Contribution (In Percent, 2009) .... 112Figure 77: Worldwide Mobile Applications Revenue – Regional Contribution (In Percent, 2014F) 112Figure 78: Mobile Applications Revenue Growth by Region (In Percent, 2009 – 2014F) ................ 113Figure 79: Apple’s App Store – Total Application Downloads ........................................................ 115Figure 80: Break-out of Available Applications by Category – Apple App Store (In Percent, April 2010)
............................................................................................................................. 116Figure 81: Mobile Broadband User Base as a Percentage of Total Mobile Subscribers – Worldwide
(In Percent, 2009 – 2014F) ........................................................................................ 128Figure 82: Revenue CAGR of Mobile Data Services – Worldwide (In Percent, 2009–2014F) ......... 129Figure 83: Mobile Broadband CAPEX and Revenues by Region (In USD Billion, 2010F) ............... 130Figure 84: Average Monthly Data Use for USB Dongles, Feature Phones and Smartphones –
Worldwide (In GB, 2009) ............................................................................................ 131Figure 85: Average Worldwide Selling Price of Nokia Handsets and Apple’s iPhone (In USD, 2007 –
2009) ........................................................................................................................ 135Figure 86: Average Cost per MB of Mobile Data Services – North America (In USD, 2007 – 2009) 136

© 2010, Portio Research. All Rights Reserved 7
Strategies for Driving Mobile Data and Broadband Adoption
List of Tables Table 1: Mobile Subscribers – Regional (In Million, 2009 – 2014F) .............................................. 12Table 2: Success Factors – Telkomsel Indonesia ....................................................................... 30Table 3: Success Factors – China Mobile ................................................................................... 35Table 4: Success Factors – SoftBank Japan ............................................................................... 41Table 5: Factors Affecting the Uptake of Mobile Messaging Services .......................................... 43Table 6: Number of Network Providers with High Speed Network Deployments – Regional (March
2010) .......................................................................................................................... 45Table 7: Examples of Partnerships between Mobile Operators and Laptop Manufacturers ........... 56Table 8: Regional Versions – Mobile Networks ........................................................................... 57Table 9: Mobile Broadband User Base – Regional (In Million, 2009 – 2014F) .............................. 60Table 10: Mobile Broadband User Base as a Percentage of Total Mobile Subscribers – Regional (In
Percent, 2009 – 2014F) ............................................................................................... 62Table 11: Mobile Broadband Revenue – Regional (In USD Billion, 2009 – 2014F) ......................... 63Table 12: Success Factors – Vodafone UK .................................................................................. 81Table 13: Success Factors – NTT DOCOMO Japan ..................................................................... 89Table 14: MNOs’ Key Performance Indicators – The US (2009) .................................................... 90Table 15: Success Factors – Verizon Wireless US ....................................................................... 93Table 16: Success Factors – Orange UK ...................................................................................... 96Table 17: Strategies to Push Mobile Broadband Uptake ................................................................ 97Table 18: Major Application Stores ............................................................................................. 103Table 19: Mobile Applications User Base – Regional (In Million, 2009 – 2014F) ........................... 109Table 20: Mobile Applications Revenue – Regional (In USD Million, 2009 – 2014F) ..................... 111Table 21: Top 20 Applications on GetJar and Total Downloads, as of November 2009 ................ 122Table 22: Key Success Factors for Application Stores ................................................................ 125Table 23: Mobile Applications and Data Transfer Rate Requirements .......................................... 131Table 24: Strategies to Cope with the Increasing Demand Data Services place on Networks ....... 134Table 25: Prices of iPhone Models offered by AT&T ................................................................... 136

8 © 2010, Portio Research. All Rights Reserved
Strategies for Driving Mobile Data and Broadband Adoption
Chapter 1 Introduction
© 2010, Portio Research. All Rights Reserved 9
Strategies for Driving Mobile Data and Broadband Adoption
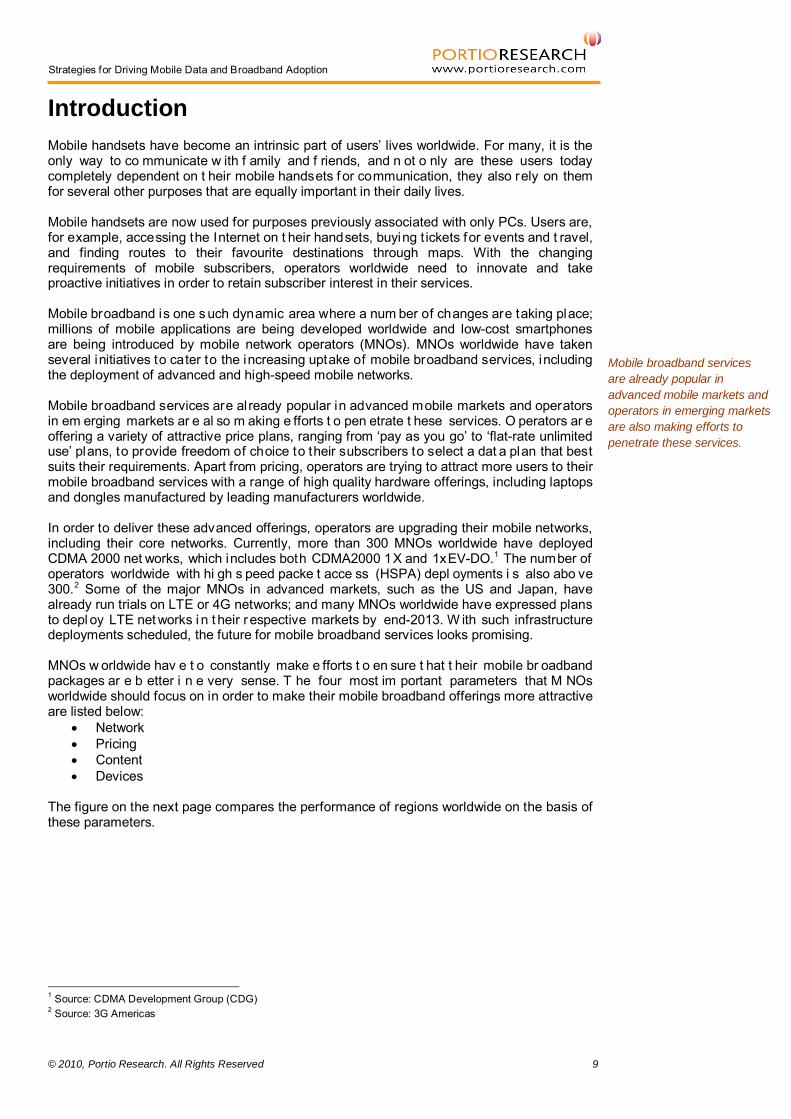
Introduction Mobile handsets have become an intrinsic part of users’ lives worldwide. For many, it is the only way to co mmunicate w ith f amily and f riends, and n ot o nly are these users today completely dependent on t heir mobile handsets f or communication, they also rely on them for several other purposes that are equally important in their daily lives. Mobile handsets are now used for purposes previously associated with only PCs. Users are, for example, accessing the Internet on t heir handsets, buying t ickets for events and t ravel, and finding routes to their favourite destinations through maps. With the changing requirements of mobile subscribers, operators worldwide need to innovate and take proactive initiatives in order to retain subscriber interest in their services. Mobile broadband is one s uch dynamic area where a num ber of changes are taking place; millions of mobile applications are being developed worldwide and low-cost smartphones are being introduced by mobile network operators (MNOs). MNOs worldwide have taken several initiatives to cater to the increasing uptake of mobile broadband services, including the deployment of advanced and high-speed mobile networks. Mobile broadband services are al ready popular in advanced mobile markets and operators in em erging markets ar e al so m aking e fforts t o pen etrate t hese services. O perators ar e offering a variety of attractive price plans, ranging from ‘pay as you go’ to ‘flat-rate unlimited use’ plans, to provide freedom of choice to their subscribers to select a dat a plan that best suits their requirements. Apart from pricing, operators are trying to attract more users to their mobile broadband services with a range of high quality hardware offerings, including laptops and dongles manufactured by leading manufacturers worldwide. In order to deliver these advanced offerings, operators are upgrading their mobile networks, including their core networks. Currently, more than 300 MNOs worldwide have deployed CDMA 2000 net works, which includes both CDMA2000 1X and 1xEV-DO.1 The number of operators worldwide with hi gh s peed packe t acce ss (HSPA) depl oyments i s also abo ve 300.2
• Network
Some of the major MNOs in advanced markets, such as the US and Japan, have already run trials on LTE or 4G networks; and many MNOs worldwide have expressed plans to depl oy LTE net works i n t heir r espective markets by end-2013. W ith such infrastructure deployments scheduled, the future for mobile broadband services looks promising. MNOs w orldwide hav e t o constantly make e fforts t o en sure t hat t heir mobile br oadband packages ar e b etter i n e very sense. T he four most im portant parameters that M NOs worldwide should focus on in order to make their mobile broadband offerings more attractive are listed below:
• Pricing • Content • Devices
The figure on the next page compares the performance of regions worldwide on the basis of these parameters.
1 Source: CDMA Development Group (CDG) 2 Source: 3G Americas
Mobile broadband services are already popular in advanced mobile markets and operators in emerging markets are also making efforts to penetrate these services.

10 © 2010, Portio Research. All Rights Reserved
Strategies for Driving Mobile Data and Broadband Adoption
North America leads other regions worldwide in terms of advanced mobile network deployments and i nnovative content offerings. Verizon and A T&T are all s et t o launch 4G networks in 2011, f or which t rials are currently running. When it comes to mobile content, Apple’s App Store is the clear leader among application stores. Europe al so scores hi gh on t his net work parameter, at tributable primarily to the advanced Western European markets – as many countries in Eastern Europe are still developing their networks. In t erms of devices and pr icing of se rvices, A sia P acific i s the leading regional market. In some co untries, such a s Chi na an d I ndia, MNOs are f looding the market w ith low-cost smartphones capable of per forming any function and r unning any application. Whereas in markets such as Japan and South Korea, MNOs are offering some of the most adv anced handsets t hat al low subscribers to get t he b est user experience f rom mobile appl ications. MNOs in Asia Pacific are known to offer mobile services at prices well below the worldwide average, as they recognise that pricing is probably the most important factor influencing the decision of the r egion’s m obile subscribers. For t his reason, MNOs i n Asia P acific are especially careful when pricing their offerings.
3 Note: The value of each axis ranges between 0 and 5, with 0 denoting the worst performer and 5 denoting the best performer for the respective parameter. For instance, a score of 5 for pricing does not imply that the region has the highest prices, but rather it is offering services at low prices keeping the subscribers’ price sensitivity in perspective.
Figure 1: Comparison on the basis of Mobile Broadband Parameters – Regional3
Source: Portio Research Ltd.
MNOs in Asia Pacific are known to offer mobile services at prices well below the worldwide average, as they recognise that pricing is probably the most important factor influencing the decision of the region’s mobile subscribers.
0
1
2
3
4
5Network
Pricing
Content
Devices
North America Europe Asia Pacific Latin America Africa and Middle East

© 2010, Portio Research. All Rights Reserved 11
Strategies for Driving Mobile Data and Broadband Adoption
Chapter 2 Worldwide Mobile Market
12 © 2010, Portio Research. All Rights Reserved
Strategies for Driving Mobile Data and Broadband Adoption
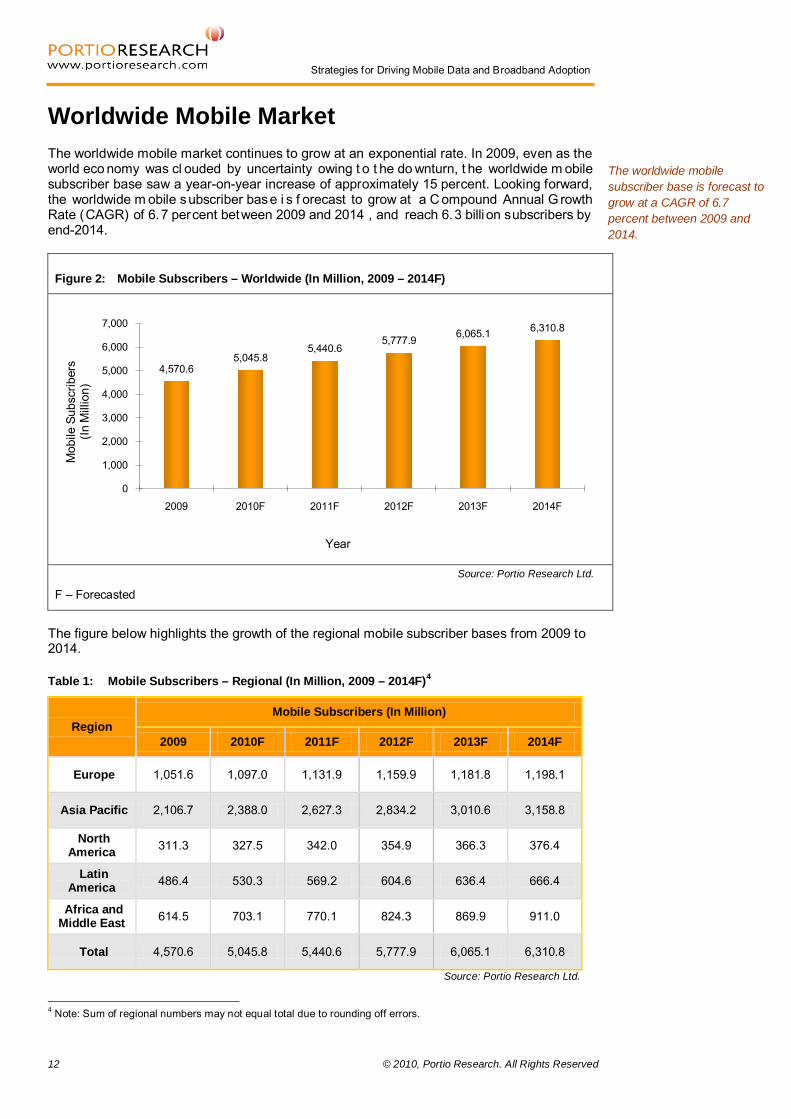
Worldwide Mobile Market The worldwide mobile market continues to grow at an exponential rate. In 2009, even as the world eco nomy was cl ouded by uncertainty owing t o t he do wnturn, t he worldwide m obile subscriber base saw a year-on-year increase of approximately 15 percent. Looking forward, the worldwide m obile subscriber base i s f orecast to grow at a C ompound Annual G rowth Rate (CAGR) of 6.7 percent between 2009 and 2014 , and reach 6.3 billi on subscribers by end-2014.
Figure 2: Mobile Subscribers – Worldwide (In Million, 2009 – 2014F)
Source: Portio Research Ltd.
F – Forecasted
The figure below highlights the growth of the regional mobile subscriber bases from 2009 to 2014.
Table 1: Mobile Subscribers – Regional (In Million, 2009 – 2014F)4
Region Mobile Subscribers (In Million)
2009 2010F 2011F 2012F 2013F 2014F
Europe 1,051.6 1,097.0 1,131.9 1,159.9 1,181.8 1,198.1
Asia Pacific 2,106.7 2,388.0 2,627.3 2,834.2 3,010.6 3,158.8
North America 311.3 327.5 342.0 354.9 366.3 376.4
Latin America 486.4 530.3 569.2 604.6 636.4 666.4
Africa and Middle East 614.5 703.1 770.1 824.3 869.9 911.0
Total 4,570.6 5,045.8 5,440.6 5,777.9 6,065.1 6,310.8
Source: Portio Research Ltd.
4 Note: Sum of regional numbers may not equal total due to rounding off errors.
4,570.65,045.8
5,440.65,777.9 6,065.1 6,310.8
0
1,000
2,000
3,000
4,000
5,000
6,000
7,000
2009 2010F 2011F 2012F 2013F 2014F
Mob
ile S
ubsc
riber
s(In
Mill
ion)
Year
The worldwide mobile subscriber base is forecast to grow at a CAGR of 6.7 percent between 2009 and 2014.

© 2010, Portio Research. All Rights Reserved 13
Strategies for Driving Mobile Data and Broadband Adoption Asia Pacific possesses the largest mobile subscriber base worldwide. In 2009, this regional subscriber base constituted 46.1 percent of the worldwide mobile subscriber base; Europe placed second with a 23 percent contribution. The figure below shows the regional share in the worldwide mobile subscriber base in 2009.
Asia Pacific will continue to dominate the worldwide mobile industry in terms of subscriber base in the coming years, and will strengthen its position further with over 50 percent of the worldwide mobile subscriber base residing in the region by end-2014. Europe is expected to lose some of its share, with its contribution dropping to 19 percent by end-2014. The figure below highlights the regional share in the worldwide mobile subscriber base in 2014.
5, 6 Note: The percentages do not add up to 100 percent because of rounding off errors.
Figure 3: Worldwide Subscriber Base – Regional Contribution (In Percent, 2009)5
Source: Portio Research Ltd.
Figure 4: Worldwide Subscriber Base – Regional Contribution (In Percent, 2014F)6
Source: Portio Research Ltd.
F – Forecasted
23.0%
46.1%6.8%
10.6%
13.4%
Europe Asia Pacific North America Latin America Africa and Middle East
19.0%
50.1% 6.0%
10.6%
14.4%
Europe Asia Pacific North America Latin America Africa and Middle East

14 © 2010, Portio Research. All Rights Reserved
Strategies for Driving Mobile Data and Broadband Adoption
The worldwide mobile subscriber base is forecast to grow at a CAGR of 6.7 percent between 2009 and 2014. During this period, Asia Pacific will lead regions worldwide in terms of subscriber growth with a CAGR of 8.4 percent, albeit with Africa and Middle East in close pursuit, while Europe is ant icipated t o witness t he l owest growth rate with a CA GR of 2. 6 percent.
Figure 5: Mobile Subscriber Base Growth by Region (In Percent, 2009 – 2014F)
Source: Portio Research Ltd.
F – Forecasted
8.4
2.6
3.9
6.5
8.2
0
3
6
9
Asia Pacific Europe North America Latin America Africa and Middle East
CA
GR
(In
Per
cent
)
Region
CAGR Worldwide = 6.7 % CAGR 6.7%

© 2010, Portio Research. All Rights Reserved 15
Strategies for Driving Mobile Data and Broadband Adoption
Chapter 3 Worldwide Data Services Market
16 © 2010, Portio Research. All Rights Reserved
Strategies for Driving Mobile Data and Broadband Adoption
Worldwide Data Services Market
‘Strategies for Dr iving Mobile Dat a and B roadband Adoption’ i s t he l atest edi tion in Portio Research’s series of reports covering the worldwide mobile data services market. It follows earlier analysis in Portio’s ‘Strategies for Driving Data ARPU’ (published in 2008) and ‘S trategies f or Cr eating E nd-User Dem and f or M obile Dat a S ervices’ (published in 2006), which both covered the popular data services of their time, and the strategies adopted by MNOs worldwide. The section below briefly discusses the evolution of mobile data services and the ef fective strategies adopted by MNOs to popularise their data offerings. Strategies for Driving Data ARPU
The ‘Strategies f or Dr iving Dat a A RPU’ report anal ysed m obile oper ators’ shift i n focus towards data services, mainly due t o decl ining revenues from voice services. This r eport focussed on summarising successful data strategies adopted by mobile network operators, and covered the following types of services:
• Messaging services SMS Mobile e-mail Mobile IM
• Non-messaging mobile services Mobile music Mobile games Mobile TV and video Mobile user generated content Mobile commerce Mobile portals
Furthermore, t he r eport i ncluded i nformation on i nnovative dat a s ervices adopt ed by emerging nations such as India, Egypt, China, South Africa and Kenya. This report summarised various f actors t hat enabl e MNOs to l aunch and dr ive successful data services. Let us look at the highlights of these factors.

© 2010, Portio Research. All Rights Reserved 17
Strategies for Driving Mobile Data and Broadband Adoption
Figure 6: Factors Behind a Successful Data Service
Source: Portio Research Ltd. Expand Perceived Value The r eport hi ghlighted t he im portance of implementing a s ervice t hat adds v alue t o subscribers, rather t han being just an addi tion/upgrade t o t he exi sting ar ray of s ervices. Furthermore, it is equally important to price the service while keeping in mind the target audience. The service price is a combination o f t he following factors – understanding t he target audi ence and t heir pr eferences, t he value t hat t he new service w ill deliv er t o the audience, and a cost that falls within the spending power of the target audience. Striking the right balance between these factors can make a new data service successful. A good ex ample o f de livering value t o s ubscribers i s V odafone E gypt’s M inicall s ervice. Minicall is an audi o m essaging service t hat all ows subscribers t o r ecord sh ort voice messages and send them as SMS to any network. Minimise ‘Clicks to Access’ For mass adoption of a data service, the operator should ensure that the usability of such a service is simple and t he service is easy to acce ss. A subscriber may lose interest if they have to go through several links/buttons to access the service. Though it is understandable that not all services can be provided at the single click of a button, the operator should ensure that the portal that hosts the data service is accessible and easy to use. 3 I talia launched new han dsets al ong with the l aunch of its mobile T V s ervices. T hese handsets came with a TV button that gave subscribers easy access to mobile TV. Choose the Right Data Service An operator should not only understand the subscriber’s need for a data service, it should also under stand t he r esources required to im plement s uch a s ervice. Each dat a s ervice requires a different degree of resources; an operator should keep a watchful eye over the feasibility of i ntroducing a s ervice, eas e of upgr ading it, and t he ca pital and manpower required.
Factors Behind a
Successful Data
Service
Expand Perceived
Value
Minimize 'Clicks to Access'
Choosing the Right
Data Service
Launch Timing
Business Model
Continuing Updgrades
An operator should not only understand the subscriber’s need for a data service, it should also understand the resources required to implement such a service.

18 © 2010, Portio Research. All Rights Reserved
Strategies for Driving Mobile Data and Broadband Adoption
Launch Timing Correctly planning the right time to launch a data service plays a very important part in helping subscribers to easily relate to the service. Among the notable success stories highlighting the importance of effective launch timing is NTT DOCOMO’s l aunch of m obile e-mail services in Ja pan, since Ja panese subscribers were more inclined to write lengthy messages, as opposed to the general t rend of sending SMS. Similarly, 3 Italia launched its mobile TV services during the 2006 football World Cup (which Italy went on to win). These two services garnered success with increased user base for the services, and subsequently increased data ARPU. Creating the Right Business Model For a data service to be a commercial success, an appropriate business model must be identified. Even if a data service achieves high adoption rates, the operator may not gain the maximum benefit if the business model is not right. As data services involve other players in the value chain, it is important for the operator to have control over this value chain to garner success from the services. NTT DOCOMO’s DCMX (Mobile Credit Card) service was lauded for its successful business model. N TT DO COMO acq uired a s take i n Sumitomo Mitsui Car ds, a co mpany with experience i n del ivering cr edit ca rd s ervices. T his par tnership was cr ucial for cr eating a successful business model for the DCMX data service. Be Ready with Upgrades The success of a dat a service is quickly outlived by new innovative services; its lifecycle is short due to the high number of innovations in the mobile industry. Hence, operators should offer regular upgrades to the portfolio of services provided. The pr ogression f rom monophonic r ingtones t o pol yphonic ringtones t o ca ller r ing back tones, and f inally, to full t rack music downloads demonstrates the importance of upgrades within existing services.
Correctly planning the right time to launch a data service plays a very important part in helping subscribers to easily relate to the service.
The success of a data service is quickly outlived by new innovative services; its lifecycle is short due to the high number of innovations in the mobile industry.

© 2010, Portio Research. All Rights Reserved 19
Strategies for Driving Mobile Data and Broadband Adoption Strategies for Creating End-User Demand for Mobile Data Services
Our ‘S trategies for Cr eating E nd-User Dem and f or M obile Dat a S ervices’ r eport was released in 2006. As voice services were getting commoditised in the developed nations and operators were forced to adopt new data services, this report analysed the strategies adopted by operators for different mobile services. This report acted as a ‘best practice’ case hi story that co uld be f ollowed by mobile ope rators. S ome o f t he im portant recommendations made by the report are as follows: Choice and Flexibility A dat a s ervice w ill be s uccessful if it offers several options. T hese opt ions can be with respect t o t he a vailability of t he co ntent and t he hands ets, and al so h ow t he co ntent i s stored in the handset after its purchase. Segmentation Segmenting the data service according to the target audience is a key factor in the success of the service. A data service, even if it is good, may not achieve success if it is not targeted at the right audience. Low-Cost Services and Transparent Pricing A data service should be priced according to the affordability of the target audience. Additionally, a service should be cross-subsidised; for example, to drive the use of SMS, the operator can increase voice tariffs and simultaneously reduce SMS prices. High-Value Proposition A subscriber will use a data service only if they can realise the value in using such a service. The value offered by the service should be per ceived as greater than the cost of using the service. Focus on Brand Subscribers feel more confident in using the services of a known brand. Hence, branding is a key aspect that drives the uptake of a s ervice. Operators should create partnerships with leading brands to provide data services. Innovation Innovative s ervices al ways ca tch subscribers’ attention. A n i nnovative s ervice s hould be supplemented with devices that can support it. Simplicity and Ease of Use Operators and handset vendors should pay attention to the user-interface of a data service. A great data service that is not easy to use may not garner success. SMS is an apt example in this case, as the service is easy to use. Handsets Handset vendors should work in coordination with mobile operators to launch handsets that are capable of supporting i nnovative services l aunched by operators. Handsets should be simple to use and offer several choices in terms of features and prices to match subscribers’ expectations.
A subscriber will use a data service only if they can realise the value in using such a service. The value offered by the service should be perceived as greater than the cost of using the service.

20 © 2010, Portio Research. All Rights Reserved
Strategies for Driving Mobile Data and Broadband Adoption
Data Services
Figure 7: Data Services Covered in Our Reports ‘Strategies for Creating End-User Demand for Mobile Data Services’, ‘Strategies for Driving Data ARPU’ and ‘Strategies for Driving Mobile Data and Broadband Adoption’
Source: Portio Research Ltd.
Messaging Services
• SMS • MMS • E-Mail • IM
As indicated i n ou r e arlier r eports (‘Strategies for C reating End-User D emand f or M obile D ata Services’ and ‘ Strategies for D riving D ata A RPU’), S MS co ntinues to be t he m aster of al l messaging services. Revenue generated by SMS services currently equates to much more than the consolidated revenues of the other messaging services and this trend is expected to continue.
Emerging Broadband
Services
• Social Networking • Audio and Video Downloads/ Streaming • Online Gaming
The evolution of mobile communication from simple voice and SMS to advanced data services and beyond has now led to the introduction of mobile broadband services. These services have started to achieve great popularity and penetration across most markets. Social networking has achieved immense worldwide popularity. Social networks allow subscribers to co nnect w ith f riends and al so upl oad p ictures/videos. As m obile br oadband a llows access to social networks through mobiles, it was an immediate success. The key drivers for mobile social networking are ease of using the service, ability to access the service anytime and anywhere, and the availability of mobile applications to send and receive messages or upload pictures/ videos. In the near future, social networking is expected to be a major driver for mobile broadband. Audio downloads became popular when mobile handsets with audio playback capabilities were introduced i n t he market; t he sa me l ogic applied t o video dow nloads. F urthermore, w ith the increasing popularity of streaming websites, mobile audio/video streams are also on the rise. Another popular mobile broadband service is online gaming, which has achieved popularity due to the availability of high-end handsets. Online gaming is more popular among the youth generation, supported by the availability of free and ad-funded games.
Other Services
• Services with limited popularity Mobile TV Video Calling
• Popular services from the past Ringtones
Mobile TV has yet not achieved the universal popularity it was expected to attain. Countries such as France and Italy, that have a particularly high inclination towards sports, have adopted Mobile TV quickly and have contributed to the success of such services in these nations. However, similar success has not been replicated in developing nations, mainly due to the high cost of services. Video calling services have also seen limited adoption, mainly due to the high cost of the services, but also because video calling requires 3G enabled handsets, which limits service use to high-end smartphones only. Ringtones slowly drowned under the evolution of mobile handsets and full track downloads. When a handset is capable of playing MP3 songs and the same can be used as a ringtone, the use of ringtones markedly declines.

© 2010, Portio Research. All Rights Reserved 21
Strategies for Driving Mobile Data and Broadband Adoption
Chapter 4 Worldwide Mobile Messaging

22 © 2010, Portio Research. All Rights Reserved
Strategies for Driving Mobile Data and Broadband Adoption
Worldwide Mobile Messaging Worldwide Mobile Messaging
Mobile messaging services are the most widely used mobile data services worldwide, and operators worldwide have been u sing these services to shore up revenues in recent years as v oice margins have declined. SMS is the most popular mobile messaging service, and accounts for the largest contribution to MNOs’ data revenues. MMS has typically performed well in advanced markets, but has struggled in emerging markets. Mobile e-mail and mobile instant m essaging (IM) are f aring well i n developed mobile m arkets, and they are seeing uptake in developing countries as well. The figure below compares the worldwide SMS and MMS traffic for 2009.
Figure 8: SMS and MMS Traffic – Worldwide (In Billion, 2009)
Source: Portio Research Ltd.
The figure below compares the number of mobile e-mail and mobile IM users worldwide for 2009.
Figure 9: Mobile E-mail and Mobile IM Users – Worldwide (In Million, 2009)
Source: Portio Research Ltd.
5,449.3
119.40
1,000
2,000
3,000
4,000
5,000
6,000
SMS MMS
Traf
fic(In
Bill
ion)
Service
330.5
191.1
0
50
100
150
200
250
300
350
Mobile E -mail Mobile I M
Use
rs(In
Mill
ion)
Service
Mobile e-mail and mobile instant messaging (IM) are faring well in developed mobile markets, and they are seeing uptake in developing countries as well.

© 2010, Portio Research. All Rights Reserved 23
Strategies for Driving Mobile Data and Broadband Adoption Dominance of SMS
The m obile m essaging segment comprises four services—SMS, MMS, mobile e -mail and mobile I M. S MS r ules t he mobile messaging world beca use of its ubi quity in all mobile markets worldwide and its use by nearly every mobile s ubscriber w orldwide. The f igure below compares revenue generated by each mobile messaging service in 2009.
Figure 10: Revenue of Mobile Messaging Services (In USD Billion, 2009)
Source: Portio Research Ltd.
The figure c learly highlights t he dominance o f SMS; i t a lone gener ated over double the collective revenues for the other three services in 2009. The primary factors behind the popularity of SMS are:
• Simplicity • Ease of use • Low cost • Compatibility with all handsets
MMS, mobile e-mail and mobile IM services cannot be availed on simple handsets, and instead demand a certain set of handset capabilities. In addition, subscribers are required to possess greater technical kn ow-how t o use these services w hereas using S MS i s more straight forward. The figure be low co mpares t he f our mobile messaging s ervices on t he bas is of t he aforementioned parameters.
102.3
26.717.3
4.3
0
20
40
60
80
100
120
SMS MMS Mobile E -Mail Mobile I M
Rev
enue
(In U
SD B
illio
n)
Service
MMS, mobile e-mail and mobile IM services cannot be availed on simple handsets, and instead demand a certain set of handset capabilities.

24 © 2010, Portio Research. All Rights Reserved
Strategies for Driving Mobile Data and Broadband Adoption
Figure 11: Comparison of Mobile Messaging Services
Source: Portio Research Ltd.
SMSMMS
Mobile E-mailMobile IM
Simplicity Ease of Use Cost Handset Compatibility

© 2010, Portio Research. All Rights Reserved 25
Strategies for Driving Mobile Data and Broadband Adoption
Chapter 5 Mobile Messaging – Strategy Case Studies

26 © 2010, Portio Research. All Rights Reserved
Strategies for Driving Mobile Data and Broadband Adoption
Mobile Messaging – Strategy Case Studies Case Studies
Telkomsel Indonesia About the Operator Telkomsel is t he l argest m obile net work operator i n I ndonesia with cl ose t o 50 per cent market share at end-2009. Rationale for Selecting the Operator The operator has launched several i nnovative services in the market that have spurred i ts data revenue, and in 2009 the MNO’s non-voice revenue was 29 percent of its total operating revenue. SMS has l ed t he growth of da ta services i n Indonesia, with T elkomsel subscribers ge nerating t he hi ghest SMS t raffic in t he country. T he figure bel ow compares the annual SMS traffic for the two leading MNOs in Indonesia.
Figure 12: SMS Traffic – Telkomsel and Excelcomindo (In Billion, 2007 – 2009)7
Source: Portio Research Ltd.
All oper ators i n Indonesia are t rying t o dif ferentiate their SMS o fferings w ith ch eap and attractive pr ice pl ans, and T elkomsel i s no ex ception. Ho wever, T elkomsel i s not onl y focussing on service pricing, but is also making efforts to increase the quality and appeal of its SMS o fferings; this i s done by ensuring regular SMS pl atform upgrades and launching innovative s ervices s uch a s SMS Me , Web 2 SMS, SMS G IFT, SM S Pro , SM S2.0 a nd Facebook SMS. Furthermore, with t he i ncreasing use of SMS, i t i s al so m aking efforts t o maintain network quality. Additionally, the MNO is promoting SMS by offering services that use SMS as the access platform.
7 Note: For Telkomsel, only chargeable SMS are shown in the Figure.
49.5
78.0
100.4
12.6 17.8
63.6
0
20
40
60
80
100
120
2007 2008 2009
SMS
Traf
fic
(In B
illio
n)
Year
Telkomsel Excelcomindo
With the increasing use of SMS, Telkomsel is also making efforts to maintain network quality.
Mobile Subscribers: 81.6 million (End-2009)
Market Share: 49.0 percent (End-2009)
Monthly ARPU: USD 4.8 (2009)
SMS Traffic: 26.9 billion (Q4 2009)

© 2010, Portio Research. All Rights Reserved 27
Strategies for Driving Mobile Data and Broadband Adoption The figure below highlights the quarterly growth in Telkomsel’s SMS traffic.
Figure 13: SMS Traffic – Telkomsel (In Billion, Q1 2009 – Q4 2009)8
Source: Portio Research Ltd.
In 2009, SMS r evenue constituted 74 per cent of Telkomsel’s d ata revenue. T he average price of an S MS has reduced ov er t he years, but the surge i n SMS t raffic has of fset t his decline, and this has enabled the operator to increase SMS revenue with each succeeding quarter of 2009. The figure below depicts the growth in Telkomsel’s SMS revenue in 2009.
Figure 14: SMS Revenue – Telkomsel (In USD Million, Q1 2009 – Q3 2009)
Source: Portio Research Ltd.
In 2009, T elkomsel’s S MS r evenue w itnessed a 23 per cent year-on-year growth. S MS revenue generated in Q4 2009 grew by 37 percent in comparison with Q1 2009 revenue.
8 Note: These are only chargeable SMS.
22.9
23.9
26.7 26.9
20
22
24
26
28
Q1 2009 Q2 2009 Q3 2009 Q4 2009
SMS
Traf
fic(In
Bill
ion)
Quarter
206.1
236.6
279.9 282.5
200
220
240
260
280
300
Q1 2009 Q2 2009 Q3 2009 Q4 2009
SMS
Rev
enue
(In U
SD M
illio
n)
Quarter
28 © 2010, Portio Research. All Rights Reserved
Strategies for Driving Mobile Data and Broadband Adoption
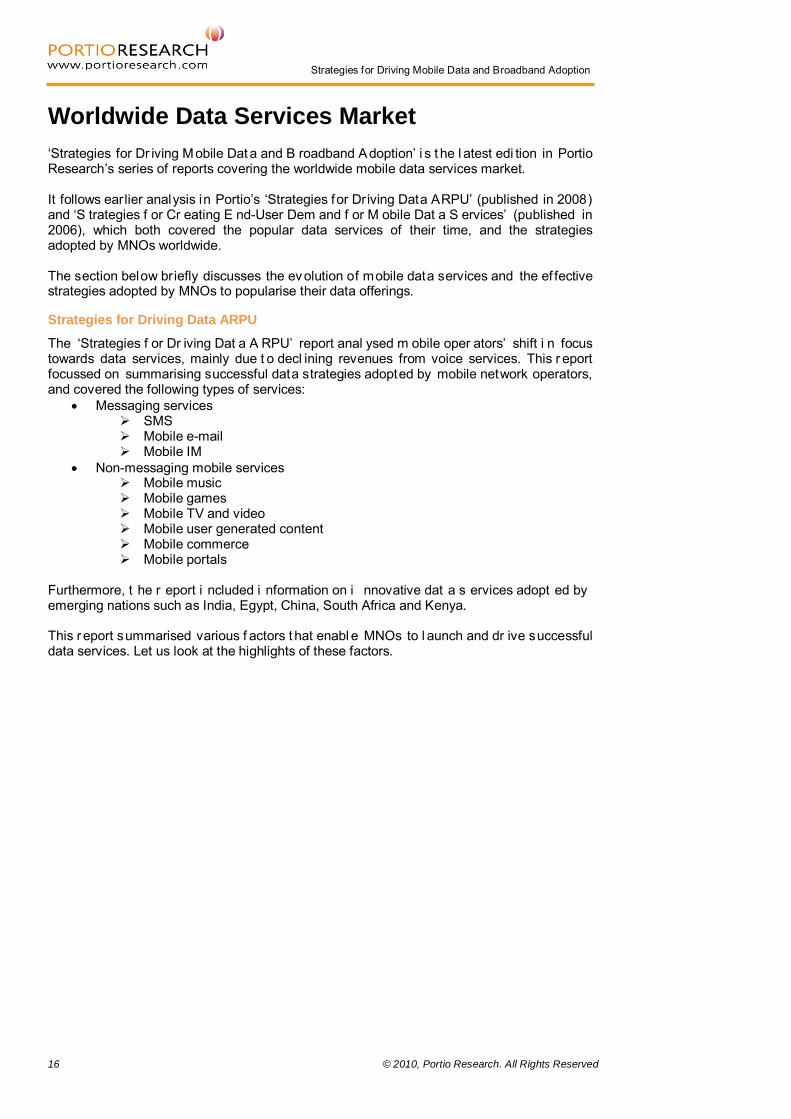
Strategies Attractive Tariffs and Promotional Plans To maintain subscriber i nterest i n its SMS s ervices, t he oper ator f requently introduces promotional pl ans and t ariffs; this results in increased use of s ervices. The figure below highlights some of the plans launched by Telkomsel.
Figure 15: SMS Tariffs and Promotional Plans – Telkomsel
Source: Company Website
‘SMS Mania’ was launched and offered a daily package of 50 SMS for USD 0.1 (IDR 1,000) to all Telkomsel numbers between 00.00-19.00 hours
May 2009
Jul 2009
‘SMS Fun 2,000’ was launched and offered other content with SMS, such as celebrity gossip, fashion and horoscopes
Jul 2009
A new SMS tariff for Kartu was introduced that allowed users to send SMS to any network for a fixed price, as against variable prices for on-net and off-net SMS
Apr 2009
‘simPATI SMS Package’ was introduced offering cheaper SMS prices for simPATI users with two different packages: ‘Regular’ and ‘Gift’
Jan 2009
‘Free 300 SMS’ was launched and offered 300 free SMS to Kartu subscribers between 00.00-19.00 hours after they registered for the service by paying a registration fee of USD 0.2 (IDR 2,000)
Mar 2009
‘100 Get 100’ was introduced and allowed Telkomsel subscribers to send 100 free SMS after sending 100 chargeable SMS
Oct 2009 A cheaper SMS plan was introduced that allowed subscribers to send
500 SMS for USD 0.1 (IDR 1,000)
Feb 2010
SMS pack ‘Kartu As’ was launched that offered free 1,000 daily SMS to Telkomsel subscribers USD 0.1 (IDR 1,000) after sending SMS worth USD 0.1 (IDR 1,000)

© 2010, Portio Research. All Rights Reserved 29
Strategies for Driving Mobile Data and Broadband Adoption Regular Upgrades of SMS Services and SMS Platform Telkomsel has transformed i ts SMS offerings f rom being a simple text-based service to an advanced service with features such as divert, auto reply, black list and white list. Some of their innovative SMS services are listed below:
• SMS Me • Web 2 SMS • SMS GIFT • SMS Pro • SMS2.0 • Facebook SMS
These efforts are aimed at making Telkomsel’s SMS services more personalised and attractive. The operator is not only upgrading its SMS services regularly, but is also of fering services through t he m ost adv anced m essaging platforms. For example, i n Ju ne 2009, Telkomsel upgraded its SMS platform with Acision’s Text Suite, to enable users to enjoy additional features su ch a s bl ocking uns olicited S MS (or S MS s pam), aut omatic replies, message forwarding and automatic copy messages. Improving Network Quality and Capacity With i ncreasing s ubscriber numbers and d ata t raffic, m obile net works worldwide require frequent upgrades. Without such upgrades, networks will succumb to the increasing strain, affecting the quality of services. Keeping this in mind, Telkomsel has invested hugely in network expansion. In Q1 2009, it increased its base transceiver station (BTS) number by 28 percent and overall network capacity by 39 percent. In 2008, the operator added 6,014 new BTS that allowed it to carry 30 percent higher SMS traffic on the day of Lebaran (a religious festival), compared with its capacity in 2007.9
9 Source: Company Reports
Using SMS as a Platform for Other Services Telkomsel has introduced several services that use SMS as the access platform. With the increasing upt ake o f t hese s ervices, SMS us e i s gai ning new hei ghts i n t he co untry. Telkomsel is offering mobile banking services through three platforms—SMS, single banking and IVR (Interactive Voice Response)—with SMS being the most popular platform used by subscribers. In 2008, Telkomsel started its mobile advertisement services. This allows content providers to push and adv ertise their products through SMS, along with other content such as news and information.
Telkomsel is not only upgrading its SMS services regularly, but is also offering services through the most advanced messaging platforms.

30 © 2010, Portio Research. All Rights Reserved
Strategies for Driving Mobile Data and Broadband Adoption
The t able below highlights t he f actors which enabl ed the operator to generate high SMS traffic.
Table 2: Success Factors – Telkomsel Indonesia
Factor Strategy
Attractive Tariffs and Promotional Plans
Telkomsel regularly introduces attractive SMS plans that offer cheap or free SMS. Different plans target subscribers with different use needs.
Regular Service and Platform Upgrades
Telkomsel has introduced several innovative SMS-based services, such as SMS Facebook. SMS Facebook is gaining rapid popularity among users and is driving SMS use further. Apart from interesting services, Telkomsel has increased the appeal of its SMS offerings with the introduction of features such as divert, auto reply, black list, white list, etc.
Improving Network Quality and Capacity
Telkomsel is focusing on network quality in order to continue delivering high quality services to its subscribers despite increased SMS traffic. It is also investing to strengthen network capacity.
SMS as a Platform for Other Services
Telkomsel is providing additional services that use SMS as an access platform, and these services are witnessing increasing demand in the local market.
Source: Portio Research Ltd.

© 2010, Portio Research. All Rights Reserved 31
Strategies for Driving Mobile Data and Broadband Adoption China Mobile About the Operator China Mobile is the largest MNO worldwide in terms of subscriber base, with 522.3 million subscribers at end-2009; the subscriber base grew nearly 14.2 percent during 2009. Rationale for Selecting the Operator Messaging services, such as SMS, MMS, mobile e-mail and mobile IM, have been the key focus of operators to generate data revenues. China Mobile’s continuous efforts to promote messaging se rvices, es pecially MMS, r equire a s pecial mention. M MS has per formed exceptionally well in t he Chinese m arket, compared with i ts per formance in other markets where it has been a distant second to SMS. While many other markets are struggling to increase MMS uptake, China Mobile’s MMS user base has shown a double-digit growth rate during 2007–2009. During 2007–2009, the number o f China M obile’s MMS users increased at a CA GR of near ly 27.5 per cent, with year-on-year growth of MMS users standing at 15.1 percent in 2009.
Figure 16: MMS Users – China Mobile (In Million, End 2007 – End 2009)
Source: Portio Research Ltd.
90.8
128.2
147.5
0
20
40
60
80
100
120
140
160
2007 2008 2009
MM
S U
sers
(In M
illio
n)
Year
While many other markets are struggling to increase MMS uptake, China Mobile’s MMS user base has shown a double-digit growth rate during 2007–2009.
Mobile Subscribers: 522.3 million (End-2009)
Market Share: 72.4 percent (End-2009)
Monthly ARPU: USD 11.0 (Q4 2009)
MMS Users: 147.5 million (End-2009)
32 © 2010, Portio Research. All Rights Reserved
Strategies for Driving Mobile Data and Broadband Adoption
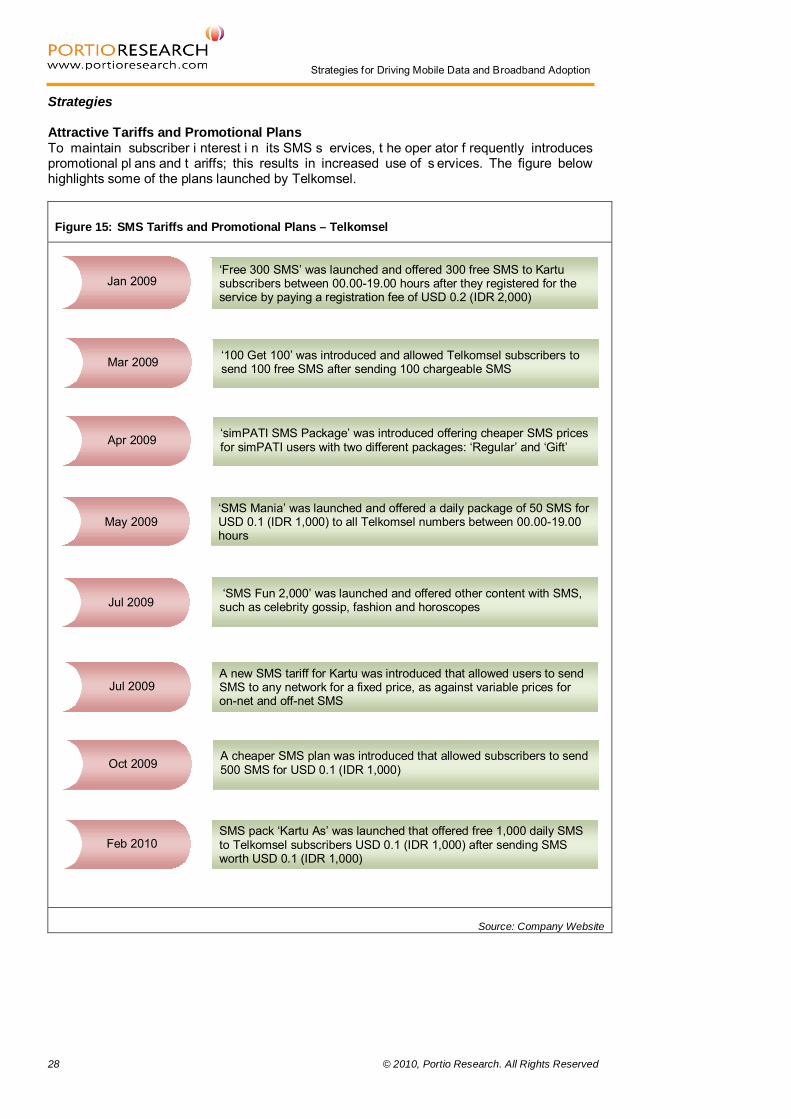
MMS Traffic per User and Revenue Growth With Chi na Mobile’s M MS user base growing at a steady pace and t he M NO’s efforts t o encourage MMS use, there has been a significant increase in MMS traffic per user and the revenue generated by this service. The f igure below depicts the MMS t raffic per active user per year f or China Mobile dur ing 2007–2009.
Figure 17: MMS Traffic per Active User per Year – China Mobile (2007 – 2009)
Source: Portio Research Ltd.
MMS revenue grew at a CAGR of 53.3 percent between 2007 an d 2009. The f igure below depicts the growth in MMS revenue of China Mobile during 2007, 2008 and 2009.
Figure 18: MMS Revenue – China Mobile (In USD Million, 2007 – 2009)
Source: Portio Research Ltd.
198.2
255.7290.1
0
50
100
150
200
250
300
350
2007 2008 2009
MM
S Tr
affic
pe
r Act
ive
Use
r per
Yea
r
Year
206.3
414.1
484.7
0
100
200
300
400
500
2007 2008 2009
MM
S R
even
ue(In
USD
Mill
ion)
Year

© 2010, Portio Research. All Rights Reserved 33
Strategies for Driving Mobile Data and Broadband Adoption Strategies Triggering the Uptake of MMS Services • Challenge: The ear ly uptake o f M MS by subscribers i s co nstrained by the fact t hat
creating and edi ting m ultimedia co ntent i s far more complicated t han w riting t ext messages. This hampers growth in P2P MMS traffic.
• China Mobile’s Strategy: China M obile s timulated MMS adopt ion by pushing A 2P
MMS and ot her MMS-based innovative services. A2P MMS-based services—M-News, entertainment and gr eeting M MS a vailable on the Monternet Web portal mobile—provide addi tional impetus to tap the potential of MMS. Dur ing 2007, A2P MMS t raffic accounted for more than 70 per cent of China Mobile’s total MMS traffic; the remaining percentage was P2P MMS traffic.10
The use of A2P MMS in turns increase P2P MMS through the message forward facility. Subscribers simply forward the MMS, without needing to be co ncerned about creating the MMS, as it is generated by the application. Once subscribers are familiar with MMS services, us ers ca n cr eate t heir own M MS co ntent, and t his in t urn i ncreases t he popularity of the service among them.
Innovative Offerings
MMS traffic is still dominated by A2P MMS, with the continued success of the M-News and Monternet services.
• M-News: This i s a m obile newspaper service that allows users t o receive information including breaking news alerts and weather reports through MMS (on their MMS-capable hands ets). Chi na M obile pr ovides the M-News se rvice in co llaboration w ith media organisations, including China Daily (a national English newspaper) and other local news sources. The news alert MMS includes ten pages of headline news, weather information and photos. The alerts are provided twice a day at a monthly charge of RMB 5 (USD 0.7), and the service is exempt from data charges. Salient Features: High cu stomisability allowing t he provision o f co ntent i n a nu mber o f ca tegories
including news al erts and information in areas such as m usic, movies, lif e, sports and finance
Option to forward M-News MMS to other users Opportunity for subscribers to share their opinions with editors and other readers Increased revenue opportunity for MNOs without the need to own any content Easy to subscribe/unsubscribe to the service as subscribers merely need to send a
text message for initiating/discontinuing the subscription Impact: The M-News service was received well by subscribers, and it became a major factor in the growth of MMS traffic in China. It was nominated as a star service for the operator i n the year of its launch (2006), and the MMS t raffic per month in China has increased by more than seven times between 2006 and 2009. The paying subscriber base for the M-News service during 2006–2009 is depicted in the figure below. The number of M-News subscribers increased at a CAGR of nearly 107.5 percent between 2006 and 2009.
10 Source: http://wwwen.zte.com.cn/endata/magazine/ztetechnologies/2007year/no4/articles/200704/t20070423_161773.html
The early uptake of MMS by subscribers is constrained by the fact that creating and editing multimedia content is far more complicated than writing text messages.

34 © 2010, Portio Research. All Rights Reserved
Strategies for Driving Mobile Data and Broadband Adoption
Figure 19: M-News Paying Subscribers – China Mobile (In Million, End 2006 – End 2009)
Source: Portio Research Ltd.
• Monternet: Monternet i s a s et of data of ferings based on the mobile Internet platform
provided by China Mobile. The service allows subscribers to use different content categories on the Monternet Web portal; subscribers can use their handsets (feature phones or smartphones) or ‘Go with E’ cards with their laptops to access the Monternet Web portal for sending and receiving MMS.
Leveraging Events for MMS Promotion • Green Box Environmental Protection Plan—517 Special Event: In May 2007, China
Mobile celebrated the World Telecommunication and Information Society Day, and invited i ts s ubscribers t o participate i n t he G reen O lympics. T he e vent enco uraged subscribers to throw their old phones into green boxes. The initiative attracted many celebrities, and the mobile operator organised an MMS photo shooting event – ‘Good Shape f or t he O lympics’ – to spread t he m essage of it s co mmitment t owards the environment.
• Olympics 2008: China Mobile released an MMS containing the ‘2008 Olympics Mascot’ on the Monternet Web portal, and the company allowed its subscribers to download and send the MMS through their handsets and laptops. The promotion of the Olympics was the first of its kind in China, and was successful in pushing MMS services further into the market.
5.5
23.6
41.5
49.1
0
10
20
30
40
50
2006 2007 2008 2009
M-N
ews
Payi
ng S
ubsc
riber
s(In
Mill
ion)
Year
© 2010, Portio Research. All Rights Reserved 35
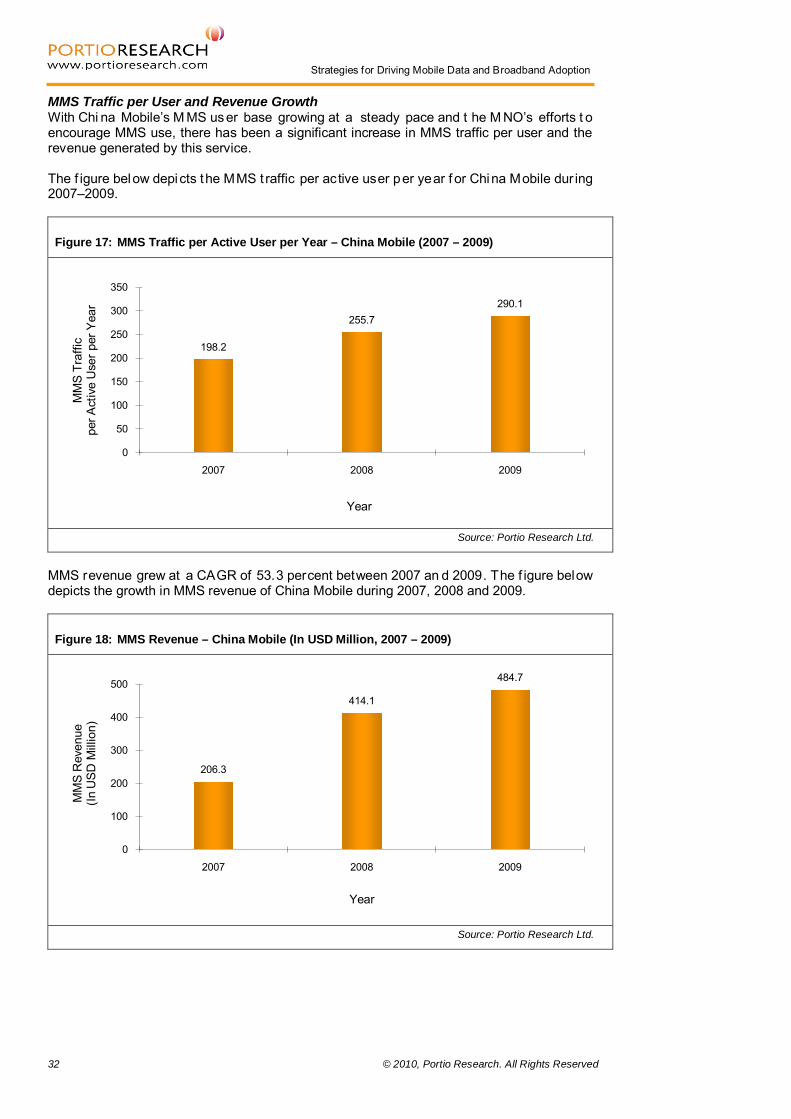
Strategies for Driving Mobile Data and Broadband Adoption The t able be low hi ghlights t he factors that enabled the oper ator t o gener ate high MMS traffic.
Table 3: Success Factors – China Mobile
Factor Strategy
Triggering the Uptake of MMS Services
China Mobile stimulated MMS traffic by pushing A2P MMS. A2P MMS received by subscribers then helped in increasing P2P MMS via the message forward facility, thereby stimulating the growth of P2P MMS.
Innovative Offerings
M-News and Monternet services provided ready-to-use MMS content to subscribers. Thus, they boosted MMS traffic significantly since they did not require users to create MMS, which is a major bottleneck in the uptake of MMS services.
Leveraging Events for MMS Promotion
China Mobile used major national and international events to promote MMS services among the masses.
Source: Portio Research Ltd.

36 © 2010, Portio Research. All Rights Reserved
Strategies for Driving Mobile Data and Broadband Adoption
SoftBank Japan About the Operator SoftBank is the third largest mobile operator in Japan, but the first operator in Japan to migrate its entire subscriber base to a 3G network. Rationale for Selecting SoftBank SoftBank has introduced a pack combining Web access and e-mail access. Considering the high I nternet us e by Japanese su bscribers and by combining e -mail wi th Web ac cess, SoftBank has paved the way for increased e-mail use by its subscribers. Subscribers using this pack can send and r eceive e-mails on the network for free, and to other networks at a minimal cost. The operator has introduced services that increase the presence and familiarity of mobile e-mail among its subscribers. In January 2008, it launched S! Information Channel , a s ervice that deliv ers i nformation t o s ubscribers via e -mail. T he s ervice had near ly 2 million registered users as of April 2009, and continues to grow in popularity and add subscribers and applications at a steady pace. The figure below highlights the increasing number of applications on the S! Information Channel.
SoftBank has introduced services that increase the presence and familiarity of mobile e-mail among its subscribers.
Figure 20: Number of S! Information Channel Applications – SoftBank (January 2010 – April 2010)
Source: Portio Research Ltd.
21,08621,171
21,587 21,618
20,800
20,900
21,000
21,100
21,200
21,300
21,400
21,500
21,600
21,700
Jan-10 Feb-10 Mar-10 Apr-10
Num
ber o
f App
licat
ions
Month
Mobile Subscribers: 21.7 million (End-2009)
Market Share: 19.4 percent (End-2009)
Monthly ARPU: 21.5 USD (Q4 2009)
3G Subscribers as a Percentage of Customer Base: 96.4 percent (End-2009)

© 2010, Portio Research. All Rights Reserved 37
Strategies for Driving Mobile Data and Broadband Adoption With the highest 3G penetration among subscribers, SoftBank has a solid f oundation for increasing i ts dat a ARPU. Moreover, after the decommissioning of its 2G net works by 31 March 2010, S oftBank is t he only network with 100 per cent 3G s ubscription. The figure below highlights the 3G penetration of SoftBank and its competitors in 2009:
Figure 21: 3G Subscribers as a Percentage of Total Subscriber Base – Japan (In Percent, Q2 2009 – Q4 2009)11
Source: Portio Research Ltd.
SoftBank introduced e -mail facilities for i ts s ubscribers t hrough a service ca lled S ! Mail. Though S! Mail was marketed and perceived as an MMS service, it offered traditional push e-mail s ervices to it s s ubscribers. S ! M ail s ubscribers ca n enclose pi ctures, voice c lips, videos, etc., while sending e-mails, and the service permits users to send e-mails only by keying i n the r ecipient’s m obile number. A ny subscriber using the S ! B asic data p lan w ill have access to e-mail, along with 3G and other Internet services including e-mail. SoftBank, after the change in management from Vodafone K.K., launched 3G services for the third time in Japan in 2005. This move garnered more success than the earlier two 3G service launches by Vodafone K .K. ( before acq uisition by SoftBank). Though late i n introducing 3G , mobile I nternet and e -mail s ervices, S oftBank has s een a significant increase in the adoption of its new services. The adoption of mobile e-mail by SoftBank subscribers has been steadily increasing; one of the m ain factors i s t he s ales of i Phones. S oftBank, pr esently the onl y operator t o o ffer iPhones in Ja pan, ex perienced a steady increase in i Phone s ales and dat a services including mobile e-mail. The following ch art depi cts t he i ncrease i n I nternet ado ption by SoftBank subscribers.
11 Note: SoftBank’s financial year starts on 1 April, hence Q4 for the operator implies the quarter ending on 31 March. However, in this report we have taken Q4 to mean the quarter ending on 31 December.
75.2 77.8 81.291.6 92.9 93.992.8 94.9 96.4
0
20
40
60
80
100
120
Q2 2009 Q3 2009 Q4 2009
3G P
erce
ntag
e(In
Per
cent
)
Period
KDDI NTT DOCOMO Softbank
The adoption of mobile e-mail by SoftBank subscribers has been steadily increasing; one of the main factors is the sales of iPhones.

38 © 2010, Portio Research. All Rights Reserved
Strategies for Driving Mobile Data and Broadband Adoption
Innovative data plans, 3G and mobile Internet adoption, and the subsequent use of web services led to a continual increase of data ARPU. The figure below showcases the increase in data ARPU for the last three quarters of 2009.
Figure 22: Mobile Internet Subscribers – SoftBank (In Million, Q2 2009 – Q4 2009)
Source: Portio Research Ltd.
Figure 23: Data ARPU – SoftBank (In USD, Q2 2009 – Q4 2009)
Source: Portio Research Ltd.
16.616.8
16.9
16
17
Q2 2009 Q3 2009 Q4 2009
Mob
ile In
tern
et S
ubsc
riber
s(In
Milli
on)
Quarter
19.3
21.3
22.9
17
18
19
20
21
22
23
24
Q2 2009 Q3 2009 Q4 2009
Dat
a A
RP
U(In
US
D)
Quarter

© 2010, Portio Research. All Rights Reserved 39
Strategies for Driving Mobile Data and Broadband Adoption Strategies Innovative Pricing Plans for Target Groups SoftBank launched innovative data price plans/offers for both enterprise and individual subscribers. Packages announced by SoftBank were a mix of voice and data services and, in a few cases, the company offered discounts of up to 80 percent. SoftBank’s strategy was to target specific groups, such as students and family members. The following are the types of pl ans and packa gers that enabled the high upt ake of mobile I nternet and s ubsequently mobile e-mail use:
• S! Basic: This pack enables subscribers to access S! Mail, along with several other services such as web access, PC Site Browser use (including PC mail) and PC Site Direct t ransmissions. A ll t hese services are offered for a flat fee of USD 3. 3 ( JPY 315) per month
• White Plan: This plan, when clubbed with the S! Basic package, offers subscribers access to unlimited e-mails within the network and a minimal charge for e-mails sent/received from outside the network
• Unlimited Packet Discount: This is an add-on package offering unlimited Web and e-mail access. The package cost ranges from USD 10.8 to USD 46.2 (JPY 1,029 to JPY 4,410)
• Unlimited Packet Discount S: A plan similar to the one above; however, the cost of the package ranges from USD 4.1 to USD 46.2 (JPY 390 to JPY 4,410)
• Monthly Discounts: A new subscriber, while purchasing a handse t f rom SoftBank and subscribing to a new connection for both voice and data services, can avail the S! Basic, Unlimited Packet Discount and Voice Call Fees for a charge of merely USD 0.2 (JPY 16)
Automated Services to Increase E-Mail Use SoftBank introduced s everal p lans t o pr omote e -mail us e. M ost o f t hese s ervices w ere focussed on se nding aut omated e -mails t o its s ubscribers and , hence, increasing e -mail adoption. Innovative e-mail services offered by SoftBank are mentioned below.
• Idokoro-mail: This i s a mobile appli cation installed on hand sets that i s used by children; it sends automatic e-mails to parents once the child reaches a destination. Also, in an emergency, a pre-defined key triggers an alarm, places a call and sends an e-mail to the parents with the location information.
• Simple Select Video: This service, launched in April 2009, allows users to receive e-mails with video content. A wide variety of content such as sports, entertainment and news is available t hrough t his s ervice. Registered s ubscribers receive new videos through e-mails that can be watched at their convenience.
• Easy Access Music: This music co ntent service was launched i n June 2009. Its users receive e-mails w ith an update on m usic information, popul ar songs, m usic rankings, et c. Subscribers ca n also view i mages on t he e -mail or c lick on li nks, allowing them t o p lay or download songs. As t his i nformation is s tored i n e -mails, the subscriber can acce ss music information and pl ay or do wnload songs at t heir convenience.
Focus on Corporate Users SoftBank’s focus has be en o n increasing its co rporate mobile s ubscribers. S oftBank Telecom (the fixed-line business) and SoftBank Mobile consolidated their efforts to accelerate growth in this segment. As a result, SoftBank Telecom achieved sales of 250,000 mobile handsets in the corporate sector in 2008. As co rporate s ubscribers use e-mails and web s ervices to a gr eat e xtent, a s ignificant increase in data ARPU was experienced. Notable corporate mobile subscriber deals in 2009 included:
• Pfizer Japan purchased 3,000 X05HT handsets for its medical representatives • PriceWaterhouseCoopers Consultants purchased approximately 2,000 iPhone 3G
handsets for their consultants
SoftBank Telecom achieved sales of 250,000 mobile handsets in the corporate sector in 2008.

40 © 2010, Portio Research. All Rights Reserved
Strategies for Driving Mobile Data and Broadband Adoption
Wide Range of Handsets and Ease of Purchase SoftBank focuses on selling s tylish and hi gh-end h andsets t o i ncrease t he a ppeal and uptake of its data services, i ncluding mobile e-mail. All high-end data-centric handsets are sold w ith dat a pl ans t o hel p i ncrease e -mail and Internet us e. Additionally, So ftBank introduced 24-month i nstalment plans, along w ith t wo-year co ntracts. T his r educed t he burden f or s ubscribers to r egularly extend t he co ntract, and it ensured r etention for t wo years. In addi tion, a new s ubscriber pur chasing a ne w han dset in t he 24-ment i nstalment deal receives subsidised m onthly rentals for us ing bot h voice and dat a services. T he operator offered discounts of up to 80 percent on voice and data plans for 24 months. SoftBank is presently the exclusive distributor of iPhone in Japan. Also, iPhone was one of the key contributors to Q3 2009 sales and the increase in data ARPU for SoftBank. The M NO introduced several innovative plans to increase i Phone adoption. In Dece mber 2009, the “iPhone for all of SoftBank” plan was introduced to offer 32 GB iPhones for free to subscribers willing t o s ign up a two-year co ntract with S oftBank. A s imilar pl an was also announced in early 2009 called “iPhone for Everybody Campaign”, wherein any subscriber signing up for the two-year data plan received an 8 GB iPhone for free. Highest 3G Adoption in Japan SoftBank, though at number three in Japan in terms of total mobile subscriber base, places first with r espect t o 3G adopt ion. The ke y focus f or S oftBank is t o im prove dat a A RPU through i ts 3G s ervices, w hich i ncludes hi gh-speed Internet br owsing, e -mail and ot her services. Furthermore, SoftBank also upgraded its 3G network infrastructure to provide high-service quality to subscribers. Also, as SoftBank announced the closure of its 2G networks, existing 2G subscribers have been shifted t o 3G net works. He nce, a s of A pril 20 10, S oftBank was the onl y national operator with 100 percent 3G adoption. This fact is further expected to boost the use of data services, such as e-mail and web access.
As of April 2010, SoftBank was the only national operator with 100 percent 3G adoption.

© 2010, Portio Research. All Rights Reserved 41
Strategies for Driving Mobile Data and Broadband Adoption The table below highlights the factors which enabled the operator to increase the uptake of mobile e-mail.
Table 4: Success Factors – SoftBank Japan
Factor Strategy
Innovative Price Plans for Target Groups
Introduction of innovative plans targeting particular groups of people – both individual and enterprise customers. Some of these plans offered discounts of up to 80 percent.
Automated Services to Increase E-Mail Use
Introduction of a new service which sends automated e-mails to subscribers, with information on latest events, location information of mobiles used by children, video files, links to music downloads, etc.
Focus on Corporate Users SoftBank, realising the heavy e-mail use by corporate users, focused on attracting more corporate subscribers and achieved significant success through this strategy. In 2008, Softbank sold 250,000 handsets to the corporate sector.
Wide Range of Handsets and Ease of Purchase
SoftBank achieved popularity in Japan for its stylish high-end handset portfolio. The MNO is currently the exclusive distributor of the iPhone in Japan. SoftBank also focused on attracting new subscribers by introducing two year monthly instalment schemes.
Highest 3G Adoption in Japan
SoftBank has achieved the highest penetration with respect to 3G subscribers. 3G subscribers will drive higher data use and a subsequent increase in e-mail use.
Source: Portio Research Ltd.

42 © 2010, Portio Research. All Rights Reserved
Strategies for Driving Mobile Data and Broadband Adoption
Conclusion
Mobile messaging services are the most popular mobile services after voice, and messaging services gener ated m ore t han US D 150 billion in revenues worldwide i n 2009 . F or ye ars now, mobile messaging services hav e enabled operators worldwide to sustain their ARPU and acq uire new s ubscribers. A s shown ear lier, SMS dominates the m obile m essaging world and greatly outperforms MMS, mobile e -mail and m obile I M – even as a co llective. MMS is often wrongly considered a failure, with confusion borne from over-enthusiastic pre-launch predictions t hat i t was the successor t o SMS. I n reality MMS has seen s ignificant, impressive growth, and recorded annual revenue of USD 26.7 billion in 2009; worldwide MMS revenue is projected to hit USD 51.2 billion by end-2014. Although S MS w ill co ntinue t o do minate t he mobile messaging ar ena f or s ome years t o come, ot her s ervices s uch a s m obile e -mail and m obile I M ar e ca tching up fast. S ome experts even believe that mobile e-mail will supplant SMS in the future; however, this seems unrealistic in the foreseeable future. SMS is well established with high penetration levels in the majority of markets worldwide, whereas mobile e-mail and m obile I M ar e s till in t he growth p hase and are hence expected t o witness higher-than-current growth r ates i n the future. T he figure bel ow co mpares t he CA GR of r evenues t o be gener ated by mobile messaging services between 2009 and 2014.
Figure 24: Revenue CAGR of Mobile Messaging Services (In Percent, 2009 – 2014F)
Source: Portio Research Ltd.
F – Forecasted
Operators worldwide have realised the importance of mobile messaging services, especially SMS, in the wake of falling ARPU. They are making conscious efforts to increase the appeal of their messaging solutions t hrough i nnovation i n t erms o f co ntent o ffered and s ervice pricing. To ach ieve t he intended popul arity of t heir messaging se rvices, oper ators have primarily focussed on the following areas:
• Prices • Promotions and marketing • Quality of the service • Identifying the target segment for each service
3.9
13.9
18.1
33.3
0
5
10
15
20
25
30
35
SMS MMS Mobile E -mail Mobile I M
CAG
R(In
Per
cent
)
Service
MMS recorded annual revenue of USD 26.7 billion in 2009; worldwide MMS revenue is projected to hit USD 51.2 billion by end-2014.

© 2010, Portio Research. All Rights Reserved 43
Strategies for Driving Mobile Data and Broadband Adoption The table below discusses these factors in brief.
Table 5: Factors Affecting the Uptake of Mobile Messaging Services
Factor Strategy
Pricing
• Offering flat rate data plans with unlimited service access • Providing free SMS and other services on festivals or other occasions
to increase the uptake of services • Offering discounts and different price plans to suit the needs of users
with different requirements
Promotions and Marketing
• Promoting other services that use mobile messaging as a platform, for
example mobile banking, video downloads through e-mail etc. • Penetrating the service through A2P mode (especially for MMS) in
order to increase users’ familiarity with the service • Using mobile messaging services at a large scale to share information
with masses during local and global events
Quality of Service
• Regularly upgrading wireless networks to offer better user experience
for services that demand high speed and more bandwidth • Launching innovative services to increase the appeal of mobile
messaging services • Offering advanced handsets that provide rich user experiences and
ease of use for mobile messaging services
Identifying Target Segment
• Identifying the target segment for each mobile messaging service, for
example youth or students for SMS and business users for mobile e-mail
• Introducing plans and offers that suit the needs of these target segments and encouraging them to use the service at a larger scale, for example free or discounted SMS during nights or weekends and flat rate e-mail plans for enterprise users
Source: Portio Research Ltd.

44 © 2010, Portio Research. All Rights Reserved
Strategies for Driving Mobile Data and Broadband Adoption
Chapter 6 Mobile Broadband – Introduction and Basics

© 2010, Portio Research. All Rights Reserved 45
Strategies for Driving Mobile Data and Broadband Adoption
Mobile Broadband – Introduction and Basics Mobile broadband allows subscribers to access high-speed Internet on the move. In this report, we consider all services with data transfer speeds of more than 256 Kbps as mobile broadband services. Three devices that enable mobile broadband access are:
• Mobile handsets • Modems (USB Modems, often known as Dongles, and Embedded modems) • PC Cards
Mobile data plans offered by operators along with any of the above mentioned devices will allow s ubscribers t o acce ss high-speed I nternet. S ubscribers’ d emand for comparatively simpler services like Internet browsing and e-mail access has now evolved to them seeking out advanced services such as v ideo s treaming and mobile T V, which require high-speed data transfer rates and extensive coverage. This has led to several developments in the mobile br oadband s pace. Cur rently, mobile oper ators, t elecom as sociations and ot her players in the mobile broadband ecosystem are working towards achieving data transfer speeds of up to 1 Gbps, with a key focus on the quality of service. The table below highlights the number of operators who have deployed high-speed networks worldwide.
Table 6: Number of Network Providers with High Speed Network Deployments – Regional (March 2010)
Network Number of Network Providers
Asia Pacific Europe North America
Latin America
Africa and Middle East Worldwide
HSDPA/HSUPA 55 143 8 52 67 325
CDMA2000 1xEV-DO Rel. 0 23 39 10 26 17 115
CDMA2000 1xEV-DO Rev. A 17 24 7 20 15 83
UMTS 63 153 8 53 69 346
Source: 3G Americas and CDG Broadly speaking, there are two types of networks providing mobile broadband—one being a m obile phone net work that provides both v oice and dat a services ( for example UM TS, HSPA), and the other provides only data services (for example WiMAX). Mobile operators are al so working t owards enha ncing the subscriber ex perience on t hese advanced networks. Operators are taking key initiatives such as introducing innovative data plans, upgrading technology infrastructure to offer improved data transfer rates and exploring new technologies. This section covers these technologies and operator strategies in detail.
Mobile operators, telecom associations and other players in the mobile broadband ecosystem are working towards achieving data transfer speeds of up to 1 Gbps, with a key focus on the quality of service.

46 © 2010, Portio Research. All Rights Reserved
Strategies for Driving Mobile Data and Broadband Adoption
Evolution of Mobile Broadband – GSM
Mobile broadband using GSM technologies (data rates of more than 256 K bps) have been constantly evolving since 1999 with the introduction of UMTS/W-CDMA technology. UMTS-enabled handsets have been able to achieve peak transfer rates of up to 384 Kbps. Currently, 3GPP (3rd Generation Partnership Project, an association responsible for developing globally acceptable mobile standards) is working on a 4G technology called LTE Advanced, which is expected to achieve peak transfer rates of 1 Gbps. Key GSM Technologies UMTS (Universal Mobile Telecommunications System)
• UMTS is one of the 3G mobile telecommunications technologies, specified by 3GPP
• UMTS builds on t he GSM technology, and most UMTS handsets also support GSM, allowing dual-mode operation
• UMTS is the first 3G mobile technology in GSM achieving broadband speeds, with transfer rates reaching 384 Kbps
• UMTS enables the use of voice and high-speed data multimedia services such as music, mobile TV, video and web browsing
• The first commercial launch of UMTS services was i n Japan i n 2001 by NTT DOCOMO. The service is called FOMA (Freedom of Mobile Multimedia Access).
HSPA (High Speed Packet Access)
• HSPA is an umbrella term for a set of technologies that define the evolution of UMTS
• HSPA includes the following technologies: High Speed Downlink Packet Access (HSDPA): HSDPA is an
enhancement to the UMTS network that enables high downlink data transfer speeds of up to 7. 2 Mbps. T hese rates are ach ieved t hrough Adaptive Modulation and Codi ng, F ast Packet Scheduling and Hyb rid Automatic Repeat request (HARQ) techniques.
High Speed Uplink Packet Access (HSUPA): HSUPA i s an enhancement to the UMTS network that enables high uplink speeds while enhancing downlink transfer rates. It increases the data rate up to 5.8 Mbps for uploading and 14. 4 Mbps for downloading. HSDPA uses the E nhanced De dicated Channel ( E-DCH) t o opt imise upl ink performance.
• Through these continuous enhancements, current HSPA networks can achieve data transfer rates of 14.4 Mbps on downlink and 5.8 Mbps on uplink
• As of February 2010, 315 commercial operators were present across 133 countries. Of t he oper ational HS PA net works, m ore t han 79 percent can achieve dat a t ransfer r ates of 3. 6 Mbps or hi gher, and m ore t han 53 per cent can achieve data rates of 7.2 Mbps or higher.12
HSPA+ (High-Speed Packet Access Plus/ Evolved HSPA) • HSPA+, w hich is an upgrade t o t he cu rrent HS PA network, provides enhance d
throughput speeds with higher performance and spectral efficiency • It is more efficient in handling advanced services such as Push-to-Talk over Cellular
(PoC), music and videos, V oice o ver I nternet P rotocol ( VoIP) and ot her s uch multimedia applications
• Enhancements, such as Multiple I nput/Multiple O utput (MIMO) ca pability, Continuous P acket Connect ivity (CPC) and Hi gher O rder M odulations, enable HSPA+ networks to achieve data transfer rates of up to 42 Mbps on downlink and 11.5 Mbps on uplink
12 Source: Global Mobile Suppliers Association
The first commercial launch of UMTS services was in Japan in 2001 by NTT DOCOMO.

© 2010, Portio Research. All Rights Reserved 47
Strategies for Driving Mobile Data and Broadband Adoption
• As of F ebruary 2010, 41 co mmercial operators l aunched HSPA+ net works acr oss 26 countries
Figure 25: UMTS Evolution – Data Transfer Rates
Note: DL: Downlink UL: Uplink
Source: Global Mobile Suppliers Association
LTE (Long Term Evolution)
• LTE, t he latest e volution i n HS PA net works, i s des igned t o i ncrease ef ficiency, capacity and data transfer rates. It is considered as a pre-4G technology while LTE Advanced is a 4G technology under development.
• It i s backw ard co mpatible w ith G SM and HS PA net works. I t use s a t echnology similar to HSPA+, with the application of Orthogonal Frequency Division Multiple Access ( OFDMA) in dow nlink and Single Car rier FDMA in t he up link enhanc ing spectral efficiency and increasing data transfer rates. LTE can achieve data transfer speeds of up to 100 Mbps on downlink and up to 50 Mbps on uplink.
• CDMA operators can also deploy LTE technology, with major players such as NTT DOCOMO and V erizon Wireless working on depl oying LTE on t heir commercial networks
• According to the Global Mobile Suppliers Association, 59 operators worldwide have committed t o depl oy LTE, o f w hich 22 w ill be oper ational by end-2010 and the remaining networks will be ready by 2012
LTE Advanced (Long Term Evolution Advanced)
• LTE Advanced is currently in the development phase and will be 3GPP’s candidate for 4G technologies defined by the International Telecommunication Union (ITU). The specifications for LTE Advanced are expected to be finalised by 2011.
• LTE A dvanced w ill incorporate new t echnical ad vancements s uch as Hi gh-Order MIMO (4x4 and beyond MIMO), the ability to use non-contiguous frequency ranges (alleviating frequency range i ssues), t he incorporation of F emtocells us ing Self-Organising Network techniques, self back-hauling base station, etc.
• The data transfer rates of LTE Advanced is expected to reach up to 1 Gbps
59 operators worldwide have committed to deploy LTE, of which 22 will be operational by end-2010 and the remaining networks will be ready by 2012.
HSPA
• DL: 3.6 Mbps • UL: 384 Kbps
• DL: 7.2 Mbps • UL: 1.4 Mbps
• DL: 14.4 Mbps • UL: 5.76 Mbps
HSPA+/ Evolution
• DL: 42.0 Mbps • UL: 11.5 Mbps
2006 2007 2008 2009

48 © 2010, Portio Research. All Rights Reserved
Strategies for Driving Mobile Data and Broadband Adoption
Figure 26: LTE Evolution – Data Transfer Rates
Note: DL: Downlink UL: Uplink
Source: Global Mobile Suppliers Association
EDGE (Enhanced Data Rates for GSM Evolution)
• As per the defined standards of the ITU, EDGE is considered as a 3G radio technology. However, considering the operable data transfer rates, EDGE is commonly denoted as 2.75G.
• EDGE is backward compatible with GPRS, hence subscribers travelling to locations with no EDGE network can still access voice and data services over GPRS
• Also, w ith a few addi tional updates o ver t he e xisting G SM/GPRS i nfrastructure, EDGE can be ea sily deployed in a co st effective manner. Furthermore, it does not require any additional spectrum and it can be d eployed across 850/900/1800/1900 MHz bands. These features enable mobile operators to launch 3G services effortlessly, using EDGE.
• The data transfer rates in EDGE technology can reach up to 474 Kbps on both downlink and uplink
• As of F ebruary 2010, 487 EDGE net works hav e been l aunched acr oss 190 countries13
EDGE Evolution or EDGE II • EDGE has evolved continually since 2006; the seventh release of 3GPP’s standards
saw EDGE evolving to EDGE Evolution • EDGE E volution depl oys several t echniques us ed i n HSPA+. This enabl es
subscribers of HS PA net works t o acce ss br oadband w hile r oaming i n EDGE networks.
• EDGE Evolution can achieve data transfer speeds of up to 1.2 Mbps (downlink) and 474 Kbps (uplink)
• Companies such as Nokia, Siemens and RIM have endorsed EDGE Evolution and are committed to launch this technology as a software upgrade
13 Source: Global Mobile Suppliers Association
The data transfer rates in EDGE technology can reach up to 474 Kbps on both downlink and uplink.
LTE (20 MHz)
• DL: 100 Mbps • UL: 50 Mbps
LTE Advanced
• DL: 1 Gbps (Expected)
2009 2011

© 2010, Portio Research. All Rights Reserved 49
Strategies for Driving Mobile Data and Broadband Adoption
Figure 27: EDGE Evolution – Data Transfer Rates
Note: DL: Downlink UL: Uplink
Source: Global Mobile Suppliers Association
EDGE
• DL: 237 Kbps • UL: 237 Kbps
• DL: 296 Kbps • UL: 237 Kbps
• DL: 474 Kbps • UL: 474 Kbps
EDGE Evolution
• DL: 1.2 Mbps • UL: 474 Kbps
2006 2007 2009 2010
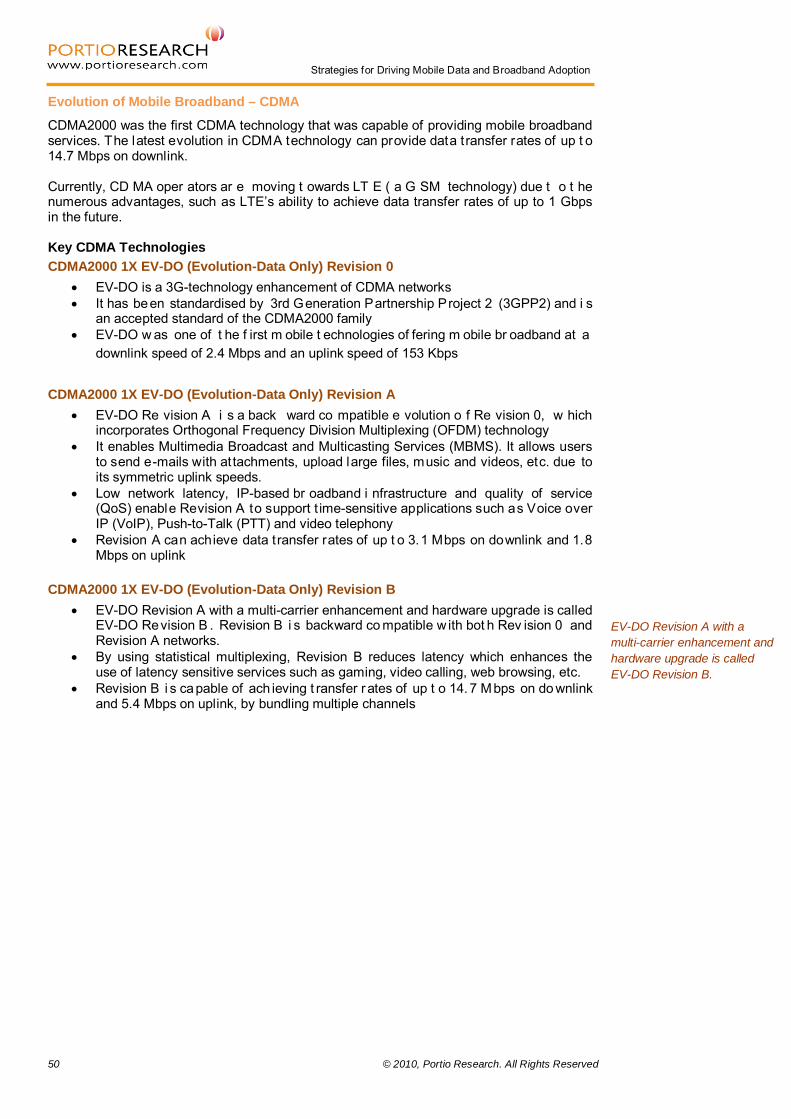
50 © 2010, Portio Research. All Rights Reserved
Strategies for Driving Mobile Data and Broadband Adoption
Evolution of Mobile Broadband – CDMA
CDMA2000 was the first CDMA technology that was capable of providing mobile broadband services. The latest evolution in CDMA technology can provide data transfer rates of up t o 14.7 Mbps on downlink. Currently, CD MA oper ators ar e moving t owards LT E ( a G SM technology) due t o t he numerous advantages, such as LTE’s ability to achieve data transfer rates of up to 1 Gbps in the future. Key CDMA Technologies CDMA2000 1X EV-DO (Evolution-Data Only) Revision 0
• EV-DO is a 3G-technology enhancement of CDMA networks • It has been standardised by 3rd Generation Partnership Project 2 (3GPP2) and i s
an accepted standard of the CDMA2000 family • EV-DO w as one of t he f irst m obile t echnologies of fering m obile br oadband at a
downlink speed of 2.4 Mbps and an uplink speed of 153 Kbps CDMA2000 1X EV-DO (Evolution-Data Only) Revision A
• EV-DO Re vision A i s a back ward co mpatible e volution o f Re vision 0, w hich incorporates Orthogonal Frequency Division Multiplexing (OFDM) technology
• It enables Multimedia Broadcast and Multicasting Services (MBMS). It allows users to send e-mails with attachments, upload large files, music and videos, etc. due to its symmetric uplink speeds.
• Low network latency, IP-based br oadband i nfrastructure and quality of service (QoS) enable Revision A to support t ime-sensitive applications such as Voice over IP (VoIP), Push-to-Talk (PTT) and video telephony
• Revision A can achieve data transfer rates of up t o 3.1 Mbps on downlink and 1.8 Mbps on uplink
CDMA2000 1X EV-DO (Evolution-Data Only) Revision B
• EV-DO Revision A with a multi-carrier enhancement and hardware upgrade is called EV-DO Revision B . Revision B i s backward co mpatible w ith bot h Rev ision 0 and Revision A networks.
• By using statistical multiplexing, Revision B reduces latency which enhances the use of latency sensitive services such as gaming, video calling, web browsing, etc.
• Revision B i s capable of ach ieving t ransfer r ates of up t o 14. 7 Mbps on do wnlink and 5.4 Mbps on uplink, by bundling multiple channels
EV-DO Revision A with a multi-carrier enhancement and hardware upgrade is called EV-DO Revision B.

© 2010, Portio Research. All Rights Reserved 51
Strategies for Driving Mobile Data and Broadband Adoption
Figure 28: CDMA2000 Evolution – Data Transfer Rates
Note: DL: Downlink UL: Uplink
Source: CDMA Development Group
CDMA2000 1X
• DL: 153 Kbps • UL: 153 Kbps
• DL: 2.4 Mbps • UL: 153 Kbps
• DL: 14.7 Mbps • UL: 5.4 Mbps
2000 2002 2007 2010 (Expected)
• DL: 3.1 Mbps • UL: 1.8 Mbps
EV-DO Rev. 0 EV-DO Rev. A EV-DO Rev. B

52 © 2010, Portio Research. All Rights Reserved
Strategies for Driving Mobile Data and Broadband Adoption
Evolution of Mobile Broadband – WiMAX
WiMAX (Worldwide Interoperability for Microwave Access) • WiMAX is the commercial term of the IEEE’s (Institute of Electrical and E lectronics
Engineers) Wireless M AN ( Metropolitan Area Networks) technology, al so denot ed as I EEE 802. 16. I t i s i n t he pr ocess of e volution and offers w ireless broadband access to subscribers.
• Mobile WiMAX has been evolving from I EEE 802.11 ( used i n Wi-Fi) w ith several enhancements in the process
• IEEE 802.16 is based on OFDMA (Orthogonal Frequency Division Multiple Access) technology and is approved by the ITU (International Telecommunication Union) as a 3G standard
• WiMAX includes high-order modulation, efficient coding, adaptive modulation and coding as well as Hybrid Automatic Repeat Request (HARQ), which is similar to the GSM technology HSPA (High-Speed Packet Access)
• Mobile WiMAX networks are not backward compatible, however they offer the following advantages:
Non-Line-of-Sight (NLOS) Operation: WiMAX does n ot r equire LoS , which makes it easy for widespread deployment
Quality of Service (QoS): WiMAX provides enhanced traffic management, achieving higher speeds in data transfer. This is accomplished by prioritising network traffic, controlling jitter and latency and improved loss characteristics.
Spectrum Efficiency: WiMAX ha s a t heoretical s pectrum e fficiency of 7bit/Hz/second
Interoperability: WiMAX m akes dat a t ransfer pos sible acr oss/between multiple operators
• Mobile WiMAX achieves data transfer rates of up to 70 Mbps in both downlink and uplink
• One of the latest developments in the IEEE 802.16 family of standards, denoted as IEEE 802. 16m, is ex pected to qualif y for t he I nternational M obile Telecommunications-Advanced ( IMT–Advanced) 4 G standard and ach ieve dat a transfer rates up to 1 Gbps
WiMAX includes high-order modulation, efficient coding, adaptive modulation and coding as well as Hybrid Automatic Repeat Request (HARQ), which is similar to the GSM technology HSPA.

© 2010, Portio Research. All Rights Reserved 53
Strategies for Driving Mobile Data and Broadband Adoption Drivers and Inhibitors – Mobile Broadband
Drivers
Figure 29: Drivers of Mobile Broadband
Source: GSMA and Portio Research Ltd.
Mobility • Mobility is one of the key drivers of mobile broadband; subscribers require access to the Internet while on the move
Data Services
• Increase in the popularity of multimedia data services such as audio/ video downloads, gam es, m obile appli cations, et c. will dr ive t he need f or hi gher data speeds
• Launch of attractive 3G services such as video calling, mobile TV, etc. will increase the demand for mobile broadband
Devices • Increasing s ales of s martphones and other high-end de vices w ill help augment the demand for mobile Internet by subscribers
Initiatives by Mobile Operators
• MNOs worldwide are expected to invest more than USD 70 billion on mobile broadband t echnologies in 2010 . Operators are m aking continuous ef forts to enhance the technology for a bet ter s ubscriber ex perience, w hich will drive mobile broadband.
• Operators’ marketing campaigns and at tractive offers will promote the use of mobile broadband
• Simple and flat data pricing will boost broadband adoption
New Mobile Services
• Implementation of new mobile services that have the potential of daily use, such as mobile banki ng, m obile t icketing/ co upons, etc., will drive m obile broadband in developed and developing economies
Social Networking, Blogs & Web 2.0
• Increased popularity of s ocial net working sites and m obile blogging w ill drive mobile broadband, par ticularly among t he yo unger generation. Web 2.0 which allows users to contribute in communities and generate their own content on the move will boost mobile broadband.
Mobile Office • Business users require high data speeds to access their e-mails and office applications while on the move
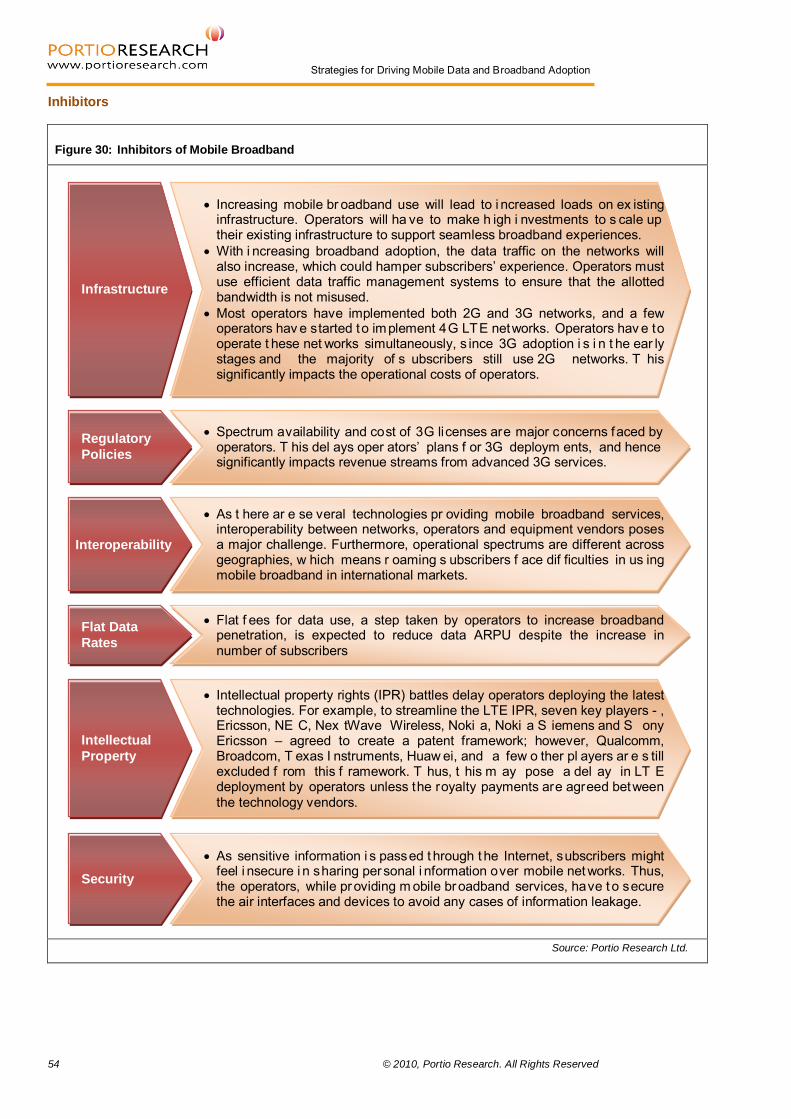
54 © 2010, Portio Research. All Rights Reserved
Strategies for Driving Mobile Data and Broadband Adoption
Inhibitors
Figure 30: Inhibitors of Mobile Broadband
Source: Portio Research Ltd.
Security • As sensitive information i s passed t hrough t he Internet, subscribers might
feel i nsecure i n sharing personal i nformation over mobile net works. Thus, the operators, while providing m obile broadband services, have t o secure the air interfaces and devices to avoid any cases of information leakage.
Infrastructure
• Increasing mobile br oadband use will lead to i ncreased loads on ex isting infrastructure. Operators will ha ve to make h igh i nvestments to s cale up their existing infrastructure to support seamless broadband experiences.
• With i ncreasing broadband adoption, the data traffic on the networks will also increase, which could hamper subscribers’ experience. Operators must use efficient data traffic management systems to ensure that the allotted bandwidth is not misused.
• Most operators have implemented both 2G and 3G networks, and a few operators hav e started to implement 4G LTE networks. Operators hav e to operate t hese net works simultaneously, s ince 3G adoption i s i n t he ear ly stages and the majority of s ubscribers still use 2G networks. T his significantly impacts the operational costs of operators.
Regulatory Policies
• Spectrum availability and cost of 3G licenses are major concerns faced by operators. T his del ays oper ators’ plans f or 3G deploym ents, and hence significantly impacts revenue streams from advanced 3G services.
Interoperability
• As t here ar e se veral technologies pr oviding mobile broadband services, interoperability between networks, operators and equipment vendors poses a major challenge. Furthermore, operational spectrums are different across geographies, w hich means r oaming s ubscribers f ace dif ficulties in us ing mobile broadband in international markets.
Flat Data Rates
• Flat f ees for data use, a step taken by operators to increase broadband penetration, is expected to reduce data ARPU despite the increase in number of subscribers
Intellectual Property
• Intellectual property rights (IPR) battles delay operators deploying the latest technologies. For example, to streamline the LTE IPR, seven key players - , Ericsson, NE C, Nex tWave Wireless, Noki a, Noki a S iemens and S ony Ericsson – agreed to create a patent framework; however, Qualcomm, Broadcom, T exas I nstruments, Huaw ei, and a few o ther pl ayers ar e s till excluded f rom this f ramework. T hus, t his m ay pose a del ay in LT E deployment by operators unless the royalty payments are agreed between the technology vendors.

© 2010, Portio Research. All Rights Reserved 55
Strategies for Driving Mobile Data and Broadband Adoption Mobile Broadband – Hardware
USB Modems • A USB Modem (also known a s a USB Dongle) i s a ‘ Plug and P lay’ dev ice which
provides i mmediate acce ss t o br oadband Internet i f co nnected t o a l aptop or a personal computer
• Mobility is t he key feature of a U SB modem; a subscriber can access broadband Internet on the move (within the service range of the mobile operator)
• The data t ransfer rates of a US B modem depend on t he mobile operator and al so the data plan selected by subscribers
• USB modems, launched in 2006, gained immediate popularity due to their ease of use and mobility
Figure 31: USB Modems/ Dongles
Source: Vodafone and Orange Websites
Internal Modems
• Internal modems are embedded in laptops, per sonal co mputers and ot her mobile Internet devices (MIDs) for access to mobile broadband
• Internal modems are more convenient to use than other broadband dev ices, since they do not require connection to any external device
• Data transfer rates of an embedded modem depend on the mobile operator and the data plan selected by subscribers
• Laptop vendors partner with operators to develop devices with embedded modems. These devices are sold with integrated network plans as bundled offers.

56 © 2010, Portio Research. All Rights Reserved
Strategies for Driving Mobile Data and Broadband Adoption
Table 7: Examples of Partnerships between Mobile Operators and Laptop Manufacturers
Laptop Manufacturer Mobile Operator
Sony VAIO Verizon Wireless (US)
Lenovo Verizon Wireless (US)
HP Verizon Wireless (US)
HP AT&T (US)
Dell AT&T (US)
Dell Vodafone (UK and Australia)
Lenovo Vodafone (UK)
Asus Orange (UK)
Compaq Orange (UK)
Dell TeliaSonera (Sweden)
Intel Reliance Communications (India)
Acer Reliance Communications (India)
Lenovo Digitel (Venezuela)
Dell Celcom (Malaysia) Source: Portio Research Ltd.
PC Cards • PC ca rds were one of the earliest devices pr oviding mobile br oadband access t o
subscribers. These cards were developed and promoted by the Personal Computer Memory Card International Association (PCMCIA).
• These ca rds can be pl ugged i n t o t he de signated ca rd s lots of l aptops f or mobile broadband connectivity
• Similar t o ot her mobile broadband hardware, t he dat a t ransfer r ates of a PC card depend on the mobile operator and the data plan selected by subscribers
• Constant innovations in PC card technology has led to the development of Express card technology, as the future replacement of PC cards
• Express cards can be plugged into the express card slot, or into the PC card slot via an adapt or. T hough t he dat a t ransfer rate i s depend ent on t he op erator, express cards are capable of achieving higher transfer rates than that of PC cards.

© 2010, Portio Research. All Rights Reserved 57
Strategies for Driving Mobile Data and Broadband Adoption
Figure 32: PC and Express Cards
Source: Company Websites
Regional Versions – Mobile Networks
Table 8: Regional Versions – Mobile Networks
Technology Deployment
Time Division Synchronous Code Division Multiple Access (TD-SCDMA)
TD-SCDMA is a 3G technology and alternative to W-CDMA. China has adopted TD-SCDMA, to avoid dependency on western technologies.
China
Personal Handy-Phone System (PHS)
PHS uses a technology similar to that of a cordless telephone. The transmitting power of the PHS base station is less than two kilometres, hence limiting the deployment of this technology to densely populated areas. PHS is expected to achieve a peak transfer rate of 800 Kbps.
Japan, China, Taiwan, Thailand, Vietnam
Evolved UMTS Terrestrial Radio Access Network (E-UTRA)
E-UTRA is an evolution to the UMTS networks, capable of achieving high data rates and low latency. It is marketed as a 4G technology.
Sweden ( Stockholm only), Norway (Oslo only)
Wireless Broadband (WiBRO)
WiBRO is a South Korean equivalent for the IEEE 802.16e standard (also known as mobile WiMAX). South Korea
iBurst, also known as High Capacity Spatial Division Multiple Access (HC-SDMA)
iBurst is a IEEE 802.20 standard, developed by ArrayComm and later adopted as the HC-SDMA standard. It is a widely used wireless broadband technology and has been implemented in a number of countries.
Norway, Lebanon, Ghana, Congo, South Africa, Azerbaijan, Kenya, Tanzania, Mozambique, Malaysia, Canada, USA
Source: Portio Research Ltd.
PC Card Express Card

58 © 2010, Portio Research. All Rights Reserved
Strategies for Driving Mobile Data and Broadband Adoption
Chapter 7 Mobile Broadband – State of the Markets

© 2010, Portio Research. All Rights Reserved 59
Strategies for Driving Mobile Data and Broadband Adoption
Mobile Broadband – State of the Markets Market Size
Mobile Broadband User Base The mobile broadband market is gaining momentum worldwide. T he e volution o f mobile networks has en abled hi gh-speed dat a t ransfer and has m ade mobile broadband m ore attractive to s ubscribers. T he wor ldwide use r base f or m obile br oadband s tood at 371. 7 million at end-2009. With MNOs making huge i nvestments to improve the quality and utility of services, the mobile broadband user base is expected to grow at a CAGR of 36.4 percent between 2009 and 2014 to reach nearly 1.8 billion by end-2014. Worldwide, the percentage of mobile subscribers using mobile broadband is expected to grow from 8.1 percent at end-2009 to 27.8 percent by end-2014. The figure below depicts the mobile broadband user base from 2009 to 2014.
Figure 33: Mobile Broadband User Base – Worldwide (In Million, 2009 – 2014F)
Source: Portio Research Ltd.
F – Forecasted
371.7521.6
721.1
975.6
1,316.5
1,757.5
0
500
1,000
1,500
2,000
2009 2010F 2011F 2012F 2013F 2014F
Mob
ile B
road
band
Use
r Bas
e(In
Mill
ion)
Year
Mobile broadband user base is expected to grow at a CAGR of 36.4 percent between 2009 and 2014 to reach nearly 1.8 billion by end-2014.

60 © 2010, Portio Research. All Rights Reserved
Strategies for Driving Mobile Data and Broadband Adoption
The table below highlights the growth of regional mobile broadband users from 2009 to 2014.
Table 9: Mobile Broadband User Base – Regional (In Million, 2009 – 2014F)14
Region Mobile Broadband Users (In Million)
2009 2010F 2011F 2012F 2013F 2014F
Europe 92.6 131.8 182.6 235.8 312.2 396.1
Asia Pacific 168.7 234.4 324.8 452.3 624.9 844.1
North America 74.0 94.7 119.1 145.9 175.2 216.1
Latin America 17.1 30.7 42.8 64.3 95.3 141.8
Africa and Middle East 19.3 30.0 51.9 77.3 108.9 159.5
Total 371.7 521.6 721.1 975.6 1,316.5 1,757.5
Source: Portio Research Ltd. Asia P acific had t he largest r egional mobile br oadband u ser ba se i n 2009, and t his constituted 45.4 percent of the worldwide mobile broadband user base. I t was f ollowed by Europe w ith a 24. 9 per cent co ntribution and North A merica w ith 19. 9 percent. T he figure below breaks out the regional share of the worldwide mobile broadband user base in 2009.
Asia Pacific is expected to lead other regions in mobile broadband adoption in terms of user base, i n t he n ext five ye ars. T he r egion will ha ve 48 per cent of t he wor ldwide m obile broadband user base by end-2014, followed by Europe with a 22.5 percent share. The next figure highlights the regional share in worldwide mobile broadband user base in 2014.
14 Note: Sum of regional numbers may not equal total due to rounding off errors.
Figure 34: Worldwide Mobile Broadband Users – Regional Contribution (In Percent, 2009)
Source: Portio Research Ltd.
24.9%
45.4%
19.9%
4.6%
5.2%
Europe Asia Pacific North America Latin America Africa and Middle East

© 2010, Portio Research. All Rights Reserved 61
Strategies for Driving Mobile Data and Broadband Adoption
The worldwide mobile broadband user base is forecast to grow at a C AGR of 36.4 percent between 2009 and 2014. Latin America, along with Africa and the Middle East, is expected to see the highest growth, since the mobile broadband user addi tions in these regions will happen on a lower user base compared with other regions. The growth rate in all regions is expected to be hi gh, as m ost of t he markets are not expected to saturate in the next f ive years.
In 2009, in t erms o f mobile broadband user base as a percentage of total mobile subscribers, North America recorded the highest level with 23.8 percent, followed by Europe with 8.8 percent. The share of worldwide mobile broadband users in the total m obile subscriber base i s expected to increase f rom 8.1 percent i n 2009 t o 27.8 percent by end-2014.
Figure 35: Worldwide Mobile Broadband Users – Regional Contribution (In Percent, 2014F)
Source: Portio Research Ltd.
F – Forecasted
The worldwide mobile broadband user base is forecast to grow at a CAGR of 36.4 percent between 2009 and 2014.
Figure 36: Mobile Broadband User Base Growth by Region (In Percent, 2009 – 2014F)
Source: Portio Research Ltd.
F – Forecasted
22.5%
48.0%
12.3%
8.1%
9.1%
Europe Asia Pacific North America Latin America Africa and Middle East
33.738.0
23.9
52.7 52.6
0
10
20
30
40
50
60
Asia Pacific Europe North America Latin America Africa and Middle East
CA
GR
(In
Per
cent
)
Region
CAGR Worldwide = 36.4 %
CAGR 36.4%

62 © 2010, Portio Research. All Rights Reserved
Strategies for Driving Mobile Data and Broadband Adoption
The t able bel ow depicts t he co ntribution of mobile br oadband u sers i n the total m obile subscriber base.
Table 10: Mobile Broadband User Base as a Percentage of Total Mobile Subscribers – Regional (In Percent, 2009 – 2014F)15
Region
Mobile Broadband Users as a Percentage of Total Mobile Subscribers (In Percent)
2009 2010F 2011F 2012F 2013F 2014F
Europe 8.8 12.0 16.1 20.3 26.4 33.1
Asia Pacific 8.0 9.8 12.4 16.0 20.8 26.7
North America 23.8 28.9 34.8 41.1 47.8 57.4
Latin America 3.5 5.8 7.5 10.6 15.0 21.3
Africa and Middle East 3.1 4.3 6.7 9.4 12.5 17.5
Worldwide 8.1 10.3 13.3 16.9 21.7 27.8
Source: Portio Research Ltd. The f igure bel ow co mpares t he co ntribution of mobile br oadband u sers i n t he r egional subscriber base.
Figure 37: Mobile Broadband Users as a Percentage of Total Mobile Subscribers – Regional (In Percent, 2009 & 2014F)
Source: Portio Research Ltd.
F – Forecasted
15 Note: Mobile broadband users as a percentage refers to mobile broadband users as a percentage of total mobile subscribers in a region.
8.8 8.0
23.8
3.5 3.1
33.126.7
57.4
21.317.5
0
10
20
30
40
50
60
70
Europe Asia Pacific North America Latin America Africa and Middle East
Mob
ile B
road
band
Use
rs'
Con
tribu
tion
(In P
erce
nt)
Region
2009 2014F

© 2010, Portio Research. All Rights Reserved 63
Strategies for Driving Mobile Data and Broadband Adoption Mobile Broadband Revenue Mobile broadband services are helping MNOs increase their data revenues. Data revenues have been dominated by SMS revenues in the past and will continue to be over the next five years. However, in part due to the increasing mobile broadband use among subscribers, the contribution of SMS to worldwide data revenues is expected to decrease from 48.4 percent in 2009 to nearly 42 percent by end-2014. During the same period, the contribution of mobile broadband to worldwide data revenues is projected to increase from 19.9 percent in 2009 to 27.1 percent by end-2014.
Figure 38: Mobile Broadband Revenue – Worldwide (In USD Billion, 2009 – 2014F)
Source: Portio Research Ltd.
F – Forecasted
The table below highlights the growth of regional mobile broadband revenues from 2009 to 2014.
Table 11: Mobile Broadband Revenue – Regional (In USD Billion, 2009 – 2014F)16
Region Mobile Broadband Revenue (In USD Billion)
2009 2010F 2011F 2012F 2013F 2014F
Europe 15.0 16.8 17.6 18.9 20.3 21.9
Asia Pacific 14.2 18.8 22.7 26.3 28.8 31.4
North America 10.7 12.6 14.3 16.1 18.6 20.8
Latin America 0.9 1.2 1.5 1.9 2.3 2.7
Africa and Middle East 1.2 1.7 2.1 2.4 2.7 3.0
Total 42.0 51.1 58.1 65.7 72.8 79.9
Source: Portio Research Ltd.
16 Note: Sum of regional numbers may not equal total due to rounding off errors.
42.0
51.158.1
65.772.8
79.9
0
20
40
60
80
2009 2010F 2011F 2012F 2013F 2014F
Mob
ile B
road
band
Rev
enue
(In U
SD B
Illio
n)
Year
Contribution of SMS to worldwide data revenues is expected to decrease from 48.4 percent in 2009 to nearly 42 percent by end-2014.

64 © 2010, Portio Research. All Rights Reserved
Strategies for Driving Mobile Data and Broadband Adoption
In 2009, Europe had the highest mobile broadband revenue, contributing 35.6 percent to the worldwide mobile broadband revenues. Europe was followed by Asia Pacific with a 33.8 percent contribution and then North America with a 25.4 percent contribution. T he f igure below shows the regional share in worldwide mobile broadband revenue in 2009.
Asia P acific is ex pected to inch ahead of Europe i n mobile br oadband r evenue by 2014. The region will acco unt f or 39. 3 percent of worldwide m obile broadband revenue by end-2014, agai nst E urope’s co ntribution of 27. 5 per cent, and N orth A merica’s 26. 1 per cent share. T he f igure bel ow hi ghlights t he r egional sh are i n worldwide m obile br oadband revenue in 2014.
17 Note: The percentages do not add up to 100 percent because of rounding off errors.
Figure 39: Worldwide Mobile Broadband Revenue – Regional Contribution (In Percent, 2009)
Source: Portio Research Ltd.
Figure 40: Worldwide Mobile Broadband Revenue – Regional Contribution (In Percent, 2014F)17
Source: Portio Research Ltd.
F – Forecasted
35.6%
33.8%
25.4%
2.2%3.0%
Europe Asia Pacific North America Latin America Africa and Middle East
27.5%
39.3%
26.1%
3.4%3.8%
Europe Asia Pacific North America Latin America Africa and Middle East

© 2010, Portio Research. All Rights Reserved 65
Strategies for Driving Mobile Data and Broadband Adoption Worldwide mobile br oadband r evenue is forecast t o gr ow at a CAGR of 13. 7 per cent between 2009 and 2014, and all regions – except Asia Pacific – are expected to record double digit CAGRs. MNOs are expected t o promote mobile broadband adoption t hrough competitive pr icing, and t his may result in mobile broadband revenue growing at a s lower pace compared with the mobile broadband user base. This effect is ant icipated to be more prominent i n l arge markets where MNOs place greater em phasis on u sing scale t o boo st revenues and network utilisation.
Worldwide mobile broadband revenue is forecast to grow at a CAGR of 13.7 percent between 2009 and 2014.
Figure 41: Mobile Broadband Revenue Growth by Region (In Percent, 2009 – 2014F)
Source: Portio Research Ltd.
F – Forecasted
7.9
17.214.3
24.0
19.3
0
5
10
15
20
25
30
Asia Pacific Europe North America Latin America Africa and Middle East
CA
GR
(In
Per
cent
)
Region
CAGR Worldwide = 13.7 %
CAGR 13.7%

66 © 2010, Portio Research. All Rights Reserved
Strategies for Driving Mobile Data and Broadband Adoption
Regional Trends
Mobile operators worldwide are encouraging the growth of mobile broadband and are formulating strategies to suit the needs of different markets. Operator s trategies ar e dependent on t he market behaviour and the cu rrent s tate o f infrastructure in their respective markets. The appropriate network technology in one region might not be suitable in other regions because of the existing network technology, density of subscriber base , dat a use behav iour, investment r equired, and r egulatory environment. Similarly, a pricing or marketing s trategy that i s successful i n one r egion might not be sustainable in another region. This section discusses the regional trends in mobile broadband adoption and the MNOs’ strategy for mobile broadband proliferation. Europe There ha ve been e xtensive 3G depl oyments i n E urope, w ith oper ators upgr ading t heir networks and t echnologies t o s erve h igh dat a s peeds and ca pabilities. S ome European markets have even upgraded to HSPA technologies. The improved networks boost data use by enterprises and consumer segments. The figure below provides the 3G subscriber forecast for Europe.
Figure 42: Technology Forecast — Europe (In Million, End 2009 – End 2014F)
Source: Portio Research Ltd.
F – Forecasted
France, the UK, Spain, I taly and Germany are the key markets in Europe with high mobile broadband adoption. The region has witnessed a positive uptake of mobile broadband owing to the following factors:
• Availability o f h igh-speed m obile net works with s peeds co mparable to fixed li ne networks
• Increase in the installed base of smartphones and high-end feature phones • Availability of advanced services and applications that allow users to stay connected
to friends and family through mobile email and social networking, and a growing online culture of sharing multimedia content including photos, videos, etc.
The r egional t rends r elated t o t he depl oyment o f mobile br oadband ca pable net works, MNOs’ strategies, and development of key content categories are stated in the next figure.
717.9558.2
360.7233.6 164.3 91.7
333.7538.8
771.2 926.4 1,017.5 1,106.5
0
200
400
600
800
1000
1200
2009 2010F 2011F 2012F 2013F 2014F
Mob
ile S
ubsc
riber
s (In
Milli
on)
Year2G and others 3G and above
France, the UK, Spain, Italy and Germany are the key markets in Europe with high mobile broadband adoption.

© 2010, Portio Research. All Rights Reserved 67
Strategies for Driving Mobile Data and Broadband Adoption
Figure 43: Regional Trends — Europe
Source: Portio Research Ltd.
Focus Area Strategies and Key Developments
Technology
Price and Packaging
Marketing and Promotions
Consumer Segments and
Content Categories
• Widespread deployment of HSPA: Used by over 120 MNOs across 42 markets; enables high data rates (peak rate over 1.8 Mbps)
• LTE rollout: To offer data speeds comparable to fixed broadband; TeliaSonera Sweden launched its LTE network in December 2009, Telekom Austria and Telenor Sweden have plans to provide LTE coverage during 2010
• Network sharing: Sharing agreements to reduce capital expenditure (CAPEX) include a multi-market network sharing agreement between Telefonica and Vodafone; TeliaSonera and Tele2 in Sweden; Vodafone and TIM in Italy; Vodafone and Orange in Spain; and T-Mobile and 3 in the UK
• Innovative devices: During H2 2009, several MNOs launched MiFi, 3G-based wireless router targeting business users
• Unlimited plans: MNOs are marketing ‘unlimited’ data plans to promote high use among subscribers
• Popularising investments in high-speed networks: MNOs are running pre-launch campaigns for technologies such as LTE, to make consumers aware of the network differentiation, and to swiftly gain critical mass of users to new technologies. Telenor Sweden launched a LTE trial campaign in 2009, highlighting the capabilities of the new networks– including peak data rates of 150 Mbps
• Increasing focus on prepaid segment: After an initial focus on postpaid subscribers (particularly for unlimited use), MNOs are now focussing on prepaid subscribers (casual use) to optimise network utilisation and revenue generation; Unlimited plans account for large data use per user at lower unit pricing, whereas prepaid plans provide an opportunity to cater to casual users with lesser data use, at higher pricing
• Mobile social networking: The developed markets in Europe have witnessed strong uptake of mobile social networking services and the use is driven by high data speeds and rich user experiences on advanced devices
• Other data-centric services: Online gaming, mobile video services, web TV broadcasting, etc. demand high speed mobile broadband connections
• Popular packages: Transparent flat-fee data plans allow use up to a specified limit; if exceeded, network speed is limited and extra charges are levied
• ‘Laptop for Free’ bundles: Mobile data access subscriptions bundled with laptops/netbooks or USB modems; payment for the device is distributed over the contract period
• International hotspot network: MNOs are bundling international hot spot use with their mobile broadband plans by leveraging their presence and collaborations in international markets. Orange Switzerland offers 2,500 free minutes of Wi-Fi access; Telenor Sweden uses this as a differentiating factor when marketing their plans
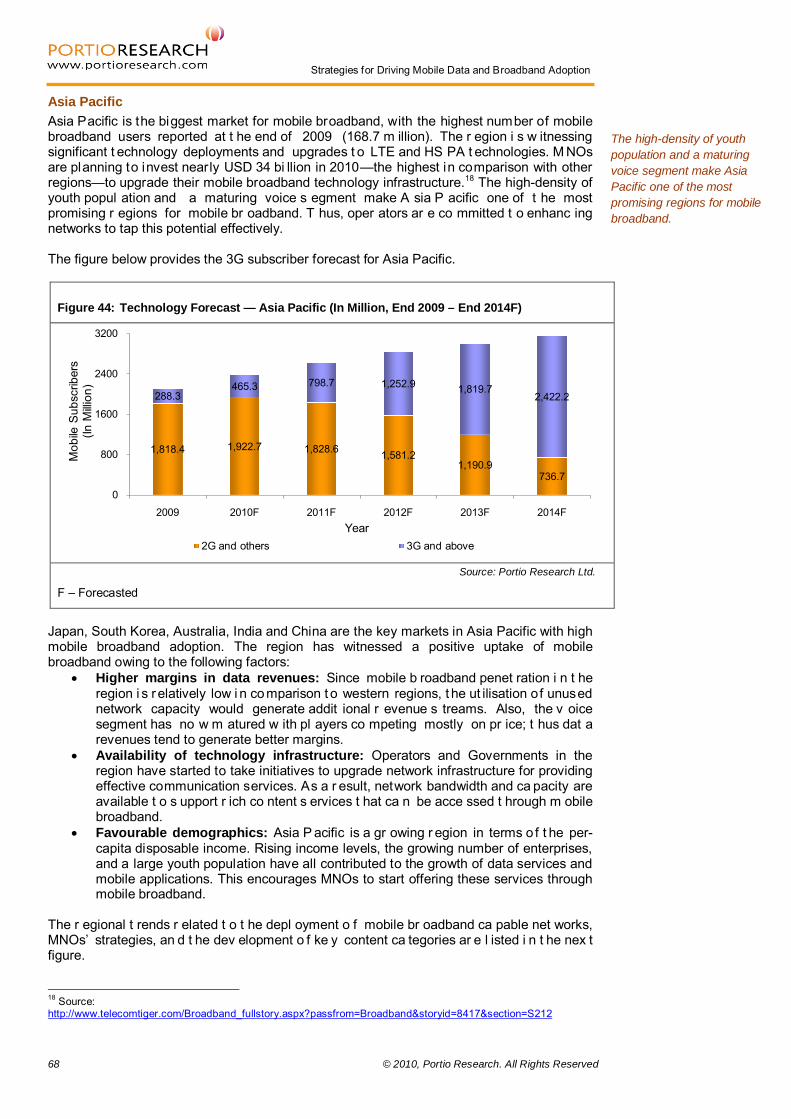
68 © 2010, Portio Research. All Rights Reserved
Strategies for Driving Mobile Data and Broadband Adoption
Asia Pacific Asia Pacific is the biggest market for mobile broadband, with the highest number of mobile broadband users reported at t he end of 2009 (168.7 m illion). The r egion i s w itnessing significant t echnology deployments and upgrades t o LTE and HS PA t echnologies. M NOs are planning to invest nearly USD 34 bi llion in 2010—the highest in comparison with other regions—to upgrade their mobile broadband technology infrastructure.18
Figure 44: Technology Forecast — Asia Pacific (In Million, End 2009 – End 2014F)
The high-density of youth popul ation and a maturing voice s egment make A sia P acific one of t he most promising r egions for mobile br oadband. T hus, oper ators ar e co mmitted t o enhanc ing networks to tap this potential effectively. The figure below provides the 3G subscriber forecast for Asia Pacific.
Source: Portio Research Ltd.
F – Forecasted
Japan, South Korea, Australia, India and China are the key markets in Asia Pacific with high mobile broadband adoption. The region has witnessed a positive uptake of mobile broadband owing to the following factors:
• Higher margins in data revenues: Since mobile b roadband penet ration i n t he region i s r elatively low i n comparison t o western regions, t he ut ilisation of unused network capacity would generate addit ional r evenue s treams. Also, the v oice segment has no w m atured w ith pl ayers co mpeting mostly on pr ice; t hus dat a revenues tend to generate better margins.
• Availability of technology infrastructure: Operators and Governments in the region have started to take initiatives to upgrade network infrastructure for providing effective communication services. As a r esult, network bandwidth and ca pacity are available t o s upport r ich co ntent s ervices t hat ca n be acce ssed t hrough m obile broadband.
• Favourable demographics: Asia P acific is a gr owing r egion in terms o f t he per-capita disposable income. Rising income levels, the growing number of enterprises, and a large youth population have all contributed to the growth of data services and mobile applications. This encourages MNOs to start offering these services through mobile broadband.
The r egional t rends r elated t o t he depl oyment o f mobile br oadband ca pable net works, MNOs’ strategies, an d t he dev elopment o f ke y content ca tegories ar e l isted i n t he nex t figure.
18 Source: http://www.telecomtiger.com/Broadband_fullstory.aspx?passfrom=Broadband&storyid=8417§ion=S212
1,818.4 1,922.7 1,828.6 1,581.21,190.9
736.7
288.3465.3 798.7 1,252.9 1,819.7
2,422.2
0
800
1600
2400
3200
2009 2010F 2011F 2012F 2013F 2014F
Mob
ile S
ubsc
riber
s (In
Milli
on)
Year2G and others 3G and above
The high-density of youth population and a maturing voice segment make Asia Pacific one of the most promising regions for mobile broadband.

© 2010, Portio Research. All Rights Reserved 69
Strategies for Driving Mobile Data and Broadband Adoption
Figure 45: Regional Trends — Asia Pacific
Source: Portio Research Ltd.
Focus Area Strategies and Key Developments
Technology
Price and Packaging
Marketing and Promotions
Consumer Segments and
Content Categories
• Migrating to HSPA Technology: Over 60 MNOs across 25 markets; some MNOs are planning to upgrade their networks to LTE technology
• High speeds: Worldwide, Telstra Australia has the largest HSPA+ 3G network with a maximum downlink speed of 21 mbps; it is also testing dual carrier HSPA technology with a downlink speed of 42 Mbps
• Flat-rate charging: Users prefer unlimited/flat-rate charging • Data packages: Data allowance plans are becoming increasingly
popular; Optus Australia, Reliance India and Telkomsel Indonesia are offering more than eight different data bundles with data allowances up to 8 GB
• Tiered Plans: Operators are also offering innovative tiered plans; Celcom Malaysia is using tiered plans based on speeds, while Maxis Malaysia has tiered plans based on volumes
• Value proposition: Mobile broadband is marketed as a replacement to fixed-line broadband
• Differentiating factors: Pricing is not the only differentiator, network coverage and quality of service are considered more important parameters for mobile broadband purchase decisions
• Consumer segments: Youth and enterprise consumers are the primary segments that drive data traffic
• Prepaid mobile broadband: Prepaid mobile broadband (PC-based Internet connectivity using flash modem with download speeds of 384 Kbps and above) is witnessing high growth
• Content: New applications and language content are more popular in the region and are driving more traffic. Consumer e-mails, social networking sites, videos, etc. are popular content services

70 © 2010, Portio Research. All Rights Reserved
Strategies for Driving Mobile Data and Broadband Adoption
North America North America is preparing for wide-scale commercial 4G deployments – WiMAX and LT E. MNOs in the US, such as Verizon and Sprint, have been the regional pioneers in deploying next generation technologies through massive trials and investments. These new technology deployments will increase the data carrying capacity of the networks in terms of volume, as well as their speed. Con sequently, mobile br oadband will e merge as an ef fective replacement for fixed broadband. The figure below provides the 3G subscriber forecast for North America.
Figure 46: Technology Forecast — North America (In Million, End 2009 – End 2014F)19
Source: Portio Research Ltd.
F – Forecasted
The US and Canada are the key markets in North America with high mobile broadband adoption. T he r egion has witnessed a positive upt ake of mobile broadband, owing t o t he following factors:
• Availability o f h igh-speed m obile net works with s peeds co mparable to fixed li ne networks
• Increase i n t he installed bas e of s martphones, such as i Phone, which enhances user experiences with mobile broadband
• Data-savvy consumer popul ation and a l arge bus iness pop ulation—an oppor tunity for MNOs to push data use
• Increasing us e of mobile on -the go and an increasing num ber o f Wi-Fi hot spots encourage data use
• Availability of advanced services and applications that allow users to stay connected to friends and family through mobile e -mail and s ocial net working, and a growing online culture of sharing multimedia content including photos, videos, etc.
The r egional t rends r elated t o t he depl oyment o f mobile br oadband ca pable net works, MNOs’ s trategies, and t he dev elopment of key content ca tegories are stated i n t he f igure overleaf.
19 Note: We have revised our 3G subscriber forecasts as our previous forecasts were made keeping the ongoing recession period in mind. However, it is now apparent that the impact of recession on 3G subscriber growth was less dampening than we previously envisaged.
236.8 203.3 168.7133.3
97.962.1
74.4 124.0 173.1 221.5 268.3 314.2
0
100
200
300
400
2009 2010F 2011F 2012F 2013F 2014F
Mob
ile S
ubsc
riber
s (In
Milli
on)
Year2G and others 3G and above
MNOs in the US, such as Verizon and Sprint, have been the regional pioneers in deploying next generation technologies through massive trials and investments.

© 2010, Portio Research. All Rights Reserved 71
Strategies for Driving Mobile Data and Broadband Adoption
Figure 47: Regional Trends — North America
Source: Company reports, Portio Research Ltd.
Focus Area Strategies and Key Developments
Technology
Price and Packaging
Marketing and Promotions
Consumer Segments and
Content Categories
• Trials for evolving technologies: The US telecom market has been at the forefront of technology evolution and has pioneered many trials: AT&T ( HSDPA i n 2005, US) and Rogers Communications (HSDPA i n 2006, C anada) p ioneered t he l aunch o f 3 .5G; M NOs ar e now conducting 4G trials, with V erizon an d A T&T following the LT E r oute with network launches planned in 2010 and 2011 respectively, whereas Sprint will be launching WiMAX in the near future
• Increased focus on mobile broadband: According t o GSMA, N orth America will ex perience the s econd highest investment in mobile broadband t echnologies in 2 010, af ter A sia P acific. T he MNOs are investing in their networks to be able to serve the growing demand for data services in the region
• Highlighting network speed: MNOs are differentiating on network speeds offered through their networks – to create consumer awareness about their new network technology and achieve critical mass of adoption. Also, to gain first mover advantage in case of launching new services on these advanced networks
• Coverage: MNOs are also using network coverage as a tool to market their services to subscribers
• Device availability: The availability of popular smartphones and other innovative devices is also an important differentiating g factor
• Youth segment: The youth segment has emerged as a major contributor to mobile broadband use; growing popularity of data-centric services such as online gaming, mobile social networking and multimedia content sharing are driving data use
• Mobile applications: The mobile applications market has mushroomed in the region after Apple launched its App Store; this has led to the adoption of various Internet-based application and services on the mobile platform
• Data services for enterprise segment: Location-based services, web TV broadcasting, web conferences, etc. are driving data use for business users
• Simplified data plans: MNOs are offering simple price plans which subscribers can easily understand
• Aggressive pricing strategy: MNOs are promoting flat-fee plans which have low per unit data charges; (these plans have 5GB upper limit ; if exceeded, network speed is often limited and extra charges are levied)
• Driving data use among 3G subscriptions: Verizon requires all its 3G subscribers to subscribe to one of the data plans; AT&T has been successful in increasing the number of 3G integrated (activated for 3G) devices by 15 million during 2009
• Leveraging the popularity of smartphones: Mobile broadband offerings bundled with popular smartphones, such as iPhone and Motorola Droid, are pushing data use

72 © 2010, Portio Research. All Rights Reserved
Strategies for Driving Mobile Data and Broadband Adoption
Latin America Latin America has been a l ate s tarter i n the 3G an d high-speed net works arena, an d the region’s 3G subscribers constituted only 4.6 percent of the total mobile subscriber base in 2009. Operators are primarily focussing on subscriber acquisition as the w ireless penetration is low in comparison with advanced markets worldwide, which generally means that advanced mobile data services are not a part of operators’ key strategies in the region. However, the future prospects for high speed data services look encouraging, as the penetration of 3G users is expected to increase to nearly 45 percent by end-2014. The figure below provides the 3G subscriber forecast for Latin America.
Figure 48: Technology Forecast — Latin America (In Million, End 2009 – End 2014F)
Source: Portio Research Ltd.
F – Forecasted
Mobile broadband has already gained traction in major markets in Lat in America, including Brazil, Argentina, Mexico, Venezuela, Peru, Chile and Colombia. However, in other parts of the region it is still finding its feet. Given below are some of the factors that drive the current growth of mobile broadband locally and will encourage future demand for the service:
• Support from local Government in markets such as Brazil to increase the presence of high-speed networks, even in remote areas
• Telecom regulatory bodies of fering full support f or mobile broadband services and allowing MNOs to use ex isting mobile bands at lower frequencies for the provision of mobile broadband services
• Increasing penet ration of mobile subscribers i s dr iving Internet access on m obiles, since t he fixed br oadband penet ration in the r egion is l ow; t his i s dr iving mobile broadband use
• Operators’ i nitiatives to grow mobile r evenues through advanced data services to compensate for falling voice ARPU
The r egional t rends r elated t o t he depl oyment o f mobile br oadband ca pable net works, MNOs’ strategies, and the development of key content categories are stated in the following figure.
464.1 471.1 458.6 433.9 403.8 367.3
22.3 59.2 110.6 170.7 232.6 299.1
0
100
200
300
400
500
600
700
2009 2010F 2011F 2012F 2013F 2014F
Mob
ile S
ubsc
riber
s (In
Milli
on)
Year2G and others 3G and above
Latin America has been a late starter in the 3G and high-speed networks arena, and the region’s 3G subscribers constituted only 4.6 percent of the total mobile subscriber base in 2009.

© 2010, Portio Research. All Rights Reserved 73
Strategies for Driving Mobile Data and Broadband Adoption
Figure 49: Regional Trends — Latin America
Source: Portio Research Ltd.
Focus Area Strategies and Key Developments
Technology
Pricing and Packaging
Marketing and Promotions
Consumer Segments and
Content Categories
• Focus on 3G: Operators in the region prefer 3G over 2G since they believe it will increase network capacity and coverage; they further argue that 3G is more efficient in terms of increasing capacity and will prevail in future over older technologies
• Increasing deployment of HSPA: 49 MNOs across 22 markets (with theoretical peak download speed greater than 1.8 Mbps)
• LTE trials: Telefonica is planning to start LTE trials in six countries including Brazil and Argentina. By end-2013, most of the operators in major markets are expected to launch LTE networks
• Promoting Internet instead of data: America Movil is focusing on Internet, rather than data, in its marketing campaigns
• Partnerships with local media: MNOs have partnered with local media and TV channels to promote mobile Internet services
• Easy to install: MNOs are promoting their mobile broadband solutions and PC dongles as easy to install solutions, keeping in mind the limited technical know-how of the subscribers in the region
• Offering new content and solutions: MNOs are offering new content services such as web TV and IPTV which will add appeal to their broadband offerings and increase the uptake of these services
• Focus on prepaid segment: Operators are focussing on penetrating their broadband services in the prepaid segment by providing broadband price plans suitable for prepaid users. It is expected that in the future, prepaid users will outnumber postpaid users as mobile broadband users.
• Capitalising on popularity of social networking: Social networking is very popular in the region; at end-2009, the highest number of Orkut, a social networking site, users originated from Brazil. MNOs are trying to capitalise on this popularity to drive mobile broadband use using mobile devices, since mobile devices are the primary medium for accessing Internet in several regional markets.
• Customised plans: MNOs have introduced new session-based price plans, which allow users unlimited Internet access for specific periods, for example one day, two days, one week, one month, etc.
• Tiered rates plans: MNOs are also offering plans which allow subscribers to download large files at discounted rates at night and non-peak hours
• Mobile broadband and PC bundles: MNOs are offering bundled mobile broadband packages with laptops or netbooks embedded with 3G chipsets and Wi-Fi capability

74 © 2010, Portio Research. All Rights Reserved
Strategies for Driving Mobile Data and Broadband Adoption
Africa and Middle East Africa and Middle East has high-potential for mobile broadband growth. Currently, the number o f s ubscribers u sing m obile br oadband i s r elatively low co mpared with matured western markets, however, this presents an exciting opportunity for global MNOs – such as MTN, Z ain and Vodacom – to o ffer mobile br oadband s ervices at co mpetitive r ates and capture the untapped market. There ar e m ore t han ten undersea ca bles, either under co nstruction or at the planning stage, to provide the necessary network infrastructure and bandwidth capacity.20
Figure 50: Technology Forecast —Africa and Middle East (In Million, End 2009 – End 2014F)
Increasing investment in br oadband i nfrastructure and a surge in m obile broadband u sers represent promising signs for this regional mobile broadband market. The figure below provides the 3G subscriber forecast for Africa and Middle East.
21
Source: Portio Research Ltd.
F – Forecasted
The UAE, South Africa, Israel, Kenya and E gypt are the key markets in Africa and Middle East that have high mobile broadband adoption. The region has witnessed a positive uptake of mobile broadband owing to the following factors:
• Building supportive infrastructure: The region is witnessing considerable investment in broadband infrastructure. The number of countries operating on HSPA technology is growing; some operators are also planning to launch LTE technology, which will provide high bandwidth and s peed to support r ich content services. The Seacom fibre-optic cable was launched in 2009 to benefit African countries, and will enable data speeds of 1.2 terabytes per second.
• Growing price competition: Owing to the low mobile broadband penetration and a substantial l ow-income co nsumer bas e i n A frican markets, M NOs ar e of fering broadband services at competitive pr ices. Operators are i ntroducing various pl ans with dat a all owances, s ervice bundl es, et c., to i ncrease t he uptake of m obile broadband services.
20 Source: http://www.reuters.com/article/idUSTRE56K3F020090721 21 Note: The 3G subscriber forecasts have been lowered (from those published previously) as the uptake of 3G services has been marred by delays in network roll-outs due to regulatory issues and operators reluctance to invest during the recent economic downturn.
553.7 567.2 530.9 468.3 395.1 315.1
60.9135.9 239.2 356.0 474.8 595.9
0
200
400
600
800
1000
2009 2010F 2011F 2012F 2013F 2014F
Mob
ile S
ubsc
riber
s (In
Milli
on)
Year2G and others 3G and above
The UAE, South Africa, Israel, Kenya and Egypt are the key markets in Africa and Middle East that have high mobile broadband adoption.

© 2010, Portio Research. All Rights Reserved 75
Strategies for Driving Mobile Data and Broadband Adoption The r egional t rends r elated t o t he depl oyment o f mobile br oadband ca pable net works, MNOs’ s trategies, and t he dev elopment of key content ca tegories are stated i n t he f igure below.
Figure 51: Regional Trends — Africa and Middle East
Source: Portio Research Ltd.
Focus Area Strategies and Key Developments
Technology
Price and Packaging
Marketing and Promotions
Consumer Segments and
Content Categories
• Mobile broadband dominating fixed broadband: In Africa, 3G/HSDPA technology subscribers outnumber fixed line ADSL subscribers. Also, fixed line broadband service providers are moving to 3G – WiMAX services to keep pace with mobile broadband technology.
• Shifting to HSPA and LTE: The region is witnessing a technology shift from HSDPA to HSPA+, to provide download speeds of up to 21 Mbps; MTN South Africa will soon launch its HSPA+ services, Etisalat and Cell C are planning to introduce 4G (LTE) networks in the UAE and South Africa respectively
• Attractive data packages: In the UAE, various data use plans, such as ‘unlimited domestic’, ‘unlimited Global’, and ‘lite use Packages’ (offering up to 50 MB of data use), are available to suit the needs of different users. 3.5G ‘Data Packages’ are also available and offer flat rate monthly charging for a fixed limit of data use ,and use-based charging for use beyond the fixed limit
• Devices for access: Popular devices, such as mobile modems, routers, laptops and netbooks, data cards and smartphones, are being offered
• Focus on pricing: In the Middle East, operators such as Etisalat are using price as a differentiating factor and are providing services at discounted rates for limited periods
• Strategic partnerships: In the Middle East, operators are also partnering with smartphone vendors to launch product promotions and thus encourage data traffic on their networks
• Target segments: Enterprise users and business professionals are the target segments of most operators in the region. MNOs are targeting the SME (Small and Medium Enterprises) segment through bundled data plans; MTN – through its ‘MTN@ccess’ project – is targeting low-income townships and aims to provide high-speed Internet access through its mobile broadband network.
• Content services: Popular content services including social networking sites such as Sembuse, navigation, instant messaging and mobile applications are increasing the demand for mobile broadband

76 © 2010, Portio Research. All Rights Reserved
Strategies for Driving Mobile Data and Broadband Adoption
Chapter 8 Mobile Broadband – Strategy Case Studies

© 2010, Portio Research. All Rights Reserved 77
Strategies for Driving Mobile Data and Broadband Adoption
Mobile Broadband – Strategy Case Studies Case Studies
Vodafone UK About the Operator Vodafone i s one of t he l eading t elecommunication se rvices pr oviders of fering f ixed-line, mobile and br oadband services. Before the recent merger of Orange and T -Mobile, i t was the second largest mobile operator in the UK after O2. Rationale for Selecting the Operator The operator has led the growth of innovative and advanced mobile data services in the UK and ha s t he hi ghest num ber of 3 G s ubscribers i n t he co untry. With ded icated e fforts t o promote advanced data services, the operator has witnessed an encouraging uptake of its mobile broadband services. The group’s mobile broadband revenue crossed GBP 1 billion in Q4 2009. 22
22 Source:
This out standing gr owth i n r evenues ha s been ach ieved through focused planning and effective promotional strategies. Vodafone is enco uraging i ts s ubscribers t o shift to advanced net works, which w ill o ffer subscribers b etter ex periences w hen u sing dat a services. I n addi tion, to offer bet ter experiences using its advanced mobile broadband services, Vodafone is offering laptops and dongles manufactured by leading manufacturers worldwide. The operator has the highest number of 3G subscribers in the country – who are the primary users of m obile broadband services – and the 3G user base is increasing steadily highlighting the growing popularity of the operator’s mobile broadband services. Strategies Focus on Broadband Network Expansion and Quality Improvement Vodafone has clearly stated its intention to extend its high-speed wireless networks to every part of the country. It is also extending its broadband network coverage to countries outside the UK, to enable subscribers to acce ss high-speed networks while roaming in near ly 135 countries. Vodafone is planning to earmark a large part of its capital expenditure (CAPEX) for mobile broadband expansion. From the outset, Vodafone has been pr oactive in l aunching and pr omoting advanced data services and has led the way in the UK. In 2007, it became the first operator in the UK to deploy HSUPA networks. The oper ator i s al so i ncreasing i ts ca pabilities; it has introduced a 3.6 M bps p eak speed evolution of HSDPA across all its 3G networks and a 7.2 Mbps peak speed in key areas. It now plans to take its network capability to higher speeds of 14.4Mbps and 21.6Mbps, which will offer more reliability and higher average connection speeds. In 2009, V odafone’s m obile br oadband net work was judged t he ‘B est Cons umer Mobile Broadband’ by the ISPA (Internet Services Providers' Association).
http://www.mobile-broadband.org.uk/news/vodafones-mobile-broadband-revenue-exceeds-1-billion-during-q4-2009-10000071/
Vodafone is encouraging its subscribers to shift to advanced networks, which will offer subscribers better experiences when using data services.
Mobile Subscribers: 19.1 million (End-2009)
Market Share: 23.7 percent (End-2009)
Monthly ARPU: USD 33.3 (Q4 2009)
3G Subscribers as a Percentage of Customer Base: 38.2 percent (End-2009)

78 © 2010, Portio Research. All Rights Reserved
Strategies for Driving Mobile Data and Broadband Adoption
Transition from 2G to 3G Vodafone is pl anning t o gradually migrate its 2G subscribers t o 3G net works. Cur rently, it has the highest 3G subscriber base in the country and the percentage of 3G subscribers in its total subscriber base is also increasing. The figure below compares the percentage of 3G subscribers in the total subscriber bases of major UK MNOs.
Figure 52: 3G Subscribers as a Percentage of Total Subscriber Base – The UK (In Percent, December 2009)
Source: Portio Research Ltd.
The UK’s 3G subscriber base is increasing and each operator is trying to shift their 2G subscribers to 3G networks. The graph below clearly depicts that in the UK, Vodafone has managed to achieve the highest growth in its 3G subscriber base in 2009.
12.1
32.429.4
38.2
0
5
10
15
20
25
30
35
40
45
O2 Orange T-Mobile Vodafone
3G P
erce
ntag
e(In
Per
cent
)
Operator
Figure 53: Increase in 3G Subscribers Percentage – The UK (In Percentage Points, Q1 2009 – Q4 2009)
Source: Portio Research Ltd.
0.5 0.7 0.71.1
3.2 3.1
2.12.6
3.1 3.1
1.5
0.6
3.9
3.2
2.4
1.6
0
1
2
3
4
5
Q1 2009 Q2 2009 Q3 2009 Q4 2009
Incr
ease
(In
Per
cent
age
Poin
ts)
Period
O2 Orange T-Mobile Vodafone

© 2010, Portio Research. All Rights Reserved 79
Strategies for Driving Mobile Data and Broadband Adoption Attractive and Innovative Services to Drive Broadband Adoption Vodafone has introduced several attractive services and products to increase the uptake of its mobile broadband services.
• In July 2009, Vodafone announced free Facebook access for its users for one week. This offer was part of the ‘Free Friday’ initiative started by Vodafone, which includes flat rate Internet browsing on Fridays.
• In December 2009, Vodafone updated i ts Mobile Connect software f or Mac users. This enabled Snow Leopard (a Mac OS) users to go online using 3G mobile broadband dongles.
• In January 2010, Vodafone Access Gateway was re-launched as ‘Sure Signal’. The hardware boo sts 3G s ignals and pr ovides a better indoor experience. W ith this launch, Vodafone claims to offer the best broadband and 3G user experience in the country.
• In January 2010, Vodafone i ntroduced m obile broadband packa ges with at tractive deals similar to those available on l andline broadband connections. The packages are div ided i nto t hree ca tegories—Standard, P remium and Ult imate—to s uit t he needs of different users.
• In Ja nuary 2010, V odafone introduced t ools w ith its broadband packa ges, which offer P C and file s ecurity t o us ers. T hese t ools ar e m ade a vailable for free w ith standard broadband packages.
User Friendly and Transparent Pricing Vodafone has introduced di fferent pr icing pl ans t o suit t he needs of dif ferent us ers. I ts broadband plans are broadly divided into the following categories:
• Plans for first time or occasional users • Plans for regular users • Plans f or r egular t ravellers ( with di fferent pl ans f or European an d worldwide
travellers) In addition, the operator offers session-based pricing rather than per MB pricing. This allows users to choose their mobile broadband plans based on their needs. To assist users in selecting the right mobile broadband plan, Vodafone allows them to check the following plan-related information on its website:
• Number of browsing hours • Number of e-mails that can be sent and received • Number of documents that can be downloaded and uploaded • Number of tracks that can be downloaded • Number of photos that can be downloaded and uploaded • Number of movies that can be downloaded • Number of software program updates that can be downloaded
Handset and Laptops/Dongles Strategy Vodafone has partnered with leading handset and l aptop vendors worldwide to expand i ts mobile broadband device portfolio. Users can choose from a wide range of Dell and Lenovo laptops, which are available with built-in 3G broadband and Vodafone SIM cards. Apart from laptops, Vodafone 3G broadband modems also come embedded in netbooks. In July 2009, Vodafone became the first operator in the UK to offer the Samsung NC10 ultra-mobile net book with i n-built mobile broadband connectivity. T he net book was of fered free of charge to users with a 24-month contract. In September 2009, Vodafone announced the launch of Vodafone 360, a s et of innovative Internet s ervices. The oper ator par tnered with S amsung t o m anufacture new d evices exclusively for V odafone 360 u sers for bet ter s ervice ex periences. T he oper ator al so partnered w ith Noki a t o s ell four Noki a Symbian s martphones pr e-loaded with V odafone 360.
In July 2009, Vodafone became the first operator in the UK to offer the Samsung NC10 ultra-mobile netbook with in-built mobile broadband connectivity.

80 © 2010, Portio Research. All Rights Reserved
Strategies for Driving Mobile Data and Broadband Adoption
In January 2010, Vodafone strengthened its mobile broadband product portfolio by including Apple iPhone 3G and iPhone 3GS into its offerings. With this launch, Vodafone users have a device that arguably offers the best browsing experience over a mobile handset. The operator r eported sa les of 100, 000 i Phones i n t he UK w ithin t wo weeks of l aunch, w ith 50,000 units sold on the launch date.23
23 Source:
http://www.mobile-broadband.org.uk/news/vodafones-mobile-broadband-revenue-exceeds-1-billion-during-q4-2009-10000071/

© 2010, Portio Research. All Rights Reserved 81
Strategies for Driving Mobile Data and Broadband Adoption The t able bel ow hi ghlights t he factors w hich ha ve l ed t o t he s uccess of V odafone UK ’s mobile broadband services.
Table 12: Success Factors – Vodafone UK
Factor Strategy
Broadband Network Expansion
Vodafone has always focused on the expansion of its advanced mobile networks, in order to cover larger numbers of subscribers.
Transition from 2G to 3G
Vodafone is encouraging its subscribers to migrate from 2G to 3G networks. This will increase the number of subscribers availing advanced services including mobile broadband, and provide a better user experience over high-speed networks.
Attractive and Innovative Services
Vodafone is attracting subscribers to its mobile broadband services with enticing plans such as free Facebook and deals that are similar to landline broadband packages.
User Friendly and Transparent Pricing
Vodafone has introduced different price plans to suit the needs of users with varying broadband requirements. The operator offers transparent pricing and users can actually visit its website to know the amount of data they can avail in a particular plan – defined in terms of number of photos, number of e-mails, songs etc..
Advanced Handset and Laptops/Dongles
Vodafone has partnered with prominent laptop and netbook manufacturers, allowing its subscribers to choose from a variety of hardware options. Vodafone is offering the hardware with embedded broadband modems, which eases the installation process for subscribers, as they do not need to attach any external hardware.
Source: Portio Research Ltd.
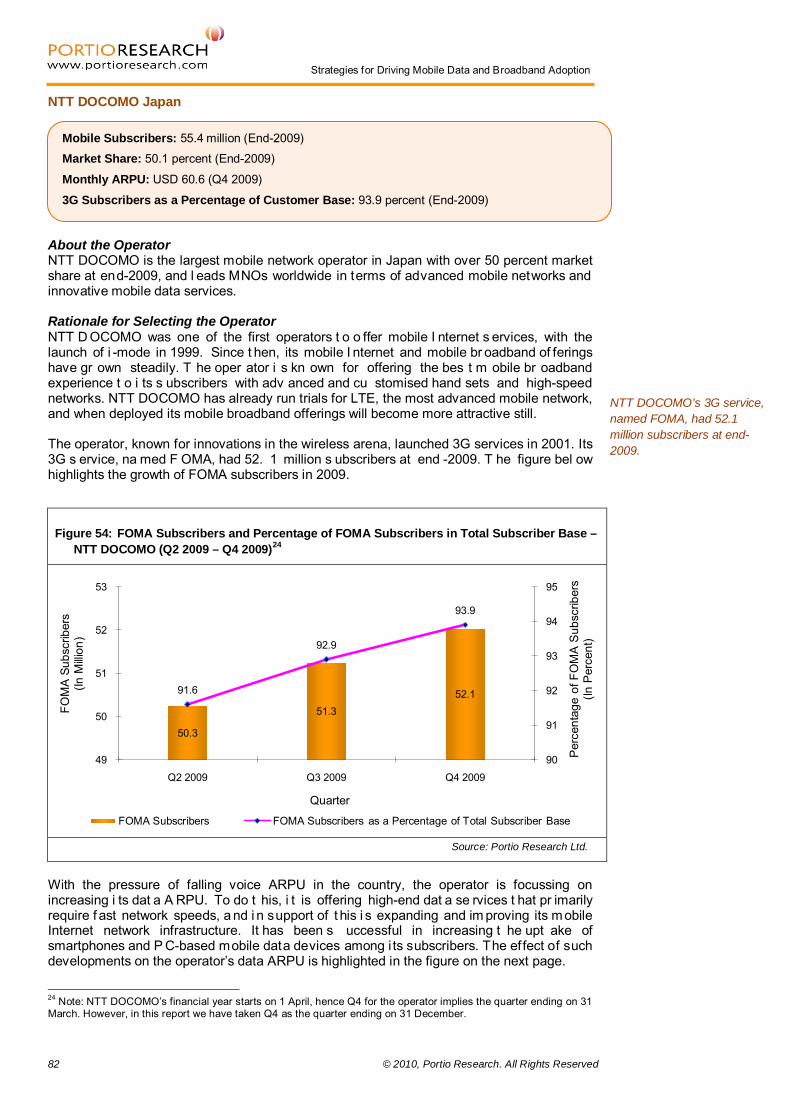
82 © 2010, Portio Research. All Rights Reserved
Strategies for Driving Mobile Data and Broadband Adoption
NTT DOCOMO Japan About the Operator NTT DOCOMO is the largest mobile network operator in Japan with over 50 percent market share at end-2009, and l eads MNOs worldwide in terms of advanced mobile networks and innovative mobile data services. Rationale for Selecting the Operator NTT D OCOMO was one of the first operators t o o ffer mobile I nternet s ervices, with the launch of i -mode in 1999. Since t hen, its mobile I nternet and mobile br oadband of ferings have gr own steadily. T he oper ator i s kn own for offering the bes t m obile br oadband experience t o i ts s ubscribers with adv anced and cu stomised hand sets and high-speed networks. NTT DOCOMO has already run trials for LTE, the most advanced mobile network, and when deployed its mobile broadband offerings will become more attractive still. The operator, known for innovations in the wireless arena, launched 3G services in 2001. Its 3G s ervice, na med F OMA, had 52. 1 million s ubscribers at end -2009. T he figure bel ow highlights the growth of FOMA subscribers in 2009.
With the pressure of falling voice ARPU in the country, the operator is focussing on increasing i ts dat a A RPU. To do t his, i t is offering high-end dat a se rvices t hat pr imarily require f ast network speeds, a nd i n support of t his i s expanding and im proving its mobile Internet network infrastructure. It has been s uccessful in increasing t he upt ake of smartphones and P C-based mobile data devices among i ts subscribers. The effect of such developments on the operator’s data ARPU is highlighted in the figure on the next page.
24 Note: NTT DOCOMO’s financial year starts on 1 April, hence Q4 for the operator implies the quarter ending on 31 March. However, in this report we have taken Q4 as the quarter ending on 31 December.
NTT DOCOMO’s 3G service, named FOMA, had 52.1 million subscribers at end-2009.
Figure 54: FOMA Subscribers and Percentage of FOMA Subscribers in Total Subscriber Base – NTT DOCOMO (Q2 2009 – Q4 2009)24
Source: Portio Research Ltd.
50.3
51.352.191.6
92.9
93.9
90
91
92
93
94
95
49
50
51
52
53
Q2 2009 Q3 2009 Q4 2009
Per
cent
age
of F
OM
A S
ubsc
riber
s(In
Per
cent
)
FOM
A S
ubsc
riber
s(In
Milli
on)
Quarter
FOMA Subscribers FOMA Subscribers as a Percentage of Total Subscriber Base
Mobile Subscribers: 55.4 million (End-2009)
Market Share: 50.1 percent (End-2009)
Monthly ARPU: USD 60.6 (Q4 2009)
3G Subscribers as a Percentage of Customer Base: 93.9 percent (End-2009)

© 2010, Portio Research. All Rights Reserved 83
Strategies for Driving Mobile Data and Broadband Adoption
Figure 55: Packet ARPU – NTT DOCOMO (In USD, Q2 2009 – Q4 2009)25
Source: Portio Research Ltd.
Strategies Early Start in Mobile Internet NTT DOCOMO started offering mobile Internet services as early as 1999 with the introduction of i -mode. The service set new benchmarks and t rends i n the mobile I nternet arena, and being the first service of its kind instantly garnered encouraging uptake from Japanese users. The operator capitalised on the initial success of the service and complemented it with the launch of innovative services such as i-appli, i-area, i-motion and i-shot. NTT DOCOMO also partnered with content providers and handset vendors to make i-mode services m ore at tractive. I n association with content providers, NT T DO COMO was able t o gener ate co ntent t hat matched t he ex pectations a nd de sires of its s ubscribers. Furthermore, its partnerships with handset vendors allowed the operator to offer customised handsets, developed specifically to increase the appeal and utility of i-mode services. In addition, flat rate pricing models enabled unlimited access of the service to i-mode users. With s uch i nitiatives i n pl ace, NT T DO COMO w as able t o es tablish i ts m obile I nternet services t hrough i -mode. DOCOMO subscribers had al ready developed a pench ant for mobile Internet services, and w ith the advent of high-speed networks in the country, these services beca me all the more at tractive. The M NO’s subscribers hav e been us ing mobile Internet s ervices f or ye ars, and so subsequently welcomed t he t ransition t o hi gh-speed networks. Furthermore, years of familiarity with mobile Internet services assisted users in a smooth t ransition t o hi gh-speed net works an d ena bled t hem t o o vercome t he hur dle o f technical know-how – a major roadblock faced by subscribers in other markets to accepting mobile broadband services. i-mode is still growing strong with over 48 million subscribers to the service and over 95,000 Internet sites offering a variety of content.26
25 Note: Packet ARPU comprises the basic monthly charges and packet communication charges for both FOMA and mova subscribers.
The figure on the next page depicts the ARPU of i-mode services.
26 Note: http://www.nttdocomo.com/services/imode/index.html
25.0
26.2
27.2
23
24
25
26
27
28
Q2 2009 Q3 2009 Q4 2009
Pack
et A
RPU
(In U
SD)
Quarter
i-mode is still growing strong with over 48 million subscribers to the service and over 95,000 Internet sites offering a variety of content.

84 © 2010, Portio Research. All Rights Reserved
Strategies for Driving Mobile Data and Broadband Adoption
Figure 56: i-mode ARPU – NTT DOCOMO (In USD, Q2 2009 – Q4 2009)
Source: Portio Research Ltd.
Enhancing Content for Higher Broadband Use Japanese subscribers are typically tech-savvy, have a thirst for advanced data services, and expect continuous service i nnovation f rom t heir operators. Therefore, to s erve t he dat a needs of subscribers NTT DOCOMO has launched several attractive data services, which it regularly upgrades. As a result, subscriber levels of these services are increasing steadily. The oper ator ha s partnered with se veral co mpanies providing i nnovative co ntent, t o increase the appeal of it s offerings. In M ay 2009, NTT DOCOMO, i n a j oint v enture with Avex Entertainment Inc., launched the Bee TV service to promote video content among its subscribers. The content is specifically developed to suit the small screens of mobile devices, and the operator believes that mobile video will drive the uptake of 4G/LTE networks i n t he f uture – as subscribers’ demand f or hi gh-definition video s treaming i s growing. The operator is continuously trying to improve the overall experience of users, by offering easy-to-find content and faster download speeds, etc.
24.4 25.5
36.4
0
5
10
15
20
25
30
35
40
Q2 2009 Q3 2009 Q4 2009
i-mod
e A
RPU
(In U
SD)
Quarter
NTT DOCOMO has partnered with several companies providing innovative content, to increase the appeal of its offerings.

© 2010, Portio Research. All Rights Reserved 85
Strategies for Driving Mobile Data and Broadband Adoption The figure below highlights the growing popularity of the Bee TV service.
Figure 57: Subscribers – Bee TV (In Million, Q2 2009 – Q4 2009)
Source: Portio Research Ltd.
NTT DO COMO has par tnered with DeNA—a prominent company in e -commerce and the Internet advertising domain—to develop and launch a website with user-generated content. This will allow subscribers to share content generated by themselves with other users. The operator is also focussing on service personalisation to increase service uptake, and i-concier is one of the prime examples of its efforts to make its services more personal and useful. T he s ervice d istributes i nformation t o us ers on t he bas is of t heir locations and preferences. The service’s encouraging uptake is depicted in the figure below.
Figure 58: Subscribers – i-concier (In Million, Q2 2009 – Q4 2009)
Source: Portio Research Ltd.
0.4
0.80.9
0.0
0.2
0.4
0.6
0.8
1.0
Q2 2009 Q3 2009 Q4 2009
Subs
crib
ers
(In M
illio
n)
Quarter
1.6
2.3
3.1
0
2
4
Q2 2009 Q3 2009 Q4 2009
Subs
crib
ers
(In M
illio
n)
Quarter

86 © 2010, Portio Research. All Rights Reserved
Strategies for Driving Mobile Data and Broadband Adoption
Furthermore, the oper ator has also r ealised t he i mportance of local co ntent t o pus h i ts services. I n Dece mber 2009, it launched ‘K anagawa S himbum newspaper’ that pr ovides information on e vents and f estivals t aking p lace i n Kanagawa Prefecture, a district in t he southern Kantō region of Honshū, Japan. It i s al so gr adually increasing t he num ber of it s content sites, to offer users a variety of content. The figure below shows the increasing number of its content sites.
Figure 59: Number of Content Sites – NTT DOCOMO (Q2 2009 – Q4 2009)
Source: Portio Research Ltd.
Promoting Flat Rate Plans NTT DOCOMO is aggressively promoting its fl at-rate subscription plan ‘Pake-hodai’. The main focus of the plan is to make users co mfortable about t heir data use and stop them worrying about t heir m onthly bills. T he MNO constantly revises i ts pl ans t o bet ter su it t he needs of its subscribers; for example, in 2008, Pake-hodai double and Biz-hodai double services were l aunched to enable users to adj ust t heir monthly fee on t he ba sis of each month’s use. To increase the overall appeal of these services, NTT DOCOMO in May 2009 reduced the entry rates for the service from USD 12 to USD 5. In December 2009, it introduced the ‘Mail Tsukai-hodai’ service, which provided unlimited domestic i-mode mail access for a flat fee of USD 12.2 per month. With such offers in place, the operator has been abl e to successfully achieve its goal of higher flat rate data subscriptions. The growth in these subscriptions i s shown in the figure below.
Figure 60: Subscribers – Pake-hodai (In Million, Q2 2009 – Q4 2009)
Source: Portio Research Ltd.
332.0
423.0493.0
0
100
200
300
400
500
600
Q2 2009 Q3 2009 Q4 2009
Num
ber o
f Con
tet S
ites
Quarter
19.621.5
23.1
0
5
10
15
20
25
Q2 2009 Q3 2009 Q4 2009
Subs
crib
ers
(In M
illio
n)
Quarter
NTT DOCOMO introduced the ‘Mail Tsukai-hodai’ service, which provided unlimited domestic i-mode mail access for a flat fee of USD 12.2 per month.

© 2010, Portio Research. All Rights Reserved 87
Strategies for Driving Mobile Data and Broadband Adoption Promoting PC Data Cards NTT DOCOMO has focussed o n t he sales of i ts P C data communication devices, and is promoting these dev ices through aggressive advertising on T V and attractive plans – such as ‘T wo-tier-flat-rate data package’ and ‘m opera U U flat-rate high-speed plan’. I t has al so collaborated with PC manufacturers to offer PCs with in-built broadband modems. The figure below depicts the growth in its PC data communication device sales.
Figure 61: PC Data Communication Devices Sold – NTT DOCOMO (In Million, Q2 2009 – Q4 2009)
Source: Portio Research Ltd.
The number of PC data communications subscribers availing flat rate data plans has risen considerably in comparison to subscribers opting for use based data plans. The figure below highlights the increasing trend for flat rate data plans.
Figure 62: PC Data Communications Flat Rate and Use Based Data Plan Subscriptions – NTT DOCOMO (In Million, Q2 2009 – Q4 2009)
Source: Portio Research Ltd.
0.08
0.12
0.16
0.0
0.1
0.2
Q2 2009 Q3 2009 Q4 2009
Dev
ices
Sol
d(In
Mill
ion)
Quarter
0.20
0.28
0.400.38 0.39 0.40
0.00
0.15
0.30
0.45
Q2 2009 Q3 2009 Q4 2009
Dat
a Su
bscr
iptio
ns(In
Mill
ion)
Quarter
Flat Rate Use Based

88 © 2010, Portio Research. All Rights Reserved
Strategies for Driving Mobile Data and Broadband Adoption
Introducing Smartphones and Enhancing their Features To retain subscriber interest in its services, NTT DOCOMO has improved its content library and i ntroduced se veral s martphones f or us ers t o avail these services w ith bet ter user experiences. The operator is not only introducing smartphones, rather with each launch it is incorporating new and ad vanced features t o make it s content more attractive and eas y to use. T he ne w s martphones ar e dev eloped and i ntroduced whi le ke eping the t hree most important factors in perspective—functions, prices and target consumers. Most smartphones offered by the MNO have s tandardised HS DPA functions and near ly 50 per cent o f its subscribers have hands ets equipped with HS DPA f unctions. I n No vember 2008, i t categorised its handset device portfolio into four series—the docomo STYLE, docomo PRIME, docomo SMART and docomo PRO—to suit the needs and lifestyles of its users. In 2009, it launched winter and spring handset models with advance designs and functionalities, and the operator cl aims t hat these i nitiatives ha ve s ignificantly helped improving o verall hands et s ales. A s of Ja nuary 2010, t he cu mulative s ales of it s ne w handset series reached 13 million. Along with feature advancements, the MNO is also trying to make devices attractive in terms of price, and has cut down on i ts development costs to reduce handset procurement costs. Leader in Advanced Wireless Networks NTT DOCOMO believes that it has to deploy a reliable and hi gh-quality mobile network to increase the uptake of advanced mobile data services, including mobile broadband. I t has been among the leading MNOs worldwide in the development of advanced and high-speed mobile net works, and t he op erator considers hi gh-quality networks as one of t he m ajor reasons behind the encouraging uptake of mobile broadband services. I t deployed the first 3G network way back in 2001 and has already run successful trials for LTE (4G networks), which i t p lans t o commercially launch by end-2010. The operator bel ieves t hat LT E is t he future technology and has expressed i ts intentions to phase out i ts 2G network completely by March 2011. T he MNO has regularly upgraded its net work to deliver a better user experience when accessing advanced services and co ntent. In June 2009, NTT DOCOMO launched a HSUPA network with a maximum uplink transmission rate of 5.7 Mbps.
NTT DOCOMO believes that it has to deploy a reliable and high-quality mobile network to increase the uptake of advanced mobile data services, including mobile broadband.

© 2010, Portio Research. All Rights Reserved 89
Strategies for Driving Mobile Data and Broadband Adoption The t able bel ow hi ghlights t he f actors which hav e l ed t o t he success of NT T DOCOMO’s mobile broadband services.
Table 13: Success Factors – NTT DOCOMO Japan
Factor Strategy
Early Start in Mobile Internet
NTT DOCOMO started offering mobile Internet services in 1999 with the launch of i-mode, and over the years has been able to increase the appeal of its mobile Internet and mobile broadband offerings. These services have grown in popularity among its subscribers and are being used more frequently.
Enhancing Content for Higher Broadband Use
NTT DOCOMO has realised that with the improving quality and speeds of mobile networks, subscribers expect advanced and innovative services to make the most of these networks. The operator continuously upgrades its established services and launches new content matching the network and handset capabilities.
Promoting Flat Rate Plans
NTT DOCOMO is encouraging the uptake of flat rate pricing plans among its subscribers. Such plans allow users to access mobile broadband services without worrying about their monthly mobile bill. Subscribers have received such plans well, and the number of flat rate plan subscribers is increasing steadily.
Promoting PC Data Cards
NTT DOCOMO understands the importance of PC and laptops/netbooks in the proliferation of mobile broadband services. Hence the operator is pushing the use of such hardware (embedded with mobile broadband modems) through attractive pricing plans and aggressive advertising.
Introducing Smartphones and Enhancing their Features
NTT DOCOMO regularly introduces advanced smartphones in order to allow its subscribers to get the best experience from its mobile broadband offerings. In addition, it upgrades the features of its handsets to enhance the ease of use of these services.
Leader in Advanced Wireless Networks
NTT DOCOMO believes in offering the best and the latest technology to its subscribers. This enables the operator to extend the most advanced mobile data services to its subscribers and let its subscribers enjoy these services, without the hassle of network congestion and poor service quality.
Source: Portio Research Ltd.

90 © 2010, Portio Research. All Rights Reserved
Strategies for Driving Mobile Data and Broadband Adoption
Verizon Wireless US About the Operator Verizon Wireless—a j oint venture bet ween Verizon Communications and V odafone Group with 55 per cent and 45 per cent ownership respectively—is one o f the leading MNOs in the US. The oper ator pr ovides m obile services on CDM A networks, w ith 3G services of fered over EV-DO Rev-A technology. Rationale for Selecting the Operator Among al l the oper ators i n t he US , i t had t he l argest 3G subscriber ba se a s well as t he highest figure for 3G subscribers a s a per centage of mobile cu stomers at end-2009. T he table below compares KPIs for the top-four MNOs (by market share) operating in the US.
Table 14: MNOs’ Key Performance Indicators – The US (2009)
MNO Market Share (In Percent)
3G Subscribers (In Million)
3G Subscribers as a Percentage of
Customer Base (In Percent)
AT&T Mobility 29.8 24.2 28.4
Sprint Nextel 16.9 14.2 29.4
T-Mobile US 11.8 1.9 5.5
Verizon Wireless 31.9 31.5 34.5
Source: Portio Research Ltd.
Also, Verizon had t he hi ghest data A RPU among t he M NOs that report dat a A RPU. The figure below compares the data ARPU for Verizon, AT&T and T-Mobile.
Figure 63: Data ARPU – The US (In USD, Q1 2009 – Q4 2009)
Source: Portio Research Ltd.
9.4 9.9 10.1 10.2
13.6 14.6 15.1 15.614.2 15.0 15.6 16.2
0
4
8
12
16
20
Q1 2009 Q2 2009 Q3 2009 Q4 2009
Dat
a AR
PU(In
USD
)
Period
T-Mobile US AT&T Verizon Wireless
Mobile Subscribers: 91.2 million (End-2009)
Market Share: 31.9 percent (End-2009)
Monthly ARPU: 50.8 USD (2009)
3G Subscribers as a Percentage of Customer Base: 34.5 percent (End-2009)
© 2010, Portio Research. All Rights Reserved 91
Strategies for Driving Mobile Data and Broadband Adoption Verizon has better presence in terms of market share and 3G subscriber base, and has high data ARPU. Also, Verizon Wireless has been at the forefront of the deployment of new, capable t echnologies t o o ffer its subscribers hi gh qu ality of s ervice. T herefore, w e ha ve selected the operator to study its strategies for driving mobile broadband adoption. Verizon’s Mobile Broadband Service Verizon’s m obile br oadband service is based on the EV-DO Rev-A network. T he service, when accessed using EV-DO Rev-A capable devices, provides typical speeds of 600 Kbps–1.4 Mbps for download and 500–800 Kbps for upload. However, when a subscriber does not have an EV-DO Rev-A capable handset or is in a s ervice area where EV-DO Rev-A is not present, lower broadband speeds are realised.27
• Verizon MiFi is a 3G modem solution which integrates 3G modems and Wi-Fi, and acts as a hotspot for devices with Wi-Fi capabilities
In June 2007, Verizon Wireless upgraded its entire EV-DO network to EV-DO Rev-A, which enabled USB modems, PC cards and select handsets to achieve theoretical peak download/upload speeds of 3.1 Mbps/1.8 Mbps. The operator began field trials for 4G Long T erm Evolution (LTE) in Boston and S eattle i n August 200 9. I n M arch 2010, Verizon said the r esults of t he t rials i ndicated data r ates significantly faster than its deployed 3G networks: peak download speeds of 40 -50 Mbps and peak upl oad speeds of 20 -25 M bps peak rates were ach ieved us ing t he 4G LT E network. T he MNO ha s announced plans t o cover 100 m illion peopl e t hrough i ts 4G LT E network by end-2010, and is utilising its 700 MHz spectrum for this LTE deployment – as it is suitable f or quickly deploying a wireless broadband n etwork with excellent coverage. With LTE technology, Verizon ca n s ignificantly increase dat a t ransfer s peeds, and t his i s expected t o enco urage t he m igration o f s ubscribers f rom fixed br oadband t o m obile broadband. Devices Verizon’s mobile broadband service can be acce ssed using f eature phones, smartphones, and m obile br oadband ca pable wireless dev ices, such a s P C C ards, E xpress C ards, embedded laptops and mobile broadband Connect cable wireless devices. Innovative product: MiFi
• The Wi-Fi connection is enabled by entering the network security code assigned to a MiFi
• The de vice i s ea sy to i nstall on se veral oper ating systems ( OS). Windows O S identifies the MiFi as an E V-DO modem and aut o-installs the drivers using a USB. The device is also compatible with Linux OS-based netbooks.
Key services with high Internet use
• V CAST: It offers music downloads and video streaming services • Get It Now: It allows subscribers to download and use applications and content on
Verizon Get It Now-enabled handset Success factors
• Acceptance and Adoption of Data Services: The US is one of the major markets worldwide in terms of data use. The market has a large number of subscribers with such service compatible handsets, and the market has witnessed strong growth with flat-rate data plans. Verizon Wireless witnessed a co nsistent growth in data ARPU during all four quarters of 2009.
• Investments: Verizon Wireless has been m aking proactive investments in network upgrades to m eet t he dat a use demands of us ers. T he E V-DO Re v-A net work upgrade in June 2007 al lowed the operator to cash in on t he growing demand f or data-centric services, i ncluding video and m usic downloads a nd the sharing of multimedia content on s ocial net working pl atforms. The operator ha s been o ne of
27 Note: Typical speeds are noticeably lower than the theoretical peak speeds.
Verizon’s mobile broadband service can be accessed using feature phones, smartphones, and mobile broadband capable wireless devices.

92 © 2010, Portio Research. All Rights Reserved
Strategies for Driving Mobile Data and Broadband Adoption
the pi oneers i n t esting and pl anning t he depl oyment of LT E. T his w ill further increase i ts net work’s ca pacity to meet t he gr owing dem and for dat a t hrough smartphones and netbooks.
• Burgeoning Smartphone and Netbook Subscriber Bases: The US has witnessed t remendous gr owth i n t he sales of s martphones and net books t hat provide a better us er experience w hile acce ssing m obile br oadband. T his, along with t he availability of 3G hot spots and hi gh-speed n etworks (EV-DO Rev-A), has resulted in an increase in the number of users opting to access broadband services on-the-go.
Strategies Constantly Evolving Pricing The unit price of data in flat-rate pricing plans is significantly lower than the unit price of data in pay-as-you-go plans. Furthermore, the number of data pricing tiers has been decreased from four to three, to simplify the pricing structure. The figure below shows the data plans for mobile subscribers.
This simple pricing structure encourages users to subscribe to flat-rate plans which help the operator i n terms of data use requirements. Also, flat rate data plans encourage high data use among subscribers. Thus, an aggr essive pricing strategy for flat-rate data plans along with a provision of 3G hot spots and M iFi is an attempt to encourage relatively longer data sessions and higher data use. Strong Portfolio of Devices Verizon o ffers a w ide r ange of devices ca tering to varying user r equirements. I ts devices portfolio includes:
• Feature phones LG Chocolate Touch – Allows faster connectivity for V CAST music with
Rhapsody Samsung Rogue – Pre-installed with VZ Navigator (GPS navigation
software); has removable memory (helpful in transferring downloaded data) LG enV3 – Has a pre-installed family locator application
• Smartphones Palm Pre Plus – Provides easy access to 3G hot spots BlackBerry Storm2 – A 3G-enabled smartphone Motorola Droid – A smartphone with Android 2.0 features for enhanced
multi-tasking and acce ss to 10,000 mobile applications f rom Android’s App market
Figure 64: Monthly Data Plans for Mobile Subscribers – Verizon Wireless (March 2010)
Source: Portio Research Ltd.
2.0
10.0
30.0
0
10
20
30
Per MB 25 MB Unlimited
Pric
ing
(In U
SD)
Data Use
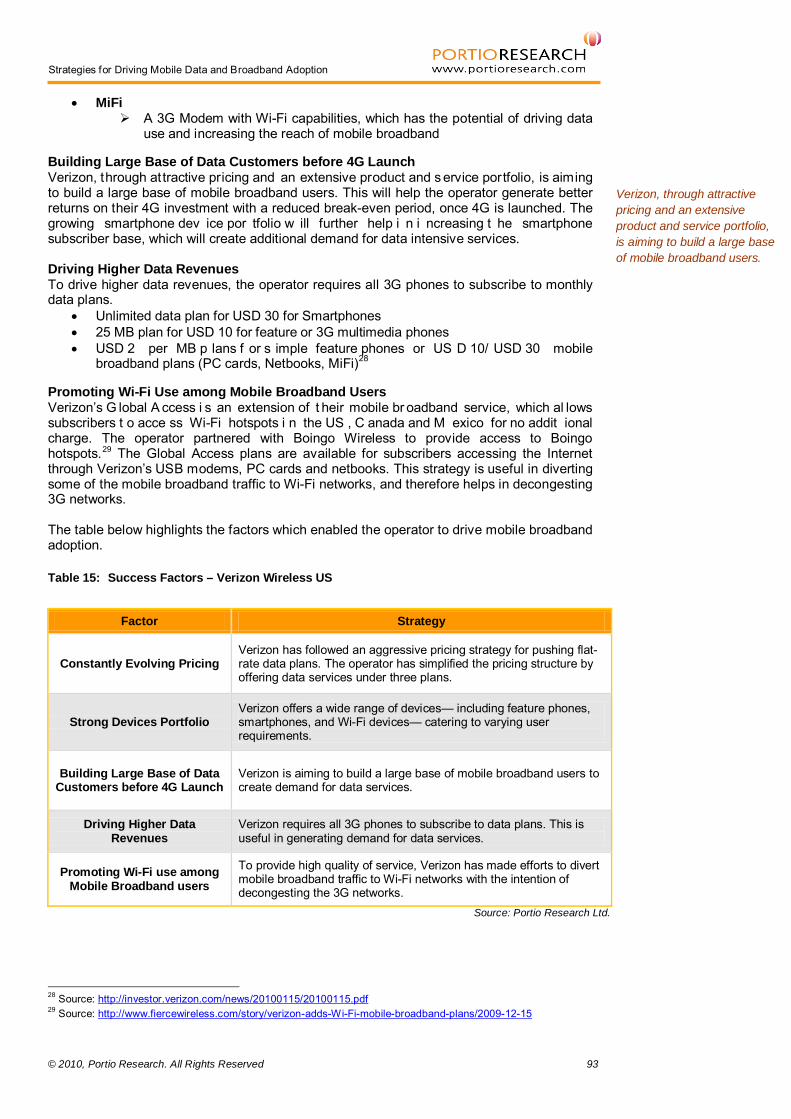
© 2010, Portio Research. All Rights Reserved 93
Strategies for Driving Mobile Data and Broadband Adoption
• MiFi A 3G Modem with Wi-Fi capabilities, which has the potential of driving data
use and increasing the reach of mobile broadband
Building Large Base of Data Customers before 4G Launch Verizon, through attractive pricing and an extensive product and s ervice portfolio, is aiming to build a large base of mobile broadband users. This will help the operator generate better returns on their 4G investment with a reduced break-even period, once 4G is launched. The growing smartphone dev ice por tfolio w ill further help i n i ncreasing t he smartphone subscriber base, which will create additional demand for data intensive services. Driving Higher Data Revenues To drive higher data revenues, the operator requires all 3G phones to subscribe to monthly data plans.
• Unlimited data plan for USD 30 for Smartphones • 25 MB plan for USD 10 for feature or 3G multimedia phones • USD 2 per MB p lans f or s imple feature phones or US D 10/ USD 30 mobile
broadband plans (PC cards, Netbooks, MiFi)28
Promoting Wi-Fi Use among Mobile Broadband Users
Verizon’s G lobal A ccess i s an extension of t heir mobile br oadband service, which al lows subscribers t o acce ss Wi-Fi hotspots i n the US , C anada and M exico for no addit ional charge. The operator partnered with Boingo Wireless to provide access to Boingo hotspots.29
Table 15: Success Factors – Verizon Wireless US
The Global Access plans are available for subscribers accessing the Internet through Verizon’s USB modems, PC cards and netbooks. This strategy is useful in diverting some of the mobile broadband traffic to Wi-Fi networks, and therefore helps in decongesting 3G networks. The table below highlights the factors which enabled the operator to drive mobile broadband adoption.
Factor Strategy
Constantly Evolving Pricing Verizon has followed an aggressive pricing strategy for pushing flat-rate data plans. The operator has simplified the pricing structure by offering data services under three plans.
Strong Devices Portfolio Verizon offers a wide range of devices— including feature phones, smartphones, and Wi-Fi devices— catering to varying user requirements.
Building Large Base of Data Customers before 4G Launch
Verizon is aiming to build a large base of mobile broadband users to create demand for data services.
Driving Higher Data Revenues
Verizon requires all 3G phones to subscribe to data plans. This is useful in generating demand for data services.
Promoting Wi-Fi use among Mobile Broadband users
To provide high quality of service, Verizon has made efforts to divert mobile broadband traffic to Wi-Fi networks with the intention of decongesting the 3G networks.
Source: Portio Research Ltd.
28 Source: http://investor.verizon.com/news/20100115/20100115.pdf 29 Source: http://www.fiercewireless.com/story/verizon-adds-Wi-Fi-mobile-broadband-plans/2009-12-15
Verizon, through attractive pricing and an extensive product and service portfolio, is aiming to build a large base of mobile broadband users.

94 © 2010, Portio Research. All Rights Reserved
Strategies for Driving Mobile Data and Broadband Adoption
Orange UK About the Operator Orange—a subsidiary of France Telecom—is a pr ominent telecom services provider i n the UK. With the recent merger of Orange and T -Mobile in the UK, the new merged ent ity has become the largest mobile services provider in the country. Rationale for Selecting the Operator Some UK MNOs are facing the challenge of maintaining desired levels of quality of service. An example of this i s 3 UK and O 2 UK, who in December 2009 issued apologies f or poor quality of service in accessing data services, particularly in high-density areas. Orange has fared better and has received top awards in various consumer surveys for its mobile broadband network in categories such as reliability, ease of use and upload speeds. In July 2009, O range UK ’s m obile br oadband net work w as r ated by Ofcom, t he UK ’s communications regulator, as the best network for 3G coverage. Orange’s key strategy has been i ts f ocus on qual ity of services and i ts m obile broadband service is one o f the main examples of this strategy. The success of its mobile broadband strategy can be judged f rom t he growth i n it s 3G s ubscriber bas e dur ing 2009; this i s depicted below.
In 2009, Orange UK’s 3G subscriber base grew by 2 million, second only to Vodafone UK’s 3G subscriber additions of 2.1 million. However, Orange led in terms of percentage increase in 3G subscriber base. In t he s ection bel ow we will briefly discuss t he m ethods a dopted by the oper ator t o popularise its broadband dongles among its subscribers.
In July 2009, Orange UK’s mobile broadband network was rated by Ofcom, the UK’s communications regulator, as the best network for 3G coverage.
Figure 65: MNOs’ Absolute and Percentage Growth in 3G Subscriber Base – The UK (2009)
Source: Portio Research Ltd.
0.7 0.9
2.01.6
2.114.4
42.5
59.5
45.741.1
0
20
40
60
80
0
1
2
3
3 UK O2 UK Orange UK T-Mobile U K Vodafone U K
Per
cent
age
Gro
wth
in
3G S
ubsc
riber
Bas
e (In
Per
cent
)
3G S
ubsc
riber
Add
itions
(In M
illion
)
MNO
3G Subscriber Additions Percentage Growth in 3G Subscriber Base
Mobile Subscribers: 16.5 million (End-2009)
Market Share: 20.6 percent (End-2009)
Monthly ARPU: USD 35.4 (Q4 2009)
3G Subscribers as a Percentage of Customer Base: 32.4 percent (End-2009)

© 2010, Portio Research. All Rights Reserved 95
Strategies for Driving Mobile Data and Broadband Adoption Strategies Pushing Broadband Dongles Orange’s 3G subscriber base i s i ncreasing at a s teady pace and t he percentage of these subscribers with 3G dongl es is al so i ncreasing. Don gles ar e an integral par t of Orange’s mobile broadband strategy. The figure below shows the growth in the uptake of 3G dongles.
Building Brand Perception by Offering More Value to Users Brand i s an important element in the highly competitive UK mobile market, and Orange i s making continuous efforts to build and strengthen its brand image. In October 2009, Orange Mobile B roadband w as re-voted as t he b est m obile br oadband service i n a s urvey conducted by YouGov, having achieved this feat earlier in April 2009. Orange has been launching attractive offers for it s subscribers and pays cl ose at tention to addressing subscribers’ concerns. For example, if a user wants to know the network quality of a particular area, they can visit Orange’s website and check the network coverage status of that ar ea. O range has cl early classified all r egions i nto f ive d ifferent ca tegories—low, moderate, good, very good and excellent—on the basis of network quality. F urthermore, Orange’s mobile broadband software is easy to install, and the interface is simple, reducing technical obstacles f or subscribers. One of the biggest concerns f or subscribers regarding mobile broadband is the possibility of overuse and the associated costs. Orange has tried to address t his co ncern by offering free s oftware t hat al erts s ubscribers when t hey are approaching their data limit. Orange’s continuous efforts to improve its network and quality of service have helped to build a positive image. Killing Competition through Aggressive Pricing In August 2009, Orange launched a broadband plan for less than GBP 5 per month, which was then the lowest broadband tariff plan ever offered by a UK operator, and is available for both ‘pay monthly’ and ‘pay -as-you-go’ su bscribers. T he oper ator has also introduced several other attractive tariff plans, including the ‘Early Bird’ plan that offers unlimited mobile broadband between midnight and 9:00 AM.
Figure 66: 3G Dongle Subscribers and Percentage of 3G Dongle Subscribers in Total 3G Subscriber Base – Orange UK (Q2 2009 – Q4 2009)
Source: Portio Research Ltd.
In August 2009, Orange launched a broadband plan for less than GBP 5 per month, which was then the lowest broadband tariff plan ever offered by a UK operator.
0.28
0.33
0.38
6.4
7.07.2
5
6
7
8
0.0
0.2
0.4
Q2 2009 Q3 2009 Q4 2009
Per
cent
age
of 3
G D
ongl
e S
ubsc
riber
s (In
Per
cent
)
3G D
ongl
e S
ubsc
riber
s(In
Milli
on)
Quarter
3G Dongle Subscribers 3G Dongle Subscribers as a Percentage of Total 3G Subscriber Base

96 © 2010, Portio Research. All Rights Reserved
Strategies for Driving Mobile Data and Broadband Adoption
In February 2010, Orange announced plans to reduce the daily roaming fee for subscribers using mobile broadband services in Europe. The operator allows subscribers two options for using data while roaming: data up to 2 MB for GBP 2 per day, and data up to 50 MB for GBP 8.5 per day for heavy users. Wide Range of Laptops and Dongles Orange has partnered with l eading vendors such as Compaq, HP and A sus f or bundling laptops with its mobile broadband offerings; it has also partnered with Huawei and Z TE for dongle offerings. In November 2009, Orange added two new laptops—Asus 1005H GO and the Compaq CQ61—to its hardware offerings. Asus 1005H GO with buil t-in Orange mobile broadband is offered exclusively by Orange, while the operator offers a free ‘Orange e1752’ dongle with the Compaq laptop. Also, to make its hardware offerings more attractive, Orange combines them with advanced accessories to increase their appeal and utility. The t able bel ow hi ghlights t he f actors w hich hav e enabled O range UK t o dr ive mobile broadband adoption.
Table 16: Success Factors – Orange UK
Factor Strategy
Pushing Broadband Dongles Promoting sales of wireless Dongles is an integral part of Orange UK’s mobile broadband strategy, as they account for more data use per device compared to handsets.
Building Brand Perception by Offering More Value to Users
Orange UK i s making continuous efforts to build and strengthen i ts brand image. Its continuous efforts to improve its network and quality of se rvice have he lped t o bui ld a po sitive i mage i n t he m inds of subscribers.
Killing Competition through Aggressive Pricing
Orange UK’s initiatives – such as offering a broadband plan for less than GBP 5 per month, the ‘Early Bird’ plan to promote data use between midnight and 9 AM, and reduced roaming fees – have helped the operator to attract more subscribers to its data services.
Wide Range of Laptops and Dongles
Orange has partnered with leading vendors like Compaq, HP and Asus for its broadband offerings bundled with laptops, and has thereby increased the choice available to subscribers.
Source: Portio Research Ltd.

© 2010, Portio Research. All Rights Reserved 97
Strategies for Driving Mobile Data and Broadband Adoption Key Parameters for the Uptake of Mobile Broadband
The four most important parameters that drive the uptake of mobile broadband service in a particular market are the following:
• Network • Content • Pricing • Devices
The table below discusses these parameters in brief.
Table 17: Strategies to Push Mobile Broadband Uptake
Factor Strategy
Network
• Proactively deploying advanced networks to gain first mover advantage • Expanding networks as much as possible to decrease the number of blind or
weak spots, and reach more subscribers • Regularly upgrading networks to keep up with advancing networks worldwide • Focusing on the Quality of Service to offer better experiences to subscribers
and keep them interested in the services
Content
• Providing innovative and attractive content to attract subscribers • Personalising the content to increase overall appeal and better suit the needs
of subscribers • Developing and promoting local content to effectively connect with subscribers
in a given market • Introducing new content services and regularly updating earlier launched
services to retain subscribers’ interest
Pricing
• Transparent pricing plans for subscribers providing clear details of exactly what they are being charged for
• Customised pricing plans to suit high data use among postpaid subscribers, as well as casual data use in prepaid subscriber segments
• Competitive pricing to attract users and encourage high data use
Devices
• Advanced devices should be offered to let users get the best experience from
the services and content • Various devices should be offered from which users can pick the hardware of
their choice, which they believe is the most suitable for the services they want to avail
• Partnering with top players in the hardware domain gains the confidence of subscribers
Source: Portio Research Ltd.

98 © 2010, Portio Research. All Rights Reserved
Strategies for Driving Mobile Data and Broadband Adoption
Chapter 9 Mobile Applications – Introduction and Market Size

© 2010, Portio Research. All Rights Reserved 99
Strategies for Driving Mobile Data and Broadband Adoption
Mobile Applications – Introduction and Market Size Overview
From their traditional use for voice and messaging, mobile handsets have transformed into information and ent ertainment de vices w ith per vasive appli cations. T hese appl ications provide user i nterfaces for m essaging and ot her advanced dat a se rvices such as games, videos and Internet browsing, and are either pre-loaded on to mobile phones or can be downloaded by users over wireless networks and installed on their handsets. In this report, we have taken the mobile application user base as the number of subscribers who use their mobile handsets for downloading and installing third-party mobile applications. For enabl ing users to i nstall and r emove t hird-party mobile appli cations, m obile handsets need to have an operating system (OS) and an A pplication P rogramming I nterface (API). Popular operating systems include:
• Symbian OS • BlackBerry OS • iPhone OS • Android OS • Windows Mobile OS • Palm webOS • Linux Mobile OS
The availability of an operating system and A PI qualif ies handsets as smartphones. Some applications also require handsets to have supporting platforms, such as Adobe’s Flash Lite, Java’s J2 ME and Qualcomm’s BREW. With handset v endors looking t o tap t he m obile applications market and using it as a differentiating factor, smartphones are being introduced at low prices; and the price difference between smartphones and feature phones is blurring. Some of t he feature phones provided with browsers and supporting pl atforms can acce ss basic applications, such as instant messaging (IM) and mobile banking, but are incapable of downloading and installing third party mobile applications, and therefore do not contribute to the growth of mobile application downloads. This report takes into account only the devices capable of running third-party applications. Currently, there are a v ariety of mobile appl ications available to satisfy different consumer needs. Some of these are mentioned below:
• Communication E-mail and IM clients Mobile Web and Internet Browsers Search On-Device Portals
• Media and Entertainment Graphics/Image Viewers Audio and Video Players Games eBooks Social Networking Portals
• Productivity Calendar Calculator, Currency Converters Task Manager, File Manager Directory Services
With handset vendors looking to tap the mobile applications market and using it as a differentiating factor, smartphones are being introduced at low prices.
100 © 2010, Portio Research. All Rights Reserved
Strategies for Driving Mobile Data and Broadband Adoption
• Payments Mobile Advertising Mobile Payments
• Navigation Google Maps GPS
These ap plications ar e differentiated by the r untime env ironments in w hich t hey are executed:
• Native p latforms and oper ating s ystems, s uch as S ymbian, Windows M obile, BlackBerry, Android, Apple OS, and Linux
• Mobile Web/browsers such as Webkit, Mozilla Firefox and Opera Mini • Other managed platforms such as Java/J2ME, BREW and Flash Lite
Improved network technologies and growing demand for smartphones has led to increased customer ex pectations f or sophisticated appl ications and r ich content se rvices. O perators’ flat-rate dat a offers and unl imited dat a packa ges ar e pr omoting t he gr owth o f mobile broadband, and consequently the mobile apps market is benefiting. Moreover, i ntense competition in the application ecosystem is pushing app prices down, further stimulating the demand for mobile applications. Value Chain and Ecosystem
The mobile applications ecosystem comprises platform developers, appl ication developers, aggregators, m obile oper ators, hands et v endors and appl ication s tore owner s; an d t he marketplace for mobile appli cations i s currently highly fragmented. M obile oper ators and platform pr oviders ar e focusing on l aunching t heir own app stores, while t here is i ntense competition among independent appl ication developers and t hird-party aggregators. This is pushing do wn appl ication pr ices, which i n a w ay is s timulating demand. However, since a majority of t he appli cation dow nloads ar e f ree, i t is co mmercially challenging for t he applications ecosystem. Market players are experimenting with different revenue approaches t o m onetise t he appl ications m arket. Mobile apps are available as either pai d applications or for free. Al so, ad sponsored appl ications are gaining popularity since these are provided free of cost to consumers. App store owners are also experimenting between different payment mechanisms, such as di rect billi ng through payment gat eways, operator billing and in-app purchases. In the following figure, we have explained the generic value chain for mobile applications.
Mobile operators and platform providers are focusing on launching their own app stores, while there is intense competition among independent application developers and third-party aggregators.
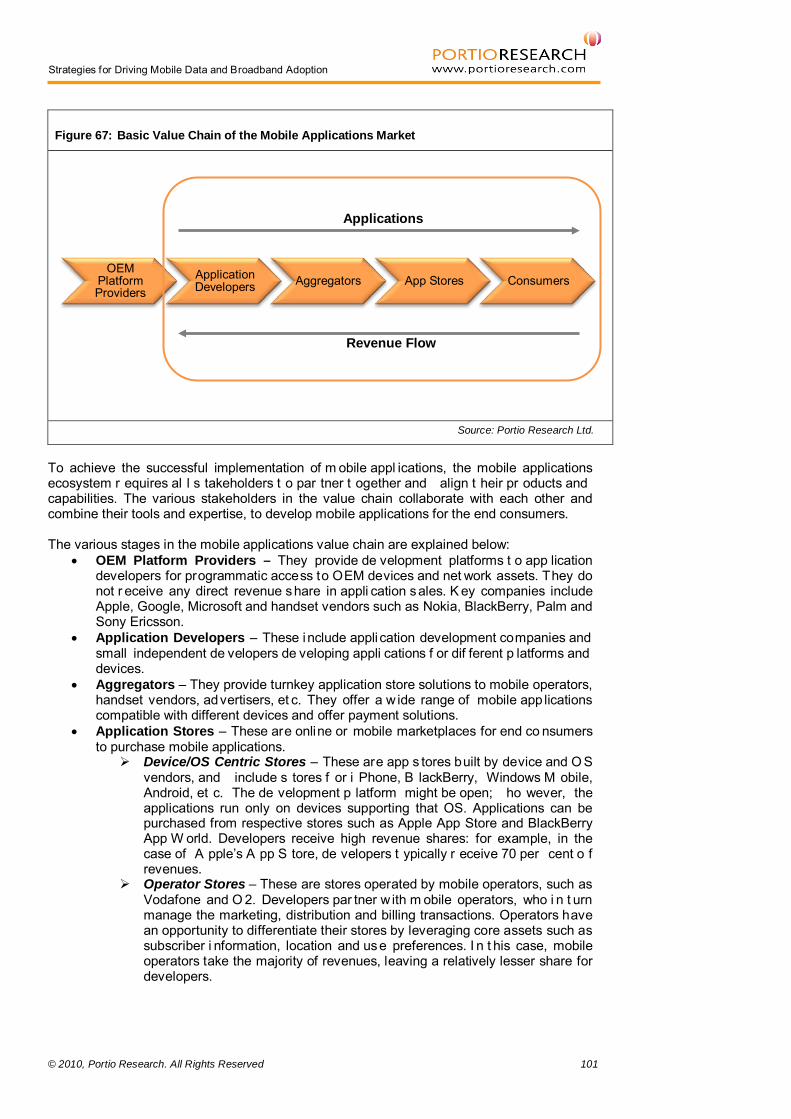
© 2010, Portio Research. All Rights Reserved 101
Strategies for Driving Mobile Data and Broadband Adoption
Figure 67: Basic Value Chain of the Mobile Applications Market
Source: Portio Research Ltd.
To achieve the successful implementation of m obile appl ications, the mobile applications ecosystem r equires al l s takeholders t o par tner t ogether and align t heir pr oducts and capabilities. The various stakeholders in the value chain collaborate with each other and combine their tools and expertise, to develop mobile applications for the end consumers. The various stages in the mobile applications value chain are explained below:
• OEM Platform Providers – They provide de velopment platforms t o app lication developers for programmatic access to OEM devices and net work assets. They do not r eceive any direct revenue share in appli cation sales. K ey companies include Apple, Google, Microsoft and handset vendors such as Nokia, BlackBerry, Palm and Sony Ericsson.
• Application Developers – These include appli cation development companies and small independent de velopers de veloping appli cations f or dif ferent p latforms and devices.
• Aggregators – They provide turnkey application store solutions to mobile operators, handset vendors, advertisers, et c. They offer a w ide range of mobile app lications compatible with different devices and offer payment solutions.
• Application Stores – These are online or mobile marketplaces for end co nsumers to purchase mobile applications.
Device/OS Centric Stores – These are app s tores built by device and O S vendors, and include s tores f or i Phone, B lackBerry, Windows M obile, Android, et c. The de velopment p latform might be open; ho wever, the applications run only on devices supporting that OS. Applications can be purchased from respective stores such as Apple App Store and BlackBerry App W orld. Developers receive high revenue shares: for example, in the case of A pple’s A pp S tore, de velopers t ypically r eceive 70 per cent o f revenues.
Operator Stores – These are stores operated by mobile operators, such as Vodafone and O 2. Developers par tner w ith m obile operators, who i n t urn manage the marketing, distribution and billing transactions. Operators have an opportunity to differentiate their stores by leveraging core assets such as subscriber i nformation, location and use preferences. I n t his case, mobile operators take the majority of revenues, leaving a relatively lesser share for developers.
OEM Platform Providers
Application Developers Aggregators App Stores Consumers
Applications
Revenue Flow

102 © 2010, Portio Research. All Rights Reserved
Strategies for Driving Mobile Data and Broadband Adoption
Third-Party/White Label Stores – These are stores operated by third-party providers such as G etJar and Handango. T hey work with developers and aggregators t o of fer applications t o consumers, acr oss a range of devices and O S. Developers receive a high revenue share; however, these s tores do not have direct visibility.
Mobile Application Stores App Stores are distribution channels to market; such stores distribute mobile applications to end consumers. App stores are owned and operated by application developers and by other players acr oss the value ch ain, including handset v endors, mobile operators and aggregators. The t able on t he nex t page provides a l ist o f the key App s tores acr oss different categories (OS vendors, handset vendors, mobile operators and others).

© 2010, Portio Research. All Rights Reserved 103
Strategies for Driving Mobile Data and Broadband Adoption
Table 18: Major Application Stores
OS Players Handset Vendors Mobile Operators Others
Google Android Market Apple App Store Vodafone 360 GetJar
Microsoft Windows Marketplace Nokia Ovi Store T-Mobile Web2go Mobango
Symbian Horizon BlackBerry App World O2 Litmus PocketGear (Handango)
Java Store Motorola Shop4APPS Orange App Shop Handmark
Palm App Catalog Sony Ericsson PlayNow Arena
Verizon Wireless VZAppZone Handster
LG Application Store AT&T Media Mall MobiHand (BlackBerry Applications)
Samsung Apps China Mobile Market SlideMe
Source: Portio Research Ltd.
Business Model and Revenue Sharing
Revenue generated through the sale of mobile applications is distributed among developers, aggregators a nd appl ication s tore ow ners, based on pr edefined r evenue s haring agreements. Apart from network data access, mobile operators in most cases work as billing enablers for handset/OS vendors and third-party stores. However, operators demand a large revenue s hare, which i s di scouraging for appl ication de velopers and s tore o wners. As a result, market players are also trying to establish credit card and other payment mechanisms to a void oper ator bi lling, and i n r eturn m aximise t heir r evenue s hares. Ho wever, t his arrangement i s generally less popular w ith consumers, i n par t due t o s ecurity concerns arising from sharing credit card information over-the-air. Apple is an exception, since it uses its well-established iTunes credit card billing mechanism for all App store transactions.
The following t wo bu siness m odels ar e t he ones predominately used i n t he mobile applications market:
• App-centric Model • Operator-centric Model
These models are briefly discussed over the coming pages.
Given a choice of paying via their operator or using a credit card, more than 80 percent of customers use operator billing.
― Nokia

104 © 2010, Portio Research. All Rights Reserved
Strategies for Driving Mobile Data and Broadband Adoption
App-centric Model The App-centric business m odel i nvolves higher i ncentives f or the application developers. Apple’s App Store is the industry benchmark representing the App-centric business model, offering a transparent m arketplace for de velopers whi le byp assing t he oper ator from t he value chain. Also, Apple offers a r ich user experience with easy access to the store from a device’s home screen, and – as mentioned – integrated bi lling with the iTunes distribution mechanism. Operators charge high commissions for processing payments through their networks, and so logically – and following the success of Apple’s direct billing mechanism – app store owners are t rying t o establish di rect bill ing relationships with app s tore use rs. I n t his model, third-party billing enablers are present in the value chain, and they charge minimal fees (paid by app stores) f or pr oviding bi lling and ho sting s olutions. Ho wever, co nsumers ha ve m ixed feelings about using cr edit/debit ca rd pay ment mechanisms for appli cation dow nloads; again, Apple’s App Store is a key exception.
Figure 68: App-centric Business Model
Source: Portio Research Ltd.
OS/OEM platform owners invite application developers to join the developer community and provide them with tools and the software development kit (SDK) to develop the OS-specific applications. Application de velopers cr eate new an d ex citing appli cations und er dif ferent categories, which are launched in the app stores. App store consumers can download these applications on their devices, and the amount is debited to their iTunes account (in Apple’s case) or their credit card accounts – in the case of paid applications. Billing enablers provide the mobile payment gateways to enable credit card payments.
Apple’s App Store is the industry benchmark representing the App-centric business model offering a transparent marketplace for developers while bypassing the operator from the value chain.
Application Development
Revenue Revenue
OS/OEM Platforms
Application Developers Consumers App Stores
Billing Enabler
Tool
s
Application Application

© 2010, Portio Research. All Rights Reserved 105
Strategies for Driving Mobile Data and Broadband Adoption The payment process is executed as follows:
• Application stores receive revenue from consumers, either directly (as in the case of Apple) or through third-party billing enablers
• The total revenue received by app stores is then shared with application developers; generally a 70:30 ratio in favour of the developers
• The billing enabler is paid by the app store owner separately
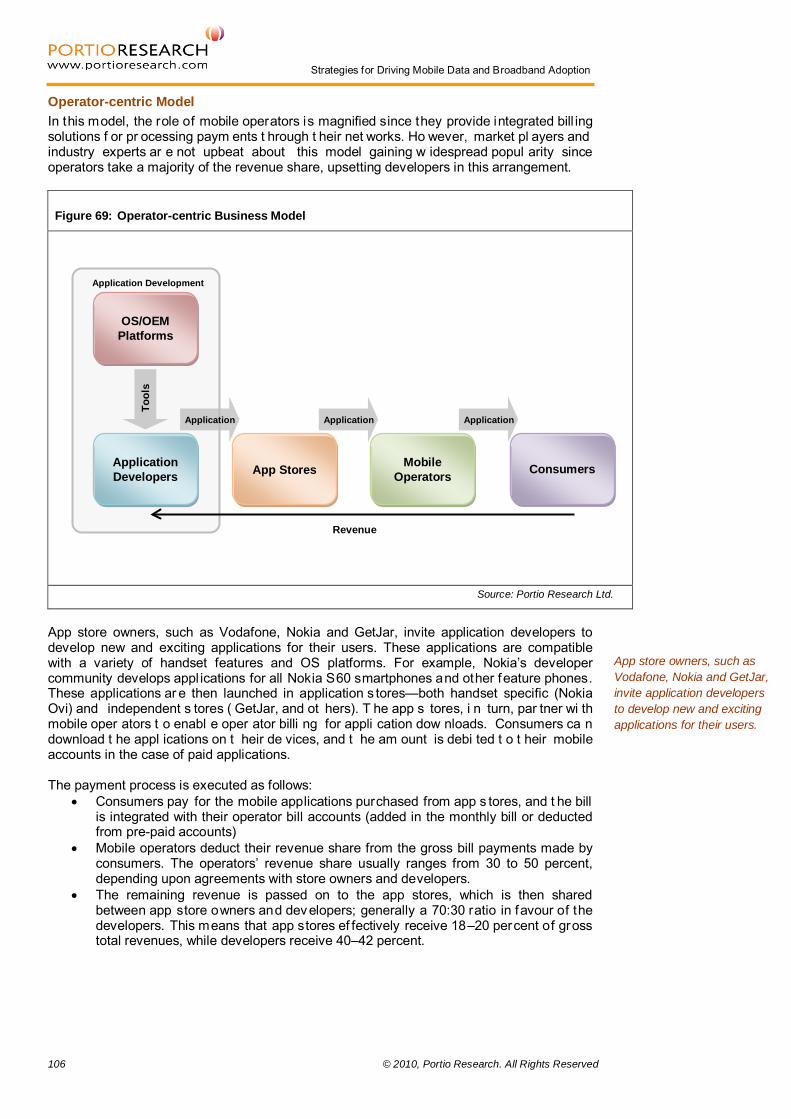
106 © 2010, Portio Research. All Rights Reserved
Strategies for Driving Mobile Data and Broadband Adoption
Operator-centric Model In this model, the role of mobile operators is magnified since they provide integrated bill ing solutions f or pr ocessing paym ents t hrough t heir net works. Ho wever, market pl ayers and industry experts ar e not upbeat about this model gaining w idespread popul arity since operators take a majority of the revenue share, upsetting developers in this arrangement.
Figure 69: Operator-centric Business Model
Source: Portio Research Ltd.
App store owners, such as Vodafone, Nokia and GetJar, invite application developers to develop new and exciting applications for their users. These applications are compatible with a variety of handset features and OS platforms. For example, Nokia’s developer community develops appl ications for all Nokia S60 smartphones and other feature phones. These applications ar e then launched in application s tores—both handset specific (Nokia Ovi) and independent s tores ( GetJar, and ot hers). T he app s tores, i n turn, par tner wi th mobile oper ators t o enabl e oper ator billi ng for appli cation dow nloads. Consumers ca n download t he appl ications on t heir de vices, and t he am ount is debi ted t o t heir mobile accounts in the case of paid applications. The payment process is executed as follows:
• Consumers pay for the mobile applications purchased from app s tores, and t he bill is integrated with their operator bill accounts (added in the monthly bill or deducted from pre-paid accounts)
• Mobile operators deduct their revenue share from the gross bill payments made by consumers. The operators’ revenue share usually ranges from 30 to 50 percent, depending upon agreements with store owners and developers.
• The remaining revenue is passed on to the app stores, which is then shared between app store owners and developers; generally a 70:30 ratio in favour of the developers. This means that app stores ef fectively receive 18–20 percent of gross total revenues, while developers receive 40–42 percent.
App store owners, such as Vodafone, Nokia and GetJar, invite application developers to develop new and exciting applications for their users.
OS/OEM Platforms
Application Developers Consumers App Stores
Tool
s
Revenue
Application
Mobile Operators
Application Application
Application Development

© 2010, Portio Research. All Rights Reserved 107
Strategies for Driving Mobile Data and Broadband Adoption The figure below describes the revenue sharing in the operator-centric business model.
Figure 70: Revenue Sharing in the Case of an Operator-centric Business Model
Source: Portio Research Ltd.
Mobile Operators can add value to the Mobile Application Ecosystem Mobile appli cations of fer a huge oppor tunity for mobile oper ators t o dr ive dat a use and increase revenue. However, operators need t o broaden t heir scope an d dev elop a ‘smart pipe’ s trategy to succeed i n t he v alue chain. Operators hav e uni que advantages t hat can help them build a robust mobile application ecosystem.
• Direct relationship with customers – Operators have a large addressable market with close customer relationships. This provides them with a key advantage, as they can leverage customer information – location, presence, permissions, contacts, etc. – to create personalised offerings.
• Well-established systems and processes – Operators have w ell-established billing systems and ot her pr ocesses t o cr eate compelling user ex periences. They can of fer a seamless service, with purchase, bi lling and CRM functions al l linked together at their end.
In s ummary, to s ucceed i n t he mobile app lications market, oper ators need t o cr eate a successful eco system w ith t ransparent r evenue s haring models t hat a ttract de velopers. Also, it m ust i nclude a well-managed appli cation distribution model acr oss div erse device portfolios to offer smooth end-user experiences.
The mobile operator, on av erage, receives 40 percent of gr oss r evenues; passing on t he remaining 60 percent to an app store.
The remaining 60 percent is then split further, with an ap p store receiving 18 p ercent an d a developer receiving 42 percent of total gross revenues.
App Store 30%
Developer 70%
Mobile Operator
40% Remaining 60%

108 © 2010, Portio Research. All Rights Reserved
Strategies for Driving Mobile Data and Broadband Adoption
Market Size
Mobile Applications User Base The growth in the mobile applications market has been largely stimulated by the introduction of Apple’s App S tore, w hich was opened in Ju ly 2008. M obile appli cations, apar t from providing an additional source of revenue, also act as a differentiating factor for an operator and as a channel to push mobile advertisements and mobile Internet. The mobile applications market has been witnessing a number of developments, including the launch of app stores by various smartphone v endors, MNOs and t hird par ty developers. S everal brands are also developing mobile applications to establish their position in the market and to get closer to consumers. The worldwide user base for mobile applications stood at 38.7 million at end-2009. The increasing penetration of smartphones and the growing a vailability of mobile applications in a number of categories is expected to boost the uptake of mobile applications, par ticularly in de veloped markets. T he m obile appli cations u ser ba se i s expected to grow at a CAGR of 32.5 percent between 2009 and 2014 to reach 157.6 million by end-2014. The percentage of worldwide mobile subscribers using mobile appl ications is expected to grow from nearly 0.8 percent at end-2009 to 2.5 percent by end-2014. The figure below depicts the mobile applications user base from 2009 to 2014.
Figure 71: Mobile Applications User Base – Worldwide (In Million, 2009 – 2014F)
Source: Portio Research Ltd.
F – Forecasted
38.7
60.2
82.9
106.5
131.8
157.6
0
30
60
90
120
150
180
2009 2010F 2011F 2012F 2013F 2014F
Mob
ile A
pplic
atio
ns U
ser B
ase
(In M
illio
n)
Year
The mobile applications user base is expected to grow at a CAGR of 32.5 percent between 2009 and 2014 to reach 157.6 million by end-2014.

© 2010, Portio Research. All Rights Reserved 109
Strategies for Driving Mobile Data and Broadband Adoption The table below highlights the growth of regional mobile applications users from 2009 to 2014.
Table 19: Mobile Applications User Base – Regional (In Million, 2009 – 2014F)
Region Mobile Applications User Base (In Million)
2009 2010F 2011F 2012F 2013F 2014F
Europe 11.1 15.2 20.2 26.0 32.4 39.3
Asia Pacific 11.4 16.2 21.1 26.8 33.9 42.5
North America 14.6 26.6 38.4 49.1 58.6 65.3
Rest of World 1.6 2.2 3.2 4.6 6.9 10.5
Total 38.7 60.2 82.9 106.5 131.8 157.6
Source: Portio Research Ltd. Aided by a growing num ber of smartphone users, North America had t he l argest r egional user base for mobile applications in 2009, and accounted for 37.7 percent of the worldwide mobile applications user base. Asia Pacific and Europe came next with respective contributions of 29.6 percent and 28.7 percent. The figure below shows the regional share in worldwide user base for mobile applications in 2009.
North A merica has shown an appetite f or m obile apps for both consumer and enterprise segments. Popular consumer segment apps include those from the following categories:
• Mobile commerce • Location-based and location-aware applications • Gaming • Social networking and blogging • Media and entertainment • Lifestyle
30 Note: The percentages do not add up to 100 percent because of rounding off errors.
North America had the largest regional user base for mobile applications in 2009, and accounted for 37.7 percent of the worldwide mobile applications user base.
Figure 72: Worldwide Mobile Applications Users – Regional Contribution (In Percent, 2009)30
Source: Portio Research Ltd.
28.7%
29.6%37.7%
4.1%
Europe Asia Pacific North America Rest World
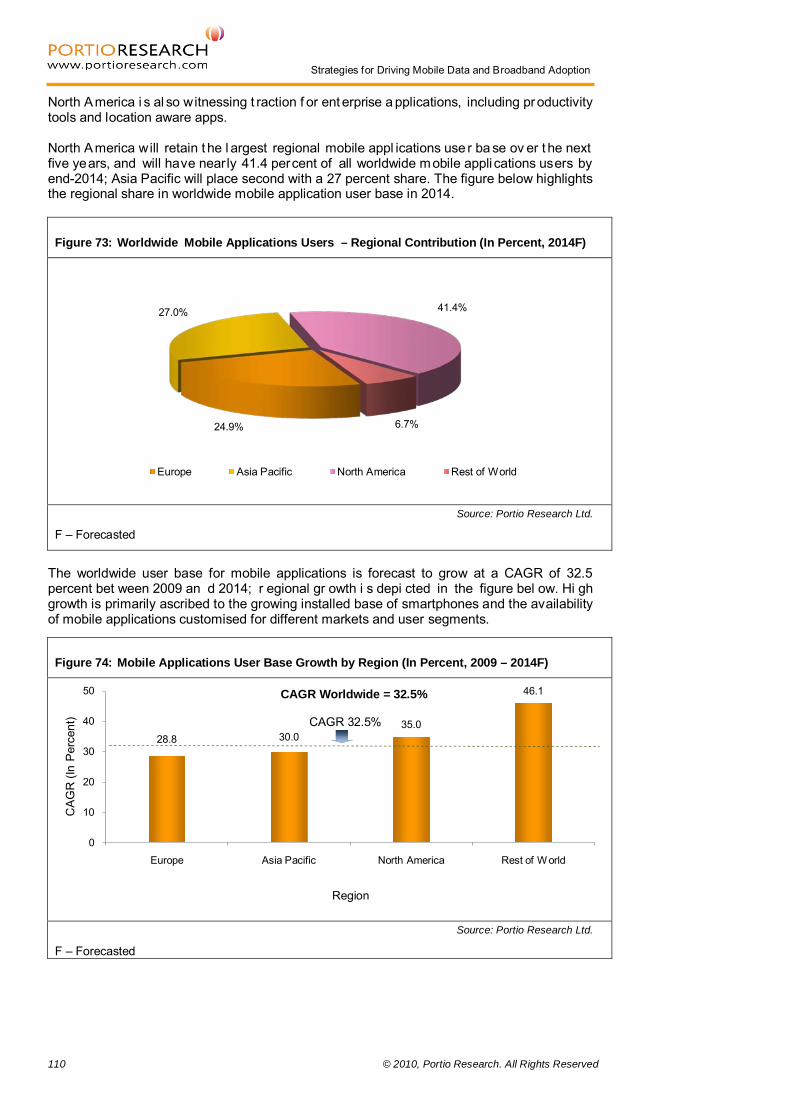
110 © 2010, Portio Research. All Rights Reserved
Strategies for Driving Mobile Data and Broadband Adoption
North America i s al so witnessing t raction f or ent erprise a pplications, including productivity tools and location aware apps. North America will retain t he l argest regional mobile appl ications use r ba se ov er t he next five years, and will have nearly 41.4 percent of all worldwide mobile appli cations users by end-2014; Asia Pacific will place second with a 27 percent share. The figure below highlights the regional share in worldwide mobile application user base in 2014.
The worldwide user base for mobile applications is forecast to grow at a CAGR of 32.5 percent bet ween 2009 an d 2014; r egional gr owth i s depi cted in the figure bel ow. Hi gh growth is primarily ascribed to the growing installed base of smartphones and the availability of mobile applications customised for different markets and user segments.
Figure 73: Worldwide Mobile Applications Users – Regional Contribution (In Percent, 2014F)
Source: Portio Research Ltd.
F – Forecasted
Figure 74: Mobile Applications User Base Growth by Region (In Percent, 2009 – 2014F)
Source: Portio Research Ltd.
F – Forecasted
24.9%
27.0% 41.4%
6.7%
Europe Asia Pacific North America Rest of World
28.8 30.035.0
46.1
0
10
20
30
40
50
Europe Asia Pacific North America Rest of W orld
CA
GR
(In
Per
cent
)
Region
CAGR Worldwide = 32.5%
CAGR 32.5%

© 2010, Portio Research. All Rights Reserved 111
Strategies for Driving Mobile Data and Broadband Adoption Mobile Applications Revenue Mobile applications are serving as differentiators, and they act as one of the deciding factors when a subscriber is choosing which smartphone vendor and MNO to buy products and services from. They are al so used by brands to tap into the burgeoning mobile broadband market. Mobile appli cations al so enco urage t he upt ake of o fferings – including l ocation-based services, online gaming, social networking, media and entertainment services – which boosts mobile broadband use. Therefore, generating revenues through mobile applications’ sales i s only one of the benef its MNOs and smartphone vendors are looking to ex tract by being involved in the mobile application value chain. Mobile applications revenue totalled nearly USD 1.6 billion in 2009, and is forecast to grow at a CAGR of 38.8 percent between 2009 and 2014, to reach USD 8.1 billion by end-2014.
Figure 75: Mobile Applications Revenue – Worldwide (In USD Billion, 2009 – 2014F)
Source: Portio Research Ltd.
F – Forecasted
The table below highlights the growth of regional mobile applications revenues from 2009 to 2014.
Table 20: Mobile Applications Revenue – Regional (In USD Million, 2009 – 2014F)
Region Mobile Applications Revenue (In USD Million)
2009 2010F 2011F 2012F 2013F 2014F
Europe 464.0 680.4 929.8 1,243.1 1,609.0 2,077.0
Asia Pacific 436.8 604.4 805.4 1,059.2 1,369.1 1,952.4
North America 631.6 1,162.7 1,785.4 2,329.0 2,938.2 3,553.2
Rest of World 40.4 36.1 139.5 334.8 491.4 526.0
Total 1,572.8 2,483.6 3,660.1 4,966.1 6,407.7 8,108.6
Source: Portio Research Ltd.
1.62.5
3.7
5.0
6.4
8.1
0
2
4
6
8
10
2009 2010F 2011F 2012F 2013F 2014F
Mob
ile A
pplic
atio
ns R
even
ue(In
USD
BIll
ion)
Year
Mobile applications revenue totalled nearly USD 1.6 billion in 2009, and is forecast to grow at a CAGR of 38.8 percent between 2009 and 2014, to reach USD 8.1 billion by end-2014.

112 © 2010, Portio Research. All Rights Reserved
Strategies for Driving Mobile Data and Broadband Adoption
North America had the highest regional mobile applications revenue in 2009 and accounted for 40.2 percent of worldwide mobile appli cations revenue. I t was f ollowed by Europe with 29.5 percent and Asia Pacific with 27.8 percent. These 2009 regional revenue contributions are shown below.
North America is expected to witness a steep increase in per user downloads of mobile apps between 2009 and 2014, and t herefore this region will also continue dominating the mobile apps m arket i n 2014 in r evenue t erms—with an e xpected 43. 8 per cent c ontribution t o worldwide mobile applications revenue. Europe’s contribution is projected to be nearly 25.6 percent by end-2014, cl osely followed by Asia P acific’s 24. 1 per cent. The figure bel ow highlights the regional share in worldwide mobile applications revenue in 2014.
31 Note: The percentages do not add up to 100 percent because of rounding off errors.
Figure 76: Worldwide Mobile Applications Revenue – Regional Contribution (In Percent, 2009)31
Source: Portio Research Ltd.
North America is expected to witness a steep increase in per user downloads of mobile apps between 2009 and 2014.
Figure 77: Worldwide Mobile Applications Revenue – Regional Contribution (In Percent, 2014F)
Source: Portio Research Ltd.
F – Forecasted
29.5%
27.8%
40.2%
2.6%
Europe Asia Pacific North America Rest World
25.6%
24.1%43.8%
6.5%
Europe Asia Pacific North America Rest of World

© 2010, Portio Research. All Rights Reserved 113
Strategies for Driving Mobile Data and Broadband Adoption Worldwide mobile app lications r evenue i s forecast t o gr ow at a CA GR of 3 8.8 percent between 2009 and 2014. The CAGR growth for revenue generated through mobile applications i n dif ferent r egions i s depi cted i n the figure bel ow. T he r evenue gr owth i s expected to be dr iven by t he growing availability of mobile applications with MNOs (either through oper ator-owned stores or i n co llaboration w ith t hird par ty application pr oviders). Revenue is also expected to be boosted by an increase in advertisement funded applications, which should encourage the uptake of mobile apps in price sensitive markets.
Worldwide mobile applications revenue is forecast to grow at a CAGR of 38.8 percent between 2009 and 2014.
Figure 78: Mobile Applications Revenue Growth by Region (In Percent, 2009 – 2014F)
Source: Portio Research Ltd.
F – Forecasted
35.0 34.941.3
67.1
0
10
20
30
40
50
60
70
80
Europe Asia Pacific North America Rest of W orld
CA
GR
(In
Per
cent
)
Region
CAGR Worldwide = 38.8%
CAGR 38.8%

114 © 2010, Portio Research. All Rights Reserved
Strategies for Driving Mobile Data and Broadband Adoption
Chapter 10 Mobile Applications – Strategy Case Studies

© 2010, Portio Research. All Rights Reserved 115
Strategies for Driving Mobile Data and Broadband Adoption
Mobile Applications – Strategy Case Studies Apple App Store
Apple l aunched its mobile appli cation s torefront ‘A pp S tore’ i n July 2008, and i t i s now available i n 90 co untries with ov er 185, 000 app s av ailable for download. Applications are listed under 20 dif ferent ca tegories i ncluding games, business, ne ws, sp orts, health and travel. The A pp S tore beca me an i nstant su ccess with i Pod and i Phone u sers, with 10 m illion applications do wnloaded within t hree days of its launch; with a wide r ange of apps f or advanced de vices, along with i ntegrated bil ling, t he s tore i s v ery attractive t o us ers. Furthermore, Apple changed t he gam e for de velopers w ith ef fective br anding, a simple distribution platform and incentivised revenue share. The following figure shows the App Store’s performance since its launch in July 2008.
Figure 79: Apple’s App Store – Total Application Downloads
Source: Apple, Portio Research Ltd.
10 100
2,000
3,000
4,000
0
1,000
2,000
3,000
4,000
5,000
Jul-08 Sep-08 Sep-09 Jan-10 Apr-10
Dow
nloa
ds (i
n M
illion
)
Period
Highlights
• Number of Applications: 185,000+ (April 2010) • Free and Paid Applications: 25% Free, 75% Paid (February 2010) • Average Price for Paid Applications in the US: USD 3.62 (December 2009)
User Base
• Over 85 million iPhone and iPod Touch users; 50 million iPhones sold (April 2010)
Downloads
• 4 billion downloads registered (April 2010)
Developers
• Number of Developers: 125,000 (November 2009) • Developer Submission Fees: USD 99/year

116 © 2010, Portio Research. All Rights Reserved
Strategies for Driving Mobile Data and Broadband Adoption
Business Model Apple’s App Store pioneered the App-centric model offering a transparent marketplace f or developers, while bypassing operators from the value chain. Apple has a direct relationship with developers and App Store users. Consequently, all revenue generated from the sale of mobile applications is shared between Apple (70 percent) and the developers (30 percent). Key Developments
• In September 2009, the Apple App Store reached a milestone of 2 billion downloads, followed by 3 billion downloads as of January 2010, and 4 billion downloads as of April 2010.
• In F ebruary 2010, 24 m obile oper ators anno unced t heir plans t o l aunch an open applications platform to compete with the Apple App Store. This initiative is also being supported by the GSMA and three handset vendors (LG, Samsung and Sony Ericsson). In total, the group is expected to reach 3 billion subscribers worldwide.
• In the first 24 hours of the launch of iPad in the US, Apple’s App Store sold 1 million iPad apps, with a total of 3.5 million iPad apps downloaded as of 8 April 2010. The App Store offers nearly 3,500 iPad applications.
The following f igure depi cts break-out of Apple A pp S tore’s av ailable applications by categories. Books, Games, Entertainment, Education and Utilities are the top five application categories with hi gher num ber o f appli cations a vailable. T ravel, lif estyle, music, s ports, business, navigation and other applications are included in the ‘Others’ category.
In the first 24 hours of the launch of iPad, Apple’s App Store sold 1 million iPad apps, with a total of 3.5 million iPad apps downloaded as of 8 April 2010.
Figure 80: Break-out of Available Applications by Category – Apple App Store (In Percent, April 2010)
Source: 148Apps, Portio Research Ltd.
18.0%
15.3%
11.9%
7.4% 6.0%
41.4%
Books Games Entertainment Education Utilities Others
Apple has reported that their net revenues from music-related products and services have increased, due to increased sales of third-party digital content and applications. “This growth in revenues is attributed to high consumer interest in third-party digital content and applications, wider iPod and iPhone customer base and overall growth of the App store.” – Apple
© 2010, Portio Research. All Rights Reserved 117
Strategies for Driving Mobile Data and Broadband Adoption Vodafone 360
Vodafone 360 is a new Internet service launched by Vodafone in September 2009. It offers an integrated mobile Internet experience with phone, e-mail and social networking combined together, and a wide range of applications – including music, games and m ap services – through a single platform. Vodafone has r eplaced i ts m obile co ntent por tal V odafone liv e! w ith it s V odafone 360 Internet services. T he Vodafone 360 ex perience i ncludes a 3D u ser i nterface, co nnected address book, m usic, phot os, maps and the Vodafone app s tore. The addr ess book connects contacts from mobile, e-mail, instant messenger and social networks. The service offers easy access to a wide variety of content and applications to suit the needs of different users. It includes infotainment content, such as news, sports, health, finance, fashion, travel, movies and gam es, as well as useful appli cations su ch as a translator, co nverters and navigation maps.
Vodafone 360 contained 1,000 applications when the service launched, and the application portfolio has grown steadily to over 7, 000 appl ications a s of F ebruary 2010. T here ar e 90,000 active users of Vodafone 360 service, with over a million apps downloaded. Features The following are the salient features of the service:
• Connected Address Book: Vodafone 360 of fers an i ntegrated address book that collects co ntacts f rom phone, s ocial net works, e-mail and ch at acco unts. Additionally, the address book allows users to get status updates, share content and get r eal t ime updat es on t heir f riends’ whereabouts. It also provides t he opt ion of arranging contacts in to different groups to enjoy selective communication.
• Communicate: Vodafone 360 allows users to communicate through calls, SMS, e-mail and ch at, using single address book. I t avoids the need f or checking dif ferent websites, as i t provides a single view of al l social networks making i t all the more convenient for subscribers.
• Maps and Places: Vodafone 360 provides an effective navigation facility with turn-by-turn maps and voice guidance. It allows users to update and share their locations in real time, along with the address and map link.
• Photos: Vodafone 360 allows users to save their photos in their gallery so that they have a back up of their photos. Users can tag photos and share complete albums with other users or groups on 360 or other social networks.
• Apps and Games Shop: Vodafone 360 o ffers a w ide range of Apps, gam es and music t o u sers for download ont o t heir mobile hand sets. S ubscribers c an cr eate their own profiles, which al low them to get personalised content recommendations from the service provider. In addition, subscribers can read content reviews given by other users to assist their content buying decisions.
Vodafone 360 contained 1,000 applications when the service launched, and the application portfolio has grown steadily to over 7,000 applications as of February 2010.
The service is currently available on LiMo, S60 and Android, with nearly two million devices that can run 360 apps. (March 2010)
–Vodafone
Highlights (September 2009)
• Catalogue of over 1,000 applications available at launch, downloadable through the Vodafone Shop
• Access to the service through a variety of handsets and operating systems; select services also available for non-Vodafone customers
• Launch of a new range of Samsung Vodafone 360 handsets, designed exclusively for enhanced customer experience
• Available in Germany, Greece, Ireland, Italy, Netherlands, Portugal, Spain and the UK

118 © 2010, Portio Research. All Rights Reserved
Strategies for Driving Mobile Data and Broadband Adoption
• My Web: Vodafone 360 makes web br owsing a pl easant and easy experience f or users, with options to create shortcuts to favourite websites and to add different widgets and applications to a phone’s homepage.
• Music Shop: Vodafone 360 has a collection of over one million songs. Subscribers can sample and buy single tracks or complete albums and dow nload these di rectly to t heir mobile hands ets. It also offers a service that allows u sers t o acce ss unlimited music content.
• Privacy Management: Vodafone 360 allows users to manage their privacy settings. Users can edit settings to allow or block a person from accessing their information, and are also able to update their online status – as “available” or” invisible”.
Popular Handsets Vodafone has partnered with major mobile handset manufacturers to offer its Vodafone 360 services, and has i ntroduced t wo ex clusive V odafone 360 hand sets i n par tnership with Samsung. The tables below highlight the features of these two exclusive handsets.
360 Samsung M1 Features
3.2" TFT touchscreen
1 GB expandable internal memory (MicroSD card)
Bluetooth 2.0 / HSDPA
3 Megapixel camera with 8x digital zoom
360 Samsung H1 Features
3.5" OLED touchscreen
16 GB internal memory
Wi-Fi / HSDPA / Bluetooth 2.0
5 Megapixel autofocus camera with flash
© 2010, Portio Research. All Rights Reserved 119
Strategies for Driving Mobile Data and Broadband Adoption Business Model Vodafone 360 is primarily based on the operator-centric model, with the company acting as the primary channel between developers and users. Vodafone has a direct relationship with its de velopers and the services ar e of fered t hrough t he V odafone pr oprietary platform. Vodafone directly receives all the revenue from the service and downloads, which in turn is shared with t he developers i n a 70:30 split in favour of the developers. Furthermore, the Vodafone 360 service includes integrated billing, which makes it convenient for users as all downloads made by them are charged directly to their monthly mobile bill. The s ervice o ffers de velopers access to V odafone’s large customer bas e across al l t he markets where it is launched. Additionally, it includes a direct billing platform. Vodafone also provides developers and partners with controlled access to other network capabilities, such as location awareness, to be able to create innovative and relevant Internet services. Key Developments
• In April 2008, Chi na Mobile, SoftBank and Vodafone announced a n agreement t o establish a Jo int I nnovation Lab (JIL) t o develop mobile Internet services. I n Ju ly 2009, Verizon Wireless al so j oined t he group, and t he f our companies deci ded t o develop mobile services for their worldwide customer base of 1.1 billion.
• In F ebruary 2010, Vodafone made it s Vodafone 360 s ervices available t o Android users. I t w as al ready offering these s ervices t o S ymbian us ers, and with t his announcement is expected to increase its Vodafone 360 user base substantially.
• In February 2010, Vodafone announced that i t had sold about 300,000 units of the two exclusive Vodafone 360 handsets—360 Samsung H1 and 360 Samsung M1
• In M arch 2010, WIN plc, an interactive information and m obile ent ertainment applications provider, announced that it will develop various applications, including Pocket Doctor, Lottery and Snow & Ski, for the Vodafone 360 platform
• In April 2010, Vodafone opened its 360 apps store for developers to publish its paid apps via the Joint Innovation Lab initiative
• Vodafone has announced an App Star competition and invited application developers to develop innovative apps for the Vodafone 360 service. Entries are invited from ei ght countries—the UK , Germany, Greece, I reland, Italy, the Netherlands, Portugal and Spain—with a total of EUR 1 million in prizes.
Vodafone directly receives all the revenue from the service and downloads, which in turn is shared with the developers in a 70:30 split in favour of the developers.

120 © 2010, Portio Research. All Rights Reserved
Strategies for Driving Mobile Data and Broadband Adoption
GetJar
GetJar is an i ndependent mobile app s tore. The Li thuania-based company was founded in December 2004, and has offices in California and London. The co mpany originally started as a bet a t esting web site f or mobile de velopers t o t est applications on various handsets and r eceive feedback. Over the ye ars, developers have started to use the site to distribute their applications. GetJar is a network agnostic service that is available through various handsets across major platforms, including Ja va M E, B lackBerry, S ymbian, Windows M obile and A ndroid. T he company has partnered with application developers and allows them to upload their apps on the developer portal f or f ree. GetJar is distributing content to consumers in over 200 countries, and received the 2009 Meffy Award for Best Direct to Consumer Service. Business Model GetJar is offering a majority of the applications f or free, so the store’s revenue i s currently being generated by selling spots on the web store f or the placement of appl ications – the ‘App Placement’ model. App de velopers bi d t o get better pl acement i n t he s torefront t o showcase t heir appl ications, and GetJar is pai d t he bid pr ice each time an application i s downloaded; if there are no dow nloads on t he appl ication, the company does not earn any revenue on it. This benefits developers, since they can launch their applications to GetJar’s large customer base f or free. Furthermore, developers of fer demo or free t rial versions of applications on GetJar, while they launch the premium-paid versions on other storefronts/portals. In F ebruary 2009, G etJar also introduced t he ‘A ds Program’—which pr ovides addi tional revenue s treams—for de velopers. Under t his scheme, G etJar’s ad o ptimisation s ystem introduces co ntextual i n-app t ext and banner ads in t he appl ication, and developers then earn revenues if users click on those ads while using the apps. The co mpany has s tarted t o of fer pai d app lications and i s t esting dif ferent pay ment solutions. It plans to gradually roll out more paid applications in the current year. Additional Services In O ctober 2009, G etJar i ntroduced ‘A pp Do wnload P age’—a new service for mobile developers. It takes users to a mobile webpage that helps to detect their handset model and directs t hem t o t he appl ications available for t hat par ticular handset on G etJar. F acebook and P hotobucket w ere t he f irst few co mpanies t o t est and r oll out their appli cations on GetJar using the App Download Page. GetJar posted a link on the Facebook mobile website prompting users to cl ick and download the Facebook Mobile application. Furthermore, this ‘App Download Page’ enhances the user experience by offering them options for searching and downloading applications.
GetJar has started to offer paid applications and is testing different payment solutions.
Highlights (April 2010)
• Over 68,400 games and other application files available for download • Nearly 314,000 developer accounts registered • Nearly 2,076 devices supported • 59,962 beta-testers registered
Downloads
• Over 15 million users a month, serving 55 million downloads per month on average (April 2010)
• 750 million downloads registered as of February 2010

© 2010, Portio Research. All Rights Reserved 121
Strategies for Driving Mobile Data and Broadband Adoption
Key Partnerships Major operators are partnering with GetJar to offer cross-platform applications to their subscribers, r ather t han managing pr oprietary s torefronts t hemselves. GetJar pr ovides a series of branded solutions and also white label solutions via its app catalog express (ACE) service. Sprint in the US has partnered with GetJar, providing its subscribers with access to GetJar’s applications. Under this agreement, Sprint has placed a link on its mobile portal that connects u sers t o t he G etJar s ite t o br owse t he ap p l ibrary and do wnload ap plications. GetJar is now available to all Sprint customers with feature phones, as well as smartphones running on BlackBerry and Windows Mobile. GetJar offers an easy to launch application storefront to mobile operators without them worrying about the back-end infrastructure, etc. Furthermore, Sprint and G etJar are not paying anything to each other f or this par tnership. Other oper ators i ncluding Roger s Wireless ( Canada), 3 ( UK) and Virgin Mobile (France) have signed similar agreements with GetJar. Sony Ericsson has partnered with GetJar to link GetJar’s por tfolio of free appli cations with Sony Ericsson’s PlayNow arena app store. Whereas the Carphone Warehouse (UK) is using GetJar’s white l abel service ACE for it s ne w cu stomer por tal. ACE will hel p the company launch a mobile app store by sourcing the applications from GetJar. In April 2010, GetJar and Reliance Communications, India’s second largest MNO, signed an agreement to provide mobile application services to Reliance’s subscribers. Subscribers can access t hese ap plications t hrough R -World, Reliance's v alue-added s ervices pl atform. These apps will include games, social networking, sports, entertainment and productivity applications, and can be availed through a wide range of handsets including feature phones and smartphones.32
Downloads
eBuddy, O pera M ini, N imbuzz, mig33 and F acebook Mobile ar e t he most s uccessful applications on G etJar. T hese five applications have been very popular; acco unting for nearly 10 per cent o f total dow nloads on G etJar for s everal months i n 2009. The t able overleaf provides the top 20 applications on GetJar and the total downloads as of November 2009.
32 Source: http://telecomyatra.afaqs.com/news/?sid=805_RCom+inks+deal+with+global+app+store+GetJar
Major operators are partnering with GetJar to offer cross-platform applications to their subscribers, rather than managing proprietary storefronts themselves.
"With the GetJar store, consumers do not have to worry about what device they are using and which OS – We take the fragmentation out of the equation by auto-detecting what apps can run on which phones and offering consumers those applications."
–GetJar

122 © 2010, Portio Research. All Rights Reserved
Strategies for Driving Mobile Data and Broadband Adoption
Table 21: Top 20 Applications on GetJar and Total Downloads, as of November 200933
Ranking Application Total Downloads (as of November 2009)
1. Facebook Mobile 27,538,238 2. eBuddy 34,332,347 3. Opera Mini 30,084,550 4. mig33 26,964,199 5. Nimbuzz 24,552,801 6. Google 4,404,400 7. Qeep 8,627,926 8. Change Ringtone 1,699,917 9. Rocketalk 2,362,095
10. TicTacToe Game 2,643,234 11. eBuddy Lite Messenger 2,014,420 12. Google Maps (featuring Latitude) 8,816,316 13. KD Player 2,217,069 14. Snaptu 2,671,648 15. Yahoo Mobile! 2,272,326 16. iRadio 309,000 17. Evan-mp3-Player 1,781,231 18. Mobile Tribe in English 1,907,893 19. Kamus Lengkap 2,723,411 20. Majiplayer Music Player 4,038,835
Source: Distimo Report
33 Note: The ranking given is only for the month of November 2009 and is not based on the cumulative total of application downloads.

© 2010, Portio Research. All Rights Reserved 123
Strategies for Driving Mobile Data and Broadband Adoption Conclusion
The market for mobile applications is far from reaching its peak, and represents a growing market with tremendous oppor tunity in the coming years. Since voice is saturating in most markets worldwide, data services are the pr imary growth opportunity for operators. Mobile messaging, mobile entertainment services, mobile social networking and mobile applications are key drivers of growth of data revenues, while there is also an immense demand for productivity enhancement tools, navigation tools and ot her appl ications. Market players are building the ecosystem to provide mobile applications and content services to fulfil consumers’ communication and entertainment needs. One of t he primary factors that w ill boos t t he gr owth of dat a s ervices i s t echnology infrastructure for improved mobile experiences. Mobile operators worldwide are investing heavily in network infrastructure and new technologies, to enable high-speed data services. According to the GSMA, mobile operators in 2010 will invest nearly USD 72 billion in mobile broadband t echnologies.34
App Stores
Operators are rapidly deploying HSPA net works t o of fer hi gher data transfer rates and better user experiences. Furthermore, in the US, Europe and Japan, operators ar e t esting 4G LT E r ollouts t o be abl e t o offer ad vanced services i n t he near future. Additionally, the availability of attractive data tariffs is boosting the adoption of mobile broadband services. For example, flat-rate data plans are quite effective since these are transparent and s imple enough f or us ers t o under stand. A ll these f actors co mbined ar e driving mobile data use. With improved high speed network technologies and increased customer expectations, the demand f or m obile applications has skyrocketed, and is growing further. The rapid expansion o f t he s martphone m arket i s also providing t he m uch-needed im petus t o t he mobile applications market; smartphones provide seamless PC-like Internet experiences for value-added and Internet-based services and applications, and are thus driving data traffic. However, the mobile application market is facing challenges, as there is large diversity in the market w ith thousands of d ifferent de vices and O S, hundr eds of app ca tegories and a plethora of big and small players in the space. This makes the market extremely fragmented.
Apple has spurred the growth of the mobile applications market by completely changing the game for de velopers. T he hi gh r evenue s hare, along w ith A pple’s strong m arketing and distribution, has hel ped d evelopers quickly reach out t o co nsumers. M oreover, Apple’s unified platform offers consistent application development, and the integrated billing system has made Apple the industry benchmark in the mobile apps business. The success of Apple’s App Store has prompted others to follow. Mobile operators, handset and OS vendors, and independent companies are among those racing to jump on the app store band wagon. Nev ertheless, dif ferent p layers ha ve dif ferent obj ectives t o t arget consumers. Apple’s primary objective is to sell more devices, and so its main strategy is to offer attractive services and applications over advanced devices. Additionally, Apple i s offering an enhance d m obile ex perience with the App S tore di rectly accessible t hrough a device’s home screen and pai d downloads l inked to the iTunes accounts. This comfortable familiarity with - and dependence upon - device features and services is expected to create additional future demand for Apple devices. On the other hand, mobile operators have a very different approach. Mobile billing is one of the primary sources of revenue for the operators in the mobile applications value chain, as well as earning revenues through data access. Operators are launching their own application stores, or are partnering with independent stores and white-label services to offer mobile apps to their subscribers. For example, Sprint has partnered with GetJar to offer GetJar’s thousands of appl ications to Sprint subscribers
34 Source: http://www.gsmworld.com/newsroom/press-releases/2010/4621.htm
According to the GSMA, mobile operators in 2010 will invest nearly USD 72 billion in mobile broadband technologies.
Apple is offering an enhanced mobile experience with the App Store directly accessible through a device’s home screen and paid downloads linked to the iTunes accounts.

124 © 2010, Portio Research. All Rights Reserved
Strategies for Driving Mobile Data and Broadband Adoption
for free. Such an appr oach helps operators to increase their data services revenues, since subscribers are motivated to download free applications and this download process generates data t raffic for t he oper ators. T he dem and f or pai d appl ications i s al so hi gh, particularly for games and productivity enhancement apps. Also, applications such as social networking, instant messaging (IM), navigation and music players/radio have high demand, and these are primarily network-connected applications, which in turn increase data usage. These users stay connected to the network in order to use these applications and they also consume more data.

© 2010, Portio Research. All Rights Reserved 125
Strategies for Driving Mobile Data and Broadband Adoption The table below highlights the key factors facilitating an app store’s success.
Table 22: Key Success Factors for Application Stores
Factor Strategy
Ease of Use (Application Discovery, Downloads and
Payment)
• Convenience – Accessibility through device’s home screen;
categorisation and labelling of different applications with easy-to-locate options; quick downloads over high speed networks
• Billing – Integrated billing systems, such as App Store iTunes account, or operator billing are more convenient than payments via credit cards
Appeal to Developer Community
• Transparent Process – A simple and inexpensive process to
publish content will encourage more developers; integrated billing and effective marketing will free developers to focus on the applications only.
• Developer Incentive – Monetizing applications with reasonable revenue sharing and other incentives will encourage developers to join the developer community. Also, application development on a consistent platform with a large customer base will offer critical mass to the developers. For example, Apple’s App Store includes 85 million iPhone and iPod users and apps are developed for just Apple OS.
Attractive Pricing
• Free Versions – Developers should launch two versions–a
free t rial ve rsion and a full premium ve rsion–of t he same application. In this way, the trial version with limited features and co ntent a llows users to t ry t he app, and, if interested, to come back for a purchase.
• New Business Models – Subsidized co ntent, ad -funded application downloads, i n-app payments, etc. have a higher uptake
Key Partnerships
Strategic partnerships are integral for the success of application stores, and the following key partnerships are essential: • Platform – Operator application stores, such as Vodafone’s,
need to partner with software vendors to launch their application platforms. These application platforms will provide the SDK to the developers to create exciting apps. For example, Aircel in India has partnered with Infosys to launch Infosys’ proprietary platform – Flypp.
• Services – Operators are also partnering with independent white-label stores to offer applications to their subscribers. For example, Sprint has partnered with GetJar to offer free apps to its customers.
• Billing – Many independent players are partnering with mobile operators, to enable operator billing solutions for their subscribers - since operator billing is more convenient for users. For example, Nokia is partnering with operators for its Ovi Store.
Source: Portio Research Ltd.

126 © 2010, Portio Research. All Rights Reserved
Strategies for Driving Mobile Data and Broadband Adoption
Chapter 11 Conclusion

© 2010, Portio Research. All Rights Reserved 127
Strategies for Driving Mobile Data and Broadband Adoption
Conclusion Current Scenario
Mobile broadband services—which were until recently looked upon as a luxury for subscribers in advanced mobile markets—have started to spread their presence in to almost every wireless m arket w orldwide. M NOs w orldwide, i ncluding those i n t he de veloping markets of Africa and Middle East and Latin America, are planning to roll out and expand the coverage o f ad vanced net works to a much wider s cale t han cu rrent levels. T he pr imary reason behi nd t hese d eployments i s t he ant icipated gr owth and uptake of m obile dat a services, of which mobile broadband forms a substantial part. Looking at how the industry has evolved over the last two or three years, it seems as though the reality of “ the mobile I nternet” i s f inally delivering on i ts promise. T he i ndustry started trying to promote the mobile Internet to consumers as WAP was rolling out in 1999 and 2000, but in truth accessing and downloading web content over mobile devices was a pretty poor co nsumer e xperience back t hen. As t hat e xperience has f allen far s hort o f the consumer web experience over a fixed li ne desktop PC, so the mobile i ndustry has had a hard time gaining traction in the mass market Finally, thanks to the boom in high-end feature phones and smartphones over recent years, and the increases in network speed and capacity, mobile Internet is becoming an expected norm in m any markets. I nnovations i n hand set de sign – such a s larger and b etter qual ity screens, touch co ntrol, accelerometer, m ore co mplex graphics support, and f aster processing – have dr amatically im proved t he quali ty of t he end -user ex perience. A t t he same t ime, networks have been r amping up sp eed, coverage and ca pacity in recent years and no w r eliable 3G is t he nor m i n many markets, with s peeds i mproving a ll the t ime. Finally, the mobile Internet is a r eality, co mparable i n e xperience t o t he fixed des ktop environment, smaller in display, but winning for convenience and anytime-anyplace access. Currently, t he percentage of mobile br oadband us ers within the t otal w orldwide mobile subscriber base is a single digit number; however, with expected rapid growth in the uptake of these services, this percentage is forecast to grow to nearly 28 percent by end-2014.
The primary reason behind advanced mobile network deployments is the anticipated growth and uptake of mobile data services, of which mobile broadband forms a substantial part.

128 © 2010, Portio Research. All Rights Reserved
Strategies for Driving Mobile Data and Broadband Adoption
The figure below highlights the share of mobile broadband users within the worldwide mobile subscriber base between 2009 and 2014.
MNOs ar e ba nking on services s uch a s M MS, m obile e -mail, mobile I M, m obile video downloads/uploads, social networking, l ocation services and m apping, and m obile banking and paym ents to dr ive t he growth of mobile dat a in the coming years. T o date, SMS has been the most successful mobile dat a service and will continue t o outperform o ther data services i n t erms of penet ration and use for some years t o come. Even by 2014, we still expect SMS to co ntribute appr oximately 41.4 per cent o f t otal MNO non -voice s ervice revenues worldwide. However, in t erms o f gr owth rates, ot her services are set to get the better of SMS as the services grow both in terms of use and popularity. The f igure on t he nex t page compares t he gr owth rates of dif ferent mobile dat a services between 2009 and 2014.
Figure 81: Mobile Broadband User Base as a Percentage of Total Mobile Subscribers – Worldwide (In Percent, 2009 – 2014F)
Source: Portio Research Ltd.
F – Forecasted
In terms of growth rates, other services are set to get the better of SMS as the services grow both in terms of use and popularity.
8.110.3
13.3
16.9
21.7
27.8
0
5
10
15
20
25
30
2009 2010F 2011F 2012F 2013F 2014F
Con
tribu
tion
(In P
erce
nt)
Year
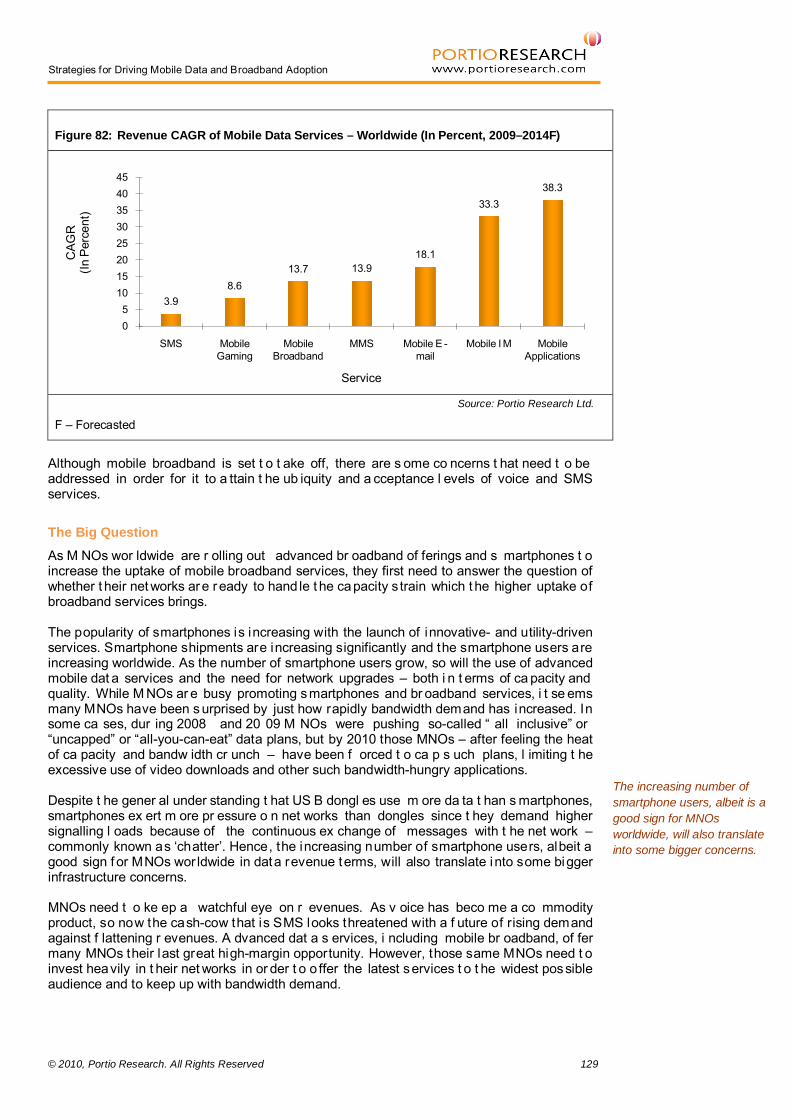
© 2010, Portio Research. All Rights Reserved 129
Strategies for Driving Mobile Data and Broadband Adoption
Figure 82: Revenue CAGR of Mobile Data Services – Worldwide (In Percent, 2009–2014F)
Source: Portio Research Ltd.
F – Forecasted
Although mobile broadband is set t o t ake off, there are s ome co ncerns t hat need t o be addressed in order for it to a ttain t he ub iquity and a cceptance l evels of voice and SMS services. The Big Question
As M NOs wor ldwide are r olling out advanced br oadband of ferings and s martphones t o increase the uptake of mobile broadband services, they first need to answer the question of whether t heir net works are ready to hand le t he capacity s train which t he higher uptake of broadband services brings. The popularity of smartphones is increasing with the launch of innovative- and utility-driven services. Smartphone shipments are increasing significantly and the smartphone users are increasing worldwide. As the number of smartphone users grow, so will the use of advanced mobile dat a services and the need for network upgrades – both i n t erms of ca pacity and quality. While M NOs ar e busy promoting smartphones and br oadband services, i t se ems many MNOs have been s urprised by just how rapidly bandwidth demand has increased. In some ca ses, dur ing 2008 and 20 09 M NOs were pushing so-called “ all inclusive” or “uncapped” or “all-you-can-eat” data plans, but by 2010 those MNOs – after feeling the heat of ca pacity and bandw idth cr unch – have been f orced t o ca p s uch plans, l imiting t he excessive use of video downloads and other such bandwidth-hungry applications. Despite t he gener al under standing t hat US B dongl es use m ore da ta t han s martphones, smartphones ex ert m ore pr essure o n net works than dongles since t hey demand higher signalling l oads because of the continuous ex change of messages with t he net work – commonly known as ‘chatter’. Hence, the increasing number of smartphone users, albeit a good sign f or MNOs wor ldwide in data revenue terms, will also translate into some bigger infrastructure concerns. MNOs need t o ke ep a watchful eye on r evenues. As v oice has beco me a co mmodity product, so now the cash-cow that is SMS looks threatened with a f uture of rising demand against f lattening r evenues. A dvanced dat a s ervices, i ncluding mobile br oadband, of fer many MNOs their last great high-margin opportunity. However, those same MNOs need t o invest heavily in t heir net works in or der t o o ffer the latest services t o t he widest possible audience and to keep up with bandwidth demand.
3.98.6
13.7 13.918.1
33.338.3
05
1015202530354045
SMS Mobile Gaming
Mobile Broadband
MMS Mobile E -mail
Mobile I M Mobile Applications
CAG
R(In
Per
cent
)
Service
The increasing number of smartphone users, albeit is a good sign for MNOs worldwide, will also translate into some bigger concerns.

130 © 2010, Portio Research. All Rights Reserved
Strategies for Driving Mobile Data and Broadband Adoption
Investment in Mobile Broadband Networks The depl oyment o f 3 G net works pr ovided a boos t t o m obile br oadband se rvices as t his enabled higher network speeds. Initially, MNOs were facing problematic delays in recovering their investments in 3G network deployments, as data use did not pick-up significantly, and low network utilisation was a major challenge resulting in high capital expenditure (CAPEX) to revenue ratio (low CAPEX to revenue ratio is an indicator of a high return on investment). However, with the evolution of devices and the increasing need to access data services while on-the-go, mobile broadband adoption has been stimulated. MNOs have m ade e fforts t o t ap t his opportunity by investing in net work coverage and capacity expansion f or mobile broadband capable networks. The CAPEX investments and mobile broadband revenue forecasts in different regions during 2010 are given in the figure below.
Figure 83: Mobile Broadband CAPEX and Revenues by Region (In USD Billion, 2010F)
Source: Portio Research Ltd.
F – Forecasted
Planned CAPEX investments for mobile broadband in Asia Pacific, North America and the Rest of W orld exceed t he e xpected r evenues f rom mobile br oadband. T his may be attributed to costly 3G roll-outs in a num ber of markets in Asia Pacific and Rest of World; while in North America, it might be explained by high investment in research and development o f 4G technologies t o co pe w ith e xpanding ca pacity requirements and on -going trials, and the expected roll-out of LTE. For Europe, mobile broadband revenue is expected to be gr eater than the associated CAPEX for mobile broadband, as the region is reaping the benefits of earlier investments in mobile broadband capable networks. Growing Demand for Data Services With the emergence of smartphones, USB dongles, and a slew of better, customised content and applications, data use per subscriber has increased. The figure overleaf depicts data use for subscribers based on devices used for accessing mobile broadband services.
18.8 16.812.6
2.9
34.1
14.119.1
5.0
0
10
20
30
40
Asia Pacific Europe North America Rest of W orld
Amou
nt(In
USD
Bill
ion)
Region
Mobile Broadband Revenue (2010F) Mobile Broadband C apex ( 2010F)
With the evolution of devices and the increasing need to access data services while on-the-go, mobile broadband adoption has been stimulated.

© 2010, Portio Research. All Rights Reserved 131
Strategies for Driving Mobile Data and Broadband Adoption
The increasing number of smartphone and USB dongle users has resulted in better network utilisation and has justified MNOs’ investments in high-speed networks. This was seen as a positive de velopment for M NOs w orldwide f or e xpanding t heir dat a revenues, an d t hey typically went ahead to push flat-rate data plans to encourage higher use among subscribers. T hese data pl ans al ong with t he a vailability of de vices – such a s i Phone, BlackBerry, Motorola Droid, Nokia N97 and net books – and appl ications – such a s social networking, navigation t ools, onli ne gaming, and phot o and video sharing – have radically increased network capacity requirements, and in most cases caught MNOs off-guard. The popularity of mobile applications has pressured mobile network capacities, as there are several popular applications that require high network speeds for proper functioning. Some of t he appl ications an d t heir hi gh dat a t ransfer r ate r equirements ar e giv en i n t he t able below.
Table 23: Mobile Applications and Data Transfer Rate Requirements
Mobile Applications/Tasks Data Transfer Rate Required (Mbps)
Online Gaming 1-10 Mbps
Enterprise Applications 1-10 Mbps
Mobile TV/Video Streaming 2 Mbps
Responsive Web Browsing More than 1 Mbps
Source: Portio Research Ltd.
Figure 84: Average Monthly Data Use for USB Dongles, Feature Phones and Smartphones – Worldwide (In GB, 2009)
Sources: Nielsen, Validas, Camiant and Portio Research Ltd.
The increasing number of smartphone and USB dongle users has resulted in better network utilisation and has justified MNOs’ investments in high-speed networks.
1.50
0.27
0.05 0.040.0
0.3
0.6
0.9
1.2
1.5
USB Dongles iPhone BlackBerry Feature P hone
MO
nthl
y D
ata
Use
(In
GB
)
Device

132 © 2010, Portio Research. All Rights Reserved
Strategies for Driving Mobile Data and Broadband Adoption
Coping with High Data Use The use of data-centric applications causes diminished network speeds and session drops, particularly at the fringe areas of the network with lower reach and in urban areas with a high concentration of smartphone and USB dongle users. The situation is fraught with the following risks:
• Networks failing to meet user expectations of high data transfer rates and quality of service deterioration
• MNOs losing out on the revenue generation opportunity that has now emerged after years of investment and huge advertising spends
If u sers aren’t provided w ith the high dat a transfer r ates and quality of service they have been promised and are expecting, they may move to other MNOs who do deliver. Therefore, flat-rate pr icing, which once worked i n MNOs’ favours to attract more subscribers f or hi gh data use, is now working against them and is clogging networks. There ha ve been ca ses where a small nu mber o f users, par ticularly iPhone and ot her smartphone users, formed a major chunk of data users through unconstrained data use and degraded the service experience for others. Some of the major ‘victims’ have been A T&T, O2 UK and 3 UK.35
In Dece mber 2009, O 2 UK ap ologised f or poor qu ality of s ervice w hile acce ssing d ata services particularly in London, which has a high density of smartphone users. The increase in data-savvy smartphone users (especially iPhone owners) caused UK data traffic to increase 18-fold in 2009.
At the time when iPhone was launched in the US and the UK, AT&T and O2 UK had exclusive distribution deals with Apple. Owing to high data use by iPhone users, the quality of service reportedly suffered.
36
3 UK , i n Dece mber 2009, ad mitted instances of poor m obile br oadband ex periences in some of its coverage ar eas. T he MNO allowed subscribers t o t erminate t heir co ntracts if dissatisfied with the service quality, and also offered service discounts. 3 UK also suspended dongle sales temporarily in affected areas with poor data speeds.
37
AT&T – A Lesson To Be Learnt
The US-based operator AT&T represents one of the major examples of a network straining under smartphone use. In 2007, AT&T became the exclusive distributor of the iPhone in the US, and this exclusivity helped the operator greatly increase its popularity and brand value – as the country’s subscribers were seemingly ready to shell out anything for this high-profile gadget. iPhone owners soon became the major contributors to AT&T’s data revenue, as they began downloading m usic and videos, and br owsing the Internet o ver their dr eam handset. In addi tion, they were using their handsets f or other purposes, such as checking match scores, getting weather updates and using maps to check for directions. It transpired that t hese iPhone u sers were u sing the majority of t he net work capacity, resulting in less available bandw idth for ot her s martphone us ers, who w ere act ually experiencing poo r network performance. T he situation degenerated f urther as t he number of iPhones being used on t he operator’s network grew. W ith excessive data use by iPhone users, AT&T’s other s ubscribers were f acing pr oblems s uch a s dr opped ca lls, del ayed t ext and voice messages and sluggish download speeds. This in turn resulted in disappointed subscribers who even contemplated changing their service provider. The operator used iPhone to increase the uptake of its data services, but while it proved a means to achieve this goal, it also created new concerns for AT&T; and in a great irony, the motivation behind the iPhone launch actually created the MNO’s biggest problem. AT&T wanted its iPhone users to avail its data services at a larger scale, but never imagined that
35 Source: http://www.infoworld.com/d/mobilize/att-moves-closer-usage-based-fees-data-579 36 Source: http://www.telegraph.co.uk/technology/news/6904792/The-head-of-mobile-phone-operator-O2-has-apologised-to-customers-who-were-unable-to-make-calls-after-the-groups-network-was-swamped-by-people-using-smartphones.html 37 Source: http://www.fiercewireless.com/europe/story/3-admits-patchy-mobile-broadband-coverage-stops-dongle-sales/2009-12-02
If users aren’t provided with the high data transfer rates and quality of service they have been promised and are expecting, they may move to other MNOs who do deliver.

© 2010, Portio Research. All Rights Reserved 133
Strategies for Driving Mobile Data and Broadband Adoption the smartphone would drive the level of use to such heights that it would ultimately become difficult for s ubscribers t o acce ss data se rvices with dece nt net work quality. T oo many iPhone users accessing dat a se rvices simultaneously l ed t o net work congestion, which i n turn r esulted i n poor e xperience – as accessing more da ta s ervices and appl ications became difficult. Soon the operator realised that the excessive iPhone use was actually creating t rouble for other smartphone users and damaging its brand value with poor network performance. The operator neither foresaw such exceptional uptake of data services after the iPhone launch; nor had its networks prepared to deliver at such highly demanding rates. AT&T’s pai nful e xperience is a pr iceless l esson. K eeping i n mind the r ate a t w hich smartphones are being accepted in mobile markets worldwide, any MNO could face such a scenario in the near future without careful forethought. This brings us back to the question of whether or not mobile networks worldwide are realistically ready to deliver on the promises they are making regarding the performance of their advanced mobile broadband offerings.38
38 Note: After facing this network quality degradation, AT&T has initiated work to revamp its network. According to a recent press release, the operator intends to cover over 250 million subscribers under a HSPA+ network by end-2010. The operator has already invested in major areas such as New York, Ohio, Pennsylvania, Iowa etc. that suffered earlier network crunch issues due to excessive mobile data use.
After the “ first false s tart” a decade ago, it would be enormously damaging to t he mobile industry as a whole if we were to yet again over-promise the mobile Internet experience to consumers and yet again under-deliver. It is in the interest of everyone in this business, of every player in the value chain, to ensure we del iver-on-promise to the end us ers. Efficient software, efficient devices and ef ficient networks must all combine to deliver a high quali ty end-user experience. In 2007, the release of the first iPhone helped inspire and lead a new generation of mobile devices and a new generation of mobile consumers. Hundreds of millions of smartphones and high-end f eature phones are now in use worldwide, and net works are f ighting hard to keep pace with bandwidth demand: in 2009, worldwide smartphone shipments stood at 159 million and are expected to grow to over 200 million in 2010. While at end-2009, there were nearly 450 m illion fixed-line br oadband u sers worldwide i n co mparison t o 37 1.7 m illion mobile br oadband us ers, i t i s likely that there w ill soon be m ore peopl e acce ssing t he Internet e very day over a mobile net work than s trictly t hrough fixed li ne net works. T he industry must keep pace with this demand.
In 2007 the release of the first iPhone helped inspire and lead a new generation of mobile devices and a new generation of mobile consumers.
AT&T’s network failing under high data use by smartphones During 2009, near ly 3 percent of smartphone users accounted f or using 40 per cent of the network capacity. High-bandwidth co nsuming activ ities i nclude video and audi o streaming. Several applications on t he i Phone pr ovide nons top I nternet r adio ( and w ere r esponsible f or increasing data use). Ralph de la Vega CEO AT&T Mobility and Consumer Markets (At a UBS Conference in New York, December 2009)

134 © 2010, Portio Research. All Rights Reserved
Strategies for Driving Mobile Data and Broadband Adoption
Possible Answers and the Way Forward
Mobile s ubscribers worldwide ar e m aturing and ar e demanding m ore f rom their service providers, bot h i n t erms of quant ity and quali ty. V oice i s no l onger t he onl y reason subscribers u se their hand sets; d ata ha s already become an inseparable par t of mobile services and data use will only grow bi gger as m ore and m ore l ow-cost s martphones (especially in Asia Pacific) flood the markets, and operators lure subscribers with attractive and low-priced data plans. However, as the use of data services grow, mobile networks worldwide must manage this traffic in a more efficient manner, or they will simply fail to deliver quality services to subscribers – and fail to deliver on the promise of advanced data services. Augmenting Networks The t able below briefly discusses strategies t hat oper ators ca n us e t o ke ep up with the increasing demand for data services.
Table 24: Strategies to Cope with the Increasing Demand Data Services place on Networks
Measure Strategy
Deploying More Cell Sites
Operators can deploy more cell sites to cover larger areas and cater to larger numbers of subscribers. In addition, larger numbers of cells allow operators to reuse the frequency more easily and serve greater subscriber numbers with the limited amount of spectrum available.
Buying New Spectrum
With an increasing mobile subscriber base, services penetrating to remote areas, and a practical limitation on cell site numbers, operators could buy more spectrum in order to cater to the newly acquired subscriber base.
Deploying New Technologies
Operators can deploy new technologies such as LTE and WiMAX that increase network efficiency and allow operators to cover a larger subscriber base with a particular amount of available bandwidth.
Offloading to Other Networks
In order to lessen the burden on their networks, operators can shift some network load to networks such as femtocells and Wi-Fi. These networks are easy to deploy and assist the operator to decrease interference between cell sites.
Upgrading Backhaul and Core Network
In order to meet the increasing demand of subscribers, operators can upgrade their backhaul and core network – as upgrading network capacity alone won’t solve the problem. Operators can replace the traditional T1 cables between core network and cell sites with fibre and microwave radio connections.
Source: Portio Research Ltd.

© 2010, Portio Research. All Rights Reserved 135
Strategies for Driving Mobile Data and Broadband Adoption Getting the Pricing Models Right Pricing is a cr itical par t in stimulating, as well as regulating, the mobile broadband market. Therefore, MNOs have tried to be pr oactive in introducing effective pricing models to boost the upt ake of mobile broadband services, while r efraining from under-pricing t he services and possibly – ultimately – overloading their networks. Flat-rate pr icing h as def initely been i nstrumental in driving t he us er dem and for m obile broadband services. However, simply replicating the flat-rate pricing model for data services isn’t sustainable. A s f ar as voice services are concerned, t here i s an amenable l imit for network use. F or dat a s ervices, if a s ubscriber use s audi o and v ideo s treaming, onli ne gaming and navigation services for long sessions, the network becomes clogged and degrades t he qual ity o f service for ot hers. T his pr oblem needs t o be t ackled through a number of effective action points, including strategies pertaining to the pricing and packaging of mobile broadband services. MNOs and handset vendors are aware of the price sensitivity of subscribers for their mobile broadband offerings and han dsets/smartphones. To keep their of ferings within the comfort zone of users, MNOs and handset vendors are gradually reducing the prices of their services and products. This declining trend is highlighted in the figures below.
Flat-rate pricing has definitely been instrumental in driving the user demand for mobile broadband services.
Figure 85: Average Worldwide Selling Price of Nokia Handsets and Apple’s iPhone (In USD, 2007 – 2009)
Source: Portio Research Ltd.
118 109 88
549
449
335
0
100
200
300
400
500
600
2007 2008 2009
Ave
rage
Sel
ling
Pric
e (In
US
D)
Year
Nokia Handsets Apple iPhone
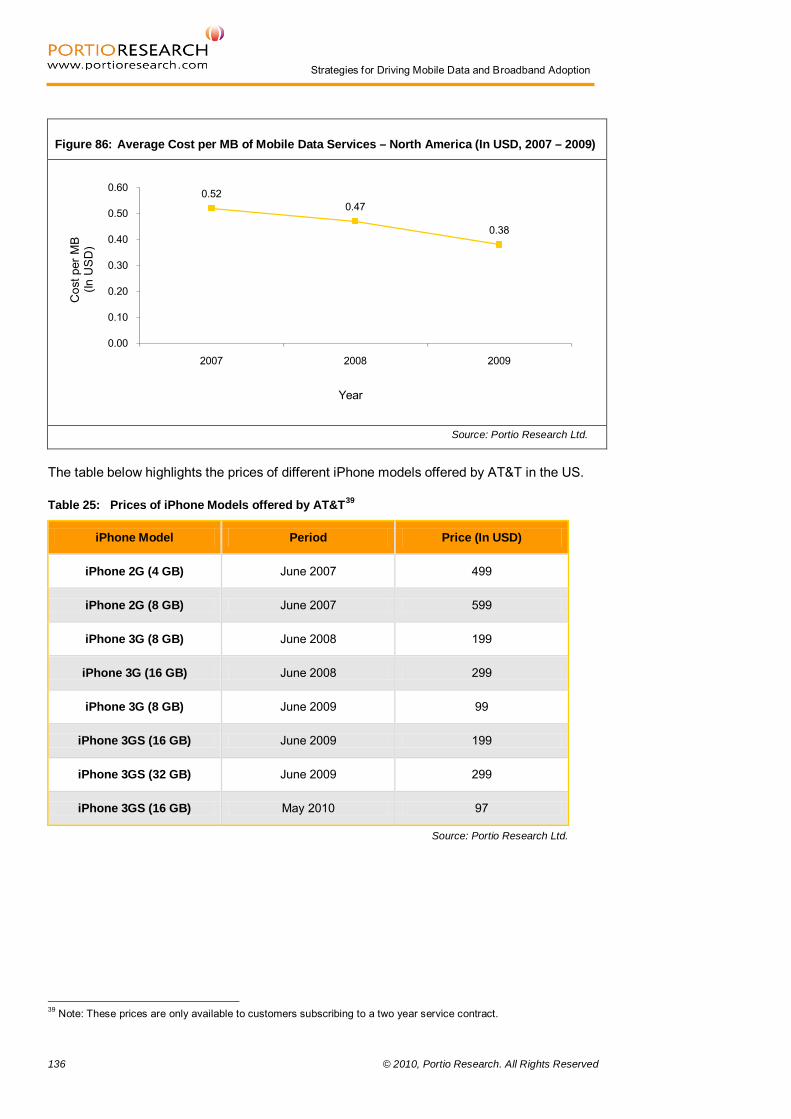
136 © 2010, Portio Research. All Rights Reserved
Strategies for Driving Mobile Data and Broadband Adoption
The table below highlights the prices of different iPhone models offered by AT&T in the US.
Table 25: Prices of iPhone Models offered by AT&T39
iPhone Model Period Price (In USD)
iPhone 2G (4 GB) June 2007 499
iPhone 2G (8 GB) June 2007 599
iPhone 3G (8 GB) June 2008 199
iPhone 3G (16 GB) June 2008 299
iPhone 3G (8 GB) June 2009 99
iPhone 3GS (16 GB) June 2009 199
iPhone 3GS (32 GB) June 2009 299
iPhone 3GS (16 GB) May 2010 97
Source: Portio Research Ltd.
39 Note: These prices are only available to customers subscribing to a two year service contract.
Figure 86: Average Cost per MB of Mobile Data Services – North America (In USD, 2007 – 2009)
Source: Portio Research Ltd.
0.520.47
0.38
0.00
0.10
0.20
0.30
0.40
0.50
0.60
2007 2008 2009
Cos
t per
MB
(In
US
D)
Year

© 2010, Portio Research. All Rights Reserved 137
Strategies for Driving Mobile Data and Broadband Adoption MNOs currently seem set on of fering unrestricted data al lowances to encourage adoption, which will put pressure on the network capacity in the medium to long term. While adhering to quality of service guidelines, MNOs need to regulate the content offered through devices in f lat-rate pr icing, for the sustainable gr owth of mobile broadband services. Furthermore, MNOs need t o segment their offerings t o im prove t heir r eturn on i nvestment and al so off-load some of the traffic by bundling their services with Wi-Fi access through hot-spots. Future Outlook Despite al l t hese ca pacity crunch s ituations par ticularly with M NOs i n t he dev eloped markets, the long-term prospects f or m obile broadband are br ight. For MNOs which have deployed 3G networks and plan to upgrade their networks to 3.5G networks, the incremental cost is low. LTE-deployments are expected to enhance the network capacity and capability for MNOs. Femtocells are expected to boost signal strength and the quality of service at indoor locations, and are useful in offloading the backhaul to wireline broadband connections. Wi-Fi hotspots – both in publ ic places and i n private homes - are proving successful in diverting some of the data traffic over to w ireline net works, an d have been particularly effective in coping with high data consumption by netbook users. While MNOs deal with al l these i ssues, they must al so continue to keep a watchful guard that they are not turned in to the dreaded “dumb pipes” they have feared for some years. As most MNOs are painfully aware, it seems almost everyone wants to sell mobile products and services now – software companies, handset vendors, PC manufacturers, content owners and many more besides. Gone are the days when mobile devices only handled voice, and MNOs only sold v oice, and t he relationship was v ery clear for all to understand. Now that mobile subscribers have t he unlim ited wonders of the open I nternet i n the palm s of t heir hands, MNOs must fight to retain a meaningful relationship with each and every end user. This r eport is t he fourth r eport in a s eries ex ploring t he e volution o f non -voice m obile services and how MNOs effectively deliver those services to mobile consumers. As we have examined go-to-market strategies for non-voice services over the last six years, we see time and again the same key points that help MNOs to differentiate their services and retain valuable customers. Focus must remain on quality of service; innovation; desirable branded content; useful messaging bundles that meet consumer needs; transparent, fair, accessible pricing; market s egmentation; br oad r ange of ch oice of fering flexibility to en d us ers; desirable hand sets; ut ility and value-for-money. In s hort, o ffer peopl e s imple and us eful things they need, desirable things they want, prices they can afford and net works that can deliver.
Offer people simple and useful things they need, desirable things they want, prices they can afford and networks that can deliver.

138 © 2010, Portio Research. All Rights Reserved
Strategies for Driving Mobile Data and Broadband Adoption
Chapter 12 Appendices

© 2010, Portio Research. All Rights Reserved 139
Strategies for Driving Mobile Data and Broadband Adoption
Appendices This market study has been written in a way that avoids excessive use of market acronyms (except where appr opriate) and industry technical t alk, as we hav e tried t o keep t he t ext open t o al l r eaders, not just t hose with i n-depth knowledge of t he world’s mobile markets. Because t his study covers all geographical r egions and m any emerging markets, a gr eat deal of the data contained within this study will potentially be of interest to investors, financial ana lysts, co nsultants, venture ca pitalists and ot hers al l around the world who do not work within the mobile industry itself every day of their lives. To many of these people, some of the industry technical talk and acronyms may be confusing, so we have attempted to write this study in a self explanatory way that assumes little prior knowledge, but in doing this, some of the speech chosen may seem somewhat "obvious" to our more knowledgeable readers. We hope this offers the best possible solution to everyone, and we hope this does not cause any confusion or inconvenience. Where w e ha ve us ed t echnical terms or acr onyms, w e of fer an e xplanation o f those expressions below.

140 © 2010, Portio Research. All Rights Reserved
Strategies for Driving Mobile Data and Broadband Adoption
Glossary
2G or Second Generation Packet Data Networks The second-generation packet networks recently introduced consist of combined voice and packet data networks based on global standards.
2.5G 2.5G des cribes t he state of w ireless t echnology and ca pability usually associated with General Packet Radio Services (GPRS) - that is, between the second and third generations of wireless technology. The second generation or 2G-level of wireless is usually identified as Global S ystem for M obile ( GSM) s ervice and t he t hird gener ation or 3G -level is usually identified as Univ ersal M obile Telecommunication S ervice ( UMTS). E ach gener ation provides a higher data rate and additional capabilities. There is also a fourth generation (4G) of t echnology in t he p lanning a nd r esearch s tages. 2.5G protocols extend 2G systems t o provide additional features such as packet-switched connection (GPRS) and enhanced data rates (HSCSD, EDGE).
3G or third generation 3G is an I nternational Telecommunication Union (ITU) specification for the third generation (analog ce llular was t he f irst gener ation and di gital PCS40
Third gener ation Wireless Wide A rea Net works ( WWAN) co mmunication s ystems ar e characterised by high-speed dat a rates (144 Kbps
was t he second ge neration) of mobile communication technology.
41 to 2+ Mbps42) suitable f or multimedia content. 3G technologies typically are packet-switched and use Code Division Multiple Access (CDMA) technology to communicate. Examples of 3G include EDGE43, 1xRTT, HDR and W-CDMA.44
3G as a Percentage
3G protocols in mobile telephony support higher data transmission rates, measured in Mbps, intended for applications ot her t han voice. 3G support broadband and bandwidth applications, such as full-motion video, video conferencing and Internet access.
3G as a per centage r efers t o 3G s ubscribers a s a per centage of t otal activ e mobile subscribers in a country. This represents the proportion of 3G subscribers in the total mobile subscriber base of a country.
3G Penetration 3G penetration refers to 3G subscribers as a per centage of total population of the country. This i s similar to the term ‘mobile penet ration’, which means total number of active mobile subscribers in a country as a percentage of total population of the country.
4G or fourth generation 4G or fourth gener ation WWAN communication systems ar e characterised by high-speed data r ates at 20+ M bps, s uitable for h igh-resolution movies and t elevision. T he i nitial deployment of 4G communication systems is expected in 2006-2010. The proposed features of these systems include 100 Mbps speed, location sensing and self-tailoring to user needs.
A2P Application-to-Peer: I n t he mobile m essaging world A 2P m essages ar e def ined as messages g enerated by an a pplication and se nt t o s ubscribers, f or ex ample, t he advertisements sent through SMS/MMS on subscribers’ handsets.
40 Personal Communications Service (PCS) 41 Kilobits per second (Kbps) 42 Megabits per second (Mbps) 43 Enhanced Data for Global Evolution (EDGE) 44 Wideband Code Division Multiple Access (W-CDMA)

© 2010, Portio Research. All Rights Reserved 141
Strategies for Driving Mobile Data and Broadband Adoption AAC Advance A udio Codi ng: It is an adv anced audi o co mpression al gorithm us ed f or downloading music files, streaming video, audio and satellite-radio applications.
Application Programming Interface (API) It is an i nterface implemented by a software program to communicate with other software. Operating systems and applications use API to determine the way to call or send requests to other software.
Average Profit per User (APPU) Measures the average monthly profit generated for each customer uni t, such as a handset or pager that an operator has in operation.
Average Revenue per User (ARPU) Measures the average monthly revenue generated for each customer unit, such as a handset or pager that an operator has in operation.
Backhaul It refers to the process of transmitting voice and dat a traffic from a r emote site to a ce ntral site.
BMP BMP is an extension for files containing graphics. It is used as a graphics file format on the Microsoft Windows platform. It stores image formats of different bit sizes. It regenerates the image in its own form and does not have any compressing capabilities. However, i t ca n adapt i tself to ot her im age s oftware’s r unning on ot her oper ating s ystems. T his gr aphic format al so co mes w ith . DIB ( device-independent bi tmap), . XBM, . XPM and . TGA extensions. BMP files can support l ossless dat a co mpression algorithms beca use of t heir spare capacities.
BoP Bottom of Pyramid: It refers to poorest socio economic groups.
BREW Binary Runtime Environment for Wireless: It is an application development platform developed by Qualcomm. It enables wireless users to download and run applications, such as enha nced e-mail, l ocation pos itioning, games, etc., t o B REW-enabled handset. BREW was f irst introduced and developed f or CDMA handse ts, but i t now su pports GSM/GPRS and UMTS handsets as well.

142 © 2010, Portio Research. All Rights Reserved
Strategies for Driving Mobile Data and Broadband Adoption
Broadcast Technologies for Mobile TV Some of the broadcast technologies for mobile TV worldwide are: DVB-H45
BTS
(Digital Video Broadcast – Handheld): DVB-H t echnology allows simultaneous broadcast of television, video and radio channels on mobile, and helps operators to preserve network bandwidth for other data and voice services. It has been accepted as the standard by the European Telecommunications Standards Institute (ETSI). ISDB-T (Integrated Services Digital Broadcast – Terrestrial): It is t he t ransmission standard that has been developed in Japan to help the radio and television stations support digital content. DMB (Digital Media Broadcast): It is a t ransmission standard, which transmits video feed via s atellite ( S-DMB) o r terrestrial (T -DMB) mode. T he s tandard i s cu rrently deployed i n Korea and is being increasingly used in other parts of Asia as well as Europe. MBMS (Multimedia Broadcast/Multicast Service): This standard al lows the t ransmission of multimedia content over the UMTS and GSM network.
Base T ransceiver Station: I t is t he equi pment t hat facilitates t he w ireless co mmunication between user equipment such as mobile handsets, computers etc., and the mobile network.
BWA Broadband Wireless Access: It is a form of fixed wireless access system.
Byte Byte is a co llection of bits i n which each bit can take a value of either 1 or 0. Kbps, Mbps and G bps denote t he num ber of byt es transferred per se cond; K bps, M bps an d G bps translate to 103, 106 and 109 bytes per second respectively.
CAPEX Capital Expenditure: It refers to the cost of developing a product or system.
CDMA Code Div ision M ultiple A ccess: I n a CDM A s ystem, each voice c ircuit i s l abelled w ith a unique co de and t ransmitted on a s ingle ch annel simultaneously along w ith m any other coded voice circuits. The receiver uses the same code to recover the signal from the noise.
CDMA2000 1x CDMA2000 1x : This i s r egarded a s t he first phas e of CDM A2000 t echnology used f or providing voice and data services over mobile networks. Data speeds of 307kbps are using a single channel while with two channels speeds of 614kbps are possible.
Churn Rate It is the rate at which the subscribers cancel their subscription with the existing operator and sign up with another operator.
Concatenate It refers to the operation of joining of two character strings end to end Disposable income Disposable income is gross income minus income tax applicable on that income, and hence the am ount of income left to an i ndividual after taxes have been pai d that i s available f or spending and saving.
45 Source: http://www.strategiy.com/inews.asp?id=20041127000355

© 2010, Portio Research. All Rights Reserved 143
Strategies for Driving Mobile Data and Broadband Adoption DoJa It is a JAVA-based technology/application developed for DOCOMO's i-mode mobile handset. I t a llows u sers t o acc ess m ore i nteractive appl ications or co ntent t han t he conventional HTML-based i-mode content.
Dongle Dongle is a portable device which is connected to a laptop or desktop and resembles a USB flash drive. It is widely used as a wireless broadband adapter.
DRM Digital Rights Management: I t refers to a s et of technologies used for the administration of digital content. It authorises the nature and restricts the frequency of the usage based on the administrative poli cy settings. I t s ustains the r evenue of t he mobile net work operator by regulating the usage of content at end user.
DSL Digital Subscriber Loop: I t is a t echnology that provides di gital data t ransmission over t he copper lines of a PSTN network.
DVB-H Digital V ideo B roadcasting-Handheld i s a m obile TV f ormat. B roadcast s ervices ca n b e brought to mobile handsets using this technical specification.
EBITDA margin EBITDA margin is the ratio in percentage of EBITDA to the total revenue earned by an MNO. E BITDA is t he ear nings of an M NO bef ore acco unting f or I nterest, T axes, Depreciation and Amortization.
EDGE Enhanced Data rates for Global Evolution: An enhanced modulation technique designed to increase net work capacity and dat a r ates in G SM net works. E DGE s hould pr ovide dat a rates up t o 384 K bps. E DGE w ill let oper ators w ithout a 3G li cense co mpete w ith 3G networks offering similar data services.
Emoticon Emoticons ar e symbols or co mbination o f s ymbols us ed t o co nvey emotional co ntent in messages.
EV-DO Evolution Data Only, Evolution Data Optimised: It is a wireless radio broadband data protocol being adopted by many CDMA operators. It is being used as a part of CDMA2000 networks in Japan, Korea, the United States and Canada. It provides better data speeds in comparison to GSM technologies such as GPRS and EDGE.
ExEn Execution Environment: I t i s an appl ication developed by Infusio for developing games f or higher-end mobile devices.
FDMA Frequency Division M ultiple A ccess i s a ch annel acce ss pr otocol t hat all ows a us er dedicated allocation to single or multiple frequency bands.
Gbps Please see “Byte”.

144 © 2010, Portio Research. All Rights Reserved
Strategies for Driving Mobile Data and Broadband Adoption
GIF Graphics Interchange Format: It is a file extension to a dif ferent kind of bitmap image. This format of file is capable of compressing the size of the file, unlike a normal BMP format file. The compression process does not result in loss of data. This feature ensures the quality of image by simultaneously reducing t he downloading t imes by a considerable am ount. T his format is only suitable for images of 256 and l ess colours. I t causes l imitation in formatting picture files.
GPRS General Packet Radio Service (GPRS) is a packet-based standard for mobile communication, which runs at speeds up t o 115 ki lobits per second, compared with G SM systems' 9.6 kilobits per second. GPRS supports a wide range of bandwidths and makes efficient use of limited bandwidth. It is particularly suited for sending and receiving small bursts of data, such as e-mail and web browsing, as well as large volumes of data. Applications f or GPRS may i nclude any of t he following: chat, t ext and visual information, still images, moving images, web browsing, document sharing/collaborative working, audio, job di spatch, co rporate e -mail, I nternet e-mail, vehicle pos itioning, r emote Loca l A rea Network (LAN) access, file transfer or home automation.
GSM Global System for Mobile communications, the most widely used digital mobile phone system and t he mobile telephone s tandard i n Europe. I t was originally defined as a pan -European open standard for a digital cellular telephone network to support voice, data, text messaging and cr oss-border r oaming. GSM i s now one of t he w orld's main 2G di gital wireless standards. GSM is present in more than 160 co untries and acco rding to the GSM Association, accounts for approximately 70 percent of the total digital cellular wireless market. GSM is a time division multiplex (TDM) system. Implemented on 800, 900, 1800 and 1900 MHz frequency bands.
GUI Graphical Us er I nterface ( GUI) is t he front-end i nterface and na vigation des ign o f an application. T his i ncludes s tandard f ormats f or r epresenting t ext and gr aphics. G UIs have become the standard ways for interaction between users and digital devices.
HSPA High Speed Packet Access comprises t wo mobile protocols: High Speed Downl ink Packet Access ( HSDPA) and Hi gh S peed Upl ink Packet Access ( HSUPA). T hese pr otocols enhance the performance of WCDMA protocols.
HTML Hyper Text Mark-up Language: It is a syntax based language used for designing web pages. The content of HTML, written in standard syntax, when opened in a web browser takes the form o f Web page. T he nas cent version of H TML was u sed with eas y syntax r ules i n comparison t o exi sting HT ML and M HTML versions of it . In r ecent t imes, t he o fficial standards of World Wide Web recommend Web developers to use XHTML 1.1, XHTML 1.0 and HTML 4.01 versions.
IC An Integrated Circuit which is also known as a chip is a small electronic circuit made out of semiconductor material. IC is used in almost all electronic equipment in use today.
iMelody It is a standard format through which music tones can be transferred between devices. The format has volume modifiers to vary the volume throughout the tone duration, codes for

© 2010, Portio Research. All Rights Reserved 145
Strategies for Driving Mobile Data and Broadband Adoption flashing phone’s backl ight and ot her features. iM elody was dev eloped by the irDa association (infrared communications).
Instant Messaging Instant Messaging is an Internet-based service that alerts users when their friends or colleagues are online and allows them to communicate with each other in real-time through private online chat areas. With i nstant messaging, use rs create a l ist of other users with whom t hey want t o communicate. When a u ser f rom t heir li st i s onl ine, t he service al erts them and enabl es an i mmediate contact with the other user. While instant messaging has primarily been a pr oprietary service offered by Internet service providers such as AOL and MSN, businesses are starting to employ instant messaging to increase employee efficiency and make expertise more readily available to employees.
Integrated Mobile Broadcast (IMB) It is a 3G PP Rel ease 8 S tandard t hat em powers MNOs t o of fer M ultimedia B roadcast Multicast S ervices i n a sp ectrally efficient manner in t he 3G T DD ban ds. It i s depl oyed existing 3G FDD unicast technology.
Intranet The i ntranet is a pr ivate net work inside a company or an or ganisation, and us es so ftware similar t o t hat used on t he I nternet. Companies use int ranets t o manage projects, provide employee information, distribute data and information, etc.
i-mode i-mode i s a pr oprietary packet-based i nformation s ervice for mobile hands ets. I t del ivers information (such as mobile banking, and train timetable) to handsets and enables exchange of e -mail from mobile hands ets on t he P DC-P n etwork. Launch ed i n 1999 by NTT DOCOMO, i-mode is very popular in Japan (especially for e-mail and transfer of icons).
IMPS IMPS (Instant Messaging and P resence Service) is an i nstant messaging system designed for mobile environments. Presence refers to the availability of a user for communication.
IMS IMS IP Multimedia Subsystem is an extension of the GSM / 3GPP GPRS core Network. I t uses S IP ( Session I nitiation P rotocol) to s et up, m aintain and t erminate packe t-switched voice and multimedia sessions.
Interoperability This is def ined as t he abili ty of a net work to oper ate w ith ot her net works, s uch as t wo systems based on different protocols or technologies.
J2ME Java2, Micro edit ion: T he M icro E dition o f the Ja va 2 P latform pr ovides an appl ication environment t hat specifically addresses t he need s of commodities i n the vast and r apidly growing co nsumer and e mbedded s pace, i ncluding mobile hands ets, pager s, per sonal digital assistants, set-top boxes, and vehicle telematics systems.
Java A s imple pl atform-independent obj ect-oriented pr ogramming language us ed f or w riting applets that are downloaded f rom the World Wide Web by a cl ient and r un on the cl ient's machine.
JPEG Joint Photographic Experts Group: This is the most commonly used format for storage and transmission of im ages on t he I nternet. T he f ormat uses l ossy co mpression t echniques wherein the compressed data i s v ery close to the or iginal form. A n advanced form of the
146 © 2010, Portio Research. All Rights Reserved
Strategies for Driving Mobile Data and Broadband Adoption
JPEG standard known as JPEG File Interchange Format (JFIF) is capable of formatting the size of graphics according the storage capacity of computer and transmission medium.
Kbps Please see “Byte”.
LTE Long-Term Evolution (LTE) is the standard being developed by 3GPP to achieve download rates of 100Mbps, and upload rates of 50Mbps for every 20MHz of spectrum and is termed as a 4G standard. LTE will have support for bandwidths ranging f rom 1.25MHz to 20MHz. The LTE group is expected to come up with concrete recommendations by September 2007.
M2M Machine-to-Machine: M2M generally means the communication between machines. However, in the mobile world, i t is sometimes defined as Mobile-to-Mobile, which basically refers to communication that involves only mobiles and not landlines.
MAN Metropolitan Area Network is a computer network that normally encompasses a city or a big premises. It is formed by connecting several local area networks.
MBMS Multimedia B roadcast and M ulticast S ervices i s a br oadcasting s ervice pr ovided through GSM and UTMS mobile networks.
Mbps Please see “Byte”.
MIDI Musical I nstrument Di gital I nterface: I t is a pr otocol w hich act s as an i nterface bet ween musical not es of an el ectronic instrument and co mputer. The orchestral per formance and notes ar e def ined ( formatted) i nto a f orm, w hich ca n be und erstood and pl ayed by computers, i.e., MIDI is capable of playing the actual piece of orchestra unl ike a r ecorded version. MiFi MiFi i s a co llection o f w ireless r outers t hat ar e us ed a s m obile Wi-Fi hot spots. T he technology is developed by Novatel Wireless. MIMO Multiple-Input and Multiple-Output refers to the use of more than one antenna at the transmitter and receiver end to enhance the communication process.
Mobile Broadband Users as a Percentage Mobile broadband users as a percentage refers to mobile broadband users as a percentage of t otal activ e mobile s ubscribers i n a co untry. T his r epresents the pr oportion of mobile broadband users in the total mobile subscriber base of a country. MNO Mobile Network Operator.
MNO market penetration It is the mobile subscriber base of an MNO expressed as a percentage of total population of the country of operation.

© 2010, Portio Research. All Rights Reserved 147
Strategies for Driving Mobile Data and Broadband Adoption Mobile Number Portability (MNP) MNP is a facility which allows mobile subscribers to retain their mobile number when moving between mobile networks.
Mobile penetration It is t he m obile s ubscriber bas e i n a co untry expressed a s a p ercentage of it s t otal population.
Modem A modem is a device which modulates and demodulates analogue and digital signals for the transmission of signals over different carriers.
MP3 It is an expert compressing tool, which has been widely used in musical content rendering. It is capable of compressing audio f iles up to 10 per cent of its or iginal size. M PEG layer-3 (MP3) format can retain the full quality of an actual song by unperceivable deviations.
MVNO Mobile Virtual Network Operator: Term used for a mobile operator who does not own its own spectrum and us ually does not hav e its own network infrastructure. Instead, MVNOs have business arrangements with t raditional mobile operators t o b uy minutes of use (MOU) for sale to their own customers.
Near Field Communication Near Field Communication (NFC) is a wireless communication technology which uses short-range high frequency to enable the exchange of data between devices in proximity with each ot her. T he d istance bet ween t he co mmunicating de vices has t o be l ess t han 10 centimetres. NF C-capable de vices ca n co mmunicate w ith s martcard r eaders as well as other NFC-capable devices.
Node - B It is a t erm used i n Universal M obile T elecommunications System ( UMTS) to refer t o the Base Transceiver Station (BTS).
Nokia Binary It is an audi o f ormat developed by Nokia, which al lows mobile users t o send r ingtones t o some Nokia handsets and other brands. I t is also known as SCKL, since al l the messages begin by //SCKL.
ODM An original design manufacturer (ODM) is a firm involved in designing and manufacturing a product according t o specifications provided by another firm. T he products are sold under the brand of the firm which gives the manufacturing contract to the ODM.
OEM An or iginal equi pment manufacturer ( OEM) i s a f irm which acquires a pr oduct (or a component) for reuse or incorporation into the products branded under its name.
OMA-IMPS Open Mobile Alliance-Instant Messaging and Presence Service: It is an open mobile alliance enabler for instant messaging and presence. The first cut of this specification was developed by the Wireless Village consortium.
OPEX Operating Expenditure: It refers to the ongoing costs for running or operating a pr oduct or system.

148 © 2010, Portio Research. All Rights Reserved
Strategies for Driving Mobile Data and Broadband Adoption
Packet Data Packet dat a i s a method o f t ransmitting i nformation i n s mall packe ts each co ntaining a certain amount of the i nformation. Packet dat a net works al low t ransmission of h igh-speed data to and from devices connected to the network. Packet Data is similar to dial-up Internet access available in homes or in businesses with cable modems, ADSL46
P2P
lines, etc.
Peer-to-Peer: In t he mobile messaging world, P 2P messages ar e def ined as m essages exchanged bet ween subscribers. T hese m essages or iginate from and t erminate t o mobile subscribers’ handsets.
PCO Public Call Office: It refers to the telephone facility located in a public place.
PCS networks Personal Com munications S ervice Net works: I n t he U. S., the 1. 9 GHz band has been allocated for PCS systems; the allocated spectrum is 120 MHz wide and is licensed as two 30 MHz segments for the 51 major trading areas, and three 10 M Hz segments for the 493 basic trading areas.
PDA Personal Di gital Assistant: A por table computing device capable of transmitting dat a. This device makes poss ible s ervices s uch a s pagi ng, dat a messaging, el ectronic mail, computing, facsimile, date book and other information handling capabilities.
PDC This stands for Personal Digital Cellular, a Japanese cellular standard.
PHS system This stands for Personal Handy phone system, a Japanese cordless standard.
PIM Personal I nformation Manager: A lso known a s a " contact manager," is a form of software that l ogs per sonal and bu siness information, such a s contacts, appoi ntments, li sts, not es, occasions, etc.
PNG Portable Net work Graphics: T his t ool r eplicates t he G IF format in its functioning w ith compression a s an add ed f eature. T his f ormat s imilar t o G IF i s ca pable of w orking on different platforms, backed by library functions. It is a non-lossy compression tool.
POS Point o f s ale ( POS) refers t o t he l ocation o f a t ransaction. G enerally, har dware or an instrument is installed at the merchant’s location to execute the transaction process.
PTT Push to Talk is a two way communication system which allows only one user to talk at any given t ime. T his system, comparable t o walky-talky is unlike mobile handsets which al low multiple users to speak at the same time.
QCP QCP is a format used for ringtones. The format was developed by Qualcomm PureVoice.
46 Asymmetric Digital Subscriber Line (ADSL)

© 2010, Portio Research. All Rights Reserved 149
Strategies for Driving Mobile Data and Broadband Adoption RAN Radio Access Network: I t i s a co mponent that exists between the mobile handset and the core network. I t performs the radio functionality of the network and provides connection to the core network.
RFID Radio frequency identification (RFID) denotes a system employed to convey a unique serial number using radio waves. It does not require contact or line of sight for communication. An example of the deployment of this technology is in electronic toll collection using RFID tags.
SDK Software Development Kit is a set of tools used for the development of an application for a software package.
Service Revenue Service revenues are the revenues earned by MNOs through the provision of services only, i.e. revenues after deducting revenues earned from sales of equipment/products.
SIM card It i s a s mart ca rd t hat giv es G SM hands et i ts u ser identity. The ca rd i s i nserted i nto a GSM/TDMA or GSM-only mobile handset containing subscriber-related data. The card contains 18 digits code for GSM markets and 20 digits code for TDMA markets.
SIM Toolkit Subscriber Identity Module Application Toolkit: It is used by network operators to provide a user friendly interface on a subscribers’ handset to access value-added services provided by them. T hese appl ications al so pr ovide a mechanism for s toring and us ing any service specific parameters. These appl ications ar e bui lt w ithin a S IM card by mobile net work operators.
SIMPLE SIMPLE ( Session I nitiation P rotocol for I nstant M essaging a nd P resence Lev eraging Extensions) is an open standard instant messaging (IM) protocol.
SIP Session I nitiation P rotocol or S IP i s a standard m ultimedia and t elephony protocol f or initiating an i nteractive us er s ession ov er mobile ne tworks. T he s ervices under S IP may include call forwarding, number delivery, authentication and other telecoms applications.
Smartphone A smartphone is a mobile handset which runs on operating system (OS) software and offers some of t he ca pabilities of a P C. I t pr ovides s tandardised i nterface and pl atform for application developers and ar e enabled with advanced f eatures, such as , e-mail, I nternet and e-book reader. Some of the other features expected from a Smartphone include built-in full keyboard/external USB keyboard, powerful microprocessors, memory, built-in m odem and large screens.
SMS TV This is defined as the use of SMS for variety of applications, such as voting, teletext chat for TV programmes.
SMSC Short Message Service Centre (SMSC) provides the routing of all SMS or text messages in any mobile network. Similar to e-mail server, the SMSC handles large volumes of messages sent between two mobile handsets or a mobile handset and a software application.

150 © 2010, Portio Research. All Rights Reserved
Strategies for Driving Mobile Data and Broadband Adoption
SoC System on Chi p: It refers to the process of i ntegrating al l the components of an el ectronic system into a single integrated circuit or chip.
SS7 SS7 i s a global s tandard f or t elecommunications defined by ITU T elecommunication Standardisation Sector (ITU-T). The standard defines the procedures and protocol by which network elements in the public switched t elephone network (PSTN) exchange i nformation over a di gital s ignalling net work to ef fect mobile ( cellular) and wire-line ca ll setup, r outing and control. Thin Client Thin Cli ent r efers t o a cl ient co mputer or cl ient s oftware i n cl ient-server ar chitecture networks. The primary purpose of Thin Client is to convey input and output between the user and the remote server.
TIFF Tagged Image File Format: It is a platform free image format, which enables reproduction of an image created on a pl atform, such as Macintosh, on ot her platform such as an or dinary PC. It is an ad vanced tool for storing bit map or graphic image on d ifferent platforms. TIFF format supports scanned image, fax and other applications involving editing of image.
TDD Time Division Multiplex: This is a scheme for allowing simultaneous transmission and receiving of data at the same frequency, but with the different time slots allocated to them.
TDMA Time Division M ultiple A ccess: A T DMA channel i s a single FDMA ch annel divided up in time into multiple time slots. TDMA system is able to transmit multiple voice circuits per channel. Three users can take it in turn to share one radio channel. The channels can vary in bandwidth and depending on the type of system, the time slots can transmit all or part of a voice circuit. Each user's speech is stored, compressed and t ransmitted as a qui ck packet, using controlled time s lots t o di stinguish t hem-hence t he phrase ' time division'. It uses 30 KHz channels a nd a v ocoder r ate o f 8 K bits/sec. A t t he r eceiver, t he packe t i s de -compressed.
TD-SCDMA Time D ivision S ynchronous Code Div ision M ultiple A ccess: It i s an ai r i nterface us ed i n UMTS mobile t elecommunications net works. I t has been depl oyed i n Chi na to replace W-CDMA technology.
UMTS Universal M obile T elecommunications S ystem: T his is t he future t ransmission network for third gener ation mobile t elephones, as def ined by the I nternational T elecommunications Union (ITU). In time, UMTS could reach transmission capacities of 2 M bits/sec. (compared to 9. 6 K bits/sec. for G SM). Initially UMTS w ill o ffer rates of 144 t o 384 K bits/sec. T his standard will make the development of new multimedia services having very wide bands and new uses, notably in the transmission of video, images and sound possible.
UMTS TDD Universal Mobile T elecommunication System ( UMTS) T ime-Division-Depleting ( TDD): UMTS T DD M obile B roadband t echnology is a packet dat a im plementation o f t he international 3GPP UMTS standard and is designed to work in a single unpaired frequency band. It is designed to generate typical data transfer rates of up to 2 Mbps.

© 2010, Portio Research. All Rights Reserved 151
Strategies for Driving Mobile Data and Broadband Adoption UMTS FDD Universal Mobile Telecommunication System (UMTS) Frequency Division Duplex (FDD): I t is designed to generate typical data transfer rates of up to 384 Kbps and is suitable for wide area coverage due to potentially high reach.
USB Universal Serial Bus is a specification used to initiate data transfer between devices and a host controller.
USSD Unstructured Supplementary Service Data (USSD) is a standard for transmitting information over GSM networks. It is primarily used to access the information on prepaid balances and similar details.
VAS Mobile operators of fer various se rvices which are not par t of t he bas ic voice of fer. T hese services are av ailed of f separately by the mobile subscribers. I t i ncludes services such as SMS, MMS, m obile e-mail, m obile games, m obile m usic etc. T hese also include services such as WAP, voicemail, call diversion, etc.
vCalender It i s a s tandard f ormat us ed t o ex change i nformation about s chedules an d act ivities electronically via an e-mail attachment. vCalender requires a personal information manager (PIM) type of application program. The format was developed by a consortium founded by Apple, AT&T, IBM and Siemens.
vCard vCard is an el ectronic business ca rd u sed f or exch anging personal i nformation di gitally. It contains name, address information, company logos, URLs, photographs and sound clips. It was developed by a consortium founded by Apple, AT&T, IBM and Siemens.
WAP Wireless Advance Protocol: WAP is a s pecification for a s et of communication protocols to standardise the way mobile devices, such as handsets and radio transceivers, can be used for Internet acce ss. T he WAP s tandard i s ba sed on Internet s tandards (HTML, XML and TCP/IP). I t co nsists of a Wireless M arkup Langua ge ( WML) s pecification, a WMLScript specification, and a Wireless Telephony Application Interface (WTAI) specification. The WAP protocol is the leading standard for information services on wireless terminals such as digital handsets. Some e xamples of WAP for ac cessing i nformation incl ude t he following: ch ecking t rain timings, pur chasing t ickets, f light check-in, viewing t raffic information, ch ecking w eather conditions, looking up stock values, looking up phone numbers, looking up addresses or looking up sport results, and there are countless more.
WAV It is a widely used audio format for wireless devices which is limited to files less than 2 GB in size.
WBMP It is a gr aphic file format used for sending Web content to wireless dev ices. The format is designed to support multiple image types for WAP-enabled wireless phones.
W-CDMA Wideband Code Division Multiple Access is a 3G wireless network air interface standard.

152 © 2010, Portio Research. All Rights Reserved
Strategies for Driving Mobile Data and Broadband Adoption
WiBro Wireless Broadband: The technology was formulated by South Korean telecom industry as an equivalent to mobile WiMAX international standard.
Wi-Fi Wireless Fidelity: It is used to pr ovide w ireless l ocal ar ea net work through enhance d interoperability of the network. Services such as Internet, VoIP phone acce ss, and gam ing, etc., can be provided using Wi-Fi.
WiMAX Worldwide Interoperability for Microwave Access: It is a telecommunication technology used for wireless data transfer over long distances through point-to-point links as well as mobile cellular type access. It is based on standards that are useful in wireless broadband access.
Wireless MAN Wireless Metropolitan A rea Net work: T he t echnology is u sed to pr ovide w ireless network over a larger area as compared to local area network.
WLL Wireless Local Loop: It refers to the wireless devices that are situated in fixed locations. The signal transmissions occur through the air and it provides connectivity to the users in remote and isolated areas without the need for laying new cables.
WMA Windows Media Audio: It is a compression format with Digital Rights Management features incorporated in i t. I t compresses the content to half of what an MP3 can do with the same content. This feature makes it more adaptable to lower memory devices such as handsets.
WML Wireless M ark-up Lan guage i s an XML and a HT ML-based l anguage u sed f or cr eating content, which can be delivered to wireless hand-held devices. This language supports WAP (Wireless Application Protocol) standards just as HTML supports World Wide Web (http) standards. WML is useful in accessing text on web pages over hand-held devices.
W-CDMA Wideband Code Div ision M ultiple A ccess: T he t hird gener ation s tandard of fered t o the International T elecommunication Uni on by GSM proponents. T his i s a 3G t echnology that increases data transmission rates in GSM systems by using CDMA instead of TDMA. W-CDMA has beco me t he Di rect S equence m ode in t he I TU's 3G sp ecification, w hich includes t he 1 x M ulti-Carrier mode ( 1x M C) and 3x Multi-Carrier mode (3x MC). 1x MC (formerly known as cd ma2000) and 3x MC comprise the 3G upgrade pat hs f or operators already using CDMA.

© 2010, Portio Research. All Rights Reserved 153
Strategies for Driving Mobile Data and Broadband Adoption Portio Research Classifications
Geographical Regions: There i s sometimes a dif ference in the way research f irms classify the major geographical territories. At Portio Research, we follow 'obvious' geographical lines, but for the record, here are the regional definitions we follow, unless otherwise stated in the report: Western Europe: Standard classification includes Iceland and various islands Central and Eastern Europe: I ncludes s tandard l ist o f Cent ral and E astern E uropean countries, and the Baltic states, Balkans, Russia, Greece and Turkey Asia Pacific: I ncludes A ustralasia, t he I ndian S ub-Continent, Pakistan, A fghanistan, S ri Lanka, Maldives and the Former Soviet Union Central Asian republics North America: Standard classification, including Hawaii and islands to the North Latin America: I ncludes al l South and Cent ral American co untries including Mexico, The Caribbean and The West Indies Middle East: Includes Israel and all Middle Eastern countries East of Egypt, South of Turkey and West of Afghanistan Africa: Standard classification includes territories in Western Indian Ocean
Mobile Subscribers Generally, we count act ive S IMs, and we consider ac tive as bei ng u sed within 3 m onths, but, of course there is some room for variance, depending on what figures operators themselves publ ish or report to us when we interview them. When running spot-checks on operator numbers, we are gov erned by the f igures they give us, and as we are al l aware, many individuals and companies around the world count their subscribers/subscriptions by a number o f d ifferent cr iteria. We r efer t o " total s ubscribers" f or a net work/country or globally, as a count of the total number of active subscriptions those networks have, and as such this can cause a slight distortion of any country-penetration rate.
Currency and Monetary Values All monetary values quoted in this report are in US Dol lars as the most widely recognised benchmark internationally. The currency conversion has been done on the year average basis. Whilst researching global mobile markets, we use http://www.oanda.com/ for all currency conversion calculations.

154 © 2010, Portio Research. All Rights Reserved
Strategies for Driving Mobile Data and Broadband Adoption
Companies Mentioned in this Report
Company Website
3 www.three.co.uk
3 Italia www.tre.it
3G Americas www.3gamericas.org
Acision www.acision.com
Adobe www.adobe.com
America Movil www.americamovil.com
Apple www.apple.com
Asus www.asus.com
AT&T www.att.com
Boingo Wireless www.boingo.com
Broadcom www.broadcom.com
Carphone Warehouse www.carphonewarehouse.com
Celcom www.celcom.com.my
CDMA Development Group www.cdg.org
Cell C www.cellc.co.za
China Mobile www.chinamobileltd.com
Compaq www.compaq.com
Dell www.dell.com
DeNA www.dena.jp
eBuddy www.ebuddy.com
Ericsson www.ericsson.com
Etisalat www.etisalat.ae
Excelcomindo www.xl.co.id
Facebook www.facebook.com
GetJar www.getjar.com
Google www.google.com
Handango www.handango.com
Handmark www.handmark.com
Handster www.handster.com
HP www.hp.com
Huawei www.huawei.com

© 2010, Portio Research. All Rights Reserved 155
Strategies for Driving Mobile Data and Broadband Adoption
Company Website
International Telecommunication Union www.itu.int
KDDI www.kddi.com
Lenovo www.lenovo.com
LG www.lg.com
Maxis www.maxis.com
Microsoft www.microsoft.com
Mobango www.mobango.com
MobiHand www.mobihand.com
Motorola www.motorola.com
Mozilla Firefox www.mozilla.com
MTN www.mtn.com
NEC www.nec.com
NextWave Wireless www.nextwave.com
Nimbuzz www.nimbuzz.com
Nokia www.nokia.com
NTT DOCOMO www.nttdocomo.com
O2 www.o2.co.uk
Ofcom www.ofcom.org.uk
Opera www.opera.com
Optus www.optus.com.au
Orange www.orange.com
Palm www.palm.com
Pfizer www.pfizer.com
PriceWaterhouseCoopers www.pwc.com
Qualcomm www.qualcomm.com
RIM www.rim.com
Rogers Communications www.rogers.com

156 © 2010, Portio Research. All Rights Reserved
Strategies for Driving Mobile Data and Broadband Adoption
Company Website
Samsung www.samsung.com
Sembuse www.sembuse.com
Siemens www.siemens.com
SlideMe www.slideme.org
SoftBank www.softbank.jp
Sony www.sony.com
Sony Ericsson www.sonyericsson.com
Sprint www.sprint.com
Sumitomo Mitsui www.smbc.co.jp
Tele2 www.tele2.com
Telefonica www.telefonica.com
Telekom Austria www.telekomaustria.com
Telenor www.telenor.com
TeliaSonera www.teliasonera.com
Telkomsel www.telkomsel.com
Texas Instruments www.ti.com
TIM www.tim.it
T-Mobile www.t-mobile.com
Verizon Wireless www.verizonwireless.com
Virgin Mobile www.virgin.com
Vodacom www.vodacom.com
Vodafone www.vodafone.com
Webkit www.webkit.org
WIN plc www.winplc.com
YouGov www.yougov.com
Zain www.zain.com
ZTE www.zte.com

© 2010, Portio Research. All Rights Reserved 157
Strategies for Driving Mobile Data and Broadband Adoption About the Authors Vikas Kumar Vikas K umar is w orking as a Senior Business Analyst w ith P ortio Res earch and Evalueserve. He has worked on v arious projects related to telecom domain. He gr aduated from IIT Delhi, India. He has been working with Portio Research and Evalueserve since July 2007. Deepak Mahajan Deepak Mahajan i s working a s a Senior Business Analyst with P ortio Res earch and Evalueserve. He gr aduated from Delhi College of Engineering, India. He has been working with Portio Research and Evalueserve since May 2008. Natarajan P Natarajan is working as a S enior Business Analyst with Portio Research and E valueserve. He graduated from Madras University, India. He has been working with Portio Research and Evalueserve since February 2010. John White John White has been Editor and contributing author for this report. John is Business Development Director for Portio Research and has over 18 years experience in the technical publishing industry. Working in the IT sector previously and in the telecoms industry for the last 11 years, John has extensive experience in the mobile sector.

158 © 2010, Portio Research. All Rights Reserved
Strategies for Driving Mobile Data and Broadband Adoption
Also available from Portio Research Limited
Portio Research Ltd is a UK-based research company focussing on the mobile space, providing reports, handbooks, directories and database products. New and Best Selling Reports include: If you have any questions or if we can be of any assistance to you, please contact us by e-mail: [email protected] Copyright 2010. Portio Research Limited 2010 www.portioresearch.com
Africa and Middle East Mobile Opportunities 2010-2014: Packed-full of invaluable data, market sizing and growth forecasts, this must-have new study delivers vital insight into the exciting mobile markets of the AME region. With essential regional, country and operator-level analysis of this growing mobile space, the detailed report includes mobile subscriber, penetration, technology and messaging forecasts; as well as subscriber numbers, service revenues, market share and ARPU data, and strategies and developments of key mobile operators – plus so much more. With the AME mobile market now the subject of intense interest, this essential 96-page market report provides an understanding of the size, scope and major players of this changing mobile market. Please click here for more details.
Mobile Payments 2010-2014: Examining the exciting worldwide mobile payments market, this essential new report delivers analysis of mobile payment services including in-app payments, mobile ticketing and mobile coupons, and identifies the opportunities in the mobile payments space. This invaluable research provides growth forecasts and market sizing; details the various types of mobile payments and different platforms they use; reveals the drivers and challenges affecting mobile payment development; appraises mobile payment business models and compares value chains; and offers supporting case studies and profiles of major markets, key players and successful mobile payment services. Please click here for more details.
Mobile Messaging Futures 2010-2014: The highly anticipated fourth edition of our best selling messaging report is now available to order. This new edition is packed with detailed market analysis, traffic and revenue forecasts and a brand new vendor survey. This massive 355-page market study gives you all the data you need for SMS, MMS, mobile e-mail and mobile IM markets worldwide, and includes a BONUS 26-slide Executive Summary presentation. With essential insight into a market that is forecast to be worth USD 233 billion by end-2014, this is one of the most detailed and popular reports ever written on the worldwide mobile messaging market. Please click here for more details.