strategies for organic food waste to power conversion in a
TRANSCRIPT

Akhilesh BakshiMechE - MIT
Soufien TaamallahMechE - MIT
Kevin S. KungBioE - MIT
Strategies forOrganic Food Waste to
Power Conversion in a NewApartment Complex in
Lagos, NigeriaAbstract The use of biomass and organic waste from house-holds, industry and farms for energy conversion could contributeto sustainable development on several fronts, namely, environ-mental, social, and economic. It is widely considered as one ofthe solutions to lower the dependence on expensive imported en-ergy sources and improve people’s access to energy hence theirquality of life, especially in rural areas, while potentially limit-ing greenhouse emissions. In developing countries, the use oforganic waste for energy purposes can also alleviate reliance ondiesel which is the default backup option when suffering frompower supply intermittency. For instance, in Lagos, Nigeria, anew apartment building built, can expect electricity from the gridonly during 2/3 of the day in average with random, non-plannedshutdowns. The choice and overall effectiveness of a municipalwaste and in general biomass to energy method depends on thefeedstock composition and related heating value. Along with theform of energy needed (electricity, heat, or liquid fuel for trans-portation), the biomass characteristic will determine the suitableenergy conversion method to be used. In the first phase of thisstudy, we provided, through our midterm report, an extensive re-view of the biomass sources used for energy purposes and ex-tracted the relevant parameters essential for a suitable choice ofconversion method. This was complemented with the review ofthe different thermochemical and biochemical processes used to-day for biomass to energy purposes. In this final report, we an-alyze the case of a new apartment complex in Lagos Nigeria, aspart of the project undertaken by NovaGen, a startup created atMIT with the goal to provide property managers with an alter-native to diesel fuel for generators, while fostering waste reduc-tion at source through waste to energy conversion. We revisitedour literature review and selected the most promising thermo-chemical and biochemical method for our particular application.Based on simplified models built using ASPEN along with ul-timate analysis-based correlations, we estimated the amount ofelectricity produced by the available waste along with the dieselfuel cost reduction.
Final report • MIT - 2.62 - Fundamentals of Advanced Energy Conversion page 1

1 IntroductionLarge-scale introduction of biomass energy could contribute to sustainable development on severalfronts, namely, environmental, social, and economic [1]. World energy supplies have been dominatedby fossil fuels for decades (approximately 80% of the total use of more than 400 EJ per year) [2].Today biomass contributes about 10 to 15% (or 45± 10 EJ) of this demand. On average, in the indus-trialized countries biomass contributes some 9 to 14% to the total energy supplies, but in developingcountries this is as high as one-fifth to one-third [3]. In quite a number of these countries, biomasscovers even over 50 to 90% of the total energy demand. It should be noted, though, that a large part ofthis biomass use is noncommercial and used for cooking and space heating, generally by the poorerpart of the population [4].
Nonetheless, in many parts of the developing world such as India and Nigeria, millions of tons ofunmanaged organic waste is dumped into informal landfill or set on fire every day because there is alack of perceived value for it, despite its great energy generation potential. In this study, we proposeto assess the viability for energy conversion of such waste, given its broad potential applications inmany parts of the world.
This document present the first phase toward that goal: we will first gain a better understanding ofthe nature of such waste through characterizing different types of biomass that may be present in thewaste stream, and then give an overview of the potential energy conversion technologies that may besuitable for organic waste. Finally, we propose the research goals for the second phase of our project.
2 Background and MotivationLagos is the most populous city in Nigeria. It is today the largest city in Africa and the 7th largesturban area in the world according to the United Nation. Access to energy and in particular electricityis one of the challenges that Lagos faces. An important intermittency is associated with power supplyto households. In average, electricity is not available for up to 8 hours per day (with a maximum of16 hours per day) making necessary to have a complementary source of power. Very often, a dieselgenerator is used to provide power when the utility power is not available. Lagos, as most of largecities in the world faces also the challenge of household and municipal waste. Large quantities ofwaste are directed towards landfills. Organic waste, in particular food waste is a large part of this totalwaste. A study of global food waste published in 2011 by the Food and Agriculture Organization ofthe UN found that roughly one third of all food produced for human consumption each year goes towaste totaling 1.3 billion tonnes [5].
NovaGen NovaGen is a startup from MIT with the goal of providing more sustainable solutions forelectricity intermittency in Lagos, compared to diesel, by taking advantage of the large mass of dailyorganic waste. NovaGen is doing a pilot study based on the case of a new apartment complex beingbuilt in Lagos.
3 Goal and ApproachNovaGen is seeking to enter the Nigerian market as a renewable energy provider for the urban apart-ment blocks (around 70 households), and is evaluating the options of biodigestion and gasification.The goal of our project is to provide NovaGen with an assessment, from the systems design andenergy conversion perspective, which one of these two options may be more viable in the Lagos con-text. In particular, NovaGen is seeking to provide electricity to households only during hours of gridoutage, which is estimated to be about 8 hours/day. The estimated household electricity consumptionis around 3 kW (the confidence interval is, however, between 1.5 kW and 8 kW, as data are sparse).
Final report • MIT - 2.62 - Fundamentals of Advanced Energy Conversion page 2

The business as usual scenario for those households would be to burn diesel in diesel generators, anddiesel, priced at about 160 Naira/L (USD 1/L), is relatively expensive. NovaGens value propositionis to provide a lower-cost source of electricity for these apartment blocks during hours of power out-age. Insights from this study may help NovaGen devise an energy conversion method with betterconversion efficiency.
In order to carry out this assessment, we will employ several multi-scale approaches for bothenergy conversion pathways. As a first step, we will carry out a brief literature review over theexisting waste treatment technologies to understand why gasification and biodigestion may be twoprocesses of choice for municipal waste on a small community scale. Then, we will model bothprocesses at different scales. As an illustration, for gasification, we will develop a kinetics-based andsingle-particle approach to understand fuel production and composition. This detailed modeling willhelp us evaluate how potential fluctuations in the incoming feedstock characteristics will affect thefuel characteristics, and therefore, the system performance. We will then consider the energy balanceinside the gasifier, and integrate the gasifier into an overall systems model that encompasses a dryer,gasification unit, and diesel engine in order to predict the system performance. We will undertakea similar approach for biodigestion. At the end, we will compare the outputs from both pathways,and make a recommendation about the better conversion pathway to pursue, at least from the energyconversion perspective. In order to achieve these goals, we will use a variety of modeling tools suchas MATLAB, EES, Cantera, and ASPEN Plus based on existing models as well as values/parametersobtained from our the literature search.
The key question that we will first address is: Given the amount of municipal waste available in theapartment blocks (about 120 kg/day), does the organic fraction (57% by weight) of the waste sufficefor power provision to fulfill the needs of the apartment block (around 3 kW for 8 hours/day)? Giventhat mixed municipal waste may be subject to significant daily and seasonal variations, how sensitiveare our projected figures to fluctuations in the input feedstock characteristics? At the end, shouldNovaGen go ahead with its project, and if so, how much money can it save?
We recognize that because we are addressing the issue of power intermittency, energy storage isan important aspect of the project. However, due to the limited scope of this study, we focus ourattention mostly on the energy balance of the waste-to-energy conversion process, and leave the issueof energy storage for further work.
The key data on the energy requirements for Lagos case is summarized below. The important dataon municipal waste characteristics in Lagos were extracted from Amber et al. [6].
Final report • MIT - 2.62 - Fundamentals of Advanced Energy Conversion page 3

Figure 1: Data for typical apartment complex in Lagos, Nigeria
4 Literature review and selected technologies
4.1 Thermochemical4.1.1 Biomass Combustion
Biomass combustion is used to convert the chemical energy stored in biomass into heat, mechanicalpower or electricity. When heating biomass, its constituents start to hydrolyze, oxidize, dehydrateand pyrolyze with increasing temperature forming combustible volatiles, tarry substances and highlyreactive carbonaceous char. At the ignition temperature, cellulose, hemicellulose, lignin and watervapor are stripped off and decompose into partial or complete combustion products in the flamingzone. The feedstock HHV depends on the combination of proximate, ultimate and structural anal-yses. For instance, the lignin content of the sample is strongly correlated with the heating value.While theoretically it is possible to burn any type of biomass, in practice combustion is feasible onlyfor biomass with a moisture content < 50%, in order to keep the combustion temperature (hencethe combustion quality) and thermal efficiency high [7]. Biomass that has significantly high volatilecomponents is easier to ignite (as compared to coal or torrified biomass), but the downside is thatcontrolling ignition is a must while a longer high temperature zone must be maintained in order to
Final report • MIT - 2.62 - Fundamentals of Advanced Energy Conversion page 4

achieve complete combustion at high efficiency and to control emissions [8]. Finally, a high ash con-tent in the biomass fuel makes it less desirable as a fuel [9]. This is because ash acts as a heat sink,in the same way as moisture, besides being responsible for corrosion, agglomeration and disposalissues adding to maintenance costs. Biomass combustion is mainly used for heat production in smalland medium scale units and the selection of the furnace type is largely determined by the operatingscale, fuel type and fuel residence time. Overall, combined heat and power (CHP) production usesbiomass combustion in conjunction with steam cycles with typical power outputs in the range 0.5-10MWe. Net bio-energy conversion efficiencies for biomass combustion power plants range from 20%to 40%. The higher efficiencies are obtained with systems over 100 MWe or when the biomass isco-combusted in coal-fired power plants [7, 10].
One of the big hindrances in using biomass as a fuel for direct combustion is the emission con-trol, along with the combined nuisance of corrosion and agglomeration. Some of the major issuesconcerning the combustion process are as follows:
• PAH Emissions: Most of the five or six member ring Polycyclic Aromatic Hydrocarbons(PAHs) are formed as a result of chemical changes during combustion, some of them areknown or suspected carcinogens [11]. The formation mechanism of PAHs is very complexand not completely known, but it is suggested that PAHs are formed by incomplete combus-tion during pyrolysis (< 850◦C) and through synthesis reactions in the presence of oxidantsOH, O3, HNO3 etc at high temperatures (> 850◦C). To avoid PAH formation, air staging andoxygen-rich combustion are essential [8].
• CO Emissions: Like conventional fuels, CO formation is primarily due to incomplete oxida-tion, i.e. fuel-rich combustion or short residence time of the fuel. Biomass that has a highervolatile component (∼ 75%) needs more residence time to completely burn the volatiles. Theproblem is further amplified by larger fuel particles (densification / pulverizing biomass is of-ten expensive), higher ash content and moisture, which reduces the combustion temperature,thereby, slowing the oxidation kinetics.
• NOx Emissions: Since most fluidized bed reactors operate at relatively low temperatures, typ-ically ∼ 900◦C, formation of NOx is primarily in the form of fuel NOx, or to some extent,prompt NOx. Typically, this is not a major concern since the nitrogen content in biomass is lowwhile presence of char further assists in the reduction of NOx emissions. Thus, even thoughchar content in biomass is low, co-firing biomass with coal reduces the overall emissions. NOx
emissions can be primarily controlled by air and fuel staging, with rich burning in the firststage followed by stoichiometric combustion in the following stage. Since this introduces con-struction / control complexity, NOx reduction may be done using selective catalytic reductionwith ammonia, or by fuel reburning, the latter would, however, come at the cost of increase inCO/CO2 emissions [8].
• Particulates: Particulate emission arises either from incomplete combustion (soot, tar and char)or from the inorganic material in the fuel. While the former is controllable by carefully select-ing the operating conditions, the latter is a big menace in biomass combustion and is directlyrelated to the chlorine and alkaline content in the fuel. Most of the particles are sub-micronscale [12], thus requiring efficient cleaning systems, unlike coarse particles (> 5 micron) whichcan be efficiently removed using cyclone and electrostatic precipitation filters [8].
• Deposits, Corrosion and Agglomeration: Presence of alkali metals (predominantly K) resultsin the formation of salts (silicates). Chlorine in the biomass sample increases the volatilityof the alkali metals, releasing them as alkali chlorides and hydroxides in the gas phase whichreact with SO2 to form low melting point silicates which stick to the surface. The non-volatile
Final report • MIT - 2.62 - Fundamentals of Advanced Energy Conversion page 5

Figure 2: Schematic of Biomass Gasification Process [15]
compounds, by coalescence or melting, form ash particle which also remain at the bottom ofthe bed and cyclone system. Thus, all metal surfaces are either directly attacked by gas species(eg Cl2) or corrode due to formation of solid / molten phase on the surface rendering the heattransfer process ineffective [9]. The latter can be mitigated by using materials such as bauxite,limestone, kaolinite etc which increase the melting point of alkali compounds, although chlo-rine is still released in the gas phase [13]. Similarly, in the combustion of biomass samples withhigh alkaline content (e.g. herbaceous biomass) agglomeration results when the ash releasedforms layers around inert particles. In fluidized bed, for example, this disrupts the bubblingphenomena, and in the extreme case, causes boiler defluidization [13,14]. Co-combustion, fuelpre-processing and use of alternate bed material are strategies often employed, but with thesubsequent flow and chemical stability issues appropriately addressed [8].
While direct combustion of biomass is presently a reliable, low-risk and flexible energy conversiontechnique, the biggest hurdle is the emission control: better combustor designs ensure check on COand PAHs emissions, while post treatment for NOx and particulates, but the challenge is related to theash content which significantly reduces the life of all equipments in a biomass combustion system,and is also a menace with respect to disposal [13]. Keeping emission control in mind along withlimitations on feedstock and product flexibility, gasification is often preferred over direct combustion.
4.1.2 Gasification
Gasification is the conversion of biomass into a combustible gas mixture by the partial oxidation ofbiomass at high temperature, typically 800-1000◦C. The gas produced can be burned directly, used asa fuel for gas turbine / internal combustion engines or used in the production of fuels (e.g. hydrogen)or other chemicals (e.g. methanol). As shown in Figure (2), a gasification system is typically madeup of three essential systems: (1) the gasifier, used to produce the combustible gas (2) the gas cleanupsystem and (3) the energy recovery system. Details regarding the gasifier and the energy recoverysystem are presented in the following sections.
Fundamentals: Gasification of biomass can generally be represented as
Biomass + O2 (or H2O) → Producer Gas (CO,CO2,H2,CH4,N2) + H2O + tar + char + ash(1)CO + H2O ↔ CO2 + H2 ∆H = −42kJ/mol (2)CO + 3H2 ↔ CH4 + H2O ∆H = −88kJ/mol, (3)
where the final composition is governed by the water-gas shift and methane formation reactions givenby Equations (2) and (3). Char is the carbonaceous solid residue of biomass while tar is a complexmixture of condensible hydrocarbons which include single ring to complex polycyclic aromatic hy-drocarbons (PAHs) [16], both being the result of incomplete conversion of biomass. In general, theproducer gas composition is a function of fuel properties such as fuel composition and moisture con-tent and operating parameters such as (1) gasifying medium (2) operating pressure (3) temperature(4) equivalence ratio (6) residence time (7) homogeneity in the reactor and (8) catalysts. Typicalsyngas compositions are listed in Figure (3).
Final report • MIT - 2.62 - Fundamentals of Advanced Energy Conversion page 6

Figure 3: Typical syngas composition with different oxidants [17]
Fuel Requirements: The fuel moisture content typically has to be less than 15% before gasificationsince higher moisture reduces the temperature achieved in the oxidation zone, resulting in incompletecracking of hydrocarbons. Thus, dryers are often employed using the waste heat from the system todry the biomass fuel to acceptable moisture levels. Similarly, as in direct combustion, ash contentin the feedstock must be checked to prevent slagging / fouling inside the gasifier, and thus physical/ chemical separation methods (eg fractionation, leaching) may be used to restrict the ash content toless than 5%. Finally, the fuel must also be ground to small particle sizes (typically 20-80 mm) sincelarge particles tend to form bridges and prevent effective movement of the fuel [18]. Therefore, theoverall energy consumption during size reduction depends on the moisture content, initial biomasssize, biomass properties and mill properties [15] and including the cost of biomass pre-treatment, thiscould contribute to as high as 50% of the total gasifier unit cost [18].
Table 1: Main advantages and technical challenges of various operating conditionsAdvantages Technical Challenges References
Gasifying AgentsAir Heat requirement for gasification met Low heating value (3-6 MJ/Nm3) [18, 19]
Moderate char and tar content Large amount of N2 in syngasSteam / CO2 High heating value syngas Indirect or external heat supply [20, 21]
H2-rich syngas (>50% volume) Catalytic tar reforming required
Gasifier DesignFixed/Moving Bed Simple, reliable design Non-uniform temperature [18, 22]
Favorable economics on small scale High char and/or tar contentFluidized beds Short residence times High particulate dust in syngas [18, 22]
Uniform temperature distribution Catalytic tar reforming required
Gasifier OperationTemperature increase Decreased char and tar content Decreased energy efficiency [19, 23]
Increased heating value of syngas Increased ash related problemsPressure increase Low char and tar content Limited operation experience [18, 22]
No syngas compression cost Higher cost at small scaleER increase Low char and tar content Decreased heating value of syngas [24]
CatalystNaturally occurring Cheap Moderate reforming efficiency [25, 26](dolomite, olivine) Easily eroded and brokenAlkali salts High reforming efficiency Increased plugging/slagging and [25, 27]
Increased Hydrogen in syngas destabilization of metal catalystsStable metal oxides High reforming efficiency Expensive [25, 28]
Increased Hydrogen in syngas Deactivated by coke, sintered by ash
Operating Conditions and Process Challenges: Table (1) highlights the main operating parame-ters. Broadly, there are two types of gasifiers, fixed bed and fluidized bed. Fixed bed gasifiers have
Final report • MIT - 2.62 - Fundamentals of Advanced Energy Conversion page 7

been traditionally used and operate at about 1000◦C. Fixed bed gasifiers are the most common smallscale-gasifiers and are predominantly updraft or downdraft gasifiers. Updraft gasifiers are counter-current gasifiers where the feedstock is loaded from the top while air is introduced from the bottom ofthe reactor. Thus, the feedstock typically undergoes the following processes (in order): drying, pyrol-ysis, reduction and combustion. As the air moves up, it carries the tar produced in the pyrolysis zoneupwards and since the temperature decreases moving upwards, the tar content freezes resulting in theproduction of gas with high tar content. On the other hand, in a downdraft gasifier, the feedstock isintroduced at the top, while air is introduced through the sides above the grate and the combustiblegas is withdrawn under the grate. As a result of this configuration, tar is effectively cracked as itmoves through the high temperature combustion zone. On the downside, the internal heat exchangeis not as efficient as in an updraft gasifier. In addition, fixed bed gasifiers are usually limited in scale(0.15-1 MWe) and must be fuel-optimized, making them rather fuel-inflexible [16]. Meanwhile, flu-idized bed gasifiers are fuel-flexible (catalysts can also be added) and are able to maintain uniformtemperature/mixture homogeneity by using high specific heat fluidizing media such as silica and alu-mina materials [15]. However, the upper limit on the temperature (800-1000 ◦C) is set by the meltingpoint of the bed material, which is also why these are unsuitable for coal gasification due to lowerreactivity of coal at temperatures less than about 1300 ◦C. Fluidized bed gasifiers and in particular,circulating beds, are ideal for fuel capacity higher than thermal 10 MW [16].
Supplying steam as a gasifying agent increases the partial pressure of water and hence, favorshydrogen formation (water-gas shift). The downside, however, is that this reaction is endothermic,requiring external or internal (via biomass oxidation) heat source or presence of catalysts to drivethe reaction forward. Recently, although not commercialized, gasification using plasma and super-critical water are also being explored as possible options since they also provide for effective wasteremoval [29, 30].
One of the biggest concerns with gasification systems is tar condensation at temperatures below450◦C which gets deposited along the piping walls and partly as an aerosol in the gas. The tar con-tent, thus, hinders the removal of particulate emissions as the subsequent utilization of the gas [31].The properties of this tar itself varies based on the operating condition; for instance, air gasificationproduces viscous tar, while steam gasification produces low-molecular-weight liquid tar [18]. Tarmay be cracked by operating the gasifier at elevated temperatures 900-1100◦C [24], but since thishigh temperature requires more combustion, the efficiency decreases and hence, catalysis at the usualgasification temperature 800-900◦C is preferred [16,18,22]. Another technique is to use electrostaticprecipitators to capture aerosols after cooling the gas to 60-80◦C [18, 31].
Applications: Some of the major (potential) applications of biomass gasification are :
• CHP: This has conventionally been the primary application for gasification. Several commer-cial plants have been set up ranging from 20 kW in the Amazon region (for local needs) [24] to6 MW electricity (+ 9 MW thermal) from wood chips in a village in Sweden [15]. Overall effi-ciencies of up to 35-40% have been reported [15,22]. Currently, India generates about 70 MWof electricity from small-scale biomass gasification systems (for example, Husk Power), whichis about 70% of the basic energy needs in the rural areas [24]. There are several studies in lightof this from both from the energetics as well as the economics point of view (e.g. [32, 33]).
• Hydrogen Production: Gasification can be used for producing hydrogen as a transportationfuel since it has better combustion properties than conventional fuels [16]. A combination ofcatalysts can be used to drive the water reforming and water-gas shift reaction (e.g. Cu-Zn)in favor of H2 and CO2 production. Subsequently, the CO2 may either be adsorbed (e.g. by
Final report • MIT - 2.62 - Fundamentals of Advanced Energy Conversion page 8
CaO) or sequestered downstream to yield pure hydrogen [22]. Compared to other techniquesfor hydrogen production, gasification remains a subject to ongoing research [24].
• Ethanol production: The biggest advantage of biological conversion over chemical catalysisis that most anaerobes are sulfur-tolerant (and hence, do not require expensive sulfur cleaningtechnology) and not sensitive to CO/H2 ratio (and hence, fuel flexible) [22]. However, the ma-jor challenge with this process is to increase the rate and yield of fermentation by increasinggas to liquid mass transfer of CO and H2 and to search for the right microbe having a highresistance to the other contaminants in syngas [15]. Similarly, there has also been considerableresearch in deriving biodiesel through Fischer-Tropsch Synthesis and bio-methanol [16]. Al-though these derived fuels are shown to be cleaner than their conventional counterparts, lowcost of petroleum-based feedstock makes their production uneconomical so far [15].
4.2 ThermochemicalAs we saw in the first phase of this study, the two main biochemical process for biomass to energyconversion are fermentation and anaerobic digestion. Fermentation require relatively simple carbo-hydrate chains to be effective, and lead then to a liquid fuel mainly ethanol. Fermentation of ligno-cellulosic material like the ones found in organic food waste is more complex as it require hydrolysisand other conditioning steps to increase fermentability. Fermentation of lignocellulosic material isstill in research and development. In contrast, anaerobic digestion is a well-established technologyand has been commercially proven. It is Suitable for small and large scale, rural and urban areas andknown to be attractive GHG mitigation option. A major advantage of anaerobic digestion in the spe-cific case of food waste is the presence of not only carbohydrates in the food waste but also proteinsand fatty materials all anaerobically biodigestable whereas during fermentation only carbohydrateare potentially processed. Anaerobic biodigestion has also advantages compared to composting asthe latter method’s output is predominately carbon dioxide which has no energy value. Moreover,cooked and oily food are suitable for biodigestion which is not the case for composting.
Table 2 shows the strengths and weaknesses for each of the main biochemical to energy conversionmethods (biodigestion and fermentation).
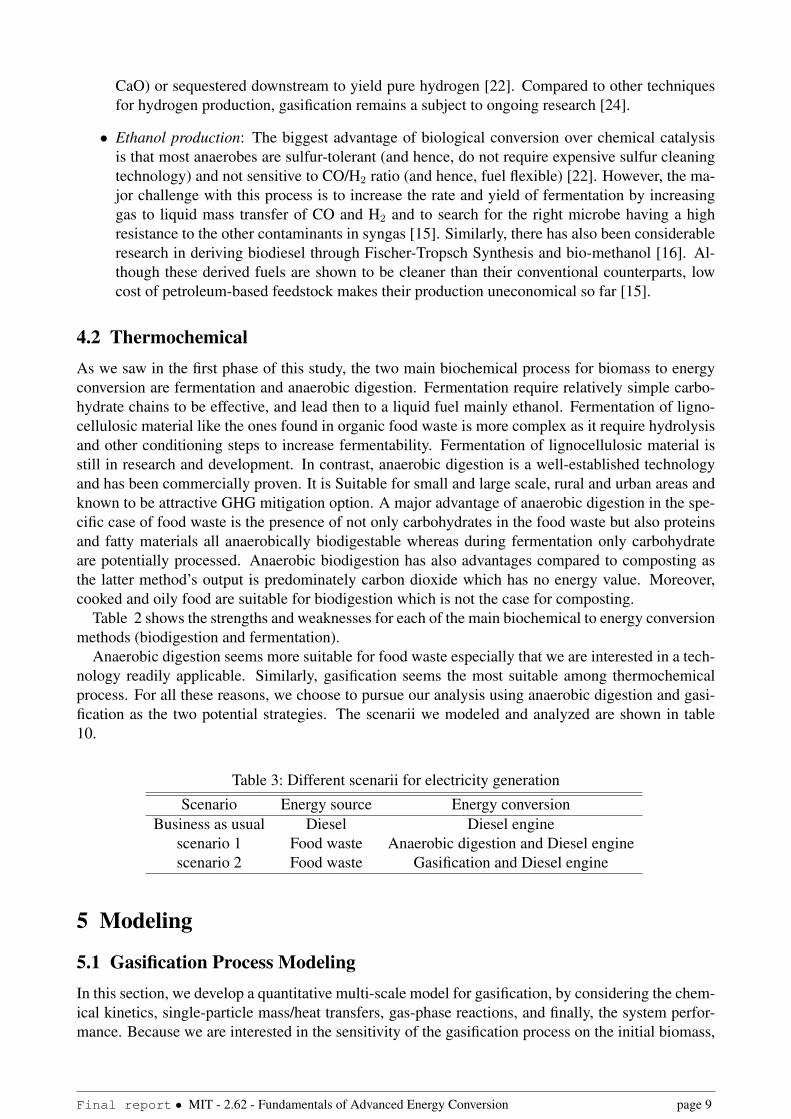
Anaerobic digestion seems more suitable for food waste especially that we are interested in a tech-nology readily applicable. Similarly, gasification seems the most suitable among thermochemicalprocess. For all these reasons, we choose to pursue our analysis using anaerobic digestion and gasi-fication as the two potential strategies. The scenarii we modeled and analyzed are shown in table10.
Table 3: Different scenarii for electricity generation
Scenario Energy source Energy conversionBusiness as usual Diesel Diesel engine
scenario 1 Food waste Anaerobic digestion and Diesel enginescenario 2 Food waste Gasification and Diesel engine
5 Modeling
5.1 Gasification Process ModelingIn this section, we develop a quantitative multi-scale model for gasification, by considering the chem-ical kinetics, single-particle mass/heat transfers, gas-phase reactions, and finally, the system perfor-mance. Because we are interested in the sensitivity of the gasification process on the initial biomass,
Final report • MIT - 2.62 - Fundamentals of Advanced Energy Conversion page 9

Table 2: Summary of biochemical biomass to energy conversionMethod Energy form Strength Weakness
Anaerobic Diges. Biogas - Well-established tech.- Commercially proven
- Widely applied forhomogeneous wet organicwaste streams and waste
water.
- To a lesser extent usedfor heterogeneous wetwastes such as organic
domestic wastes (sortingrequired)
- Suitable for small andlarge scale, rural and
urban areas.- Attractive GHGmitigation option
Fermentation (1st
gen.) Bioethanol- Straightforward sugar
fermentation- Competition with food
- If applied to organicwaste, only carbohydrate
will be converted- Varying GHG abatement
potentialFermentation
(Cellulosic-2nd
gen.)Bioethanol - Abundant resource
- Pretreatment andhydrolysis required
- Clear GHG abatementpotential
it will be important for us to predict, with reasonable detail, the major species that emerge from thegasifier. This necessitates the use of a detailed chemical kinetics mechanism. The results from thissensitivity study will be later used to model the larger gasifier system.
The reactor model—which incorporates the detailed kinetics and single-particle mass/energy trans-fer effects—roughly consists of two parts: the initial solid-phase drying and devolatilization reactions,and the latter gas-phase combustion and gasification reactions. In this section, we will describe thesetwo models separately as they primarily concern themselves with the different phases.
5.1.1 Gasifier Design
Considering the scale of operation (<20 kWe), an air blown downdraft gasifier is chosed for thepresent study. A typical downdraft gasifier and its schematic is shown in Figure (4). As was high-lighted before, the advantage of a downdraft gasifier is that the product gases leave the gasifier at ahigh temperature (800-1000◦C) enabling partial cracking of tars formed during gasification, however,at the cost of an efficiency penalty associated with the high heat content of the product gases [18]. Itspopularity can be gauged by various studies in literature using a huge range in feedstock includingwood [34, 36–39], sugarcane leaves [40] and sewage sludge [41] operating in the range 5 kWe - 80kWth.
Modeling : In general, there are two broad approaches for modeling fixed bed gasifiers: thermo-dynamic equilibrium models and kinetic models. Thermodynamic equilibrium models are based ona steady state analysis and hence, may not predict in good agreement with experiments for operating
Final report • MIT - 2.62 - Fundamentals of Advanced Energy Conversion page 10

Figure 4: Experimental facility [34] and schematic [35] of a typical downdraft gasifier
temperatures lower than 1000◦C, where reactions tend to be more kinetic controlled and hence, donot reach equilibrium. Other typical assumptions include [42]:
• Reactor is implicitly zero-dimensional
• Perfectly insulated apparatus i.e. heat losses are often neglected, although this can be easilyincorporated into the model
• Perfect mixing and uniform temperature throughout the gasifier, which is almost never possiblein practice
• Usually no information on the reaction intermediates is given
The equilibrium model assumes a given operating temperature and solves for the product compo-sition based on mass balance equations and thermodynamic equilibrium equations, including tem-perature dependent equilibrium constants for the water-gas shift and methane formation reactions.Additionally, empirical constants may be included to the equilibrium calculations to fit the modeloutput with experimental data (e.g. [43]). While typically not included, some studies (e.g. [44]) haveconsidered tar even though the composition and formation mechanism of tar are somewhat empirical.Considering the limited applicability of these models, thermodynamic equilibrium models are, thus,more suitable for parametric studies.
Meanwhile, kinetic models provide a more mechanistic insight into the conversion process. Whilethese rate models are accurate and detailed, the complete mechanism often needs to be simplified dueto computational constraints. Nevertheless, the char reduction process may be accurately determinedusing experimentally obtained rate expressions for short residence times of gas and biomass [42].Tinaut et al [39] analyzed the impact of biomass (pine bark) particle size and superficial gas veloc-ity on the steady state gasification process by implementing an exhaustive kinetic model includingboth the gas-phase and heterogeneous reactions in all the four gasifier zones. As a simplificationto the full-scale model, Giltrap et al [45] developed a model for the reduction zone in a gasifier byconsidering mass and energy balance along the reduction zone using four given parameters: gas con-centration and temperature into the reduction zone (from the combustion zone), char reactivity factor
Final report • MIT - 2.62 - Fundamentals of Advanced Energy Conversion page 11

(CRF) accounting for the porous structure, and hence, the reactivity of char and the pyrolysis fractionrepresenting the effective fraction of initial gas that comes from the pyrolysis and cracking reactions.Building onto this model, Babu and Sheth [46] assumed a variable CRF (linear and exponential de-crease) along the reduction zone to make the model more realistic as opposed to uniform CRF asimposed by Giltrap et al. Jayah et al [47] additionally used the flaming pyrolysis zone sub-model topredict the gas composition and temperature which was then fed as an input to the gasification zonesub-model. While a lot of these models are application specific and experimental data dependent,kinetic models, in general, are more flexible than equilibrium models.
For the present study, a single-particle model has been used for char devolatilization. For thegas-phase reactions, especially during combustion, we employed the Ranzi gas-phase model, whichconsists of 450 species and 16,000 reactions. This kinetic scheme was made into a Cantera object,which was manipulated in MATLAB in order to integrate into the gasification reactor. For the gasifi-cation process, in addition to the gas-phase reactions as described above, there are also heterogeneouschar-gas reactions. This is modeled in the Ranzi scheme [48] in Table 4 below.
Table 4: Heterogeneous char-gas reaction kinetic scheme, from [48]
Reactions Reaction rate (kmol s−1)Char + O2 → CO2 1.2× 10¹⁰ exp(−32000/RT ) [Char][O2]Char + 0.5 O2 → CO 2.5× 10¹¹ exp(−38200/RT ) [Char][O2]0.78
Char + H2O → CO + H2 2.5× 10⁹ exp(−52000/RT ) [Char]0.5[H2O]0.70
In the case above, [Char] refers to the ratio of the current char to the initial char concentration, so ithas a dimensionless range of between 0 and 1.
Choosing Parameters : The single particle model discussed above requires several input parame-ters so that the output gas composition can be calculated. This includes feedstock properties such asthe composition which are known a priori while the operating conditions including particle diameter,temperature profile in the zones and the solid and gas residence times need to be estimated based onstudies in literature. A compilation of some of the data presented in literature is presented in Table(5). While some data presented has been estimated / inferred based on the limited data providedin these studies and may not be accurate, these studies do provide a sense of typical data that maybe used to design a hypothetical gasifier operation. Moreover, the methodology used in the currentanalysis can be easily extended when more accurate data is obtained.
The parameters required for the kinetic modeling are:
• Reactor Geometry : Based on the dimensions of most small scale reactors (5 kWe - 80 kWth)reported in literature, the gasifier used in the present study has an internal diameter of 0.5 mand length of 1 m.
• Particle Diameter : In case of large biomass particles, the gasifier section must be long formaximum conversion while for smaller particles, faster consumption (higher throughput) ispossible [39, 47]. The disadvantage with smaller particles, though, is the higher cost requiredfor grinding upfront. Thus, the particle size is typically based on the gasifier size although thismust not exceed 1/8th of the reactor diameter to avoid bridging effects [41, 47]. Keeping thisin mind, the particle diameter used for this analysis is 5 cm, mainly to keep the grinding coststo a minimum considering the operating scale of this study.
• Input Moisture : Moisture content in the biomass affects both the gasifier operation as wellas the quality of the gas produced. This is because for higher moisture content the energy
Final report • MIT - 2.62 - Fundamentals of Advanced Energy Conversion page 12

Tabl
e5:
Sum
mar
yof
oper
atin
gco
nditi
ons
inlit
erat
ure
(est
imat
esha
vebe
enpr
ovid
edif
data
notd
irec
tlylis
ted)
Stud
yR
eact
orFe
edst
ock
d pR
esid
ence
Tim
eG
asC
ompo
sitio
n(%
vol)
(mm
)(m
m)
Gas
Solid
CO
H2
CO
2C
H4
N2
Exp
erim
ent
[38]
300x
1092
Ros
ewoo
d(4
9C+6
H+4
5O)
25.4
10-1
5s
10-1
5hr
15-2
27-
124-
81-
259
-68
[36]
2090
(ht)
Kik
erw
ood
365-
10s
7-15
hr18
-23
10-1
15-
2050
-65
[34]
600x
2000
Woo
d(4
7C+6
H+4
5O)
5010
-20
s2
hr23
-25
13-1
512
-14
2-3
44-4
6[4
0]30
0(I
D)
Suga
rcan
eL
eave
s(4
0C+6
H+4
7O)
10-1
0015
min
[41]
Sew
age
Slud
ge(4
0C+6
H+2
6O)
10-3
56-
119-
1111
-13
1-2
62-6
4
Mod
elin
g(E
quili
briu
m)
[43]
MSW
(51C
+7H
+40O
)18
-20
12-1
78-
121-
251
-60
[49]
Saw
dust
(52C
+6H
+42O
)20
1412
251
Mod
elin
g(K
inet
ic)
[39]
50x7
00Pi
neB
ark
(55C
+6H
+38O
)2-
195
s1
hr[4
5]D
ougl
asFi
rBar
k(3
5C+1
0H+5
5O)
23-2
510
-15
9-11
1-2
48-5
2[4
7]92
0x11
50R
ubbe
rWoo
d(5
1C+6
H+4
2O)
33-5
510
-15
hr18
-22
9-11
11-1
31-
250
-59
Final report • MIT - 2.62 - Fundamentals of Advanced Energy Conversion page 13

Figure 5: Effect of moisture content on the gasifier operating temperature and CV of the output gas[43]
requirement for drying increases which leads to a decrease in the gasifier operating temperature.In other words, with a higher moisture content, more air must be pumped in to maintain theoperating reaction temperature reducing the mole fraction of the useful gases and hence, thecalorific value. Jarungathammachhote and Dutta [43] used a modified equilibrium model tostudy the impact of moisture on the gasification of MSW in Thailand on both the operatingtemperature as well as the calorific value of the output gas, as shown in Figure (5). Based ontheir study as well as other reported literature, gasification of biomass with moisture contentmore than 40% is considered infeasible although in practice, it is usually less kept below 20%on a dry basis [38, 39, 43, 44, 47]. For the present study, the biomass entering the gasifier has15% moisture (wet basis) and any additional moisture is removed using an external dryer.
• Residence Time : The residence time of the gas and solid phases was decided based on liter-ature values. As can be seen in Table (5), the biomass / char residence time is typically in theorder of hours while the gas residence time is much smaller (in seconds). Note that the val-ues presented are only estimates and an accurate residence time, especially for gas / volatiles,can only be known if the exact experimental details regarding the geometry and the flow areknown. For the present study, the solid and gas residence time have been fixed as 8 hrs and 4 srespectively.
• Temperature Profile : In the gasifier, peak temperature is achieved in the combustion zonewhere oxygen is supplied for partial combustion of the fuel to meet the energy requirementsof the bed (gasification reactions are endothermic). While the combustion zone temperatureitself depends on the equivalence ratio, the temperature in this zone is typically around 1000◦C.Similarly, as reported in literature, typical temperatures in the drying, pyrolysis and gasificationzones are 200◦C, 400-500◦C and 700-900◦C respectively [38, 41, 50]. For the present study,a temperature profile is required as an input to evaluate the heat transfer in the single particlemodel. Therefore, as a first approximation, the gasifier has been primarily divided into twosections: (a) drying + pyrolysis zone at an average temperature of 400◦C and (b) reductionzone at an average temperature of 800◦C. The drying-pyrolysis zone has been fixed to be 0.6m long, while the reduction zone occupies the bottom 0.4 m of the bed. The length of thesezones should be verified post simulation to ensure that the drying-pyrolysis and reduction zonesare long enough for the respective products to reach quasi-steady state. If this is not the case,several iterations will be required, as demonstrated in [47]. Meanwhile, combustion is assumedto take place in a narrow zone (∼ 1 mm) between these two sections at a temperature of 1000◦C
Final report • MIT - 2.62 - Fundamentals of Advanced Energy Conversion page 14

Figure 6: Effect of Equivalence Ratio on various operating conditions [38]
and as in the case of the other zones, it must be ensured that with the given gas and solidresidence times, the oxygen supplied (in the air) is consumed completely before the gas / charenter the reduction zone.
• Equivalence Ratio : As mentioned before, since the gasification reactions are overall endother-mic, some fuel must be burnt in air to meet the energy requirements of the gasifier unit. Theflow rate of air pumped in is usually represented by the equivalence ratio φ given in terms ofthe air-fuel flow ratio A/F as
φ =(A/F )actual(A/F )stoich
(4)
Thus, gasifiers usually operate with φ < 1 (fuel rich). While the actual value of φ employeddepends on the feedstock and the absolute flow rates, a range of 0.25-0.5 is reported in literature[24, 39, 51]. Typically, for a given geometry and biomass flow rate, the equivalence ratio isoptimized as shown in Figure (6). An initial increase in φ results in an increase in the CO2
production in the combustion zone which results in an increase in the formation of CO andH2 in the reduction zone and hence, an increase in the CV of the gas. At higher values of φ,however, CO2 starts to accumulate in the system resulting in a lower CV of the gas. WhileSheth and Babu [38] determine the optimal ER to be 0.205, other optimal values reportedin literature include 0.276 [41] and 0.388 [34], highlighting the range of optimal ER that ispossible. For this study, the ER ratio has been set as 0.2, though ideally, this must be optimized.
Gasifier Heat Requirement : While the oxygen (air) supplied must ideally be sufficient to meetthe heat requirements of the gasifier, an alternate approach is to burn less biomass but supply externalheat. Using this approach has a two-fold advantage: the producer gas has less Nitrogen content (andhence, a higher mole fraction of combustible gases CO and H2) while it also provides an avenue touse the excess sensible heat (high quality) of the producer gas (or engine exhaust) effectively. How-ever, such an approach may make the system layout complicated and hence, may not be feasible froma practical perspective.
In order to calculate the heat requirement of the gasifier (overall gasification reactions are endother-mic), the gasifier unit is treated as a black-box and an enthalpy balance is performed between the inletand outlet streams to determine the heat requirements of gasifier, in addition to the heat supplied bypartial combustion of biomass. The calculation has been performed in EES and the code has beenattached in the Appendix for reference. The steps in this calculation are:
1. The exit gas / char composition is calculated based on the Cantera single-particle model.
2. Based on the ultimate analysis of the biomass feedstock, its formula is determined as CH1.58O0.45N0.02S0.01.Mass balance across the gasifier is used to calculate the char composition.
Final report • MIT - 2.62 - Fundamentals of Advanced Energy Conversion page 15

3. The HHV of biomass and char is evaluated using the Boie equation [52] following which theheat of formation at standard condition is calculated based on the enthalpy of the followingreaction [53]
CHxOy(s) +
(2 + x/2− y
2
)O2(g)→ x
2H2O(l) + CO2(g) (5)
4. Since the gasifier output is at 800◦C, the enthalpy of char at the gasifier temperature is obtainedusing h0
f + Cp∆T , where the average specific heat capacity Cp between standard condition andthe gasifier temperature and is evaluate using the expression in [53]
5. Finally, the heat required by the gasifier is simply the enthalpy difference between the reactants(biomass + moisture + air) and the products (gas + char) and is 8.33 kW for the present study.
5.1.2 Drying and Pyrolysis
In the first stage of the process (the first 60 cm of the reactor), we describe the devolatilization of thebiomass. In this section, we assume that the air is inert, such that no oxygen is present. While thisinertness is in practice is difficult to achieve completely, our gasifier design—with only the solid feedand without an air stream from the top of the reactor—at the least emulates this condition.
Mass Balance In our case, because the biomass particles are ground to a size of 5 cm immediatelybefore gasification, it will be important to consider the conductive/convective effects within the par-ticle. To do so, we utilize a single biomass particle model described in Bates and Ghoniem [53]. Inthis model, the solid-phase mass balance for ith species is described by
∂ρi∂t
+ ~∇ · (ρi~vi) = wi. (6)
It was noted by Bates and Ghoniem, by a scaling analysis within the single particle, that once de-volatilized, the gas quickly convects out of the particle, and therefore we neglect the diffusion terminside the particle. Assuming no net accumulation of devolatilized gas, we have, for the gas phase,
~∇ · (ρi~vi) = wi. (7)
Assuming radial symmetry and integrating both sides, we obtain
ρivi =1
rn
∫ r
0
r′nwi(r′)dr′, (8)
where n reflects the geometry of the particle: it is 0 for a flat plate, 1 for a long cylinder, and 2 for asphere. In our case, we assume that our particles are spheres.
Energy Balance With radial symmetry and incompressible flow, we can write the energy balanceas: ∑
i
cp,iρi∂T
∂t=∂T
∂r
(∂〈k〉∂r
+n〈k〉r−∑i∈Gas
ρivi
)+ 〈k〉∂
2T
∂r2−∑i
wiHi. (9)
Assuming known reactor temperature Treact = 400◦C, the boundary conditions are given as follows:
Final report • MIT - 2.62 - Fundamentals of Advanced Energy Conversion page 16

T (r, 0) = T0, (10)∂T
∂r
∣∣∣∣r=0
= 0, (11)
∂T
∂r
∣∣∣∣r=R
= hc(Treact − T ) + ωσ(T 4react − T 4), (12)
where the first right-hand term of Eqn. (12) reflects convection, and second right-hand term reflectsradiation at the surface of the biomass particle. Therefore, hc refers to the convective heat transfercoefficient, ω the emissivity coefficient, and σ the Stefan-Boltzmann constant.
Devolatilization Kinetics For the kinetics of the solid-phase devolatilization reaction, we utilizedthe Ranzi mechanism as described in [48]. In this mechanism, the biomass is considered to be madeup of lignin, hemicellulose, and cellulose components, each undergoing a different set of devolatiliza-tion reactions. For example, cellulose first decomposes into activated cellulose, which then followstwo different pathways of different kinetic rates to form large organic molecules or to form water andchar. This 25-reaction, 45-species mechanism was programmed into Cantera, which ran on MAT-LAB in order to predict the dynamics of the devolatilization process. This mechanism is also able topredict the heat of reaction. In fact, when run at a surrounding temperature of 400◦C, we determinedthat the reaction is slightly endothermic, at 776.87 kJ/kg of biomass.
Drying Kinetics Because drying is an important first step of the gasification reaction, we alsosought to describe the process in reasonable detail by using an existing MATLAB model developedby Kevin Kung as part of his thesis research for thermally thick biomass.
In this model, drying is considered as the conversion of water from the ”bound” to the ”unbound”state:
H2O(b) −→ H2O(ub). (13)
The rate of drying is related to the amount of energy available. In other words, once the temperaturehas reached the local bound water-vapor equilibrium at temperature T = TVap(ρb) (using experi-mentally measured correlations such as [54]), any excess energy flowing into the locality is used toevaporate water, before causing any further temperature rise:
∂ρb
∂t=
1
∆HVap
max
(0, ~∇ · (keff
~∇T )− ~∇ · (Tcp,ub~Φub)
), T > TVap(ρb). (14)
This model found a reasonable fit with the experimental biomass drying data from Alves and Figueiredo[55], as well as from van der Stelt [56].
5.2 Biodigestion Process ModelingModeling a biodigestion system can be very complex but a minimum of three steps have to always beaccounted for. First, the pre-treatment of the biomass prior to digestion. Many pretreatment methodsexist as we will see later, but one of the main goals is to increase the surface area and the availability ofthe biomass for digestion, i.e. breaking large carbohydrate polymer to simpler sugars. This biomassconditioning is followed by the biodigestion step itself. Finally, a gas separation step is required toremove toxic and corrosive H2S as well as the water contained in the biogas.
Final report • MIT - 2.62 - Fundamentals of Advanced Energy Conversion page 17
5.2.1 Pretreatment
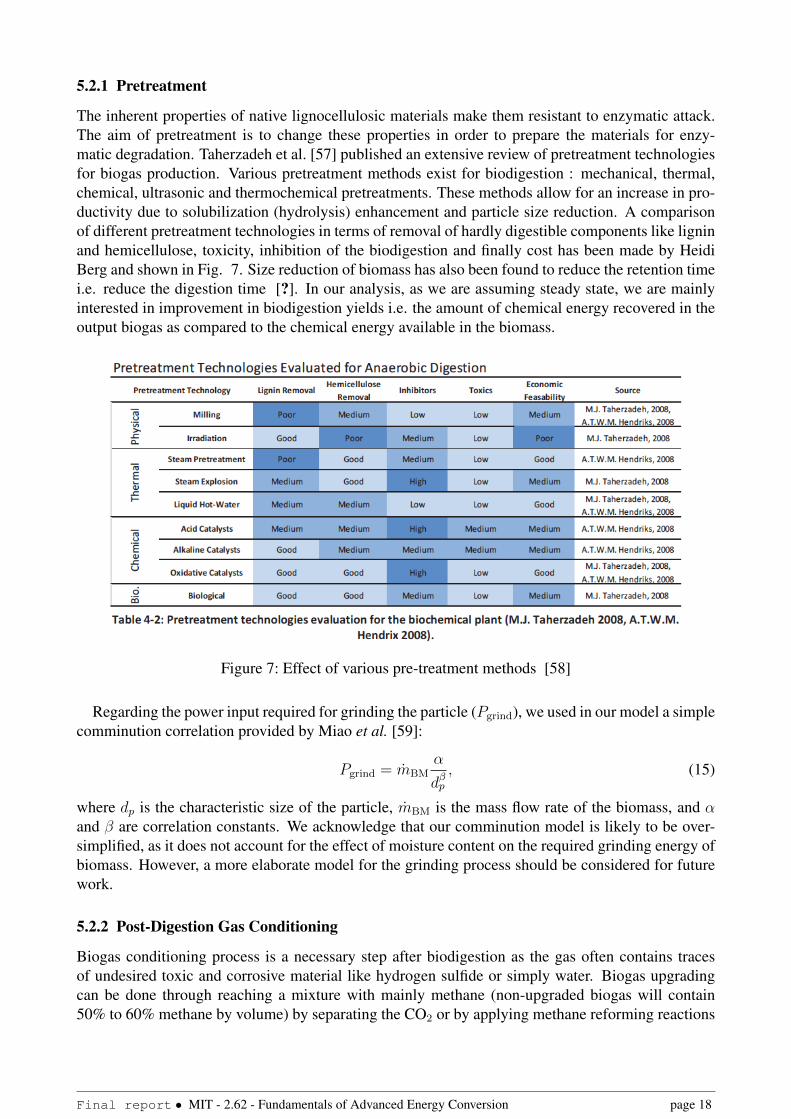
The inherent properties of native lignocellulosic materials make them resistant to enzymatic attack.The aim of pretreatment is to change these properties in order to prepare the materials for enzy-matic degradation. Taherzadeh et al. [57] published an extensive review of pretreatment technologiesfor biogas production. Various pretreatment methods exist for biodigestion : mechanical, thermal,chemical, ultrasonic and thermochemical pretreatments. These methods allow for an increase in pro-ductivity due to solubilization (hydrolysis) enhancement and particle size reduction. A comparisonof different pretreatment technologies in terms of removal of hardly digestible components like ligninand hemicellulose, toxicity, inhibition of the biodigestion and finally cost has been made by HeidiBerg and shown in Fig. 7. Size reduction of biomass has also been found to reduce the retention timei.e. reduce the digestion time [?]. In our analysis, as we are assuming steady state, we are mainlyinterested in improvement in biodigestion yields i.e. the amount of chemical energy recovered in theoutput biogas as compared to the chemical energy available in the biomass.
Figure 7: Effect of various pre-treatment methods [58]
Regarding the power input required for grinding the particle (Pgrind), we used in our model a simplecomminution correlation provided by Miao et al. [59]:
Pgrind = mBMα
dβp, (15)
where dp is the characteristic size of the particle, mBM is the mass flow rate of the biomass, and αand β are correlation constants. We acknowledge that our comminution model is likely to be over-simplified, as it does not account for the effect of moisture content on the required grinding energy ofbiomass. However, a more elaborate model for the grinding process should be considered for futurework.
5.2.2 Post-Digestion Gas Conditioning
Biogas conditioning process is a necessary step after biodigestion as the gas often contains tracesof undesired toxic and corrosive material like hydrogen sulfide or simply water. Biogas upgradingcan be done through reaching a mixture with mainly methane (non-upgraded biogas will contain50% to 60% methane by volume) by separating the CO2 or by applying methane reforming reactions
Final report • MIT - 2.62 - Fundamentals of Advanced Energy Conversion page 18

for example, which is the conversion of methane to carbon monoxide and hydrogen (syngas) by theaddition of steam.
The removal of unwanted contaminants from the biogas can be done using different technologies.All these can be categorized as following: Absorption, adsorption, permeation and cryogenic. Themost applied technologies in anaerobic digestion and gasification systems are scrubbing, physicaland chemical absorption [58]. In our model, traces of hydrogen sulfide must be separated. For thepower input Pscrub required for gas scrubbing, we estimated the minimum work of separation as:
Pscrub = −nRT(X lnX + (1−X) ln(1−X)
), (16)
where X denotes the mole fraction of the species to be scrubbed in the overall gas phase, and n isthe mole flow rate of the gas phase. In reality this minimum work is not achievable and we assumeda second law efficiency ηII = 20%.
5.2.3 Biodigestion Method
For this project, we choose the most mature, proven and low cost methods since the goal is to assessthe feasibility of a biogas plant in Nigeria today. We choose wet fermentation in the vertical con-tinuously stirred tank fermenter (stirring energy not modeled) as it is the most conventional reactorset-up used for wet fermentation ( implemented in Germany in approximately 90% of its modern bio-gas plants), despite some recently highlighted limitations including difficulty in achieving completemixing, high energy requirements associated with mixing, and disruption of microbial consortia bymixing (other methods include plug flow reactors and batch reactors).
There are several methods of anaerobic digestion, but for food waste, studies have shown thatmesophilic is the most stable. Thermophilic digestion allows for faster methane extraction and there-fore has a lower substrate retention time and can be considered in situations where size is a restriction,but has been shown not to be as stable and more sensitive to input composition when dealing withfood waste [60].
In order to estimate the biogas yield for food waste, four different methods are usually undertaken:
1. If the ultimate analysis of the feedstock is available, a global reaction (Buswell Equation(1952)) can be used to find the final composition of the biogas. Since only a portion of thebiomass can be broken down, a biodigestion efficiency has to be assumed in order to estimatethe biogas yield.
2. In some cases, the exact atomic composition of the feedstock is not known and only the break-down in term of carbohydrates, fats and proteins is known. These are usually difficult to mea-sure for highly heterogeneous waste like organic food waste. Assumptions on an average chem-ical formula for different components lead in turn to estimate yields and compositions, whenassuming a biodigestion efficiency that can be different for carbohydrates, protein and lipids.
3. Advanced mathematical and chemical models to predict yields and compositions of the biogasproduced exist. The most advanced and commonly referred to is the Anaerobic DigestionModel 1 or ADM1. ADM1 is based on differential and algebraic equations governing thebiochemical kinetic processes. The use of advanced model like ADM1 requires an extensiveand precise knowledge of the anaerobic digestion biochemistry and models separately the fourphases of the process: hydrolysis, acidogenesis, acetogenesis and finally methanogenesis.
4. One can build correlations for biodigestion yield and compositions based on available exper-imental data. However, for the specific case of food waste, the composition of the feedstockmay vary considerably from a region to another, or even from a household to another within
Final report • MIT - 2.62 - Fundamentals of Advanced Energy Conversion page 19

the same area. The use of this method could be used as a way to check order of magnitudes ofobtained yields.
In this project, we chose to proceed using a combination of the first and fourth methods for biodi-gestion yield and composition estimation. We first used published ultimate analysis for food wastein Lagos ?? to find the composition and yield. This was compared to a basket of different biomasssources likely to be part of residential food waste. Statistics obtained using this basket is used for asensitivity analysis. The values obtained are cross-checked against experimental data gathered fromliterature for organic food waste.
5.3 Diesel Engine Modeling5.3.1 Diesel Engine Retrofit
Gaseous fuel can be used in both spark ignition (SI) and compression ignition (CI) engines withappropriate relatively simple conversion [61]. In an SI engine one can operate on 100 per centbiogas or syngas, since the spark ignites the gaseous fuel/air mixture. However in a diesel engine,the gaseous fuels usually have a large octane numbers compared to conventional liquid fuels, andtherefore, a high resistance to auto-igniting and knocking, hence suitable for engines with relativelyhigh compression ratio. Since the gaseous fuel will hardly auto-ignite, a pilot diesel injection isrequired (between 10% and 20% depending on the load) acting as an ignition energy source. Usuallydual-fuel (gaseous fuel and diesel) engines have the gaseous fuel mixed with the air in the enginecylinders, either through direct mixing in the intake manifold with air or through injection directlyinto the cylinder. The resulting mixture after compression is then ignited through the injection of asmall amount of diesel fuel (the pilot) in the usual way. Using gaseous fuels in a dual mode dieselengine can be done without significant efficiency drop. In some instances improvements in both workoutput and efficiency have been reported [62].
In the case of biogas and syngas, outputs of biodigestion and gasification respectively, the gaseousfuel added to the diesel has a lower heating value per unit mass compared to pure methane due in thefirst case to the large amount of CO2 and in the second case to the present of CO in the syngas, fuelwhich is already partially oxidized, hence its lower heating value per unit mass.
5.3.2 Flowsheet
For the modeling purpose, we assumed an idealized diesel cycle consisting of an isentropic com-pression, followed by isobaric combustion, isentropic expansion, and finally isochoric exhaust. Thecompression ratio of the diesel engine V1/V2 is assumed to be 20, which is within the nominal designrange. We first note that the isobaric combustion is a conservative estimation. In reality, we expectthe pressure to rise in the combustion chamber (as the volume also expands). Then due to the higherpressure, there will be more work that can be extracted during the expansion stroke of the engine.However, modeling the relationship between pressure and volume during the combustion process inASPEN Plus is non-trivial, so here within the scope of this project, we simply take the conservativeestimate but note that in reality, the amount of work can be increased.
We also note that there are two possible modes of running a diesel cycle. The first mode, whichis common for liquid diesel, is to first compress the air only, and then inject liquid diesel dropletsafter the compression stroke, so that the fuel auto-ignites due to the heat. Then both the air and fuelexpand and are exhausted. The second mode, which is more common for gaseous fuels, is to pre-mixair and fuel before the compression, and go through the whole cycle without adding additional fuelsto the engine.
In the ASPEN Plus flowsheet, we will simulate both modes of operation, as shown in Fig. 8.However, for the base case simulation, we will choose the first mode of operation (inject fuel after
Final report • MIT - 2.62 - Fundamentals of Advanced Energy Conversion page 20

compression) due to two reasons. Firstly, in the current Lagos community, there are already opera-tional diesel engines, which run on diesel (and thus inject the fuel after the compression stroke). Thepoint of the biodigestion/gasification intervention is to provide an alternative energy source withoutneeding to extensively retrofit the current diesel engine design. If we change the way the fuel is in-jected into the engine, this may necessitate additional investment, so before we propose this change,we want to compare the performance of the two modes of operation first. Secondly, with both biogasand syngas, it will be necessary to mix the fuel with about 10% diesel in order to ignite the mixture.However, as we are primarily interested in modeling the energy balance from the gasification andbiodigestion processes, we do not account for this 10% diesel in our flowsheet energy balance.
Figure 8: Flowsheet modeling of the diesel engine
5.4 System Modeling
Figure 9: Flowsheet modeling of the biodigestion system (blue) and gasification system (red) in AS-PEN Plus.
In order to interrogate the relative performance of gasification and biodigestion of municipal wastefrom the systems perspective, it is necessary for us to construct a flowsheet model to understand theoverall energy balance and efficiencies. As shown in Fig. 9, the biodigestion system is modeled asa series of biodigester, scrubbing mechanism, and diesel engine. Likewise, the gasification system ismodeled as a series of dryer, gasifier, and cooling components. Not shown in the flowsheet are energycalculations related to preparing and grinding the biomass to the suitable size for either process. Oncesyngas or biogas is produced, this fuel is then fed into the diesel engine, which is a sub-model of thesystem flowsheet.
Final report • MIT - 2.62 - Fundamentals of Advanced Energy Conversion page 21

6 Results: Process Modeling
6.1 Gasification Process Results6.1.1 Base Case Results
First we establish the results for the base case scenario. In this scenario, to simplify the problem, weassume that the temperature profile along the length of the reactor is known. In the drying/pyrolysiszone (0.6 m), the temperature is assumed to be held constant at 400◦C whilst solid-phase devolatiliza-tion takes place. Fig. 10 shows the solid-phase devolatilization process as a function of the reactorlength, in the initial drying/pyrolysis zone at the top of the gasifier. In the different panels of thefigure, we plot the different quantities such as the intra-particle temperature, moisture content, totaldevolatilized gas yield, and the yields of some important gas species. The different lines show theprofiles at different points inside the particle: at the core, 2.5 mm from the core, and at the surface (5mm).
As shown in all panels, there is delayed drying and devolatilization at the particle core, which isexpected due to the fact that the thermally thick nature of the biomass particles will require time forheat transfer into the solid. This timescale is around a few minutes, or in terms of the reactor length,5 cm (about 5% of the total length), which is relatively minor compared to the total residence time(hours) of the solid phase in the reactor.
Furthermore, panels (d) through (f) show the dynamics of the devolatilized species—CO, methanol,and carbon dioxide. We observe that while CO and CO2 have a relatively transient devolatilizationdynamics (i.e. all these species have completed devolatilization quickly), species such as methanolhas a much longer timescale for devolatilization. In the Ranzi kinetic scheme, this is due to the ex-istence of so-called ”trapped species”: partially devolatilized molecules which are still bound to thesolid phase, but which takes a much longer timescale to be released in the gaseous phase.
At the end of the solid devolatilization phase at 400◦C, we transferred all the devolatilized gasspecies into a new Cantera object programmed to perform the gas-phase Ranzi kinetic mechanism.We assume that the combustion zone is very thin (around 1 mm in axial thickness), the tempera-ture of the combustion zone is constant at 1000◦C, and that air (O2 and N2) is being supplied at anair/fuel equivalence ratio of 0.2. The injected air is designed to provide a limited extent of exother-mic combustion, and the heat of reaction is used to both heat up the biomass as well as to drive theendothermic component of the gasification reaction. These assumptions are consistent with typicalgasification values found in the literature and existing designs.
Fig. 11(a) illustrates the evolution of the major gaseous species (hydrogen, carbon dioxide, CO,oxygen, and methane) as a function of reactor length. As we can see, at the high temperature, thelean oxygen becomes consumed immediately, and the other species evolve in a correspondingly shorttimescale of around 0.3 s (or about 0.1 mm in the reactor length). Because the burning is lean,we have a preferential production of CO over CO2, which is what we want for the ensuing syngasproduction.
Once combustion is complete, the next zone is the reduction zone. Here, we once again assumea known temperature profile of a steady 800◦C over the whole length (0.3 m). In the reaction zone,two types of reactions will occur: the homogeneous gas-phase reactions, as well as the heterogeneouschar-gas reactions. While the Ranzi mechanism gives a detailed account for both, it is unfortunate thatwe were unable to adapt the heterogeneous char-gas reaction kinetics into Cantera object, becauseas shown in Table 4 previously, the char reaction rates have fractional power dependencies on thegaseous species, and in Cantera there is no feasible way to specify these fraction power coefficients.Instead, we first completely ignore the heterogeneous reactions, and focus our attention on the gas-phase reactions first.
Fig. 11(a) illustrates the time evolution of the major gas species (hydrogen, carbon dioxide, CO,oxygen, and methane) inside the reduction zone due to the Ranzi gas-phase reactions only. We see
Final report • MIT - 2.62 - Fundamentals of Advanced Energy Conversion page 22

0 0.05 0.1 0.15 0.20
50
100
150
200
250
300
350
400
450
Reactor length / m
Te
mp
era
ture
/ ° C
(a) Intraparticle temperature profile
Partcle core
R = 2.5 mm
Particle surface
0 0.05 0.1 0.15 0.20
0.005
0.01
0.015
0.02
0.025
0.03
0.035
0.04
0.045
0.05
Reactor length / m
CO
ma
ss f
ractio
n
(d) CO yield in gas phase
Partcle core
R = 2.5 mm
Particle surface
0 0.05 0.1 0.15 0.20
0.02
0.04
0.06
0.08
0.1
0.12
0.14
0.16
0.18
0.2
Reactor length / m
Mo
istu
re m
ass f
ractio
n (
we
t b
asis
)
(b) Intraparticle moisture profile
Partcle core
R = 2.5 mm
Particle surface
0 0.05 0.1 0.15 0.20
0.5
1
1.5
2
2.5
3
3.5
4
4.5
5x 10
−3
Reactor length / m
CH
3O
H m
ass f
ractio
n
(e) CH3OH yield in gas phase
Partcle core
R = 2.5 mm
Particle surface
0 0.05 0.1 0.15 0.20
0.1
0.2
0.3
0.4
0.5
0.6
Reactor length / m
De
vo
latiliz
ed
ma
ss f
ractio
n
(c) Total devolatilized gas yield
Partcle core
R = 2.5 mm
Particle surface
0 0.05 0.1 0.15 0.20
0.02
0.04
0.06
0.08
0.1
0.12
Reactor length / m
CO
2 m
ass f
ractio
n
(f) CO2 yield in gas phase
Partcle core
R = 2.5 mm
Particle surface
Figure 10: Simulation results of solid-phase devolatilization from 10-cm-diameter single-particlemodel based on the Ranzi pyrolysis kinetics [48], as a function of reactor length. (a)Intra-particle temperature profile, (b) intra-particle moisture profile, (c) total devolatilizedgas yield, (d) CO yield in the gas phase, (e) methanol yield in the gas phase, and (f) carbondioxide yield in the gas phase. The blue solid lines denote profiles at the particle center;red dashed lines, at a distance 2.5 cm from the center; and black dash-dotted lines, at theparticle surface (5 cm from the center).
Final report • MIT - 2.62 - Fundamentals of Advanced Energy Conversion page 23

0.6 0.6002 0.6004 0.6006 0.6008 0.6010
0.05
0.1
0.15
0.2
0.25
0.3
0.35
0.4
Reactor length / m
Ga
s−
ph
ase
ma
ss f
ractio
n(a) Major gas species in the combustion zone
H2
CO2
COO
2
CH4
0.7 0.75 0.8 0.85 0.9 0.95 10
0.05
0.1
0.15
0.2
0.25
0.3
0.35
0.4
Reactor length / m
Ga
s−
ph
ase
ma
ss f
ractio
n
(b) Major gas species in the reduction zone
H2
CO2
COO
2
CH4
Figure 11: Simulation results of gas-phase reactions based on the Ranzi kinetics scheme [48], as afunction of reactor length. (a) Major gas species inside the combustion zone, and (b)major gas species inside the reduction zone, before accounting for heterogeneous charreactions. The equivalence air/fuel ratio is set to 0.2 at the beginning of the combustionzone.
that, in the absence of oxygen, very little is happening to the species: barring from the initial transientchange in the species concentrations (presumably due largely to the changed temperature and thusequilibrium), for the remaining part of the reduction zone, the relative abundance of these major gasspecies remains more or less constant.
This observation does somewhat simplify the problem of the heterogeneous char-gas reactions forus. If it is true that not much is happening in the gas phase, perhaps we can reasonably decouplethe homogeneous gas-phase reactions from the heterogeneous reactions (with some caveats to bedescribed later).
For the heterogeneous reactions, we have three competing char reactions. Based on the flow rate ofthe gas phase and the approximate residence time, we first calculated the effective molar concentra-tions of the relevant gas species based on the results from the gas phase reactions: [O2]≈ 1.9×10⁻¹¹
kmol/m3, [H2] ≈ 2.6× 10⁻³ kmol/m3, [H2O] ≈ 2.0× 10⁻³ kmol/m3, [CO] ≈ 3.1× 10⁻³ kmol/m3,and [CO2]≈ 6.2×10⁻⁴ kmol/m3. To estimate the effective concentration of char, we take the knownmass flow rate of char, multiplied by the carbon elemental composition (around 60%), and adjustedproperly for the solid-phase residence time, which is known. This gave us an approximation of [Char]≈ 14 kmol/m3. So as we can see, char is in great excess compared to the other gaseous species. Sofor the reactions described in Table 4, we simply assume that all the reactions are zeroth order withrespect to char, and set [Char] ≈ 1.
This simplification effectively reduces our rate equations to the following type:
d[X]
dt= −k[X]γ, and (17)
d[Y ]
dt= k[X]γ. (18)
where [X] refers to the concentration of the relevant gaseous species, and [Y ] refers to a product as aresult of the consumption of X . This system of equations actually has an analytical solution. For thefirst differential equation, integrating both sides and setting the initial condition [X](t = 0) = [X]0,we arrive at the following implicit expression:
1
1− γ
([X]1−γ − [X]1−γ0
)= −kt, γ 6= 1. (19)
Final report • MIT - 2.62 - Fundamentals of Advanced Energy Conversion page 24
Given a pre-calculated gas-phase residence time τres,gas = ρgasAreactLred/mgas, we can analyticallysolve for the final species concentration:
[X] =
([X]1−γ0 − (1− γ)kτres
) 11−γ
. (20)
Plugging this into the second differential equation, we obtain:
d[Y ]
dt= k
([X]1−γ0 − (1− γ)kt
) γ1−γ
. (21)
Integrating both sides and setting the initial condition [Y ](t = 0) = [Y ]0, we obtain:
[Y ] = [X]0 + [Y ]0 −(
[X]1−γ0 − (1− γ)kτres
) 11−γ
. (22)
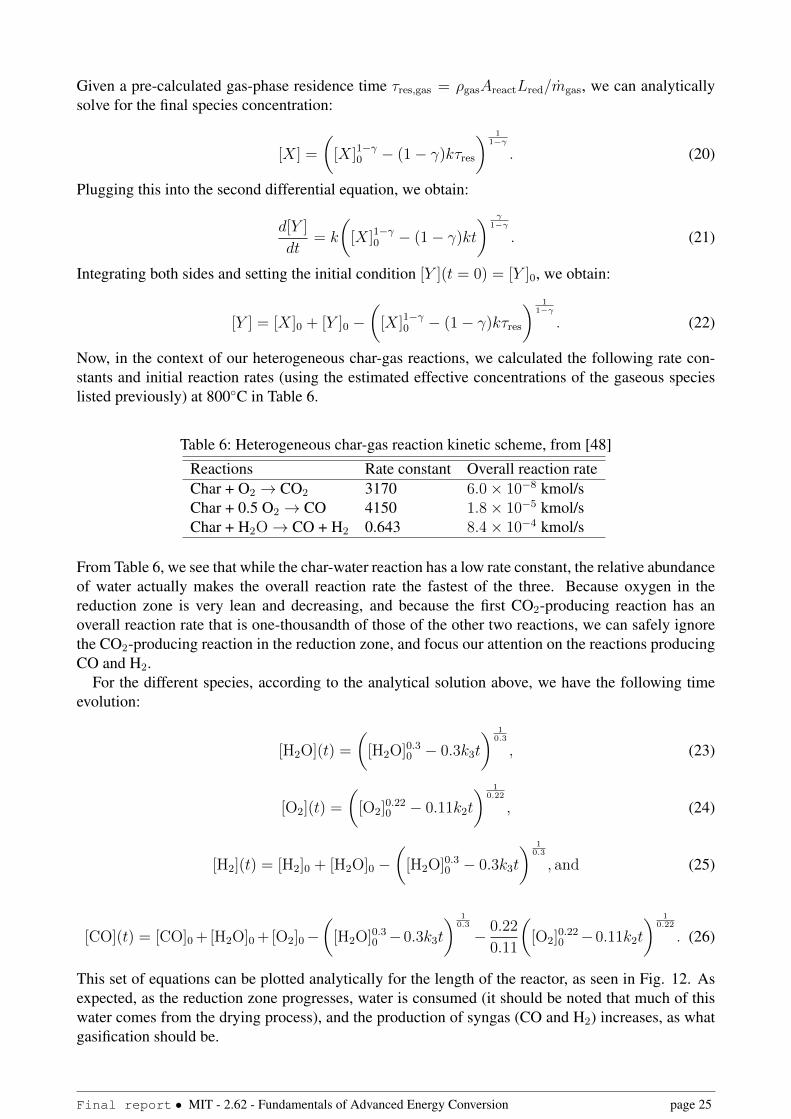
Now, in the context of our heterogeneous char-gas reactions, we calculated the following rate con-stants and initial reaction rates (using the estimated effective concentrations of the gaseous specieslisted previously) at 800◦C in Table 6.
Table 6: Heterogeneous char-gas reaction kinetic scheme, from [48]
Reactions Rate constant Overall reaction rateChar + O2 → CO2 3170 6.0× 10⁻⁸ kmol/sChar + 0.5 O2 → CO 4150 1.8× 10⁻⁵ kmol/sChar + H2O→ CO + H2 0.643 8.4× 10⁻⁴ kmol/s
From Table 6, we see that while the char-water reaction has a low rate constant, the relative abundanceof water actually makes the overall reaction rate the fastest of the three. Because oxygen in thereduction zone is very lean and decreasing, and because the first CO2-producing reaction has anoverall reaction rate that is one-thousandth of those of the other two reactions, we can safely ignorethe CO2-producing reaction in the reduction zone, and focus our attention on the reactions producingCO and H2.
For the different species, according to the analytical solution above, we have the following timeevolution:
[H2O](t) =
([H2O]0.30 − 0.3k3t
) 10.3
, (23)
[O2](t) =
([O2]0.22
0 − 0.11k2t
) 10.22
, (24)
[H2](t) = [H2]0 + [H2O]0 −(
[H2O]0.30 − 0.3k3t
) 10.3
, and (25)
[CO](t) = [CO]0 +[H2O]0 +[O2]0−(
[H2O]0.30 −0.3k3t
) 10.3
− 0.22
0.11
([O2]0.22
0 −0.11k2t
) 10.22
. (26)
This set of equations can be plotted analytically for the length of the reactor, as seen in Fig. 12. Asexpected, as the reduction zone progresses, water is consumed (it should be noted that much of thiswater comes from the drying process), and the production of syngas (CO and H2) increases, as whatgasification should be.
Final report • MIT - 2.62 - Fundamentals of Advanced Energy Conversion page 25

0.6 0.65 0.7 0.75 0.8 0.85 0.90
0.01
0.02
0.03
0.04
0.05
0.06
0.07
0.08
0.09
0.1
Reactor length / m
Gas−
phase m
ass fra
ction
Molar flow rates in the reduction zone
COH
2
H2O
Figure 12: Evolution of the major gas species due to heterogeneous char reactions in the reductionzone of the gasifier. Blue solid line: CO; red dashed line: hydrogen gas; black dash-dottedline: water vapor. The species evolve at 800◦C.
Of course, our assumption of decoupling the gas-phase from the heterogeneous reactions is notcompletely valid, as it is well known that the consumption of water and the production of CO, H2
and CO2 will affect the equilibrium balance of the water-gas shift reaction (which is described in theRanzi gas phase mechanism). In fact, had we accounted for the water-gas shift reaction, we wouldexpect that due to decreasing water concentration, the equilibrium will favor the formation of moreCO and water. We acknowledge this error, but will leave further quantification of the water-gas shiftreaction to future studies.
Table 7: Major Species at the Outlet of the Gasifier, at 800◦C
Species Molar flow rate (mol s−1) Mole fraction Experimental (Arnavat [51])CO 0.0922 0.364 0.17-0.22H2 0.0813 0.321 0.12-0.20N2 0.0571 0.225 0.50-0.54CO2 0.0121 0.048 0.09-0.15H2O 0.0084 0.033 -C2H2 0.0013 0.005 -CH4 7.9782× 10⁻⁴ 0.003 0.02-0.03H 3.7357× 10⁻⁵ - -CH3 1.4837× 10⁻⁵ - -C2H4 1.4201× 10⁻⁵ - -C(char) 0.0483
At the outlet, we have the following major species shown in Table 7.1, and compare the mole frac-tions with an experimentally obtained dataset for woody biomass. As we can see, while the relativeCO/H2 fraction is within the range, the mole fractions of CO and H2 seem over-estimated, whilethe mole fractions of N2, CO2, and CH4, under-estimated. One potential reason for underestimatingnitrogen/carbon monoxide and overestimating syngas is that we are using much less air in the pro-cess. For example, while the air/fuel equivalence ratio used in our model is 0.2, the Arnavat studyused ratios ranging from 0.25 to 0.47 [51]. While we could have adjusted our Cantera parameters to
Final report • MIT - 2.62 - Fundamentals of Advanced Energy Conversion page 26

more closely resemble the Arnavat study, there are specific reasons why we decided not to do so, aswill be discussed later in the technical constraints in running a diesel cycle on syngas. Also, whileArnavat used primarily woody biomass in the gasification experiments, we used data from municipalsolid waste, which will have a different elemental composition and biomass structure, thereby givingdifferent relative yields. Finally, the underestimation of CH4 is likely due to ignoring the steam refor-mation reaction due to the way we modeled the gas-phase and heterogeneous reactions independently,the same way as we ignored the water-gas shift reaction.
6.1.2 Sensitivity of the Gasification Process on Biomass Types
One of our main motivations for developing a detailed chemical kinetics and reactor model for gasi-fication is that it will enable us to assess the sensitivity of gasification outputs as a function of thevariation in the inputs. As we know, different types of biomass have different ultimate/proximateanalysis values, as well as lignin-cellulose-hemicellulose contents. The Ranzi kinetic mechanism hasbeen shown previously (in Kevin Kung’s thesis research) to be generalizable to a diverse range ofbiomass types (with reasonable match to a variety of experimental data), insofar that the appropriateinput biomass characterization parameters be known accurately.
Given that the municipal solid waste is a composite of many different types of wastes, and itscomposition may fluctuate from day to day and season to season dependent upon what types ofbiomass is discarded int he neighborhood, we find it appropriate to undertake an investigation of howsensitive the gasifier output will be to such variations in the input feedstock.
In order to do so, we compiled a database of more than 200 biomass types from a diverse rangeof literature sources. We selected 15 biomass types where both the ultimate analysis and the lignin-cellulose-hemicellulose compositions are well known. These biomass types are: almond, bamboo,barley straw, beech wood, corncob, corn stover, eucalyptus, hazelnut, olive husk, poplar, sugarcanebagasse, switchgrass, tea waste, tobacco leaf, and wheat straw. We ran these different types ofbiomass under the same Ranzi kinetic mechanism and gasifier conditions as described in the basecase above. Fig. 13 illustrates the solid-phase devolatilization dynamics as a function of the reactorlength, and each different biomass type is shown as a line of different color and line style.
As observed, panels (a) and (b), which correspondingly show the temperature profile and the mois-ture content, have very little variation as a function of the different types of biomass. Panel (c), whichshows the total devolatilized gas mass fraction evolution, has a comparably wider spread, reaching arange of around 25%. In contrast, panels (d), (e), and (f)—which illustrate the devolatilization of spe-cific gas species—show a much more significant variation for different types of biomass. This trendmay at first seem disheartening, as the gasifier performance seems to vary drastically depending onthe biomass input. However, we need to examine further into how these different volatile gases reactin the ensuing combustion/reduction zones before arriving at a conclusive answer.
Fig. 14 shows the evolution of major gas species in the combustion zone of the gasifier, for fourdifferent types of biomass: almond, bamboo, sugarcane bagasse, and tea waste. Perhaps a bit surpris-ingly, we see that despite the wide variation in the solid-phase devolatilization as noted earlier, oncewe reach the combustion zone, all the devolatilized species seem to react with oxygen and give arelatively consistent output from biomass to biomass, with an error range of 3%. Therefore, we cameto the conclusion that despite the wide biomass-dependent variations in the different devolatilized gasspecies as observed in panels (d), (e), and (f) of Fig. 13, these variations tend to disappear. The onlybiomass-dependent variation in Fig. 13 that we should be concerned about is illustrated in panel (c),where the different types of biomass may give rise to different mass yield of gas. This will affect themass flow of the syngas in the final system per unit mass flow of biomass, and will therefore affectthe overall system performance.
Final report • MIT - 2.62 - Fundamentals of Advanced Energy Conversion page 27

0 0.05 0.1 0.15250
300
350
400
450
500
550
600
650
700
Reactor length / m
Pa
rtic
le c
ore
te
mp
era
ture
/ K
(a) Particle core temperature profile
0 0.05 0.1 0.150
0.01
0.02
0.03
0.04
0.05
0.06
0.07
Reactor length / m
CO
ma
ss f
ractio
n
(d) CO yield in gas phase
0 0.05 0.1 0.150
0.02
0.04
0.06
0.08
0.1
0.12
0.14
0.16
0.18
0.2
Reactor length / m
Mo
istu
re m
ass f
ractio
n (
we
t b
asis
)
(b) Particle core moisture profile
0 0.05 0.1 0.150
0.005
0.01
0.015
0.02
0.025
0.03
0.035
0.04
Reactor length / m
CH
3O
H m
ass f
ractio
n
(e) CH3OH yield in gas phase
0 0.05 0.1 0.150
0.1
0.2
0.3
0.4
0.5
0.6
0.7
0.8
Reactor length / m
De
vo
latiliz
ed
ma
ss f
ractio
n
(c) Total devolatilized gas yield
0 0.05 0.1 0.150
0.02
0.04
0.06
0.08
0.1
0.12
0.14
0.16
Reactor length / m
CO
2 m
ass f
ractio
n
(f) CO2 yield in gas phase
Figure 13: Simulation results of solid-phase devolatilization from single-particle model based onthe Ranzi pyrolysis kinetics [48] for different types of biomass, as a function of reactorlength. (a) Intra-particle temperature profile, (b) intra-particle moisture profile, (c) totaldevolatilized gas yield, (d) CO yield in the gas phase, (e) methanol yield in the gas phase,and (f) carbon dioxide yield in the gas phase. The different lines of different styles denotethe different types of biomass.
Final report • MIT - 2.62 - Fundamentals of Advanced Energy Conversion page 28

0.6 0.6002 0.6004 0.6006 0.6008 0.6010
0.05
0.1
0.15
0.2
0.25
0.3
0.35
0.4
Reactor length / m
Ga
s−
ph
ase
ma
ss f
ractio
n
(a) Almond
H2
CO2
COO
2
CH4
0.6 0.6002 0.6004 0.6006 0.6008 0.6010
0.05
0.1
0.15
0.2
0.25
0.3
0.35
0.4
Reactor length / m
Ga
s−
ph
ase
ma
ss f
ractio
n
(c) Sugarcane bagasse
H2
CO2
COO
2
CH4
0.6 0.6002 0.6004 0.6006 0.6008 0.6010
0.05
0.1
0.15
0.2
0.25
0.3
0.35
0.4
Reactor length / m
Ga
s−
ph
ase
ma
ss f
ractio
n
(b) Bamboo
H2
CO2
COO
2
CH4
0.6 0.6002 0.6004 0.6006 0.6008 0.6010
0.05
0.1
0.15
0.2
0.25
0.3
0.35
0.4
Reactor length / m
Ga
s−
ph
ase
ma
ss f
ractio
n
(d) Tea waste
H2
CO2
COO
2
CH4
Figure 14: Simulation results of gas-phase reactions based on the Ranzi kinetics scheme [48], fordifferent types of biomass, as a function of reactor length. (a) Almond, (b) sugarcanebagasse, (c) bamboo, and (d) tea waste. The equivalence air/fuel ratio is set to 0.2 at thebeginning of the combustion zone.
Final report • MIT - 2.62 - Fundamentals of Advanced Energy Conversion page 29

6.2 Biodigestion Process Modeling ResultsWe first estimate the chemical formula of the food waste from Lagos ??:
Table 8: Estimated MSW Composition for Lagos
Atom Weight% Adjusted Weight% Mole% Molar Mass (g/mol)C 51.33 55.93 32.59 12H 6.77 7.37 51.59 1O 30.92 33.69 14.73 16N 1.42 1.54 0.772 14S 1.34 1.46 0.319 32
We obtain the following chemical formula for our feedstock:
C102.1H161.7O46.17N2.4S1
Using the following global reaction for anaerobic biodigestion Buswell Equation (1952):
CcHhOoNnSs + 4c−h−2o+3n+2s4
H2O→ 4c−h+2o+3n+2s8
CO2 + 4c+h−2o−3n−2s8
CH4 + nNH3 + sH2S
The global biodigestion reaction becomes:
C102.1H161.7O46.17N2.4S1 + 40.89 H2O→ 43.53 CO2 + 58.57 CH4 + 2.4 NH3 + H2S
This leads to the following final composition of the biogas:
Table 9: Estimated biogas composition for Lagos (Molar%)
Product Mole%CO2 41.26CH4 55.52NH3 2.275H2S 0.947
The analysis based on the Buswell equation gives us the composition of the biogas but assumescomplete biodigestion of the food waste, hence over estimate the biogas output per ton (dry) biomassused. In reality, only a percentage is biodigested, this percentage depending on hardly biodigestablematerials typically lignin. For food waste, realistically 40% to 65% of the initial biomass is bro-ken down into biogas [?]. A value of 65% would be reached for food scraps with relatively lowerlignin and hemicellulose or after an effective pre-treatment step. Based on this more realistic rangeof conversion of 40% to 65%, the biodigester output per unit dry mass of biomass is estimated withinthe range [461-749] m3 per ton of volatile solid (VS). The biogas obtained has a heating value ofapproximately 18 MJ per m3 once trace components removed.
In order to check the validity of the obtained biodigestion yield, a comparison with reported ex-perimental results is needed. Curry [?] reports a mesophilic biodigestion yield for food waste of 367m3 per ton of volatile solid basis. In figure 15, different feedstock biomass are shown along withtheir biodigestion yields [?]. Assuming organic food waste to be an average of all these experimentalvalues, we obtain experimental biogas yield in the range [342-407] m3 per ton biomass (VS).
Final report • MIT - 2.62 - Fundamentals of Advanced Energy Conversion page 30

Figure 15: Experimental biogas yield for food waste from different sources
The previous assessment shows that our estimate for biogas yield using Buswell equation alongwith a biodigestion efficiency, in the case of food waste in Lagos are realistic. Our system analysiswill use a base case value of 400 m3 per ton biomass (VS).
6.2.1 Sensitivity of the biodigestion Process on Biomass Types
The results of a sensitivity analysis of the biogas yield and composition to the biogas yield are nowshown. We used a basket of biomass sources that are likely to be part of the organic food waste.These have been previously gathered in our biomass database presented in the first phase of thisstudy (midterm report). The result of ultimate analysis for these biomass sources is known. Figure16 shows the variations in composition and yield for the selected biomass.
Figure 16: Sensitivity Analysis of Biogas Composition and Yield
Final report • MIT - 2.62 - Fundamentals of Advanced Energy Conversion page 31

Figure 17: Statistics - sensitivity analysis
A low standard deviation is associated with the percentage of methane and carbon dioxide of thebiogas as well with the biogas yield. For a conservative biodigestion efficiency of 40%, the averageyield of 412 m3 per ton of volatile solid (VS) is obtained with only a 2.1% deviation from the mean.The uncertainty regarding traces seems higher, especially for hydrogen sulfide. This will have animplication on the amount of work required for gas separation before using the biogas in the dieselgenerator.
7 Results: Diesel Engine ModelingHere, we discuss the results related to two modes of operating the diesel engine: fuel injection aftercompression (base case), or fuel injection before compression, and evaluate the engine cycle efficien-cies with respect to the two waste management pathways.
7.1 Mode 1 – Post-Compression Fuel Injection (Base Case)
Figure 18: P-V diagrams of the diesel engine performance for biodigestion (left panel) and gasifica-tion (right panel), for the base case of fuel injection after air compression
Fig. 18 illustrates the P-V diagrams of the base cases from biodigestion (left panel) and gasification(right panel). While the initial atmospheric air starts at the same point (25◦C, 1 atm) and follows thesame isentropic compression path, because the differing reaction thermochemistry and fuel compo-sition, biodigestion and gasification bring the engine to different points on the P-V diagram after thecombustion chamber (point 3). This is important, as then the engine will follow different isentropic
Final report • MIT - 2.62 - Fundamentals of Advanced Energy Conversion page 32
lines as it expands from point 3 to point 4. This in turn affects the amount of work that is done, andthus the overall engine performance.
One point of caution in interpreting the P-V diagram is that points 1 and 2 show the compressionof air, and at point 2 injected into the engine is fuel, which ignites spontaneously. This is how a dieselengine works in practice. Therefore, mass is not conserved throughout the P-V cycle, and the extrawork needed to compress the fuel is not shown in the P-V diagrams. When we sum up all the workthat is required to compress both the air and the fuel, we find that gasification, while apparently havinga larger integration area under the P-V diagram, actually has less efficiency compared to biodigestion(13% versus 7.5%). There are several reasons for this. Firstly, per volume basis, methane is about 3times as energy dense as syngas (about 800 kJ/mol versus 280 kJ/mol respectively, in terms of lowerheating value). This matters because in order to achieve a similar heat of reaction, we will needto compress more volume of syngas compared to methane, and thus expend more work. Secondly,for both the oxidation of hydrogen gas and carbon monoxide, we start with 1.5 moles of reactants(for example, CO + 1/2 O2) and end with 1 mole of product (in this case, CO2). Whereas, in thecase of methane (biogas), 3 moles of reactants (CH4 + 2O2) give rise to 3 moles of products (CO2 +2H2O). This is significant, because it implies that for syngas, there are fewer moles of gas in the post-combustion products available to do the work in the expansion stroke compared to biogas. Thirdly, ifwe focus on the relative stoichiometry of the reactants, we realize that for every molecule of oxygen,there are 2 molecules of syngas (of either species), while there are only 0.5 molecules of methane.Given a diesel engine of a particular intake volume (of atmospheric air), more molecules of syngasneeds to be compressed at each engine cycle to burn the fuel at a given air/fuel stoichiometric ratio,and this contributes towards the energy penalty for the gasification process. In contrast, in terms ofbiogas, per engine cycle, there are fewer molecules of biogas to compress given a fixed initial airintake volume. From the perspective of the engine, for a given mole flow rate of fuel, it is runningfaster for biogas than it is for syngas. Fourthly, while biogas is relatively ”cold” (37◦C), syngas ishot (≈ 800◦C). Compressing syngas at its exit temperature from the gasifier turned out to have sucha high penalty that we were forced to cool the syngas down to 90◦C first before compressing it. Evenso, syngas is still relatively hot compared to biogas, and it would not be surprising that, given thesame moles of gas, a larger amount of work is needed to compress syngas.
In fact, this efficiency constraint of the diesel engine is one reason why we needed to keep theair/fuel equivalence ratio for the gasifier low in contrast to many current studies/designs: we wantthe input fuel stream into the diesel engine to have as little inert molecules as possible (such as N2
and CO2). As an illustration, originally, we utilized the syngas composition as given experimentallyby Arnavat [51] as listed in Table . What we soon realized was that compressing a syngas streamcontaining about 70% v/v of inert gases is highly unfeasible: in fact, the power needed for fuelcompression in this case was so high that the overall efficiency of the diesel cycle turned out to benegative. In this prohibitive scenario, one might entertain the idea of filtering out the N2 beforehand sothat only the combustible portion of the mixture goes into the diesel engine. There are two problemswith this. Firstly, at the small scale of around 70 households, investing in a nitrogen-scrubbingcomponent is quite costly. Secondly, the approximated work to remove nitrogen, according to theidealized entropy of mixing model, is on the order of:
Pscrub,N2 = −2(0.25mol/s)(8.314J/molK)(360K)(0.5 ln 0.5) ≈ 0.5kW. (27)
However, if we re-run our base case after scrubbing nitrogen gas, we found that there is a marginalincrease in the work output by 0.3 kW (thereby increasing the diesel engine efficiency from 7.5% to10%), which is on the same order as the work required to scrub the gas in the first place. Therefore,there is nothing much to be gained by removing the inert nitrogen from the syngas mix. On the otherhand, if we reduce the air/fuel equivalence ratio, then we would conserve more biomass for syngasproduction, obtain a syngas composition of higher fuel volume fraction, and achieve a higher engineefficiency. Then, the exhaust heat from the diesel cycle can be used to supply heat to the gasifier,
Final report • MIT - 2.62 - Fundamentals of Advanced Energy Conversion page 33

Figure 19: P-V diagrams of the diesel engine performance for biodigestion (left panel) and gasifica-tion (right panel), for the modified case of pre-mixing air and fuel before the compressionstroke
in lieu of directly oxidizing biomass. This will also result in a higher overall system performanceefficiency, as we will discuss next.
7.2 Mode 2 – Pre-Compression Fuel InjectionWe also modified our ASPEN Plus flowsheet to consider the possibility of pre-mixing the bio-gas/syngas and air before the diesel compression stroke. Fig. 19 illustrates the modified engineperformance. As can be noted, the efficiencies in both cases increased. In particular, there is a signif-icant improvement in the engine efficiency when run on syngas: in fact, the two pathways now havecomparable efficiencies of around 14-15%. One key reason for this improvement, if we compare Fig.18 and Fig. 19, is that in the base case, points 1 and 2 for both syngas and biogas are at the sameP-V states: 25◦C and 1 atm for point 1 and 808◦C and 50 atm for point 2. This is expected as in thebase case, the compression cycle only starts with air, and the compression ratio is the same in bothcases. In contrast, for mode 2, we note that at point 1, the fuel/air mixture already starts at differ-ent points on the P-V diagram: the syngas/air mixture, for example, has a higher initial temperature(40◦C) because it enters into the engine hotter than biogas. In the rest of the processes, syngas has aconsistently higher temperature (which meant less volume at the same pressure) compared to biogas.While more work is required to compress hot gas, even more work can be extracted from the hotterexpanding post-combustion gas. This compensates for the various energy penalties for the syngascycle mentioned previously.
Therefore, from these comparative studies, we can draw the conclusion that, if gasification were tobe implemented, if the cost of retrofitting the diesel engine to pre-mix gas and fuel is not a concern,then doing so would significantly add to the efficiency of the diesel cycle.
8 Results: System ModelingIn order to meaningfully compare the two separate biomass treatment pathways, we need to definea ”common denominator” that allows us to define the overall system efficiency. This is done usingthe calorific value of the Lagos municipal waste, which was found to be 7.6 MJ/kg (wet basis) [63].
Final report • MIT - 2.62 - Fundamentals of Advanced Energy Conversion page 34

Assuming the base case flow rate specified previously (119.7 kg/day at 49.9% moisture content), thiscorresponds to 31.9 kW. It is expected that in the ensuing energy conversion processes of biodigestionor gasification, some fraction of this 31.9 kW will be lost. The overall system efficiency will beinferred based on how much of this original energy is lost.
Figure 20: The overall system energy balance for (a) biodigestion, and (b) gasification.
First, we quantify the system performance of the chemical reactor by asking the following question:of the 31.9 kW of biomass input, how much of this is converted into usable fuel (syngas or biogas)?Fig. 20 shows the overall outcome for both biodigestion and gasification. For either process, there areconversion losses. For the case of biodigestion, we know, for example, that the digestion of organicwaste is never complete, and there is always effluent organic content. For the case of gasification, theinput of air to combust the biomass, which provides heat for the gasification system, also subtractsenergy away from the overall biomass. As we can see, while for biodigestion about 49% of theMSW heating value is converted into fuel, for gasification, this figure is higher at about 62%. Onecaution is that there is no obvious basis to compare the heating values of syngas versus biogas atthis stage, because these two fuels emerge from the reactor at different temperatures. For example,syngas in appearance carries more energy because it is at 800◦C—and in fact, in the ASPEN Plusflowsheet, we actually extracted some heat when we cool the syngas down before compressing it inthe diesel engine. In fact, if we com are the higher heating value of syngas and biogas at about roomtemperature, they are roughly equivalent (as seen in Fig. 19 previously, syngas has a Qin of 15.5 kWinto the engine, while biogas, 15.6 kW). In fact, some heat or work from downstream will need to bere-diverted back into the reactor to produce these gases in the first place.
After the diesel engine, we observe that the biodigestion stream has slightly higher work output(at 4.0 kW) compared to syngas (3.6 kW). However, the work that needs to be re-directed back tothe previous fuel processing steps is also higher for syngas, one key reason being that it is necessaryto scrub hydrogen sulfide (H2S) before the gas enters into the engine. The various scrubbing andgrinding energies add up to about 4% of the total work output. On the other hand, there is a lighter”tax” on the power output from gasification: it is less than 1%, and mainly relates to blower in thedowndraft gasifier.
Final report • MIT - 2.62 - Fundamentals of Advanced Energy Conversion page 35

Another interesting observation is that, while syngas on appearance has more conversion efficiencyfrom the gasifier, some of this energy is in term of the lower-quality heat (at 800◦C) which does notmake its way into the work stream, but rather, the exhaust heat stream from the diesel engine. Thisis corroborated by the observation, in Fig. 19 previously, that the diesel cycle has a lower efficiencyrunning on syngas than it does on biogas. Indeed, when we examine the heat output from the dieselengine, we find that the output from the gasification route is much higher than the biodigestion route.
However, not all this heat output from the engine is ”free”: both the biodigestion and gasificationprocesses have various heating requirements. For biodigestion, this relates mainly to the maintenanceof the biodigester at 37◦C for optimal biological activity, and the penalty is rather small: 0.3 kW inthe heat output. On the other hand, for the case of gasification, the gasifier needs a hefty amountof heat intake to run itself, in particular, because we chose to run the gasifier at a lower-than-usualair/fuel equivalence ratio. In addition, for the gasification process, because of the requirement that thefeedstock into the gasifier must be reasonably dry (less than 15% moisture content), it will also takeconsiderable amount of energy in the dryer to reduce the moisture content from the original 50% to15%. In some studies, this energy is avoided by laying out the biomass out in the open to dry, usingthe low-quality heat from the air and sun. However, this process takes many days, and in an urbanLagos setting, is simply not feasible given the constrained land area. When summed up, this heatingrequirement for drying and running the gasification process turns out to be quite large: about 8.4 kWfor our base case. This means that there is less net usable heat output from the gasification processas compared to the biodigestion process for our base case, at a given moisture content of 50%. Wewill discuss in greater depth about the dependency of the overall energy balance, in particular for thegasification process, on the moisture content later, but at this point, we conclude that for the typicalmunicipal waste characteristics, biodigestion seems the more viable route from the energy conversionperspective.
Therefore, we can define and assign some system efficiencies to both processes by dividing theavailable power output by the initial fuel energy content: for gasification, at the given moisture con-tent and feedstock conditions, this efficiency is about 12% for biodigestion, and 11% for gasification.Under different conditions, we expect these efficiencies to change, and the section immediately be-low will discuss some effects such as the initial feedstock variability, as well as the initial feedstockmoisture content.
8.1 System Error AnalysisEarlier, we assessed the impact of variations in the characteristics of the input biomass feedstock(mainly in terms of the ultimate and structural analyses) on the fuel production, because, as explainedpreviously, municipal waste is a highly heterogeneous mix of different biomass types that can changefrom day to day and season to season. The question we ask here is: given our inability to bettercharacterize the waste composition in Lagos, what effect does this possible error has on the overallsystem performance? In this section, we analyze the case for both gasification and biodigestion.
8.1.1 Gasification Feedstock Sensitivity
As noted previously, the ultimate and structural analyses have a significant impact on the compositionof the devolatilized gas, but this effect is quickly erased in the combustion zone, creating only a minorerror (less than 2%). The more significant error actually comes from the differing gas/char yield fordifferent types of biomass. There are two causes fro this variable gas/char yield in the different typesof biomass: (a) different types of biomass have different structural components (lignin, hemicellulose,and cellulose), which decompose differently under pyrolyiss, and (b) different types of biomass havedifferent amounts of inert ash, which serves to reduce the overall gas/char yield when such ash isincluded. The Cantera simulation results above suggest that at the typical range of pyrolysis gas yield
Final report • MIT - 2.62 - Fundamentals of Advanced Energy Conversion page 36

is around 0.6 to 0.8 initially, though of course, the composition of char also has an influence on howmuch syngas (of which variety) is produced.
Figure 21: Sensitivity of the gasification system performance based on the initial feedstock condi-tions, which affect the fuel yield (a) The power output from gasification as a function ofthe gas yield. (b) The heat output from gasification as a function of the gas yield. Theplots are done for different initial feedstock moisture contents of 35% (red), 50% (blue),and 65% (black).
Fig. 21(a) illustrates the effect of this uncertainty range on the net power output from the gasifi-cation system. It makes sense to observe that as the gas yield increases, the available power outputalso increases, because in our system, only gas, and not char, can contribute to useful work in theengine. Fig. 21(b) shows the effect of this uncertainty range on the net usable heat output from thegasification system. There is in reality a trade-off here: the higher the gas yield, the lower the heatcontribution from the char. However, as the heat contribution from the char is already quite small inthe base case (about 2.8 kW out of the total 19.6 kW of heat before the diesel engine), we surmise thatthe increasing heat contribution from the engine exhaust of burning syngas will be the more importantfactor. This is indeed true as Fig. 21(b) shows an increasing trend.
In all the figures above, we also plot the system performance based on three different initial mois-ture levels for the biomass feedstock. We will discuss this effect in a later section.
8.1.2 Biodigestion Feedstock Sensitivity
In this section, we perform some sensitivity analyses based on potential errors in the input feedstockfor biodigestion. We first evaluate the impact of different types of feedstock on the fuel characteris-tics, which can then impact the power/heat output from the system.
With regard to biodigestion, there are two key uncertainties in the fuel production: (a) the fractionof methane in the biogas stream, and (b) the total biogas yield per unit mass of input feedstock.As explained in the process modeling results section before, both quantities may be affected by thecharacteristics of the input feedstock. Because municipal waste is mixed waste, it becomes verydifficult to predict a priori the waste composition from the different biomass types. Therefore, it isimportant for us to analyze how this uncertainty affects the overall system performance, and evaluatewhether or not such fluctuation in the power/heat output is acceptable for NovaGen.
As can be seen in Fig. 22(a), the net power output increases as the mole fraction of CH4 increases,which is expected as the given volume of the gas contains increasing energy. While not shown inthe plots, the diesel engine efficiency also increases from 25.4% to 26.2% over the parametric range.This corresponds, on the P-V diagram, to increasing temperatures T2, T3, and T4 by about 10, 40, and30 Kelvins respectively. Likewise, Fig. 22(b) illustrates that the net heat output also increases. While
Final report • MIT - 2.62 - Fundamentals of Advanced Energy Conversion page 37

Figure 22: Sensitivity of the biodigestion system performance based on the initial feedstock condi-tions, which affect the fuel yield and/or composition. (a) The power output from biodi-gestion as a function of the CH4 mole fraction of biogas. (b) The heat output from biodi-gestion as a function of the CH4 mole fraction of biogas. (c) The power output frombiodigestion as a function of the total biogas yield per dry unit mass of input feedstock.(d) The heat output from biodigestion as a function of the total biogas yield per dry unitmass of input feedstock. The plots are done for different initial feedstock moisture con-tents of 35% (red), 50% (blue), and 65% (black).
this figure plots the trends at three different moisture contents, we will discuss the influence of theinitial feedstock moisture content later.
The other factor that varies as a function of feedstock characteristics is the overall biogas yield,measured in cubic meters per ton of dry biomass. As explained before, digested waste such as cowdung typically will have a low biogas yield, while high-fat and high-sugar wastes tend to have ahigher biogas yield. Depending on the composition of the municipal waste, differing yields can beobtained.
Fig. 22(c) examines the dependency of the power output from the system on this factor, by varyingthe biogas yield from near zero to 800 m3/dry ton of initial biomass. It should be noted that there isa minimally viable gas yield value at 303/dry ton, below which the system will be unable to producenet positive work. 22(d) shows the same for the available heat output from the system, and we seethat the heat output is much more sensitive to the changes in biogas yield compared to the poweroutput.
Final report • MIT - 2.62 - Fundamentals of Advanced Energy Conversion page 38

8.2 Effect of Moisture ContentWhile for the base case, we used a value of 50% (wet basis) moisture content for the incomingmunicipal waste from Lagos, we recognize that this value can vary greatly, dependent upon the wastecomposition, neighborhood, weather, and season. To understand the impact of this variable on theoverall system performance, in Figures 21 and 22 previously, we also plotted the anticipated systemperformance based on two other moisture values for the initial biomass: 35% and 65% (again wetbasis), assuming a constant incoming mass flow rate (i.e. gasifier/biodigester feeding rate). We cansee that for both gasification and biodigestion, the net power available is affected significantly bythis varying moisture content: a higher moisture content leads to a lower value for the net poweravailable. This is expected for several reasons. Firstly, per unit of mass flow of incoming municipalwaste, there is now less organic waste that actually contributes to the fuel conversion process, whichaffects how much fuel goes into the diesel engine. Secondly, in processes that require water removal(for example, biodigestion), the higher moisture content means a larger separation cost. It is notedthat the presence of larger moisture content will also affect the amount of steam available insidethe gasifier, which will also affect the reactions dictating the formation of H2 and CO. Typically,we expect the formation rate to increase as a function of increasing steam concentration inside thereduction zone, with a greater preference for H2. However, as the plot shows, this positive effect isoverpowered by the two previous negative effects.
In contrast, the right panels of Figures 21 and 22 show trends of a somewhat different characteristic.Notably, in contrast to the power output, the slopes of the available heat output do not seem to dependon the moisture content. This can be understood by noting that for gasification, the higher the initialmoisture content, the more drying is required to bring the biomass down to acceptable moisturecontents to feed into the gasifier. The removal of an additional 15% moisture corresponds to an offsetof about 1.53 kW in the heat requirement. For biodigestion, while the moisture level does impact theavailable heat output, we see that this effect is much smaller. This makes sense, as biodigestion doesnot require the moisture to be heated and removed from the biomass completely, but rather, that thewhole biomass/water mixture be brought from ambient temperature to 37◦C where the biodigestinotakes place.
If it is true, as discussed above, that the initial moisture within the biomass levies such a bigenergy penalty on the gasification process, then we expect that if we reduce the moisture content,gasification will become increasingly attractive in comparison with biodigestion, until a point whereit becomes energetically superior. By performing sensitivity analysis on the system, we found outthat this point is around 15% moisture content, which, incidentally, is also the upper maximum intakemoisture content designed for various types of gasification units. This is interesting, as it tells thatmost gasifiers seem already designed with this energetic constraint in mind. While this moisturecontent is readily achievable with post-harvest typical agricultural waste—which are plenty in ruralNigeria—in practice it is difficult to achieve with solely municipal waste, which typically has a muchhigher moisture content unless household-based segregation based on moisture level were to takeplace. While it is possible to reduce the heating requirement in the gasification pathway by lettingthe biomass dry using lower-quality heat, such as the sun or the ambient air, this strategy requires avery large land area and may be weather-dependent. In an urban setting such as Lagos, its feasibilityis also questionable.
9 Conclusion and Discussions
9.1 SummaryIn this study, we undertook an assessment of biodigestion and gasification of municipal solid wastein the context of an upscale apartment complex in Lagos. To do this, we created models for both pro-
Final report • MIT - 2.62 - Fundamentals of Advanced Energy Conversion page 39

cesses. We first elucidated the underlying kinetics and molecular balance that govern fuel production,and evaluated how variations in the input biomass may impact this result. We then integrated theseinsights into a macroscopic systems-level model of both processes in order to account for the overallenergy balance and efficiency. Here are some key insights from our study:
1. Both producer gas and biogas production is variously sensitive to the input feedstock charac-teristics, in particular, the ultimate analysis and structural data. For gasification, this affectsthe overall gas yield without significantly changing the gas composition. For biodigestion, thedifferent types of feedstock will alter the methane fraction as well as the overall biogas yield;however, the sensitivity is comparatively low in this case.
2. There are two modes of running the diesel engine: pre-mixing the fuel and air before compres-sion, or injecting the fuel after compression. Having evaluated both cases, we concluded thatthe first mode yields superior efficiency. For producer gas, the engine efficiency is around 23%, while for biogas, 26%.
3. The pretreatment and post-treatment processes in both gasification and biodigestion do notimpose a significant energy penalty on the system performance (less than 5%). This may bedue to our idealized model, which we will discuss in the subsequent section.
4. The first-law efficiency for the full system—defined as the fraction of work extracted to theoverall calorific content of the incoming organic waste—is comparable for both conversiontechniques at 11-12%. At this level, the power output is about 3.6-3.8 kW, which is sufficientfor the average case of 3 kW for the households. However, it will not meet the upper bound of8 kW of household electricity demand.
5. At the given waste moisture content and treatment conditions, there is more available exhaustheat for biodigestion which, while not of primary importance to NovaGen, can nonetheless beutilized in other ways by the households, such as heating shower water.
6. Both processes show significant sensitivity to the initial feedstock moisture content. A lowermoisture content generally leads to higher energy yields, especially for the case of gasification.In fact, gasification will be energetically comparable to biodigestion at an initial feedstockmoisture content of about 15 %, unless alternative drying strategies using lower quality heat(such as the sun) are employed.
7. Because municipal waste is highly mixed, we expect daily or seasonal fluctuations to havea significant impact on the system-level energy performance. This fluctuation should not beoverlooked and NovaGen should seek to characterize it as accurately as possible.
Overall, should NovaGen proceed with either waste conversion techniques? As concluded above,if NovaGen is only interested in the power output, then both gasification and biodigestion may befeasible at a power output of 3 kW. If NovaGen seeks to satisfy the upper estimate of 8 kW for thecommunity, then additional energy sources—such as additional food waste, diesel, or solar sources—should be sought. From the point of view of overall energy balance including the possible utility ofwaste heat from the diesel cycle, we recommend biodigestion.
From the analysis above, we arrive at the following figures:
Final report • MIT - 2.62 - Fundamentals of Advanced Energy Conversion page 40

Table 10: Results summaryScenario Business as usual Biodigestion Gasification
1st law efficiency 20% 12% 11%Food waste used 0% 100% 100%
Diesel use avoided (l/year) 0 5548 5256Fuel cost savings (USD) 0 5216.4 5506.3
The savings above reflect only fuel cost savings. In reality, a lifecycle analysis should consider othersavings such as landfill tipping cost, and the transportation of the diesel and waste.
We do not have the exact figures for the capital cost of either hardware. However, if we use thebaseline approximation for gasification which is USD 1/W, given our community capacity, we expectsuch a unit to cost about USD 8000, excluding peripheral facilities such as dryers, scrubbers, etc.This would imply a return on investment of approximate 2-3 years.
9.2 Assumptions and LimitationsThroughout the modeling process, we made various simplifications in both the biodigestion and gasi-fication processes. In this section, we enumerate these assumptions which are bases for future work.
Gasification
1. The gas / char yield is evaluated using a single-particle model. This is a highly simplifiedkinetic model since, in reality, the interaction between the particles themselves is likely to besignificant for a packed bed.
2. As mentioned before, ensuring good heat exchange between the exhaust and the gasifier maynot be practically feasible. Therefore, for this system, the equivalence ratio should be muchhigher which will consequently increase the Nitrogen mole fraction in the producer gas. Thiscould present potential problems for ignition and NOx control in the IC engine and may, there-fore, have to be separated out. This separation will result in an efficiency penalty.
3. It is assumed that the char concentration in the reduction zone is sufficiently high so that theheterogeneous chemical reactions are not controlled by the char concentration in the bed. Thissimplification may not hold true for higher equivalence ratios (more char gets burnt).
4. The current analysis has not assumed any post-treatment to the gas. While the menace ofemissions and their control has been somewhat described in Section (4.1.1), incorporating sep-aration units will result in further efficiency penalty.
5. Due to limited scope of this study, we prescribed a temperature profile inside the gasificationreactor based on typical experimental data, instead of building a full-fledged downdraft reactormodel and letting the energy balance dictate the temperature profile.
6. The system-level analysis did not account for the fate of ash, which is expected to accumulateand may need transportation to be removed from the site.
Biodigestion
1. We did not use a kinetics or steady-state modeling approach for biodigestion, and assume awell-define efficiency for a global reaction. In further studies, a more detailed implementationfor the biodigestion process—such as the ADM1 model—is warranted in order to better assessthe reactor behavior under different feedstock and temperature conditions.
Final report • MIT - 2.62 - Fundamentals of Advanced Energy Conversion page 41

2. We did not account for the water cycle. In a typical biodigestion process, a large amount ofwater is added to the input feedstock to form a slurry-like consistency before being fed into thebiodigester. In our modeling, we did not account for this water as it has minimal impact on theoverall system energy balance. However, in more realistic models, we will need to account forvarious steps such as water pumping, water extraction from the wet digestate, and so forth.
3. We did not account for additional work required to keep the biodigester well-mixed, for exam-ple, the constant stirring that is found in various installations.
4. We did not trace the fate of the solid digestate in the biodigestion process. In many biodigestionplants, this digestate is used for fertilizer on site or in nearby farms. In others, it is discarded.However, in either case, there is typically an energy requirement related to the transport of thissubstance, which we did not explicitly include in the model.
Finally, there are some simplifications which are common for both conversion strategies:
1. We did not account for any heat losses in the different processes in both biodigestion andgasification. In reality, these heat losses may add up to significant penalties in the system-levelenergy balance.
2. Typically, a 10% diesel is necessary in order to operate the diesel engine with biogas or pro-ducer gas. However, for the interest of system energy balance, we only accounted for biogasand producer gas in the flowsheet, and ignored the diesel from the system.
Final report • MIT - 2.62 - Fundamentals of Advanced Energy Conversion page 42

References[1] Rudolf Braun. Anaerobic digestion: a multi-faceted process for energy, environmental manage-
ment and rural development. Improvement of Crop Plants for Industrial End Uses, (335-416),2007.
[2] Mustafa Balat. Production of bioethanol from lignocellulosic materials via the biochemicalpathway: a review. Energy Conversion and Management, 52(2):858–875, 2011.
[3] Anaerobic digestion of municipal solid waste: A modern waste disposal option on the verge ofbreakthrough. Biomass and Bioenergy, 9(1-5):365–376, 1995.
[4] Carlo N. Hamelinck, Geertje van Hooijdonk, and Andre PC Faaij. Ethanol from lignocellu-losic biomass: techno-economic performance in short-, middle- and long-term. Biomass andBioenergy, 28(4):384–410, 2005.
[5] UN FAO. Global food losses and food waste. Technical report, 2011.
[6] Ityona Amber, Daniel M. Kulla, and Nicholas Gukop. Municipal waste in nigeria genera-tion, characteristics and energy potential of solid. ASIAN JOURNAL OF ENGINEERING, SCI-ENCES AND TECHNOLOGY, 2012.
[7] Peter McKendry. Energy production from biomass (part 2): conversion technologies. Biore-source Technology, 83(1):47 – 54, 2002. Reviews Issue.
[8] A.A. Khan, W. de Jong, P.J. Jansens, and H. Spliethoff. Biomass combustion in fluidized bedboilers: Potential problems and remedies. Fuel Processing Technology, 90(1):21 – 50, 2009.
[9] Ayhan Demirbas. Potential applications of renewable energy sources, biomass combustionproblems in boiler power systems and combustion related environmental issues. Progress inEnergy and Combustion Science, 31(2):171 – 192, 2005.
[10] Thomas Nussbaumer. Combustion and co-combustion of biomass: Fundamentals, technologies,and primary measures for emission reduction. Energy & Fuels, 17(6):1510–1521, 2003.
[11] Bernd R.T Simoneit. Biomass burning a review of organic tracers for smoke from incompletecombustion. Applied Geochemistry, 17(3):129 – 162, 2002.
[12] L.S. Johansson, C. Tullin, B. Leckner, and P. Sjvall. Particle emissions from biomass combus-tion in small combustors. Biomass and Bioenergy, 25(4):435 – 446, 2003.
[13] R. Saidur, E.A. Abdelaziz, A. Demirbas, M.S. Hossain, and S. Mekhilef. A review on biomassas a fuel for boilers. Renewable and Sustainable Energy Reviews, 15(5):2262 – 2289, 2011.
[14] Thomas R. Miles, Thomas R. Miles Jr, Larry L. Baxter, Richard W. Bryers, Bryan M. Jenkins,and Laurance L. Oden. Boiler deposits from firing biomass fuels. Biomass and Bioenergy,10(23):125 – 138, 1996. Strategic Benefits of Biomass and Wasteful fuels.
[15] Ajay Kumar, David D. Jones, and Milford A. Hanna. Thermochemical biomass gasification: Areview of the current status of the technology. Energies, 2(3):556–581, 2009.
[16] Mustafa Balat, Mehmet Balat, Elif Kirtay, and Havva Balat. Main routes for the thermo-conversion of biomass into fuels and chemicals. part 1: Pyrolysis systems. Energy Conversionand Management, 50(12):3147 – 3157, 2009.
Final report • MIT - 2.62 - Fundamentals of Advanced Energy Conversion page 43

[17] E. Bocci, M. Sisinni, M. Moneti, L. Vecchione, A. Di Carlo, and M. Villarini. State of artof small scale biomass gasification power systems: A review of the different typologies. En-ergy Procedia, 45(0):247 – 256, 2014. {ATI} 2013 - 68th Conference of the Italian ThermalMachines Engineering Association.
[18] Peter McKendry. Energy production from biomass (part 3): gasification technologies. Biore-source Technology, 83(1):55 – 63, 2002. Reviews Issue.
[19] Ian Narvaez, Alberto Orio, Maria P. Aznar, and Jose Corella. Biomass gasification with air inan atmospheric bubbling fluidized bed. effect of six operational variables on the quality of theproduced raw gas. Industrial & Engineering Chemistry Research, 35(7):2110–2120, 1996.
[20] P. Ollero, A. Serrera, R. Arjona, and S. Alcantarilla. The {CO2} gasification kinetics of oliveresidue. Biomass and Bioenergy, 24(2):151 – 161, 2003.
[21] S. Rapagna, N. Jand, A. Kiennemann, and P.U. Foscolo. Steam-gasification of biomass in afluidised-bed of olivine particles. Biomass and Bioenergy, 19(3):187 – 197, 2000.
[22] Lijun Wang, Curtis L. Weller, David D. Jones, and Milford A. Hanna. Contemporary issues inthermal gasification of biomass and its application to electricity and fuel production. Biomassand Bioenergy, 32(7):573 – 581, 2008.
[23] C. Lucas, D. Szewczyk, W. Blasiak, and S. Mochida. High-temperature air and steam gasifica-tion of densified biofuels. Biomass and Bioenergy, 27(6):563 – 575, 2004. Pellets 2002. Thefirst world conference on pellets.
[24] Emanuele Graciosa Pereira, Jadir Nogueira da Silva, Jofran L. de Oliveira, and Cssio S.Machado. Sustainable energy: A review of gasification technologies. Renewable and Sus-tainable Energy Reviews, 16(7):4753 – 4762, 2012.
[25] Lopamudra Devi, Krzysztof J Ptasinski, and Frans J.J.G Janssen. A review of the primary mea-sures for tar elimination in biomass gasification processes. Biomass and Bioenergy, 24(2):125– 140, 2003.
[26] Carin Myren, Christina Hrnell, Emilia Bjrnbom, and Krister Sjstrm. Catalytic tar decompositionof biomass pyrolysis gas with a combination of dolomite and silica. Biomass and Bioenergy,23(3):217 – 227, 2002.
[27] Douglas C. Elliott, L. John Sealock, and Eddie G. Baker. Chemical processing in high-pressureaqueous environments. 2. development of catalysts for gasification. Industrial & EngineeringChemistry Research, 32(8):1542–1548, 1993.
[28] Mohammad Asadullah, Shin ichi Ito, Kimio Kunimori, Muneyoshi Yamada, and KeiichiTomishige. Biomass gasification to hydrogen and syngas at low temperature: Novel catalyticsystem using fluidized-bed reactor. Journal of Catalysis, 208(2):255 – 259, 2002.
[29] J.A. Ruiz, M.C. Jurez, M.P. Morales, P. Muoz, and M.A. Mendvil. Biomass gasification forelectricity generation: Review of current technology barriers. Renewable and Sustainable En-ergy Reviews, 18(0):174 – 183, 2013.
[30] Yukihiko Matsumura, Tomoaki Minowa, Biljana Potic, Sascha R.A. Kersten, Wolter Prins,Willibrordus P.M. van Swaaij, Bert van de Beld, Douglas C. Elliott, Gary G. Neuenschwan-der, Andrea Kruse, and Michael Jerry Antal Jr. Biomass gasification in near- and super-criticalwater: Status and prospects. Biomass and Bioenergy, 29(4):269 – 292, 2005.
Final report • MIT - 2.62 - Fundamentals of Advanced Energy Conversion page 44

[31] Samsudin Anis and Z.A. Zainal. Tar reduction in biomass producer gas via mechanical, catalyticand thermal methods: A review. Renewable and Sustainable Energy Reviews, 15(5):2355 –2377, 2011.
[32] S. Dasappa N. H. Ravindranath, H. I. Somashekar and C. N. Jayasheela Reddy. Sustainablebiomass power for rural india: Case study of biomass gasifier for village electrification. CurrentScience, 87, 2004.
[33] Buljit Buragohain, Pinakeswar Mahanta, and Vijayanand S. Moholkar. Biomass gasification fordecentralized power generation: The indian perspective. Renewable and Sustainable EnergyReviews, 14(1):73 – 92, 2010.
[34] Z.A Zainal, Ali Rifau, G.A Quadir, and K.N Seetharamu. Experimental investigation of adowndraft biomass gasifier. Biomass and Bioenergy, 23(4):283 – 289, 2002.
[35] V. Belgiorno, G. De Feo, C. Della Rocca, and R.M.A. Napoli. Energy from gasification of solidwastes. Waste Management, 23(1):1 – 15, 2003.
[36] Avdhesh Kr. Sharma. Experimental study on 75kwth downdraft (biomass) gasifier system.Renewable Energy, 34(7):1726 – 1733, 2009.
[37] Avdhesh Kr. Sharma. Experimental investigations on a 20 kwe, solid biomass gasification sys-tem. Biomass and Bioenergy, 35(1):421 – 428, 2011.
[38] Pratik N. Sheth and B.V. Babu. Experimental studies on producer gas generation from woodwaste in a downdraft biomass gasifier. Bioresource Technology, 100(12):3127 – 3133, 2009.
[39] Francisco V. Tinaut, Andrs Melgar, Juan F. Prez, and Alfonso Horrillo. Effect of biomassparticle size and air superficial velocity on the gasification process in a downdraft fixed bedgasifier. an experimental and modelling study. Fuel Processing Technology, 89(11):1076 –1089, 2008.
[40] Rajeev M. Jorapur and Anil K. Rajvanshi. Development of a sugarcane leaf gasifier for elec-tricity generation. Biomass and Bioenergy, 8(2):91 – 98, 1995.
[41] Murat Dogru, Adnan Midilli, and Colin R Howarth. Gasification of sewage sludge using athroated downdraft gasifier and uncertainty analysis. Fuel Processing Technology, 75(1):55 –82, 2002.
[42] Maria Puig-Arnavat, Joan Carles Bruno, and Alberto Coronas. Review and analysis of biomassgasification models. Renewable and Sustainable Energy Reviews, 14(9):2841 – 2851, 2010.
[43] S. Jarungthammachote and A. Dutta. Thermodynamic equilibrium model and second law anal-ysis of a downdraft waste gasifier. Energy, 32(9):1660 – 1669, 2007.
[44] Niladri Sekhar Barman, Sudip Ghosh, and Sudipta De. Gasification of biomass in a fixed beddowndraft gasifier a realistic model including tar. Bioresource Technology, 107(0):505 – 511,2012.
[45] D.L. Giltrap, R. McKibbin, and G.R.G. Barnes. A steady state model of gas-char reactions in adowndraft biomass gasifier. Solar Energy, 74(1):85 – 91, 2003.
[46] B.V. Babu and Pratik N. Sheth. Modeling and simulation of reduction zone of downdraftbiomass gasifier: Effect of char reactivity factor. Energy Conversion and Management,47(1516):2602 – 2611, 2006.
Final report • MIT - 2.62 - Fundamentals of Advanced Energy Conversion page 45
[47] T.H. Jayah, Lu Aye, R.J. Fuller, and D.F. Stewart. Computer simulation of a downdraft woodgasifier for tea drying. Biomass and Bioenergy, 25(4):459 – 469, 2003.
[48] Eliseo Ranzi, Michele Corbetta, Flavio Manenti, and Sauro Pierucci. Kinetic modeling of thethermal degradation and combustion of biomass. Chemical Engineering Science, 110:2 – 12,2014.
[49] Carlos R. Altafini, Paulo R. Wander, and Ronaldo M. Barreto. Prediction of the working pa-rameters of a wood waste gasifier through an equilibrium model. Energy Conversion and Man-agement, 44(17):2763 – 2777, 2003.
[50] Avdhesh Kr. Sharma. Modeling fluid and heat transport in the reactive, porous bed of downdraft(biomass) gasifier. International Journal of Heat and Fluid Flow, 28(6):1518 – 1530, 2007.Revised and extended papers from the 5th conference in Turbulence, Heat and Mass TransferThe 5th conference in Turbulence, Heat and Mass Transfer.
[51] Maria Puig Arnavat. Performance modelling and validation of biomass gasifiers for trigenera-tion plants. PhD thesis, Universitat Rovira i Virgili, 2011.
[52] W. Boie. Fuel technology calculations. Energietechnik, 3:309–16, 1953.
[53] Richard B. Bates and Ahmed F. Ghoniem. Biomass torrefaction: modeling of reaction thermo-chemistry. Bioresource Technology, 134:331–340, 2013.
[54] A.C. Kent, H.N. Rosen, and B.M. Hari. Determination of equilibrium moisture content ofyellow-poplar sapwood above 100c with the aid of an experimental psychrometer. Wood Scienceand Technology, 15(93), 1981.
[55] S.S. Alves and J.F. Figueiredo. A model for pyrolysis of wet wood. Chemical EngineeringScience, 12:2861–2869, 1989.
[56] Marcelis Jacob Cornelis van der Stelt. Chemistry and Reaction Kinetics of Biowaste Torrefac-tion. PhD thesis, Technical University of Eindhoven, 2010.
[57] Mohammad J Taherzadeh and Keikhosro Karimi. Pretreatment of lignocellulosic wastes toimprove ethanol and biogas production: a review. International Journal of Molecular Sciences,9(9):1621–1651, 2008.
[58] Heidi Berg. Comparison of conversion pathways for lignocellulosic biomass to biofuel in mid-norway. Thesis - Master of Energy and Environmental Engineering, 2013.
[59] Z. Miao et al. Energy requirement for comminution of biomass in relation to particle physicalproperties. Industrial Crops and Products, 33(2):504–513, 2011.
[60] Nathan Curry and Pragasen Pillay. Biogas prediction and design of a food waste to energysystem for the urban environment. Renewable Energy, 41(0):200 – 209, 2012.
[61] Effect of engine parameters and type of gaseous fuel on the performance of dual fuel gas dieselengines - a critical review. Renewable and Sustainable Energy Reviews, 13(6-7):1151–1184,2009.
[62] O Badr, G.A Karim, and B Liu. An examination of the flame spread limits in a dual fuel engine.Applied Thermal Engineering, 19(10):1071 – 1080, 1999.
[63] Ityona Amber, Daniel M. Kulla, and Nicholas Gukop. Municipal waste in nigeria: generation,characteristics, and energy potential of solid. Asian Journal of Engineering, Sciences, andTechnology, 2(2), 2012.
Final report • MIT - 2.62 - Fundamentals of Advanced Energy Conversion page 46