strategies for small scale vendors in...
TRANSCRIPT

STRATEGIES FOR SMALL SCALE VENDORS IN INDIA
TO APPROACH LOWER MAINLAND COMPANIES
by
Baljeet Dhaliwal Master of Science (Information Technology), Simon Fraser University, 2006
Bachelor of Engineering (Mechanical Engineering), Calcutta University, 1992
and
George Mathew Bachelor of Engineering, University of Victoria, 1995
PROJECT SUBMITTED IN PARTIAL FULFILLMENT
OF THE REQUIREMENTS FOR THE DEGREE OF
MASTER OF BUSINESS ADMINISTRATION
In the Faculty of Business Administration
© Baljeet Dhaliwal & George Mathew, 2008
SIMON FRASER UNIVERSITY
Summer 2008
All rights reserved. This work may not be reproduced in whole or in part, by photocopy
or other means, without permission of the author.

ii
APPROVAL
Name: Baljeet Dhaliwal and George Mathew
Degree: Master of Business Administration
Title of Project: Strategies for Small Scale Vendors in India to Approach Lower Mainland Companies
Supervisory Committee:
___________________________________________
Dr. Sudheer Gupta Senior Supervisor Assistant Professor
___________________________________________
Dr. Elicia Maine Second Reader Assistant Professor
Date Approved: ___________________________________________

iii
ABSTRACT
The top IT companies in India are interested in high value projects from Canada,
while several small companies in India would be interested in accepting small-scale
projects from Canada. This project develops strategies through which small-scale
vendors in India may approach Lower Mainland companies for their smaller projects.
Through a survey on Lower Mainland companies, the project recommends that small-
scale Indian vendors should differentiate themselves through economies of scope, not
necessarily through achieving quality, but by building a strong reference list through
previous work with other clients. Vendors should also prepare a differentiation strategy
with respect to other countries and provide a strong level of communications with the
client through a local contact. Vendors should not accept more than a 20% advance and
should finish projects with no time overrun in order to improve client response.
Keywords: Outsourcing Strategies to India; Small Scale Projects Outsourcing; IT Outsourcing to India.

iv
ACKNOWLEDGEMENTS
We would like to thank Assistant professors, Dr. Sudheer Gupta and Dr. Elicia
Maine in reviewing and guiding us in our research efforts. Without their effort, this report
would not have been possible. We would also like to thank Assistant Dean, Dr. Colleen
Collins for approving this research project and providing initial guidelines.
We would also like to thank our loving wives and children for their support,
patience and care while we became “Professional Students” for two years.
v
TABLE OF CONTENTS
Approval ............................................................................................................................ ii Abstract ............................................................................................................................. iii Acknowledgements .......................................................................................................... iv
Table of Contents ...............................................................................................................v
List of Figures .................................................................................................................. vii List of Tables .................................................................................................................. viii 1: Introduction ...................................................................................................................1
1.1 Indian IT Market ..............................................................................................2 1.2 Big Vs Small IT Vendors – Relative Advantages ...........................................3 1.3 Outsourcing Business in Lower Mainland of BC ............................................4 1.4 Outsourcing to India ........................................................................................5
2: Literature Review ..........................................................................................................7 2.1 Outsourcing Literature .....................................................................................7
2.1.1 Outsourcing Advantages ..............................................................................7 2.1.2 Outsourcing Disadvantages .........................................................................9 2.1.3 What to Outsource .....................................................................................11 2.1.4 Outsourcing Checks ...................................................................................12 2.1.5 Outsourcing Reasons .................................................................................14
2.2 A Primary Outsourcing Survey .....................................................................16 2.3 Surveying Literature ......................................................................................16
2.3.1 Traditional Surveys and their Effectiveness ..............................................16 2.3.2 Web-Based/Internet Surveys and Their Effectiveness ..............................17 2.3.3 Lessons from the Survey Literature Review .............................................23
3: Target Market ..............................................................................................................25 3.1 Survey Development .....................................................................................26 3.2 Client Selection .............................................................................................27 3.3 Survey Instruments ........................................................................................28 3.4 Conducting the Survey ..................................................................................30
4: Analysis .........................................................................................................................32 4.1 Data Collected ...............................................................................................32 4.2 Data Observation ...........................................................................................32
4.2.1 General Observation ..................................................................................32 4.2.2 India Specific Observations .......................................................................34

vi
5: Recommendations ........................................................................................................38 5.1 Recommendation 1: Indian vendors should continue to differentiate
themselves through low cost and high quality ..............................................38 5.2 Recommendation 2: Getting certified in quality standards is not
necessarily a differentiating factor ................................................................40 5.3 Recommendation 3: Build a strong reference list by providing quality
work to previous clients .................................................................................41 5.4 Recommendation 4: In order to obtain more projects, start small and
then move on to larger projects .....................................................................43 5.5 Recommendation 5: Prepare a differentiation strategy with other
countries that are competing ..........................................................................44 5.6 Recommendation 6: Improve communications between the vendor
and client by providing a reliable local contact before bidding on a project ............................................................................................................45
5.7 Recommendation 7: Financial considerations when bidding or proposing a project ........................................................................................47
5.8 Target small service companies and small professional firms with website and e-commerce development ..........................................................49
5.9 Future Research .............................................................................................51
Appendices ........................................................................................................................52 Appendix A – Survey Outline ........................................................................................52 Appendix B – Survey Data .............................................................................................55
6: Bibliography .................................................................................................................61

vii
LIST OF FIGURES
Figure 1: Alternative Types of IS Outsourcing by Permission ..........................................13
Figure 2: Strategic Intent for IT outsourcing by Permission .............................................15

viii
LIST OF TABLES
Table 1: Features Comparison of Web Survey Websites ..................................................29
Table 2: Hidden Costs of Outsourcing ...............................................................................48
Table 3: Outsourced Project Percentages ..........................................................................49
1
1: INTRODUCTION
This project develops strategies through which small-scale vendors in India may
approach companies in the Lower Mainland of British Columbia, Canada (hereafter
called Lower Mainland) for small outsourcing projects. For the purpose of this project,
we assumed anything less than $20,000 to be a small-scale project. In order to develop
these strategies, this project reviews literature on outsourcing and conducts a survey on
several companies within the Lower Mainland. The purpose of this report is to assist
North American companies to be productive by outsourcing their small-scale
assignments. On the other hand, this would be beneficial for the companies in India as
this would give them an opportunity to enter the North American market by
understanding their customers’ needs better.
The first part of the project involved the findings from peer-reviewed academic
journals. The study first looks at the advantages and disadvantages of outsourcing. Then
it examines the strategies a company should consider before considering outsourcing.
Next, it reviews some reasons for outsourcing and looks at a specific study on
outsourcing to India. A literature review on surveys was also conducted. A survey is then
developed and presented, along with the results of the client interviews. In the final step
of the study, the findings from the survey, combined with the literature review, are used
to develop recommended strategies for small-scale Indian companies to approach Lower
2
Mainland companies. In the end, the project suggests several areas where the existing
research could be extended.
1.1 Indian IT Market
Since the liberalization of Indian industry in the early ‘90’s, the Indian IT sector has
experienced phenomenal growth. In 1996, the IT sector was about $1.24 billion. In 2001,
it had reached $8.75 billion. By 2006, the total market is expected to grow to $28.5
billion. Of this, $15.2 billion will be IT software and service exports, $7.3 billion will be
in the Business Process Outsourcing and the remaining $6 billion will be the domestic
market. The total market is expected to be about 7% of India’s GDP1 in 2008. The
current largest IT markets are the USA and the UK (Compare Infobase Ltd., New Delhi,
2008).
Morris et. al. (Morris & Basant, 2006) indicates that, for small firms in the Indian
IT industry, approximately 88% of the total have a turnover of less than 100 million
Rupees2. “This suggests that a large portion of IT firms are small entrepreneurial ventures
managed by self-employed individuals.” Morris et al mentions that 52 firms dominate the
market. The top five firms share 32% of the market, the next top 47 firms about 35% and
small firms share less than 11% of the market. Morris et al also indicates that 38% of IT
workers work in small enterprises. The top Indian IT firms, according to Dataquest 2005-
1 Gross Domestic Product 2 The August 2008 currency exchange rate is Cdn $1 = 41.73 Rupees. So 100 million Rupees is about
Cdn$2.4 million.

3
2006 report3 are Tata Consultancy Services, Wipro, Infosys Technologies, Satyam
Computers and HCL technologies.
1.2 Big Vs Small IT Vendors – Relative Advantages
The bigger players in the market offer the following advantages as compared to
smaller players
• A wider reach - they often have offices or resellers spread all over globe to
develop markets and find new opportunities.
• Larger talent pools – they can offer a variety of turnkey services for their
customers as they have expertise in a wide gamut of technologies.
• Better risk tolerance – due to their size and available resources, the large
companies are in a better position to take risk (losses) on a project without
jeopardizing the solvency of the organization.
The smaller players offer the following advantages when compared to bigger
players
• Lower overhead costs – with lower costs, they are more flexible in their price
offerings and can offer more competitive pricing
• Smaller bureaucracies – with a flatter structure, smaller companies enjoy faster
response time, since teams are able to make decisions quickly
3 http://dqindia.ciol.com/content/DQTop20_2006/ranking06/2006/106081725.asp accessed on August 17,
2008

4
• Customers have a true sense of ownership - "The customer benefits from a true
sense of ownership when the same individual can follow an information systems
project through the design, implementation, validation and maintenance phases."4
• They are more willing to take on smaller budget projects. They are able to provide
better service and the ability to handle smaller budget projects with better
flexibility.
1.3 Outsourcing Business in Lower Mainland of BC
According to Industry Canada (Industry Canada, 2008), excluding self-employed
businesses, there are over 1 million small companies (small companies are those with less
than 100 employees). The Industry Canada report states that 79% of small firms were
connected to the Internet and only 33% had their own web-site: this percentage is rapidly
growing. According to an Ipsos Reid study, (Dellazizzo, 2006) Canadian firms spent
approximately $41 billion dollars on IT in 2006. Small firms spent about $13 billion.
With about a million small firms in Canada, we can safely assume that on an average a
small firm spends about $13,000 per year on its IT budget. According to Chambers et. al
(Chambers & Church, 2006) there are 347,500 small businesses in British Columbia
which contribute about 22% to the Canadian GDP. Within the Lower Mainland of British
Columbia, there are 95,607 businesses – this number is growing at 0.6% (or about 547
businesses) per year. Most of the growth occurs in Professional, Scientific, and Technical
4 http://www.bizjournals.com/albany/stories/2002/03/18/focus9.html accessed on August 18, 2008
5
Services and the Information, Cultural, and Recreation sectors (Chambers & Church,
2006). Applying $13,000 IT to BC companies, we get an annual figure of $1.24 billions
spent by small scale companies in Lower Mainland. Even if 10% of these projects are
outsourced, that would amount to $124 million. Thus the overall outsourcing market can
be assumed to be worth at least $124 million per annum and growing at 0.6% per annum.
1.4 Outsourcing to India
According to the annual NASSCOM5 survey, IT services exports in India grew by
35.5% in 2006-07 to USD 18 billion; while ITES-BPO (IT enabled services – Business
Process Outsourcing) exports grew by 33.5% registering revenues of USD 8.4 billion.
The survey further projected “overall IT software and services sector will grow by 24-
27% to USD 49-50 billion in FY08”. A forecast study conducted by XMG (XMG, 2007)
in 2007 states that the outsourcing market for IT, BPO and Call Centre services to be
around US $450 billion by 2010, a compound annual growth rate (CAGR) of 16% when
compared to US $297 billion achieved in 2006. The report further states “India will
continue to lead the offshore segment through 2010 with at least 15% share”.
According to Chandrasekhar et al (Chandrasekhar & Ghosh, 2006), the greatest
advantage of outsourcing to India is the cost saving offered by Indian companies. The
authors suggest that “cost comparisons between India and the US point to savings of
around 80 percent to the source companies”. According to the research data (University
of California, Berkeley, 2003) published by the Haas School of Business at the 5 National Association of Software and Service Companies – India.

6
University of California, Berkeley, the wage difference between a US employee and an
Indian employee can range anywhere between 400% to 1500% depending upon the type
of profession. Chandrasekhar et al suggest that by outsourcing 10 small jobs to India, a
small scale Silicon Valley Company can save around $1.5 million in payroll costs. They
also suggest that the cost of setting up a call centre in New Delhi is about one-third the
cost of setting up similar call centre in the US.

7
2: LITERATURE REVIEW
2.1 Outsourcing Literature
Information Technology (IT) outsourcing can be defined as “the significant
contribution by external vendors in the physical and/or human resources associated with
the entire or specific components of the IT infrastructure in the user organization”
(Lawrence & Venkatraman, 1992). The current global economy has led to a spate of
outsourcing jobs and services to developing countries by developed countries. IT is no
exception, and India has emerged as a major outsourcing destination for countries around
the world. According to a KPMG report (KPMG, 2005), “around 250 of the Fortune 500
companies are clients of Indian Information Technology companies”.
2.1.1 Outsourcing Advantages
Loh et al (Lawrence & Venkatraman, 1992) and Barthelemy (Barthelemy, 2001)
cited that reasons for outsourcing could range from economies of scale or scope achieved
by a vendor serving several clients on similar technology or working on a wide gamut of
technologies and leveraging their experience for the best-suited technology for the client
requirements. The IT training budgets might be bigger than the whole IT budget of an
enterprise and the time spent on training might be longer than the lead-time of delivery
by an expert vendor. Besides, no kind of training would make them equipped to handle
the intricacies learnt while working on a project that the vendors have already achieved
by working on several similar projects.

8
They also suggested the another reason for outsourcing IT jobs is the vendor’s
better understanding of trends in the IT industry and thus ability to offer leading-edge
software and systems. The vendor that is an IT company has its core-competency in
software development, faces more-varied issues, and can thus have more expertise than
their individual clients can. They often have employees with several years of experience
in specialized areas that their customers may have to deal with once only. For example: a
company that has to migrate from legacy systems to an ERP6 system would be at a much
lower knowledge base as compared to the vendor who has implemented several such
migrations across several industries verticals.
Other than the factors mentioned above, Grover et al (Grover, Cheon, & Teng, A
descriptive study on the outsourcing of information system functions, 1994) suggest that
the risk of technology obsolescence could be minimized by outsourcing. The high risk of
technological obsolescence can be passed on to the service provider and the service
provider handles the risk by its “ability to diversify the risks across a broad range of
service receivers”. Grover et al also suggested that, instead of spending their valuable
resources on understanding and managing the complex IS7 infrastructure, companies can
focus on their core business by outsourcing the IS infrastructure. This in turn helps the
firm to “focus available IS talent on IT activities that promote competitiveness rather than
routine activities of systems maintenance or operations”.
6 Enterprise Resource Planning 7 Information Systems
9
2.1.2 Outsourcing Disadvantages
Like every aspect of business, outsourcing is not without its share of concerns and
has certain dark sides to it. One such dark side could be hidden costs associated with
outsourcing that may not be evident at the outset. Barthelemy (Barthelemy, 2001)
suggested that 14% of the 50 companies surveyed by his paper termed their outsourcing
experience a failure because they failed to include the hidden costs in their risk
management. Barthelemy suggested four hidden costs behind such experiences:
• vendor search and contracting (time and cost associated with searching a vendor)
• transitioning to the vendor (switching in-house activities to the vendor)
• managing the outsourcing effort (agency costs associated with managing the vendors)
• transitioning after outsourcing (switching vendors or reintegrating IT activities
internally)
These hidden costs should be planned for and provisions be made for these
contingencies to mitigate the risks associated with these hidden costs. The organizations
that failed to see these hidden costs in the beginning and thus did not make provisions for
cost or schedule overruns are often not prepared when faced with the realities of these
hidden costs. On the contrary, the organizations that proactively plan for these
contingencies are better equipped to face them with sufficient buffers for each type of
hidden cost.
Quinn (Quinn, Strategic Outsourcing: Leveraging Knowledge Capabilities, 1999)
suggests that since the vendor has more knowledge depth than the customer does, the

10
customers may not be able to guide the vendors by direct orders. Often the customer is at
vendor’s mercy to help them with the issues faced in the development that might be
solely due to the incompetency of the vendor. It may also not be possible to measure the
impact of the supplier’s contribution and the customers may fail to strike a balanced deal
with the vendors, who are experts in the specific technology. Not understanding the
amount of effort needed to offer the service; a customer is not in a position to evaluate
the service cost efficiently and may end up overpaying for the services provided.
Outsourcing may also lead to internal backlash from staff that either fear for their own
jobs or are apprehensive of outsourcing not achieving the responsiveness that can be
achieved internally. According to Palley (Palley, 2007), outsourcing can have “significant
effects on wage levels and employment conditions by affecting a worker’s sense of
security and bargaining power”. It is not only the fear of job loss, it is also that the
workers lose their power to bargain for their remuneration or benefits due to fear of
exerting excessive pressure, leading to their jobs being outsourced. There is also a fear of
information pilfering to competitors who also are clients to the vendor.
Grover et al (Grover, Cheon, & Teng, A descriptive study on the outsourcing of
information system functions, 1994) suggest that outsourcing reduces “real or perceived
control over the quality of software and timetable of a project” because the work is
executed by a vendor not under direct supervision of the company management. They
also suggested that the outsourcing reduces the long-term career prospects for IS staff
and, as a result, employee turnover for IS staff is much higher.

11
2.1.3 What to Outsource
According to Quinn et al (Quinn & Frederick, Strategic Outsourcing, 1995), a
company should develop its core-competency in-house, “where it can achieve definable
pre-eminence and provide unique value for customers” and “strategically outsource other
activities including many [activities] traditionally considered integral to the company, for
which the firm has neither a critical strategic need nor special capabilities”. A firm’s
survival in the market depends upon how it adapts itself to the changing trends in the
industry and whether it is at the forefront of innovation in its core business. Trying to
manage an ever changing complex world of Information Systems would leave a part of
the firm’s resources dedicated to its non-core IT part and that would eventually have to
be compensated from other areas of the firm, which often is the core business.
According to a Computer Economics report (Computer Economics, 2006), the eight
major categories of IT outsourcing are Software Development, Website/E-Commerce,
Hosted Applications, Disaster Recovery Services, Network Operations, Desktop Support,
Data Centre Operations and Help Desk operations. This list can act as a guideline about
the industry trend in outsourcing their jobs. However, no organization should outsource
its core-competency activities. For example: for an software development organization,
software development is its core competency, and, while it is safe to outsource non-
critical modules of their development process, the outsourcing of the crucial and core
modules of their development should be avoided.

12
2.1.4 Outsourcing Checks
Quinn (Quinn, Strategic Outsourcing: Leveraging Knowledge Capabilities, 1999)
suggests six steps to ensure a smooth functioning of outsourcing operations. They are
“ensuring goal and value congruence” (aligning the vendor’s and customer’s value and
incentive system), “highly trained procurement and contract management group”
(checking the vendor agency costs by improving their knowledge through constantly
evaluating best-in-breed solutions from many sources), strategic and operational
monitoring to ensure that “the supplier is not moving in directions inimical to the buyer’s
interests’, calculating “insourcing transaction costs and actively measuring the benefits
intended from the outsourcing relationship” (comparison of internal development costs
including transaction costs viz a viz outsourcing costs), “developing feedback systems to
leverage and share knowledge and innovation” (gaining from vendor’s expertise on the
field) and creating a “mutual three level contact system” (including top managers,
champions on both side, bench and operating level personnel).
Barthelemy(Barthelemy, 2001) suggested that hidden costs related to IT can be
reduced by outsourcing activities that are not idiosyncratic or shrouded with too many
uncertainties, spending some time researching vendors, contracting or hiring people with
outsourcing experience, drafting the right contracts, cultivating vendor relationships and
having a key IT skill base in-house. IT outsourcing should be carried out after detailed
analysis as against trial and error experience. Barthelemy suggested that companies
“should watch for managers with experience in outsourcing, joint-ventures management

13
or leading multi-skilled or cross-functional teams” in order to hire and retain such
individuals.
Grover et al (Grover, Cheon, & Teng, A descriptive study on the outsourcing of
information system functions, 1994) suggest five levels of outsourcing: Complete
Outsourcing – transfer of entire IS centre, Facilities Management Outsourcing – where
there is a shortage of IT staff, Systems Integration Outsourcing – medium level of
internalization of technological and human resources, Time-Sharing Outsourcing –
practised in the late 1950s with mainframe computers and Other Types of Outsourcing –
rental / installation / maintenance contracts. They classify those five types under two
broad categories of outsourcing of human resources and of technological resources and
explained the extent of outsourcing in each case with the help of a 2x2 matrix (refer to
Figure 1). The authors plotted internalization (opposite of outsourcing) of the two types
of resources and show the placement of the categories under the five levels of
outsourcing mentioned above.
Figure 1: Alternative Types of IS Outsourcing by Permission
(Grover, Cheon, & Teng, 1994)

14
2.1.5 Outsourcing Reasons
According to Lawrence et al (Lawrence & Venkatraman, 1992), the decision to
outsource IT depends on several factors at the levels of the economy, industry and firm.
The factors can be caused by trends and cycles in the economy, industry or gaining a
competitive edge by increasing information flow and productivity by leveraging the
expertise of IT vendors to develop state of the art information systems. The authors
developed a research model based on several hypotheses and concluded that a firm’s
business cost structure is positively related to the degree of IT outsourcing (i.e. firms with
higher business costs are more likely to outsource their IT) , the firm’s IT cost structure is
positively related to the degree of outsourcing and the firm’s IT performance is
negatively related to the degree of IT outsourcing. Business cost structure was defined as
the cost directly associated with product line production. The authors argue that, since IT
is an integral part of running the business, with a higher business cost structure, firms
would look for options to reduce their costs and may thus outsource their IT systems. The
same logic is applicable to the IT cost structure as well. A firm that does not have a
strong business cost structure but nevertheless a high IT cost structure is also likely to
outsource jobs as an option to reduce cost and improve strategic positioning. Lastly, the
authors suggest that with the increasing role of IT in the corporate world, management is
becoming more conscious about the return of investment on their IT infrastructure and
are concerned with “reconfigure[ing] their IT infrastructure in ways that ascertain the
benefits in a clear manner”. With a decrease in IT performance, management would be

15
looking for options to improve IT returns on investments, and one such option would be
to outsource their IT infrastructure or projects.
Figure 2: Strategic Intent for IT outsourcing by Permission (DiRomualdo & Gurbaxani, 1998)
DiRomualdo et al (DiRomualdo & Gurbaxani, 1998) also support the reasons
outlined by Loh et al. According to them, “the motivations for IT outsourcing are
evolving from a primary focus on cost reduction to an emerging emphasis on improving
business performance”. The authors suggest that the IT outsourcing plays an increasingly
prominent role in strategies designed to close the gap between existing state of the art
technologies and the in-house IT capabilities and skills of firms. DiRomualdo et al
suggest three strategic intents for IT outsourcing: IS improvement, Commercial
Exploitation and Business Impact (refer to Figure 2).

16
2.2 A Primary Outsourcing Survey
A literature search did not produce any studies on why a company in the Lower
Mainland would outsource their operations and / or in what forms of outsourcing it would
engage. Due to this lack of knowledge, it was decided to perform primary research with
Lower Mainland companies to determine the reasons for their outsourcing. However,
project members had only previously performed basic phone research and wanted to
improve the research response rates and consider any new techniques and avenues that
would improve research feedback. In order to do this, a literature review was conducted
on surveys ((i.e. phone, person-to-person interview or web-based) and their effectiveness.
Following this, the most suitable survey method was chosen and developed.
2.3 Surveying Literature
Zhang (Zhang, 2000) indicates that surveys are an extensively used form of
research in many disciplines. For example, in business, surveys are used to determine
market size and demand for a product. In medicine, surveys can be used to determine
social attitudes and to map lifestyles with diseases. Surveys are used in politics to
determine the popularity of a candidate or a policy. Although surveys are extensively
used, Zhang also identifies the main challenge in surveys is to “conduct studies
efficiently and effectively while retaining validity”.
2.3.1 Traditional Surveys and their Effectiveness
Before the Internet came into common use, surveys were primarily conducted
through posted mail since mail surveys were the cheapest form of survey mode (Fricker

17
& Schonlau, 2002). However Zhang (Zhang, 2000) indicated that this method suffered
from a low response rate and slow response time. Ilieva (Ilieva, Baron, & Healey, 2002)
also indicated that, in addition to the low response rate and time, traditional surveys
suffered from transcription error. Transcription error occurred when the data was copied
from the completed questionnaire to the statistical tool for analysis. This error resulted in
non-response errors (i.e. a blank response) and data entry errors.
2.3.2 Web-Based/Internet Surveys and Their Effectiveness
When the Internet grew rapidly in the 1990s, it became obvious that this would be
an ideal tool to obtain survey measurements. Surveys were easier to administer - users
were given a link to a website where they would enter the data or the respondent could be
provided with an e-mail that would be filled up and returned. Fricker (Fricker &
Schonlau, 2002) compared the perceived improvements of web over traditional surveys
in four areas: responsiveness, timeliness, cost, and data quality.
For responsiveness, when an open population was surveyed, the response rate was
low at about 8%. However, in closed populations (for example, surveying professors
within a specific university), the rates were 19% or higher. Of course, the response rate
was much higher if the sample population had access to a computer. For example, a
survey of potential students to a university yielded an 8% response rate while the
response rate of students at a university (with ready access to a computer) was more than
35%. Overall, Fricker et al (Fricker & Schonlau, 2002) found that the rate was much
higher for closed populations than for open populations.

18
The literature was not clear on the timeliness of the responses of traditional surveys
versus Internet surveys. There is no doubt that the response time of an Internet survey is
faster than a mail-in survey. However, with Internet surveys, there is fielding time, the
time from which the survey is posted on the web until the responses are adequate. Fricker
indicated that a prominent commercial survey company had to leave the survey on for
about 1.5 weeks in order to achieve a response rate of more than 80%.
2.3.2.1 Quality
Solomon (Solomon, 2001) cautions, “the biggest concern in the Internet surveying
is coverage bias or bias due to sampled people not having access or choosing not to
access the Internet.” Couper (Couper, 2000) also identifies coverage error as the “biggest
threat to inference from Web surveys.” Solomon and Couper identify that the source of
the coverage error is from accessibility to the Internet. Even though Internet access is
increasing, the population that has access to the Internet to fill out a survey is actually
less than what can be achieved using conventional survey modes such as the telephone or
mail. Furthermore Fricker (Fricker & Schonlau, 2002) indicates that the Internet access
and computer literacy are not only required, compatible hardware and software are
required to ensure that coverage is adequate. As an extreme case, a customer who has a
computer but no Internet access is unable to obtain or return a survey. To address these
concerns, Dillman (Dillman, Tortora, & Bowker, 1998) recommends a “dual-mode
strategy” to improve coverage by sending an e-mail or mailing a potential respondent a
notification of a survey. Following acknowledgement by the end user, the potential
respondent is then provided access to the survey to complete.

19
2.3.2.2 Cost
Fricker (Fricker & Schonlau, 2002) found that internet surveys are cheaper than
traditional methods if only the mailing and printing costs are considered. However, if the
programming and labor costs are added in, the Internet costs can be significantly higher.
The advent of several free websites (for example: http://www.surveymonkey.com) for
surveying, has reduced the cost of programming and manpower to practically negligible
other than the staff needed to create or process the survey, which would have been
needed for mail-in survey as well.
2.3.2.3 Sample Type
Schonlau et al (Schonlau, Fricker, & Elliott, 2002) recommend using a probability
sample if the larger population can be inferred based on the survey sample. Otherwise, a
convenience sample should be used. “If the researcher has established that a probability
sample is required, he or she must then determine how to contact the surveyed population
or how to develop a sample frame. On-line advertising is not an option for generating
probability samples.”
2.3.2.4 Response Rates
Schonlau et al (Schonlau, Fricker, & Elliott, 2002) state that response rates range
from 7 to 44 percent for Web surveys and 6 to 68 percent for e-mail surveys. Response
rates can be improved if a company is formally contacted and there is follow-up on the
survey. They also suggest that the “the most effective use of the Web seems to involve a
sequential fielding scheme in which respondents are first encouraged to complete a
20
survey via the Web and then non-respondents are subsequently sent a paper survey
through the mail.”
Couper (Couper, 2000) also cautions that a there is a possibility of non-response
from e-mail surveys sent to companies. This is primarily due to confidentiality: “Some
organizations keep records of all incoming and outgoing messages, and if the topic of the
survey is particularly sensitive, this may discourage employees from completing
company related surveys at the office.”
Schmidt (Schmidt, 1997) suggests that in keeping with ethics, informed consent can
be obtained from the respondent in two ways. These methods of achieving informed
consent are by setting up the survey so the the user needs to click on consent before being
sent onwards to the questionnaire or by “instruct[ing] the user not to submit their results
unless he/she has read and agreed to the content of the informed consent form.”
2.3.2.5 Survey Principles
Some of the relevant survey design principles are outlined by Schonlau et al
(Schonlau, Fricker, & Elliott, 2002).
1. List only a few questions per screen. This reduces clutter, excessive scrolling and
allows a respondent to concentrate on a few questions at a time. Grouping similar
questions allows the respondent to frame his thoughts in a particular area.
2. Eliminate unnecessary questions. For example, eliminate questions where answers
which can be easily determined by the computer (for example, the date that the
questionnaire was filled in).

21
3. Use small graphics to reduce any possibility of slowdown. Slowdowns should be
avoided to reduce any frustration with the respondent. If graphics are used, they
should be relevant to the question and should help interpret the question.
4. Restrict the number of responses to reduce errors. Open ended questions should
be avoided in order to reduce any errors.
5. Use matrix questions sparingly since these questions create a lot of work for the
user on a screen. Matrix questions have a response scale from 1 – 7 (such as the
Lickert Scales).
6. Indicate survey progress by using a progress bar. For a mail survey, the
respondent can view flip through the pages to understand the size of the survey.
For an internet survey, a progress bar will provide a similar indication. Without a
progress bar, the survey can turn into a “seemingly endless stream of questions”.
7. Assure the respondents that their data will be kept confidential and protected. This
will provide them with the assurance of privacy of their data. This can be
achieved by indicating to users that the data is encrypted when being transmitted
online.
8. If respondents are unable to complete a survey, give them an option to complete
the survey later. This may be required if the surveys are fairly long. Giving them
an option of later completion can be achieved by either providing a password to
the user, or placing a cookie on the computer so the respondent can start where he

22
left off. The other option is to delete any previous entries and start afresh each
time the user logs on.
9. Avoid forcing answers. A forced answer is where the user is unable to proceed
without entering some information. Forced answers should be avoided since it
may make a frustrated user to give an erroneous answer in order to proceed to the
next screen.
10. Validate the input as it is being entered. This will lower the possibility of non
response questions. The user should be prompted to reenter the information if it is
incomplete or not selected. However, this should also be balanced with forcing an
answer as discussed in the previous point.
11. Test a survey before it is released and allow respondents to easily report any
problems or bugs. The survey may be tested with a sample within the population
and the questions, response rates and the compatibility of the survey with the
population’s hardware and software should be considered. For example, when
surveying respondents within a population of Linux users, the Internet survey
should be tested on a Linux operating system for compatibility and speed.
Dillman et al (Dillman, Tortora, & Bowker, 1998) list similar principles to Schonlau et al, 2002 but adds the following:
1. On the opening screen, provide instructions to the respondents.
2. “Begin with a question that is fully visible on the first screen which is easily

23
comprehensible and easily answered by ALL respondents. “
Schmidt (Schmidt, 1997) adds two more suggestions:
1. If uncontrolled access to a survey is a concern, then restrict access to the survey
by providing a password to the respondent. This is especially true if sampling a
closed population set such a specific set of businesses. Instead of allowing anyone
access to the site, provide a password so only specific person or businesses may
access the sire for the survey.
2. Collect some demographic information “to ensure that the population being
considered is appropriate for the conclusions that are drawn.” Demographic
information is relevant to the field of the research being carried out. For example,
if surveying businesses about their market, their head office location and size and
income may be a relevant demographic.
2.3.3 Lessons from the Survey Literature Review
Based on the survey literature review, a web-based business survey will be
conducted on a closed population, which will provide an increased response rate and less
noise from possible unwanted respondents. The survey will also involve a personalized e-
mail invitation to specific customers in order to improve their response rate. We will also
have to be prepared for a survey response of at least 7%. Since this is a business survey,
non-response errors may occur due to confidentiality: therefore respondents will be
provided with an agreement that data is only provided in aggregate and no personal
information will be provided in the published survey.

24
A web-survey was chosen because most of the survey principles provided by
Schonlau et al (Schonlau, Fricker, & Elliott, 2002) have already been implemented.
Several sites have templates with confidentiality agreements, various question types
(matrix, drop down lists), logic branching, progress bars and survey testing capabilities. It
was also chosen since it afforded the largest coverage through e-mails and therefore
possibly increasing response rates. A traditional survey will not be performed since it has
a low response rate, requires a long response time and may have transcription errors.
25
3: TARGET MARKET
As mentioned in the introduction to the survey literature review, the project was not
aware of any information on outsourcing by Lower Mainland companies. Therefore, a
web-based survey was developed to poll Lower Mainland companies for their feedback
on what forms of outsourcing they perform. Lower Mainland companies thus were the
target market for the survey. Although our report is primarily intended for Lower
Mainland companies, we believe that the principles observed in the survey may be
applicable to other companies in Canada. The belief is based on the assumption that the
business requirements and the legal obligations are similar across Canada and is not
supported by research or statistical analysis.
The primary goal of the survey was to learn the type of outsourcing performed by
Lower Mainland companies. We were interested to find out if they outsourced their
work, the types of work being outsourced, the countries that the work was outsourced to
and if they had not outsourced, what their interest in outsourcing would be. In addition,
,we wanted to check what they are looking for when outsourcing: quality time, the speed
of delivery and financial aspects of this. Demographic information would also be
collected in case this is required for further analysis.

26
3.1 Survey Development
The survey was designed and developed by reviewing the literature on outsourcing
and survey methodologies as discussed in section 2.3. The questions were also reviewed
to ensure that all information was pertinent to research associated with this project. Logic
branching was applied to guide the clients through appropriate questions. For example: if
a client selected that they have an in-house software development team, then the next
group of questions was about their software development (team size / budget et al)
otherwise, the software development group of questions were skipped for them.
Depending upon client’s answer to “whether they have outsourced any IT project”
question, they were directed towards outsourced projects related questions or if they
would be interested in outsourcing their IT projects. If the answer to outsourcing projects
was affirmative, then they would be asked if they were interested in outsourcing IT
projects to India. Thus, the survey guided them with the questions relevant to their
business needs without getting into complications of them skipping questions or reading
guidelines about every question.
The survey, which is in Appendix A, consisted of 33 questions and, depending
upon their answers, a client could end up answering anywhere between 6 to 21 questions.
A client who neither has outsourced any IT project nor is interested in outsourcing in
future would end up answering no more than six questions. Answering the questions was

27
voluntary (including the company information) to remove any apprehension with clients
about disclosing their company information on the Internet.
3.2 Client Selection
The clients were selected from a list of companies within the Lower Mainland.
Most of the information about the Lower Mainland companies was collected from a
database in form of a multi-sheet MS-Excel spreadsheet prepared by Business in
Vancouver (BIV), a Lower Mainland newspaper. The BIV database was sorted by the
newspapers themselves into several categories : hi-tech companies, biotechnology
companies, telecommunications, software publishers, accounting firms, ad agencies,
airlines which had offices in Vancouver, vehicle dealerships, banks and credit unions,
charitable organizations, commercial printers, commercial property managers,
construction, engineering and consulting firms, financial planners, food franchises,
graphic design, hotels, insurance brokers, interior design, law firms, manufactures,
marinas, mining companies, newspapers, post secondary institutions, public relations
companies, golf courses, and radio stations. The BIV list was not comprehensive. There
were several companies that students in the 2006 MBA cohort attended and were not
listed in this list. Therefore, students within the 2006 cohort of the Simon Fraser
University Management of Technology MBA program were also surveyed in order to
cast the net for the survey as wide as possible. Surveys were also sent to colleagues who
had contacts to companies not on the BIV list.

28
Since almost all companies need IT in one form or other with requirements ranging
from developing a website to complicated e-commerce systems, it was decided that the
emails should be sent to all the companies in the BIV database. The intent of the survey
was to poll companies in a diverse range of fields to ensure that the results could be
applicable to any company across any industry vertical as long as the company is willing
to outsource its IT services / projects to India. An email was sent to around 500
companies in the list to participate in the survey. The clients were promised anonymity
with respect to the information they provided to protect their identity and business
practices and hence to increase the participation chances in the survey. The email sent to
clients also requested them to forward the mail to anyone else who they think can provide
input to the survey.
3.3 Survey Instruments
The Internet was used as the survey instrument for fast response rate (Zhang, 2000)
and to avoid transcription errors (Ilieva, Baron, & Healey, 2002). As suggested above,
transcription error occurs when the data is copied from the completed questionnaire to the
statistical tool for analysis. This error resulted in non-response errors (i.e. a blank
response) and data entry errors. Besides, as learnt while researching on effective strategy
for surveying for this project, the Internet option is easy to administer, as users could be
easily directed to a link to the survey, thus leading to the improvements in
responsiveness, timeliness, cost and data quality as suggested by Fricker (Fricker &
Schonlau, 2002). It is convenient for users to go to a link, which is readily available in
their email, thus enabling them to fill it in at their convenience. The only costs associated

29
SFU Web Survey Survey Monkey Question Pro Web-site www.websurvey.sfu.ca www.surveymonkey.com www.questionpro.com Price Free $19.95 per month
(Monthly Pro account) $15 per month (Professional Edition)
Allows questions to have a mandatory (required) answer
Yes Yes Yes
Capability to generate an E-mail to respondents?
Yes Yes Yes
Logic Branching
No Yes Yes
Survey can be pretested with data
No Yes Yes
Records who has responded to the survey
No Yes Yes
Progress Bar No Yes Yes Comment Boxes
No Yes Yes
Number of Responses
Unlimited 1000 per month Unlimited
Allows html code for external linking and text formatting
No Yes Yes
Downloadable responses to a database
Yes, Comma delimited (CSV) file
Yes, CSV and MS-Excel file
Yes, CSV and MS-Excel file
Table 1: Features Comparison of Web Survey Websites
with the survey are those of subscription fees paid to the survey-hosting website. Some of
the basic websites are free where as those others, which offer a wide range of services,
offer them at different price. The survey principles suggested by Schonlau et al

30
(Schonlau, Fricker, & Elliott, 2002) and outlined in section 2.3.2 - Web-Based/Internet
Surveys and Their Effectiveness - were followed.
While researching on the website suitable for our survey, we shortlisted a few
websites: SFU web-survey website (http://websurvey.sfu.ca ), SurveyMonkey
(http://www.surveymonkey.com/) and QuestionPro (http://www.questionpro.com/). The
SFU website is free, whereas both SurveyMonkey and QuestionPro offer both free as
well as paid services. The rates for paid services are staggered depending upon the
requirements for the survey. The following table lists the features and advantages of
using each survey site:
After due diligence about the features, price and project requirements of each
survey provider, and comparing the features, QuestionPro was chosen as a survey tool
most suitable for the project since it had the lower price and the feature set that we
needed to conduct the survey.
3.4 Conducting the Survey
The survey was activated on the www.questionpro.com site for 10 days (activated
on July 10th and closed on July 21st). E-mails were sent to all 500 companies that were
listed in the BIV database. In addition, the 2006 MBA cohort and personal contacts in the
industry were used to contact companies not listed in the BV database. 37 people /

31
company representatives completed the survey, 21 started but did not complete and 76
viewed the survey, meaning 18 viewed but did not care to start the survey. The response
rate is 37/500, which is 7.4%. This response rate is in line with those suggested by 8%
suggested by Fricker et al (Fricker & Schonlau, 2002).

32
4: ANALYSIS
4.1 Data Collected
Complete survey data was collected from 37 clients, whereas incomplete data was
collected from 21 clients. The clients with incomplete data decided to terminate the
survey without completing it. The reasons for the same are not known, but could be
attributed to not finding the survey relevant or interesting, system crash or any other
priority emerging during the survey session. Nevertheless, even the incomplete data,
wherever applicable, was used in the analysis. For example, around 46 clients replied to
the question whether they have an in-house software development team and the same is
represented in the analysis. Hence, the number of responses varies for different questions
depending upon the number of clients that chose to reply to the question.
4.2 Data Observation
4.2.1 General Observation
The data gathered provided following information from the survey respondents.
• More than half (52%) had some form of in-house software development.
• Among the respondents who had in-house software development, 52% had less than 5
developers in their Software Development department.

33
• Around 67% had an in-house software development team of between 1 to 5
developers.
• About 52% also allocated 10% of their budget or less to their software development
efforts.
• Around 76% of the respondents have outsourced their IT projects in the past.
• Around 40% of the respondents have outsourced their web site / ecommerce
development efforts and around 17% outsourced their networking operations. 13%
outsourced software development and 11% outsourced their disaster recovery
services.
• 60% spent more than $20,000 on the outsourced projects and 38% said that the
average effort required is between 10 person weeks and 26 person weeks.
• 44% were outsourced only to Canadian companies, 41% to non-Canadian firms and
only 15% outsourced to both Canadian and non-Canadian companies.
• Among those who have never outsourced their IT projects, only 33% were interested
in outsourcing their IT projects.
Respondents were also asked if there were any reasons for not outsourcing. Most of
these fell into the reasons of need. Some of the responses were:
- “Working on a new product that does not require outsourcing at this time.”
- “Nothing to do with software. We are an import/export company.”

34
- “We do web-site development - too small to outsource and we can do all the
development ourselves.”
- “No IT jobs to outsource.”
- “We work on small projects and need tight control over how they are built.”
4.2.2 India Specific Observations
• More than half (53%) of the respondents to the survey have outsourced their projects
to India.
• Among those who have not outsourced their IT projects to India, 41% are interested
in outsourcing their IT projects to India.
• Among those who are interested in outsourcing their IT projects to India, 33% are
interested in outsourcing their IT projects to small vendors only and to 55%, the size
of the vendor did not matter.
• To 89% of the respondents interested in outsourcing their IT projects to India, the age
of the vendor business did not matter.
• 80% of the vendors are interested in outsourcing projects to India due to low costs
and only 20% felt that because software development is not their core competency.
None of the respondents is interested in outsourcing to exploit the expertise of the IT
vendor or to share the cost with other clients of the vendor.

35
• 78% of the respondents required some kind of reference from the vendor, where as
22% felt that it was not important.
• Not even a single respondent felt a need for any quality practices from their IT
service provider.
• Around 78% of the respondents are willing to issue advance payments against the
contract whereas no respondent is interested in paying more than a 20% advance to
their IT vendors and only 22% of those who are willing to pay any advance need
some form of security (bond or guarantee) against the advance paid to protect
themselves.
Some of the comments received about the reasons for outsourcing IT projects to
India are outlined below.
- Proof of Concept. They were the lowest cost offshore country by far.
- “Low cost and [high] quality of developers.”
- “We contracted with a vendor that employed Indian resources. The Indian team
offered additional capacity at a low cost to help us meet our development
deadlines and target budget.”
- “They quoted the lowest price and were able to provide the most resources
(people) to complete the project.”
- “Low price and good quality work.”

36
Some of the respondents provided other countries that they have outsourced to:
They include countries in Eastern Europe (Russia, Ukraine, Latvia, and Romania) and the
United States. When asked for reasons to outsource to these locations, the responses were
varied but it seems that proximity with the sites was important. Some of the comments
that were received:
- “Quality, near shore - offshore options, embedded staff.”
- “Strategic to establish good relationship to sell company's own products to
Russia”
- “Closer to their physical location” (this referred to a US company).
- “Having subsidiaries within those countries.”
For specifically not outsourcing to India, the following comments were received:
- “Not enough back end work. Most of our work is design interface work and we
would not outsource that. In the other work, it has been developing systems for
our company internally, and it has meant many face-to-face meetings through the
development process as the outsourced firm observed our systems and procedures
and made recommendations for software to run them”.
- “The only IT work we have we feel requires a consultant that is available. Our IT
requirements are very basic and therefore do not require more than an
independent consultant. Developers cannot be easily brought into a face-to-face
meeting with management in the event of an unexpected change in scope, or

37
schedule. Developers cannot interact directly with the stakeholders to optimally
understand their usability needs."
- “We prefer to have a local contact that will be able to work with us”.
- “We have contracted help desk support to a company in the Philippines”
- “Proximity to our service provider in Vancouver”
- “Local web-site development.”
38
5: RECOMMENDATIONS
The observations in this project indicate that companies in Lower Mainland are
outsourcing their IT projects to India. Among the companies that are not outsourcing, a
good proportion is interested in trying out Indian vendors and the size of the vendor is not
a criterion in the client’s determination. Based on these observations, we recommend the
following to Indian vendors interested in exploring Lower Mainland (or Canadian) IT
projects.
5.1 Recommendation 1: Indian vendors should continue to differentiate themselves through low cost and high quality
Vendors should continue to maintain their low cost image but they should also
maintain the good quality of their development work. India continues to be perceived as a
low-cost and good quality destination and a large majority (80%) of the respondents in
our survey have indicated so. Dossani et al (Dossani & Kenney, 2003) state that the
primary reason for outsourcing were the cost savings and the quality provided by the
vendors. Their study found that clients require savings of about 40% in order to make
outsourcing worthwhile. However, they found that the savings were much higher than
40% in most cases. “One Fortune 500 firm that consolidated several fulfilment operations
to Bangalore reported that the overall cost savings were 80 percent.
It is practically impossible to calculate the cost saving that can be offered to a
specific client as it depends upon several factors like their cost of hiring developers,

39
overhead costs and their experience with similar products. As a result, the authors could
not locate any research that could show the ballpark figure for software development in
North American companies. Thus to be competitive, Indian firms should develop their
own costing model that is quick and reinforces itself through a positive feedback loop,
where the model efficiency improves after every project it executes.
One such model is the Function Point Costing Model suggested by Matson et al
(Matson, Barrett, & Mellichamp, 1994). “A function point is a unit of measurement to
express the amount of business functionality an information system provides to a user”8.
It helps in calculating the effort required to develop an information system (a software
application) and is independent of the underlying platform. A single strategy can thus be
developed to calculate the effort required for all the software languages or platforms used
by the vendor. Matson et al (Matson, Barrett, & Mellichamp, 1994) suggest that the
vendor can develop a model to calculate the cost needed to develop a unit function point
and can fine tune the model as they grow familiar with the model and have positively
reinforced their model using the result from the projects they executed. To start with the
model, the vendors can calculate the cost they incurred while delivering the project and
the function points in the project to get a unit cost for function points for their future
projects. Developing software according the specifications and client requirements meets
the basic requirements for successful completion of the project. The meeting of
8 http://en.wikipedia.org/wiki/Function_point

40
specifications and client requirements can be consistently checked with help of surveys
after achieving major milestones of the project and at the completion of the project.
Another strategy for improving the service quality to their clients is identified in a
study by Hirschheim et al (Hirschheim, Heinzl, & Dibbern, 2006, p. 386) who describes
several critical success factors for clients when outsourcing. One critical success factor is
the service quality by the vendor. Superior service quality provided by a vendor has an
immediate impact on the success of the vendor in obtaining a client’s project.
5.2 Recommendation 2: Getting certified in quality standards is not necessarily a differentiating factor
Clients were not particular about any of quality standards followed by Indian
vendors. In fact, the survey indicated that none of the clients suggested it as a
requirement for Indian vendors to follow. As a corollary, we can recommend that cost
cutting may be achieved by reducing the rigor in meeting quality standard certifications
such as CMM (Capability Maturity Model – refer
http://en.wikipedia.org/wiki/Capability_Maturity_Model for details) or ISO 9000 (refer
http://en.wikipedia.org/wiki/ISO_9001 for details) etc.
There have been several studies that indicate that Indian SMEs are engaged in
establishing quality standards. Sharma et al, (Sharma & Bhagwat, 2006) did an analysis
of 147 Indian small and medium sized enterprises and found that 70% of the firms were
interested in establishing performance measurement factors and are looking to improve
their quality standards. The survey found that such practices would not give any strategic
advantage to small vendors while competing in North America. On the contrary,

41
implementing these standards is not without costs. There are two types of cost associated
with such standards: Certificate cost and Maintenance cost. Barnes (Barnes, 1998) has
suggested that it takes “6 – 12 months of training and preparation period followed by an
intensive year-long effort to adapt one’s procedures to the ISO standard to acquire ISO
certification”. On top of these time costs there are monetary costs like registration costs,
certification costs and maintenance costs (ISO certified companies are audited every six
months and there are internal audits prior to official audits).
Since customers’ decisions are not affected by vendor affiliation with standards, it
can thus be recommended that the vendors save these costs and pass these savings on to
the customers, thereby having a cost advantage with respect to the competition. As cost is
one of the most important reasons for customers to award projects, the vendor can thus
gain strategic advantage.
5.3 Recommendation 3: Build a strong reference list by providing quality work to previous clients
Although clients have indicated that they were not concerned with quality
standards, 78% required some form of reference in order for a vendor to be considered. A
vendor can only be provided with a reliable reference if they have met or exceeded the
expectations of their clients in previous projects. Therefore, we recommend that vendors
start producing quality work at the outset to start building a list of references
immediately. We would also recommend that, for each project, a strategy is developed to
obtain references. References may be posted on the website to provide immediate
confidence in the quality of their work. Alternatively, they should automatically be

42
provided to any client when proposing or bidding for a project. Providing quality work
and having happy clients are keys to a successful business. A happy client could bring
100 prospects and an unhappy client could take away 100 prospects. Stephanie (Overby,
The Hidden Costs of Offshore Outsourcing, 2003) also recommends that clients to check
vendor references and obtain peer input on the vendor as two items in a 5-item9 checklist
of outsourcing projects. Oza et al (Oza, Hall, Rainer, & Grey, 2005) surveyed clients to
determine the factors, which affected trust between an outsourcing client and vendor.
They found that that the primary means to achieve trust with a first time vendor was by
providing vendor references, which were relevant to the project. In fact relevant vendor
references was stated by 14 out of 18 clients surveyed which trumped other trust building
relationships such as previous project experience (9 out of 18 clients), reputation (6 out of
18 clients) and personal visits (5 out of 18 clients). Incidentally, after trust has been built
up through client references, this paper recommends transparency as the primary means
to maintain trust.
However, organizations face a catch-22 situation: how does an organization get
their first reference unless they get their first client, and how can they get the first client
until there is a first reference? Ruokolainen et al (Ruokolainen & Igel, 2004) suggest
several factors that play a role in getting the first reference. According to them, social
capital i.e. social network of the company management - often helps a company in getting
their first client. Another factor could be the background of the management, i.e., the
9 The five items were: Know your internal costs, Ask your peers for recommendations, contact the potential
vendor references, estimate soft costs (employee morale, layoffs) and create a 3 to 5 year plan.

43
management must have an impressive profile, which is achieved through either
outstanding academic credentials or working with “bigwigs” of the industry. The vendor
must assure the customer of protection of their intellectual property. The vendor who is
able to achieve one or more of these factors would have a competitive advantage.
Building a social network in North America can be difficult, but the vendor can try to
convince personnel in big industry players on equity participation if one of the partners
does not have an impressive profile to convince prospective customers. The chance of
attracting key personnel to small organization can be challenging but with the spate of
fortune 500 IT companies in India, it is definitely achievable.
5.4 Recommendation 4: In order to obtain more projects, start small and then move on to larger projects
According to the survey, 52% of the respondents indicate that projects of less than
$20,000 are primarily for web-site development and e-commerce development. This is
similar to a study by Al-Qirim et al (Al-Qirim & Bathula, 2002) who studied small and
medium sized enterprises in New Zealand (those earning less than $5 million per year).
They found that with increasing globalization and their own lack of resources to compete,
71% of the surveyed enterprises have innovated by outsourcing their business functions
to others who have the resources to do such service. Of the companies that have
outsourced, 46% were for web-site development, hosting, maintenance and integration.
According to our survey, clients do not care about the size of the vendor. Hayes et
al (Hayes, Hunton, & Reck, 2001) studied market reaction to announcements of a
relationship between ERP vendors and clients with respect to the vendor size. They found

44
that that a small, healthy vendor has good positive reactions from the market when a
relationship is announced. Therefore, smaller companies can take advantage of the
perceived low cost web-site e-commerce applications to develop a relationship with the
vendor knowing that the market will take positively to any news regarding a relationship.
Building a relationship with the vendor may eventually provide access to more
challenging projects. Since, among those who have never outsourced, only 33% were
interested in outsourcing their projects, vendors would use a similar strategy of
communicating low cost and superior quality to capture those who currently perform in-
house development.
5.5 Recommendation 5: Prepare a differentiation strategy with other countries that are competing
Companies should be aware that their bid may be compared to other vendors and/or
countries (most likely in Eastern Europe). Therefore, vendor strategies in Eastern Europe
should be examined to determine points of differentiation. Desai et al (Desai,
Weerakkody, Currie, Tebboune, & Khan, 2003) suggest a “Verticalization” strategy:
focus on a particular industry and excel in the knowledge of that industry. For example, if
a vendor specializes in the medical industry, they should be aware of all issues with the
medical patenting and approval processes in order to gain an advantage over rivals.
Pragmatic Marketing10 also proposes several differentiation strategies:
10 http://www.pragmaticmarketing.com/publications/magazine/1/2/07sj

45
• Performing a technology assessment comparing the technologies employed by
Eastern European outsourcers with that of India. Based on these technology
assessments, the Indian companies can see what aspects can be improved.
• A few survey respondents have indicated that they have outsourced to Eastern
Europe. Therefore, vendors should examine the macroeconomic structure in
Eastern Europe and determine the legal and economical advantages of these
countries compared to India. The vendor can then approach the client with a set of
answers to these questions.
• Perform a post mortem analysis for the reasons that contracts that are awarded –
whether to an Indian company or a competitor. This information can then be used
to improve future contract bids.
• Examine the pricing structures of these companies and use this information to
price their own projects advantageously
5.6 Recommendation 6: Improve communications between the vendor and client by providing a reliable local contact before bidding on a project
It is advisable that Indian vendors develop a strong communication channel with
their clients. Some of the respondents suggested their lack of interest in outsourcing to
Indian vendors was due to absence of any local contact and the difficulties faced in
organizing face-to-face meetings or due to time zone differences. For start-up companies,
it would be advisable for the Indian vendors to find a local consultant or sales
representative who can be hired on a commission basis or be awarded a portion of the

46
total project cost. This would occur until they grow enough to set up their own office in
Lower Mainland or any other part of Canada where they want to carry out the business.
Some communication issues can be traced to cross-cultural difficulties. Krishna et
al (Krishna, Sahay, & Walsham, 2004) indicates, “U.S. client companies normally work
with extensive written agreements and explicit documentation, reinforced with frequent
and informal telephone and email contact.” They also recommend that systems, controls,
audits, and monitoring using established technologies or procedures should be in place to
ensure good coordination and communication between the vendor and client.
Beyond cross-cultural differences, there is other advice which can improve the
chances of a successful partnership. Representatives and distributors can handle
miscommunications or rumours during the project by preparing a communications plan
with audits at regular intervals Zhu et al. (Zhu, Hsu, & Lillie, 2001) also recommend that
both the client and vendor handle any news releases in order to provide a balanced
viewpoint to the reader. Grover et al. (Grover, Cheon, & Teng, The effect of service
quality and partnership on the outsourcing of information systems functions, 1996), also
state that the “strong relationship between partnership and outsourcing success indicates
that fostering a long-term interactive relationship based on trust, communication,
satisfaction, and cooperation is critical to achieving the greatest benefits from
outsourcing.”

47
5.7 Recommendation 7: Financial considerations when bidding or proposing a project
Our survey indicates that vendors can negotiate an advance up to 20% of the final
project cost. This is the most that companies are willing to pay. 22% of companies will
also require some form of guarantee if the advance is provided. Bloch et al. (Bloch &
Spang, 2003) indicate that guaranteeing performance is one way to reduce risk. A
performance guarantee provides an incentive for a company to meet the standards of the
guarantee, Bloch et al also recommends splitting the cost of the benefits or savings
realized when a company meets the guarantee standards as an incentive.
In order to reduce the risk of failure, vendors should describe hidden costs in a
project as described by Barthelemy (3). We believe that vendors may be able to develop
an estimate of hidden costs through previous experiences with similar projects or by
hiring a consultant to review possible costs. A study by (Overby, The Hidden Costs of
Offshore Outsourcing, 2003) looked at the total cost of outsouring and identified several
hidden costs as a percentage of the final contract price. This is summarized in the
following table:

48
Categories of Hidden Outsourcing Costs Percentage of Final Contract Price (Estimate)
Vendor selection which includes travel and documentation (documentation and legal costs can take 0.2% to 2%).
1 to 10%
Transition costs – possible travel required by clients between Indian and the Lower Mainland to ensure that systems are in place and programmers are aware of what to do
2 to 3%
Possible layoffs and termination packages for employees at the client side that are affected by outsourcing
3 to 5%
Cultural differences and productivity lags (for example, a programmer in India may not inquire whether the program can be efficiently implemented but follows the specifications).
Up to 20%
Vendor programmer turn-over (attrition rates can sometimes reach 35%)
1 to 2%
Language differences and possible communication gaps 2 to 5%
Ensuring that in house procedures and software development processes are in place
1 to 10%
Audits and managing the logistics of the outsourcing project 6 to 10%
Table 2: Hidden Costs of Outsourcing
Vendors should also alleviate any concerns with the clients: such as wage and job
concerns, especially with IS staff. Overall, the effect on job losses due to outsourcing is
negligible across most industries. For example, Amiti et. al (Amiti & Wei, 2005) states
that “that jobs are not being exported, on net, from industrial countries to developing
countries as a result of outsourcing. In fact, the evidence suggests that workers who lose
jobs in one industry manage to find jobs in other growing industries.” Another study by
Kirkergaard (Kirkegaard, 2004) indicates that employment has not been affected by
outsourcing. His paper also notes that losing jobs to outsourcing nets nets an overall gain
to the economy in other areas. For example, jobs that are outsourced are low cost jobs
that that tend to be eliminated due to technological obsolence. These jobs tend to get
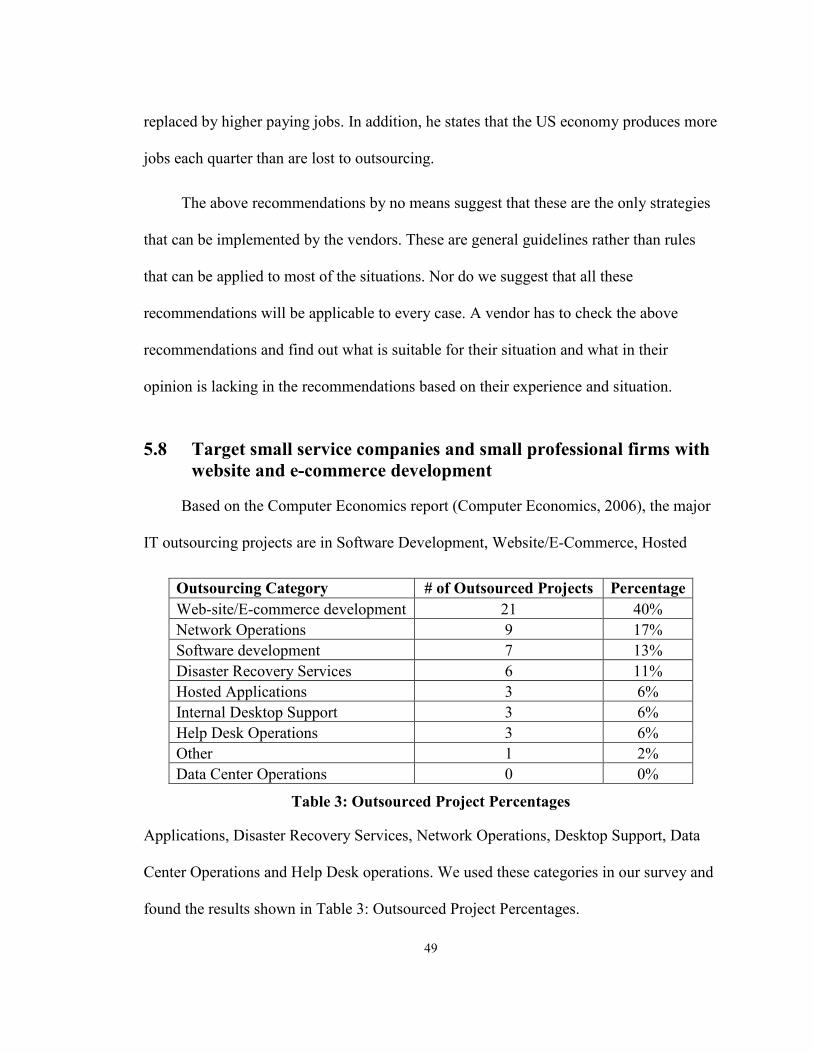
49
replaced by higher paying jobs. In addition, he states that the US economy produces more
jobs each quarter than are lost to outsourcing.
The above recommendations by no means suggest that these are the only strategies
that can be implemented by the vendors. These are general guidelines rather than rules
that can be applied to most of the situations. Nor do we suggest that all these
recommendations will be applicable to every case. A vendor has to check the above
recommendations and find out what is suitable for their situation and what in their
opinion is lacking in the recommendations based on their experience and situation.
5.8 Target small service companies and small professional firms with website and e-commerce development
Based on the Computer Economics report (Computer Economics, 2006), the major
IT outsourcing projects are in Software Development, Website/E-Commerce, Hosted
Outsourcing Category # of Outsourced Projects Percentage Web-site/E-commerce development 21 40% Network Operations 9 17% Software development 7 13% Disaster Recovery Services 6 11% Hosted Applications 3 6% Internal Desktop Support 3 6% Help Desk Operations 3 6% Other 1 2% Data Center Operations 0 0%
Table 3: Outsourced Project Percentages
Applications, Disaster Recovery Services, Network Operations, Desktop Support, Data
Center Operations and Help Desk operations. We used these categories in our survey and
found the results shown in Table 3: Outsourced Project Percentages.
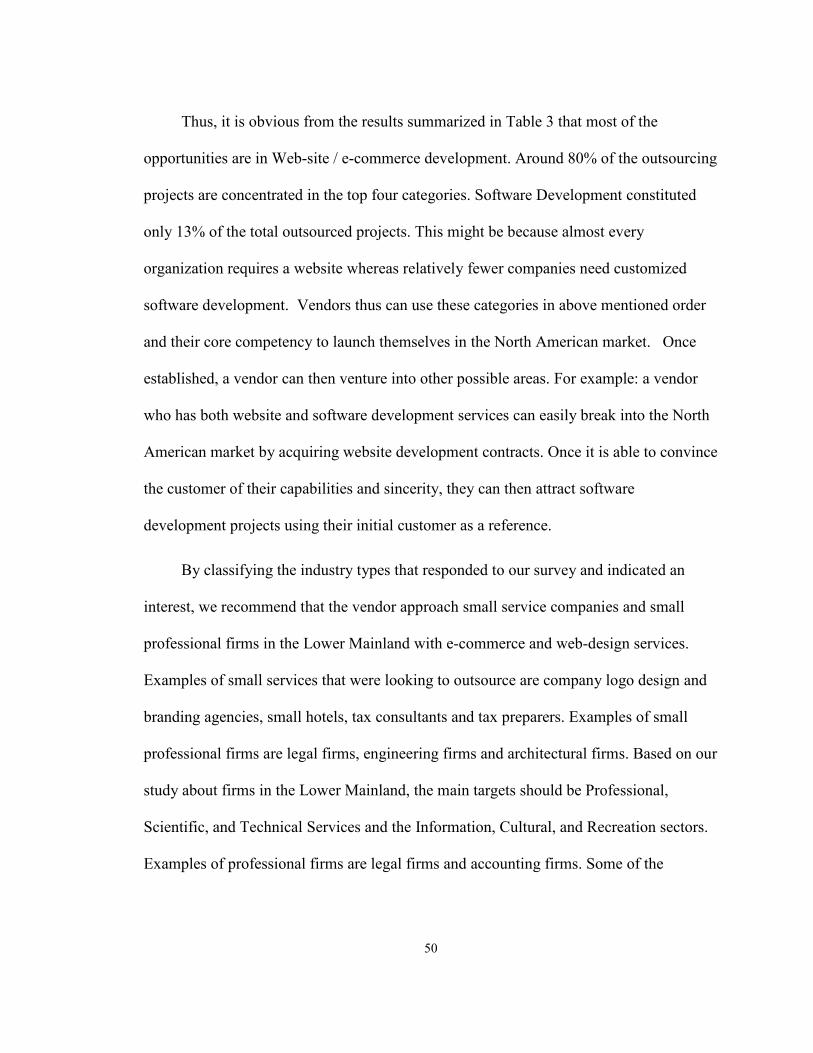
50
Thus, it is obvious from the results summarized in Table 3 that most of the
opportunities are in Web-site / e-commerce development. Around 80% of the outsourcing
projects are concentrated in the top four categories. Software Development constituted
only 13% of the total outsourced projects. This might be because almost every
organization requires a website whereas relatively fewer companies need customized
software development. Vendors thus can use these categories in above mentioned order
and their core competency to launch themselves in the North American market. Once
established, a vendor can then venture into other possible areas. For example: a vendor
who has both website and software development services can easily break into the North
American market by acquiring website development contracts. Once it is able to convince
the customer of their capabilities and sincerity, they can then attract software
development projects using their initial customer as a reference.
By classifying the industry types that responded to our survey and indicated an
interest, we recommend that the vendor approach small service companies and small
professional firms in the Lower Mainland with e-commerce and web-design services.
Examples of small services that were looking to outsource are company logo design and
branding agencies, small hotels, tax consultants and tax preparers. Examples of small
professional firms are legal firms, engineering firms and architectural firms. Based on our
study about firms in the Lower Mainland, the main targets should be Professional,
Scientific, and Technical Services and the Information, Cultural, and Recreation sectors.
Examples of professional firms are legal firms and accounting firms. Some of the

51
industries that responded to our survey who were looking to outsource were company
logo design and branding agencies, small hotels, tax consultants and tax preparers.
5.9 Future Research
Future research could be carried out in the following areas:
• Conducting a similar survey in India with small-scale vendors to assess their
requirements or hurdles in conducting business in Canada / United States.
• Similar research in other parts of Canada / United States to check if the
requirements of businesses are similar to that of Lower Mainland or not. If they
vary, what is the extent of the variation and in which areas?
• Extending survey to other potential developing countries like some of those
mentioned above (Eastern European, South Asian, and Far East).
• If it is possible to set up a bureau or standards agency like the Better Business
Bureau that would rate the Indian vendors and thereby make it convenient for
North American companies to conduct with small scale vendors with confidence.

52
APPENDICES
Appendix A – Survey Outline
The following table shows the outline of the survey that was sent to Lower
Mainland companies for their feedback. The question numbering scheme Q30, Q31 was
based on the order that the questions were entered into our survey vendor
www.questionpro.com. The question numbers were not visible to the respondent. In
many of the questions below, the logic would branch on one question. If it does not
branch, the then question proceeds to the next one the list in the sequence listed below.
Code Description Logic
INTRO Hello: We are Management of Technology MBA students at Simon Fraser University. We would like you to participate in this survey which solicits your opinion on outsourcing IT projects to India. Approximately 200 organizations have been asked to complete this survey which will take approximately 10-15 minutes. This survey closes on July 23rd. Your participation in this study is voluntary. Survey responses will be strictly confidential and data from this research will be reported only in the aggregate. Participants who complete the survey may request results by sending an e-mail to [email protected]. It is very important for us to learn your opinions by July 23rd. If you have questions about the survey or the procedure, please feel free to contact the undersigned. Thank you very much for your time and support. Please start with the survey by clicking on the Continue button below. Regards Simon Fraser University 2008 MBA candidates Baljeet Dhaliwal ([email protected], cell: 778 386 9041) George Mathew ([email protected])

53
Code Description Logic
Page Break
Q31 Name of the Company
Q32 Contact Person
Q34 Title / Position
Q33 Phone Number
Q34 email
Page Break
Q2 Does your organization do in-house software development? Page Break | Automatic Logic Break
No » [Q6] Have you ever outsourced your ...
Q3 How many software developers your organization / department have?
Q4 What is the average size of the team?
Q5 What percentage of your organization / department budget is dedicated for software development?
Page Break
Q6 Have you ever outsourced your IT projects? Page Break | Automatic Logic Break
Yes » [Q7] What type of IT jobs have you ...
No » [Q16] Would your organization be int ...
Q7 What type of IT jobs have you outsourced? (check all relevant ones)
Q9 What was the average budget for your outsourced IT project?
Q10 What was the average effort required for your outsourced IT project?
Q11 Was it outsourced to a Canadian IT company or an international IT company?
Page Break | Automatic Logic Break
Canadian » [Q17] Would your organization be int ...
International » [Q13] Have you ever outsourced your ...
Both » [Q13] Have you ever outsourced your ...
Q13 Have you ever outsourced your IT projects to India? Automatic Logic Break
Yes » [Q16] Reasons for outsourcing your ...
No » [Q17] Would your organization be int ...
Q16 Reasons for outsourcing your IT jobs to India? Page Break
Q14 What other countries have you outsourced your IT jobs?

54
Code Description Logic
Q13 Any specific reasons for choosing the above mentioned countries?
Page Break | Automatic Logic Break
Q16 Would your organization be interested in outsourcing IT jobs?
Page Break | Automatic Logic Break
Yes » [Q17] Would your organization be int ...
No » [Q30] Reasons for not outsourcing IT ...
Q17 Would your organization be interested in outsourcing IT jobs to India?
Page Break | Automatic Logic Break
Yes » [Q20] While deciding on your outsour ...
No » [Q35] Reasons for not outsourcing IT ...
Q20 While deciding on your outsourcing to small scale Indian IT vendor, what is the vendor size you would prefer?
Q21 The number of years the vendor has been in business?
Q33 Reasons for outsourcing?
Q23 Do you require references from vendor? Page Break
Q24 Do you require any specific quality practices followed by the vendor?
Page Break | Automatic Logic Break
No » [Q26] Would you be willing to pay an ...
Q25 What quality practices you expect vendor to follow? Page Break
Q26 Would you be willing to pay any advance to the vendor? Automatic Logic Break
No » [Q28] Would you be interested in any ...
Q27 What kind of advance would you be interested in paying to the vendor?
Page Break
Q28 Would you be interested in any financial bond / guarantees? Automatic Logic Break
Yes » [Q29] What kind of financial bonds / ...
No » Thank You Page
Q29 What kind of financial bonds / guarantees? Page Break | Automatic Logic Break
Q30 Reasons for not outsourcing IT jobs? Page Break | Automatic Logic Break
Q35 Reasons for not outsourcing IT jobs to India?

55
Appendix B – Survey Data
Q2 Does your organization do in-house software development?
Yes 23 52.27% No 21 47.73%
Total 44 Mean 1.48 Standard Dev. 0.51 Variance 0.26 Q3 How many software developers your organization / department have?
<5 11 52.38% <10 3 14.29% <25 3 14.29% <50 1 4.76% >50 3 14.29%
Total 21 Mean 2.14 Standard Dev. 1.49 Variance 2.23 Q4 What is the average size of the team?
1-5 14 66.67% 6-10 7 33.33% 11-20 0 0.00% 21-50 0 0.00% 50+ 0 0.00%
Total 21 Mean 1.33 Standard Dev. 0.48 Variance 0.23 Q5 What percentage of your organization / department budget is dedicated for software development?
<10% 11 52.38% <25% 5 23.81% <50% 3 14.29% >50% 2 9.52%
Total 21 Mean 1.81 Standard Dev. 1.03 Variance 1.06 Q6 Have you ever outsourced your IT projects?
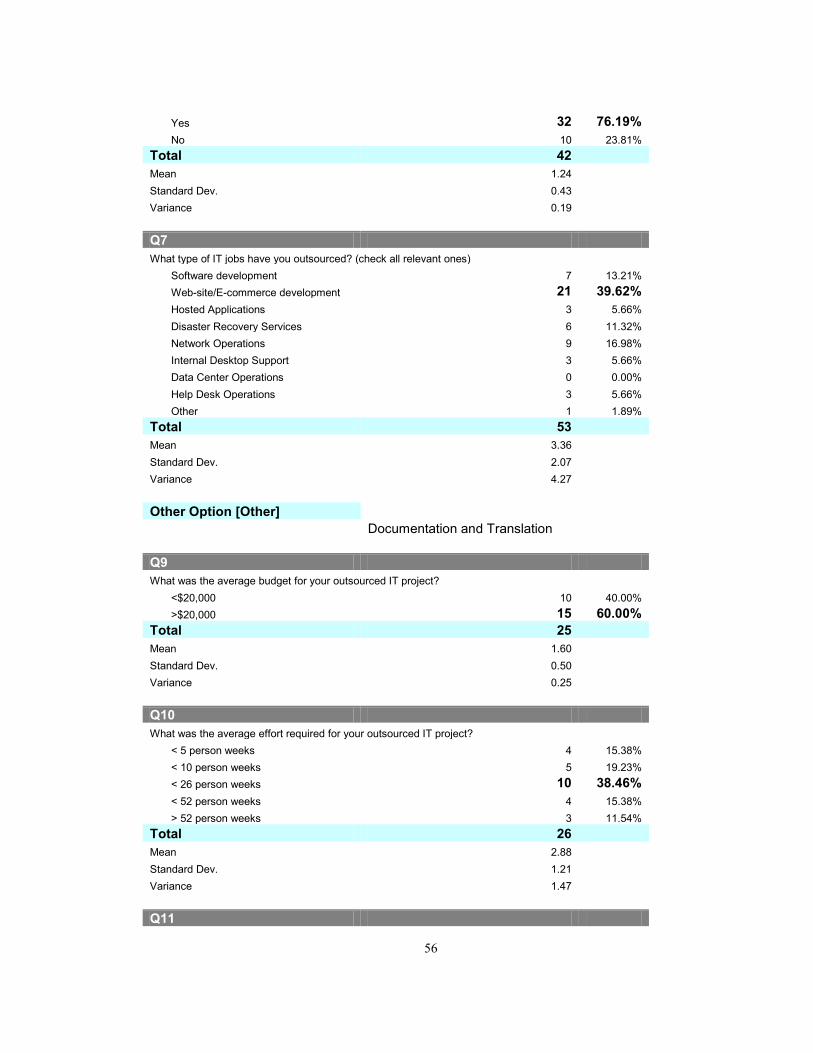
56
Yes 32 76.19% No 10 23.81%
Total 42 Mean 1.24 Standard Dev. 0.43 Variance 0.19 Q7 What type of IT jobs have you outsourced? (check all relevant ones)
Software development 7 13.21% Web-site/E-commerce development 21 39.62% Hosted Applications 3 5.66% Disaster Recovery Services 6 11.32% Network Operations 9 16.98% Internal Desktop Support 3 5.66% Data Center Operations 0 0.00% Help Desk Operations 3 5.66% Other 1 1.89%
Total 53 Mean 3.36 Standard Dev. 2.07 Variance 4.27 Other Option [Other] Documentation and Translation Q9 What was the average budget for your outsourced IT project?
<$20,000 10 40.00% >$20,000 15 60.00%
Total 25 Mean 1.60 Standard Dev. 0.50 Variance 0.25 Q10 What was the average effort required for your outsourced IT project?
< 5 person weeks 4 15.38% < 10 person weeks 5 19.23% < 26 person weeks 10 38.46% < 52 person weeks 4 15.38% > 52 person weeks 3 11.54%
Total 26 Mean 2.88 Standard Dev. 1.21 Variance 1.47 Q11

57
Was it outsourced to a Canadian IT company or an international IT company? Canadian 12 44.44% International 11 40.74% Both 4 14.81%
Total 27 Mean 1.70 Standard Dev. 0.72 Variance 0.52 Q13 Have you ever outsourced your IT projects to India?
Yes 8 53.33% No 7 46.67%
Total 15 Mean 1.47 Standard Dev. 0.52 Variance 0.27
Q16 Would your organization be interested in outsourcing IT jobs?
Yes 3 33.33% No 6 66.67%
Total 9 Mean 1.67 Standard Dev. 0.50 Variance 0.25 Q17 Would your organization be interested in outsourcing IT jobs to India?
Yes 9 40.91% No 13 59.09%
Total 22 Mean 1.59 Standard Dev. 0.50 Variance 0.25 Q20 While deciding on your outsourcing to small scale Indian IT vendor, what is the vendor size you would prefer?
Does not matter 5 55.56% Small Size (vendors with less than 50 employees) 3 33.33% Large Size (vendors with greater than 50 employees) 1 11.11%
Total 9 Mean 1.56 Standard Dev. 0.73 Variance 0.53

58
Q21 The number of years the vendor has been in business?
New 0 0.00% <3 years 0 0.00% <7 years 1 11.11% <10 years 0 0.00% > 10+ years 0 0.00% Does not matter 8 88.89%
Total 9 Mean 5.67 Standard Dev. 1.00 Variance 1.00 Q33 Reasons for outsourcing?
Economical 8 80.00% Not core competency 2 20.00% Using vendor expertise(vendor is better aware of technology
suiting the needs) 0 0.00% Cost sharing with other vendor clients (e.g. hosting of services) 0 0.00% Other 0 0.00%
Total 10 Mean 1.20 Standard Dev. 0.42 Variance 0.18 Other Option [Other] Q23 Do you require references from vendor?
Yes 7 77.78% No 2 22.22%
Total 9 Mean 1.22 Standard Dev. 0.44 Variance 0.19 Q24 Do you require any specific quality practices followed by the vendor?
Yes 0 0.00% No 9 100.00%
Total 9 Mean 2.00 Standard Dev. 0.00 Variance 0.00
Q26 Would you be willing to pay any advance to the vendor?
Yes 7 77.78% No 2 22.22%

59
Total 9 Mean 1.22 Standard Dev. 0.44 Variance 0.19 Q27 What kind of advance would you be interested in paying to the vendor?
<10% 3 42.86% <20% 4 57.14% <50% 0 0.00% 50%+ 0 0.00%
Total 7 Mean 1.57 Standard Dev. 0.53 Variance 0.29 Q28 Would you be interested in any financial bond / guarantees?
Yes 2 22.22% No 7 77.78%
Total 9 Mean 1.78 Standard Dev. 0.44 Variance 0.19

60
Appendix C – Raw Text Responses: Reasons for outsourcing your IT jobs to India? Proof of Concept. They were the lowest performing offshore country by far. Low cost. quality of developers We contracted with a vendor that employed Indian resources. The Indian team offered additional capacity at a low cost to help us meet our development deadlines and target budget. They quoted the lowest price and were able to provide the most resources (people) to complete the project. Low price and good quality work. Low cost Knew someone there who could do web-site programming
What other countries have you outsourced your IT jobs? Russia, Ukraine, Latvia, Canada Russia Canada; United States. None - we only outsourced our web-site development. Russia, Romania, USA We have outsourced to India only
Any specific reasons for choosing the above mentioned countries? Quality, near shore - offshore options, embedded staff Strategic to establish good relationship to sell company's own products to Russia Local to our physical location. We have a contact in that country.
Reasons for not outsourcing IT jobs to India? Not enough back end work. Most of our work is design interface work and we would not outsource that. In the other work, it has been developing systems for our company internally, and it has meant many many face-to-face meetings through the development process as the outsourced firm observed our systems and procedures and made recommendations for software to run them. The only IT work we have we feel requires a consultant that is available. Our IT requirements are very basic and therefore do not require more than an independent consultant 1. Developers cannot be easily brought into a face to face meeting with management in the event of an unexpected change in scope, or schedule. 2. Developers cannot interact directly with the stakeholders to optimally understand their usability needs. We prefer to have a local contact that will be able to work with us. We are a Business to consumer company - so the only thing we wanted was a web-site for our company. one time project only Proximity to our service provider in Vancouver local web-site development

61
6: BIBLIOGRAPHY
Al-Qirim, N. A., & Bathula, H. (2002). IT and eCommerce Outsourcing in Small to Medium-Size Enterprises in New Zealand: An Exploratory Research. 15th Bled Electronic Commerce Conference eReality: Constructing the eEconomy, (pp. 537-551). Bled, Slovenia.
Amiti, M., & Wei, S.-J. (2005). Fear of service outsourcing: is it justified? Economic Policy , 20 (42), 308-347.
Barnes, F. C. (1998). ISO 9000 Myth and Reality: A Reasonable Approach to ISO 9000. SAM ADVANCED MANAGEMENT JOURNAL , 63 (2 pp 23-30).
Barthelemy, J. (2001). The Hidden Costs of IT Outsourcing. MIT Sloan Management Review , 60-69.
Bloch, M., & Spang, S. (2003). Reaping the benefits of business-process outsourcing. Geneva: McKinsey on IT.
Chandrasekhar, C., & Ghosh, J. (2006). IT-driven offshoring: The exaggerated "Development Opportunity". Human Systems Management , 91-101.
Compare Infobase Ltd., New Delhi. (2008, April 10). Software Industry. Retrieved 08 17, 2008, from Economy Watch: http://www.economywatch.com/business-and-economy/software-industry.html
Computer Economics. (2006). IT Spending & Staffing 2006/2007: Chapter 5, IT Outsourcing Trends" . Computer Economics.
Couper, M. P. (2000). Web-surveys: A Review of Issues and Approaches. 64 (4 (pp 464-494)).
Desai, B., Weerakkody, V., Currie, W., Tebboune, D., & Khan, N. (2003). Market entry strategies of application service providers: identifying strategic differentiation. Proceedings of the 36th Annual Hawaii International Conference on System Sciences (p. 10). Hawaii: IEEE Computer Society.

62
Dillman, D. A., Tortora, R. D., & Bowker, D. (1998). Principles for Constructing Web Surveys - SESRC Technical Report. Pullman.
DiRomualdo, A., & Gurbaxani, V. (1998). Strategic Intent for IT Outsourcing. Sloan Management Review , 67-80.
Dossani, R., & Kenney, M. (2003). Went for Cost, Stayed for Quality? Moving the Back Office to India. Berkeley: Asia-Pacific Research Center.
Fricker, R. D., & Schonlau, M. (2002). Advantages and Disadvantages of Internet Research Surveys: Evidence From the Literature. 14 (4 (pp 347-367)).
Grover, V., Cheon, M. J., & Teng, J. T. (1994). A descriptive study on the outsourcing of information system functions. Information and Management , 33-44.
Grover, V., Cheon, M. J., & Teng, J. T. (1996). The effect of service quality and partnership on the outsourcing of information systems functions. Journal of Management Information Systems , 89-116.
Hayes, D. C., Hunton, J. E., & Reck, J. L. (2001). Market Reactions to ERP Implementation Announcements. Journal of Information Systems , 15 (1), 3-18.
Hirschheim, R., Heinzl, A., & Dibbern, J. (2006, January 10). Information Systems Outsourcing: Enduring Themes, New Perspectives and Global Changes. Retrieved 08 09, 2008, from www.myilibrary.com: http://www.myilibrary.com.proxy.lib.sfu.ca/Browse/open.asp?ID=94064&loc=386
Ilieva, J., Baron, S., & Healey, N. M. (2002). Online Surveys in Marketing Research: Pros and Cons. 44 (3 (pp 361-376)).
Kirkegaard, J. F. (2004). Outsourcing—Stains on the White Collar? Washington DC: The Peterson Institute for International Economics.
KPMG. (2005). Fortune 500 companies in India: Success Stories. India: IBEF - India Brand Equity Foundation.
Krishna, S., Sahay, S., & Walsham, G. (2004). Managing cross-cultural issues in global software outsourcing. Communications of the ACM , 62-66.
63
Lawrence, L., & Venkatraman, N. (1992). Determinants of Information Technology Outsourcing: A Cross-Sectional Analysis. Journal of Management Information Systems , 7-24.
Matson, J. E., Barrett, B. E., & Mellichamp, J. M. (1994). Software Development Cost Estimation Using Function Points (Vol. 20 no. 4). IEEE TRANSACTIONS ON SOFTWARE ENGINEERING,.
Morris, S., & Basant, R. (2006). Small and Medium Enterprises in India Today - Overcoming Policy Constraints in Achieving rapifd Growth in a Globalizing Economy. Ahmedabad: Indian Institute of Management.
NASSCOM. (2007, July 02). Indian IT Software and Services Revenues to reach US $50bn mark in FY 07-08. Retrieved June 01, 2008, from http://www.nasscom.in/: http://www.nasscom.in/Nasscom/templates/NormalPage.aspx?id=51734
Overby, S. (2003, 09 01). The Hidden Costs of Offshore Outsourcing. Retrieved 08 09, 2008, from CIO.com: http://www.cio.com/article/29654/The_Hidden_Costs_of_Offshore_Outsourcing
Overby, S. (2003, September 1). The Hidden Costs of Offshore Outsourcing. Retrieved August 08, 2008, from http://www.cio.com/article/29654/The_Hidden_Costs_of_Offshore_Outsourcing
Oza, N. V., Hall, T., Rainer, A., & Grey, S. (2005, 09 27). Trust in software outsourcing relationships: An empirical investigation of Indian software companies. Information and Software Technology , pp. 345-354.
Palley, T. I. (2007). The Economics of Outsourcing: How Should Policy Respond? Economics Public Policy Brief Archive ppb_89, Levy Economics Institute .
Quinn, J. B. (1999). Strategic Outsourcing: Leveraging Knowledge Capabilities. Sloan Management Review , 9-20.
Quinn, J. B., & Frederick, H. G. (1995). Strategic Outsourcing. The McKinsey Quarterly , 48-69.
Ruokolainen, J., & Igel, B. (2004). The factors of making the first successful customer reference to leverage the business of start-up software company — multiple case study in Thai software industry. Technovation , 24 (9 pp 673 - 681).
64
Schmidt, W. C. (1997). World Wide Web Survey Research: Benefits, Potential Problems and Solutions. 29 (2 (pp 274 - 279)).
Schonlau, M., Fricker, R. D., & Elliott, M. N. (2002). Conducting Research Surveys via E-mail and the Web. RAND.
Sharma, M. K., & Bhagwat, R. (2006). Performance measurements in the implementation of information systems in small and medium-sized enterprises: a framework and empirical analysis. Measuring Business Excellence , 10 (4), 8-21.
Solomon, D. J. (2001, August 23). Conducting Web-based Surveys, Practical Assessment, Research & Evaluation. Retrieved june 01, 2008, from Practical Assessment, Research and Evaluation: http://pareonline.net/getvn.asp?v=7&n=19
University of California, Berkeley. (2003, October 29). Haas News Room. Retrieved June 02, 2008, from Haas School of Business, University of California, Berkeley: http://www.haas.berkeley.edu/news/20031029_outsourcing.html
XMG. (2007, October 27). Press Releases. Retrieved June 03, 2008, from XMG - Global ICT Research and Advisory: http://www.xmg-global.com/press_releases/pr071027.html
Zhang, Y. (2000). Using the Internet for Survey Research: A Case Study. 51 (1 (pp 57-58)).
Zhu, Z., Hsu, K., & Lillie, J. (2001). Outsourcing – a strategic move: the process and the ingredients for success. Management Decision , 39 (5), 373-378.
.