strategy and financials - gerry weberir.gerryweber.com/download/companies/gerryweber/...4 gerry...
TRANSCRIPT

1
Strategy and FinancialsJune 2014

2
„What We Stand For:“
growing business
high brand awareness
middle price segment
modern and trend oriented
fashion
perfect fit
high quality standards

3
Agenda
(1) Unique Business Model Page 4(2) Key Financials Page 13(3) GERRY WEBER Share Page 21(4) Outlook Page 24(5) Appendix Page 28

4
GERRY WEBER: an Overview
1973 Company established by Gerhard Weber and Udo Hardieck
1986 Brand name GERRY WEBER introduced
1989 Foundation of TAIFUN
1989 Going Public as GERRY WEBER International AG
1994 Foundation of SAMOON
1999 Opening of the first HOUSE OF GERRY WEBER
2001 Sublabel GERRY WEBER EDITION established
2011 New Design Centre in Halle, Listing in M-Dax
2011 Acquisition of 20 former DON GIL stores in Austria
2012 Acquisition of 200 former WISSMACH stores and conversion into GERRY WEBER brand stores
2012 Acquisition of majority stake in 25 existing Dutch HoGWs2013 Acquisition of majority stake in 19 existing Belgian HoGWs2014 Acquisition of 8 HoGWs and 17 multilabel stores that were
formerly owned by our franchise partner in Norway
HISTORY
Business
Global German fashion and lifestyle company with three strong brands families and their sublabels:
GERRY WEBER (including GERRY WEBER COLLECTION, GERRY WEBER EDITION, G.W. and GERRY WEBER ACCESSORIES)
TAIFUN SAMOON
Retail
711 company-owned Houses of GERRY WEBER and Monolabel Stores, including 111 concessions stores. In addition: six online shops for nine countries in Europe (April 2014).
WholesaleMore than 280 franchised Houses of GERRY WEBER and round about 2,800 Shop-in-Shops. (April 2014)
Financials
2012/13 Revenues: EUR 852.0 mnEBITDA: EUR 127.4 mnEBIT: EUR 105.8 mnNet income: EUR 71.0 mn
COMPANY PROFILE
Board
Gerhard Weber Dr. David FrinkRalf WeberArnd Buchardt
ShareStable share price development in the last two years.Dividend payment 2013: EUR 0.75 per share
5
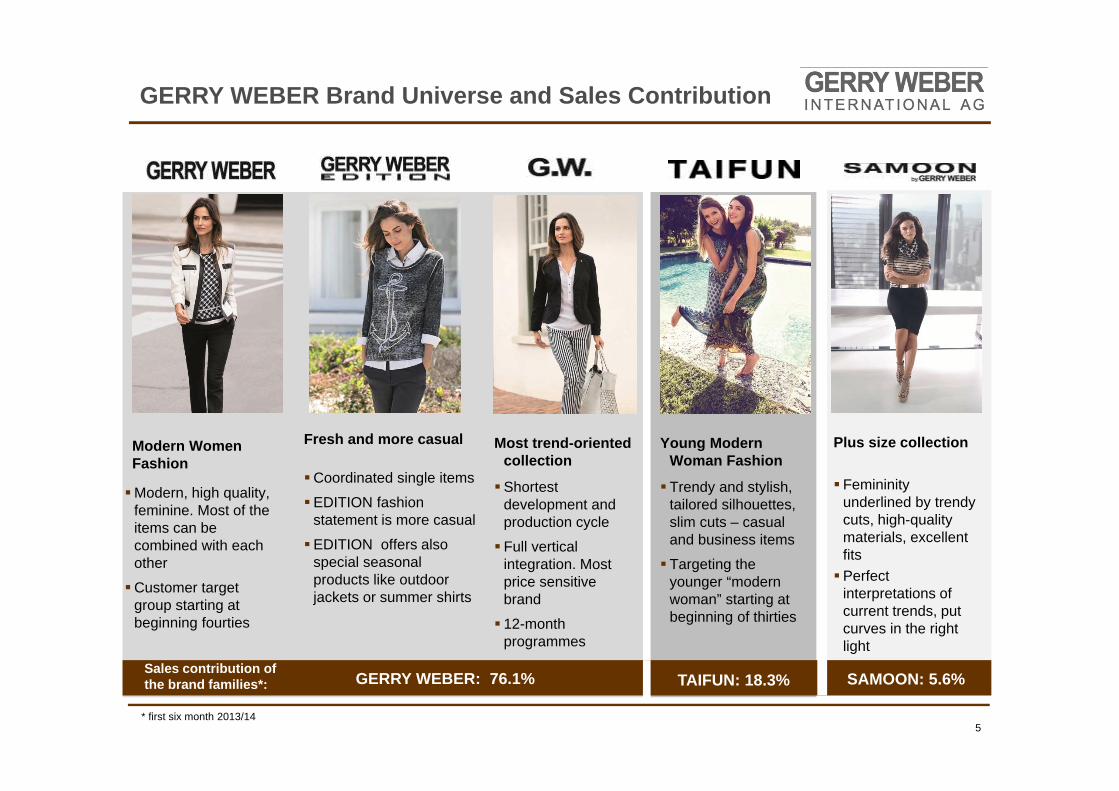
GERRY WEBER Brand Universe and Sales Contribution
Modern, high quality, feminine. Most of the items can be combined with each other
Customer target group starting at beginning fourties
Fresh and more casual
Coordinated single items
EDITION fashion statement is more casual
EDITION offers also special seasonal products like outdoor jackets or summer shirts
Most trend-oriented collection
Shortest development and production cycle
Full vertical integration. Most price sensitive brand
12-month programmes
Young Modern Woman Fashion
Trendy and stylish, tailored silhouettes, slim cuts – casual and business items
Targeting the younger “modern woman” starting at beginning of thirties
Plus size collection
Femininity underlined by trendy cuts, high-quality materials, excellent fitsPerfect
interpretations of current trends, put curves in the right light
Modern Women Fashion
TAIFUN: 18.3% SAMOON: 5.6%GERRY WEBER: 76.1%Sales contribution of the brand families*:
* first six month 2013/14

6
CURRENT FASHION POSITIONING
Fashion Statement
COLLECTIONS
Six collections per year and brand (except G.W.); three spring/summer and three autumn/winter collections
18 themes p.a. - all collections comprise three themes, each consisting of about 30 – 35 single items
New items are delivered to the shops and stores almost every two to three weeks
In the last five years we rejuvenated our GERRY WEBER fashion statement step by step.
From “Modern Classic” to the more trend-oriented “Modern Women” segment
Fashion statement / Fashion appeal
GERRY WEBER
TAIFU
N
Modern ClassicModern WomanYoung Fashion
7
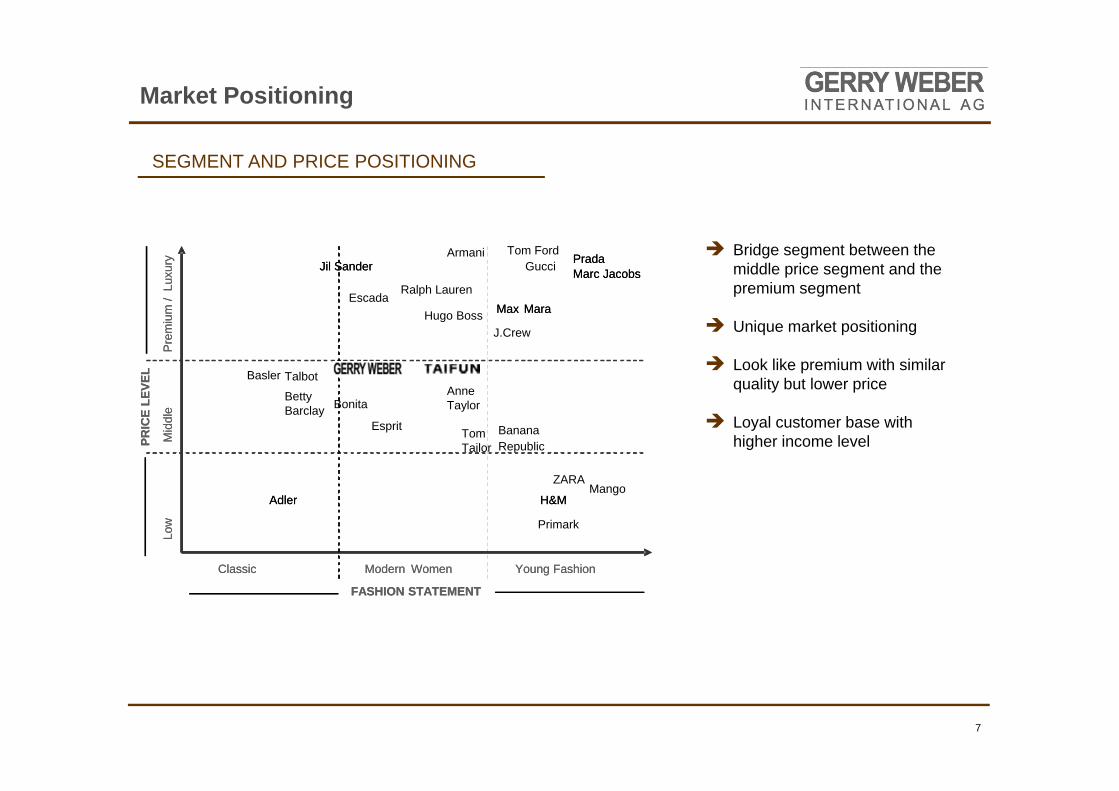
Market Positioning
Bridge segment between the middle price segment and the premium segment
Unique market positioning
Look like premium with similar quality but lower price
Loyal customer base with higher income level
SEGMENT AND PRICE POSITIONING
Classic Modern Women Young Fashion
FASHION STATEMENT
PRIC
E LE
VEL
Low
Mid
dle
Pre
miu
m /
Luxu
ry
Max Mara
Gucci PradaMarc Jacobs
H&MAdler
ZARAMango
Basler
Jil Sander
Classic Modern Women Young Fashion
FASHION STATEMENT
PRIC
E LE
VEL
Low
Mid
dle
Pre
miu
m /
Luxu
ry
Hugo Boss Max Mara
PradaMarc Jacobs
Ralph Lauren
H&MAdler
Tom Tailor
BananaRepublic
Esprit
Bonita
Jil SanderTom Ford
Escada
Armani
TalbotAnne Taylor
Betty Barclay
J.Crew
Primark

8
GERRY WEBER Distribution
RETAIL
Own Retail Stores
Houses of GERRY WEBER
Monolabel Stores
Concessions
Shop-in-Shop systems
managed by GERRY WEBER
Factory Outlets
National andinternational
special sales areas
E-commerce/ Online shops
Online Shopnationally or internationally
integrated
WHOLESALE
Franchise
FranchisedHouses of
GERRY WEBER
Trusted Wholesale CustomersWholesale customers transfer the order process
to GERRY WEBER
Shop-in-Shop
Branded Shop-in-Shops,
which are managed by our
wholesale partners
Multi Label
Stores where several labels are presented simultaneously; noseparate branding
DISTRIBUTION CHANNELS
45.7%* of Group sales 54.3%* of Group sales
* first half fiscal year 2013/14

9
GERRY WEBER Retail Expansion
RETAIL BUSINESS
68 new company-managed stores opened in 2012/13 and 13 were closed, thereof 5 Monolabel Stores in Germany and 5 HoGWs in Spain
47 concessions opened 2012/13, most of them in the Netherlands
2013/14: Continued expansion abroad: A focus will be on established markets (e.g. Netherlands and Belgium) and on new markets as in Eastern Europe and Scandinavia
June 2013/14: Expansion plan was confirmed by acquisition of Norwegian franchise partner early in June, including 8 HoGWs and 17 multi label stores
COMPANY-MANAGED STORES BY REGION
* Monolabel Stores TAIFUN, SAMOON and EDITION
H12013/14
2012/13 2011/12 2010/11
Houses of GERRY WEBER
434 424 347 210
Monolabel Stores* 141 144 146 25
Concessions 111 111 64 45
Factory Outlets 25 22 17 13
TOTAL 711 701 574 293
424 - Germany
43 - Austria
32 - Netherlands
22 - Belgium
12 - Spain
17 - UK + Ireland
17 - Poland
5 - Denmark
2 - Sweden
1 - Czech Republic

10
GERRY WEBER E-Commerce
Germany
Austria
Switzerland
The Netherlands
Poland
COMPANY-OWNED ONLINE SHOPS (currently)
Online business generated sales of EUR 19.5 million; an increase of 16.3% in 2012/13
2012/13: - a new company-managed online shop was opened in Poland - cooperation with German online platform www.zalando.de started in September 2013
June 2013/14: - opening of EU-online shop for Sweden, Belgium, France and the UK in June 2014
UK
France
Sweden
Belgium

11
WHOLESALE BUSINESS
23 Houses of GERRY WEBER managed by our franchise partners were opened in 2012/13 and 13 were closed
Most of the new franchise stores were opened in the Middle East (7), France (5) and Russia (4)
Acquisition of majority stake in 19 former franchise Houses of GERRY WEBER in Belgium; they are part of the Retail segment since August 2013
June 2013/14: Acquisition of 8 well established Houses of GERRY WEBER and 17 multi label stores in Norway; they used to be managed by our former franchise partner and will be part of the Retail segment as of June 2014
GERRY WEBER Wholesale
FRANCHISE HoGWs BY REGION
H1 2013/14 2012/13 2011/12 2010/11
Houses ofGERRY WEBER
281 271 277 260
Shop-in-Shops 2,828 2,816 2,767 2,292
70 - Germany
56 - Russia
29 - Middle East
22 - Eastern Europe
10 - Poland
12 - BeNeLux
18 - France
10 - Scandinavia
12 - Baltic countries
13 - Switzerland
5 - Austria
5 - Italy
19 - Others
12
Agenda
(1) Unique Business Model Page 4(2) Key Financials Page 13(3) GERRY WEBER Share Page 21(4) Outlook Page 24(5) Appendix Page 28
13
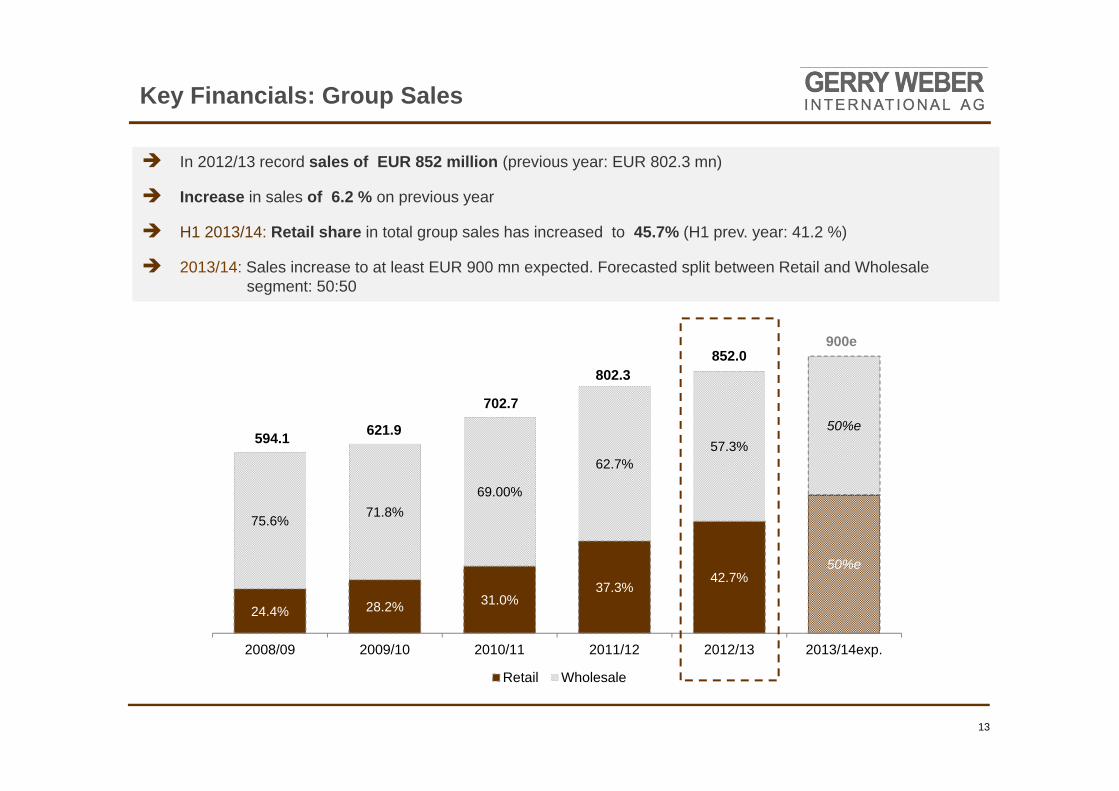
Key Financials: Group Sales
24.4% 28.2% 31.0%37.3%
42.7%50%e
75.6% 71.8%69.00%
62.7%57.3%
50%e
2008/09 2009/10 2010/11 2011/12 2012/13 2013/14exp.
Retail Wholesale
594.1 621.9
702.7
802.3852.0
900e
In 2012/13 record sales of EUR 852 million (previous year: EUR 802.3 mn)
Increase in sales of 6.2 % on previous year
H1 2013/14: Retail share in total group sales has increased to 45.7% (H1 prev. year: 41.2 %)
2013/14: Sales increase to at least EUR 900 mn expected. Forecasted split between Retail and Wholesale segment: 50:50

14
Key Financials: Group EBIT and EBITDA
EBIT and EBITDA have shown a strong and steady development over the past five years
Expansion costs and higher depreciation due to the dynamic Retail roll-out in the last two years lead to temporarily lower margins in 2012/13
2013/14: Increase in margins expected – EBIT guidance EUR 120 mn
71.2
83.3
99.6
115.9105.8
83.6
95.2
111.6
132.3 127.4
2008/09 2009/10 2010/11 2011/12 2012/13
EBIT EBITDA
12.0%13.4% 14.2% 14.5%
12.4%
14.1%15.3% 15.9% 16.5%
15.0%
2008/09 2009/10 2010/11 2011/12 2012/13
EBIT margin EBITDA margin
EBITDA AND EBIT in Euro million EBITDA AND EBIT MARGIN in %
80.993.1
104.097.7
90.9
Q2 2012/13 Q3 2012/13 Q4 2012/13 Q1 2013/14 Q2 2013/14
Key Financials: Retail Sales
15
188.7
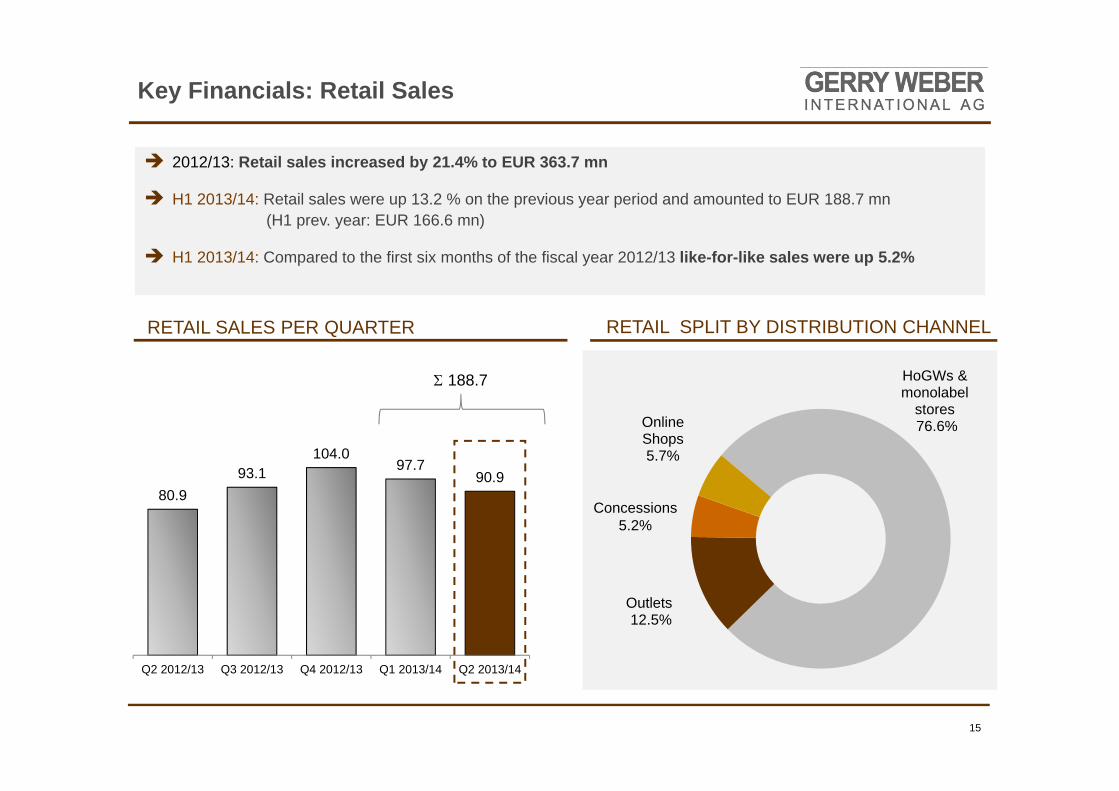
2012/13: Retail sales increased by 21.4% to EUR 363.7 mn
H1 2013/14: Retail sales were up 13.2 % on the previous year period and amounted to EUR 188.7 mn(H1 prev. year: EUR 166.6 mn)
H1 2013/14: Compared to the first six months of the fiscal year 2012/13 like-for-like sales were up 5.2%
RETAIL SALES PER QUARTER RETAIL SPLIT BY DISTRIBUTION CHANNEL
HoGWs & monolabel
stores 76.6%
Outlets12.5%
Online Shops 5.7%
Concessions 5.2%

138.1
95.8
155.1
92.7
131.5
Q2 2012/13 Q3 2012/13 Q4 2012/13 Q1 2013/14 Q2 2013/14
Key Financials: Wholesale Sales
16
224.1
WHOLESALE SALES PER QUARTER
H1 2013/14: Wholesale sales amounted to EUR 224.1 million (H1 prev. year: EUR 237.3 m)
This is a decrease of 5.6% on H1 2012/13
Decrease is partly due to the Belgian HoGWs that are now part of the Retail segment
We assume that pre-orders from our wholesale partners pick up again for the 2nd half of our fiscal year
Santiago de Chile

Key Financials: Profitability per Quarter
17
H1 2013/14: EBITDA increased to EUR 61.8 mn and a EBITDA margin of 15.0% (H1 2012/13: 13.2%)
H1 2013/14: EBIT amounted to EUR 49.5 mn – an increase of 14.2% compared to H1 2012/13
H1 2013/14: EBIT margin was 12.0% (H1 2012/13: 10.7%)
30.3 22.6 51.3 24.3 37.525.6 17.4 45.0 18.3 31.3
13.8%
12.0%
19.8%
12.8%
16.9%
11.7%
9.2%
17.4%
9.6%
14.2%
0,0%
5,0%
10,0%
15,0%
20,0%
25,0%
10,0
15,0
20,0
25,0
30,0
35,0
40,0
45,0
50,0
55,0
Q2 2012/13 Q3 2012/13 Q4 2012/13 Q1 2013/14 Q2 2013/14
EBITDA
EBIT
EBITDA Margin
EBIT Margin
EBITDA and EBIT in EUR millionEBITDA and EBIT margin in %

18
BALANCE SHEET STRUCTURE
Strong balance sheet structure with an equity ration of 67.7% (as of 30 April 2014)
Short and long-term financial liabilities amounted to EUR 84.5 million with a cash volume of EUR 141.8 mn
Financial liabilities increased in H1 2013/14 due to the issuance of an EUR 75 mn note loan, which will be used to finance the new logistic center
Currentliabilities
Equity
Non-Currentliabilities
Cash
Currentassets
Non-currentassets
in EUR millionASSETS EQUITY &
LIABITITIES
141.8
211.1
277.8
120.8
82.6
427.2
Key Financials: Balance Sheet (as of 30 April 2014)

19
INVESTMENTS / CAPEX (in EUR million)
Key Financials: Cash In- and Outflows (current and expected)
2011/12 2012/13 2013/14e
56 33
21
7
5
35 -
40
6-8
16-18
5-6 Retail expansion & maintenance
Acquisitions (e. g. WISSMACH)
Investments in properties
New logistic center
Others/ IT investments (e.g. Hard/Software)Maintenance of existing stores
Retail expansion
84
38
62-72
Capex for the operational business per year including Retail expansion and maintenance -between EUR 26 to 32 million
Investment volume new logistic center EUR 80 to 90 million - round about 50% per year 2014 and 2015
Cash inflow from current operating activities amounted to EUR 90.7 mn in 2012/13
logistic center
operative investments

20
Agenda
(1) Unique Business Model Page 4(2) Key Financials Page 13(3) GERRY WEBER Share Page 21(4) Outlook Page 24(5) Appendix Page 28

21
GERRY WEBER Share
SHARE PERFORMANCE (since June 2013)
Strong share performance in the last month
Payout ratio between 40% and 50% every year
Dividend yield of round about 2.3%
SHAREHOLDER STRUCTURE DIVIDEND PAYMENTS
Gerhard Weber29.05%
Udo Hardieck17.42%
Freefloat53.53%
0.43
0.55
0.650.75 0.75
2008/09 2009/10 2010/11 2011/12 2012/13

22
GERRY WEBER Share
Bank/Broker Analyst Rating Price Date
target
Baader Bank Volker Bosse buy 42.00 6 June2014
Bank of America Merrill Lynch Tushar Jain buy 38.00 14 March
2014
Berenberg Bank Anna Patrice hold 38.50 27 Feb. 2013
BHF Bank over-weight 38.00 18. June
2013
BNP Paribas Andreas Inderst outper-fom 40.00 13 June
2014
Close Brothers Sydler Martin Decot hold 39.00 13 June 2014
Commerzbank Yasmin MoschitzAndreas Riemann hold 32.00 13 June
2014
Cheuvreux Jürgen Kolb under-perform 30.50 18. Jan.
2013
Deutsche Bank Michael Kuhn buy 40.00 10 June 2014
DZ Bank Herbert Sturm sell 30.00 28 Feb. 2014
Bank/Broker Analyst Rating Price Date
target
Equinet Bank Ingbert Faust accumu-late 40.00 6 June
2014
Hauck & Aufhäuser Christian Schwenkenbecher buy 44.00 13 June
2014
HSBC Global Research Thomas Teetz neutral 36.00 3 March2014
Lampe Research Christoph Schlienkamp buy 40.00 11 June
2014
LBBW Fabian Süßengut hold 41.00 13 June 2014
Main First Bank AG Gael Colcombet out-perform 42.00 13 June
2014
Metzler Equity Research Peter Steiner buy 40.00 14 Jan
2014
Montega Research Tim Kruse hold 37.00 13 June2014
MM Warburg Philipp Frey buy 43.00 13 June 2014
Quirin Bank Mark Josefson sell 32.50 3 March2014
ANALYSTS’ RECOMMENDATIONS

23
Agenda
(1) Unique Business Model Page 4(2) Key Financials Page 13(3) GERRY WEBER Share Page 21(4) Outlook Page 24(5) Appendix Page 28

24
Forecast 2013/14
Building on our unique brand positioning, our operational strengths, our customer structure and the growth opportunities yet to be tapped in the international markets, the successful “GERRY WEBER” growth story continues.
Our business model and strategy is aligned for long-term oriented and sustainable growth. Therefore we continue to anticipate dynamic and profitable growth for our company moving forward.
EBIT 115.9 105.8
SALES 802.3852.0
2011/12 2012/13
at least120e
at least900e
+5.6%
13.4%
Forecast2013/14
25
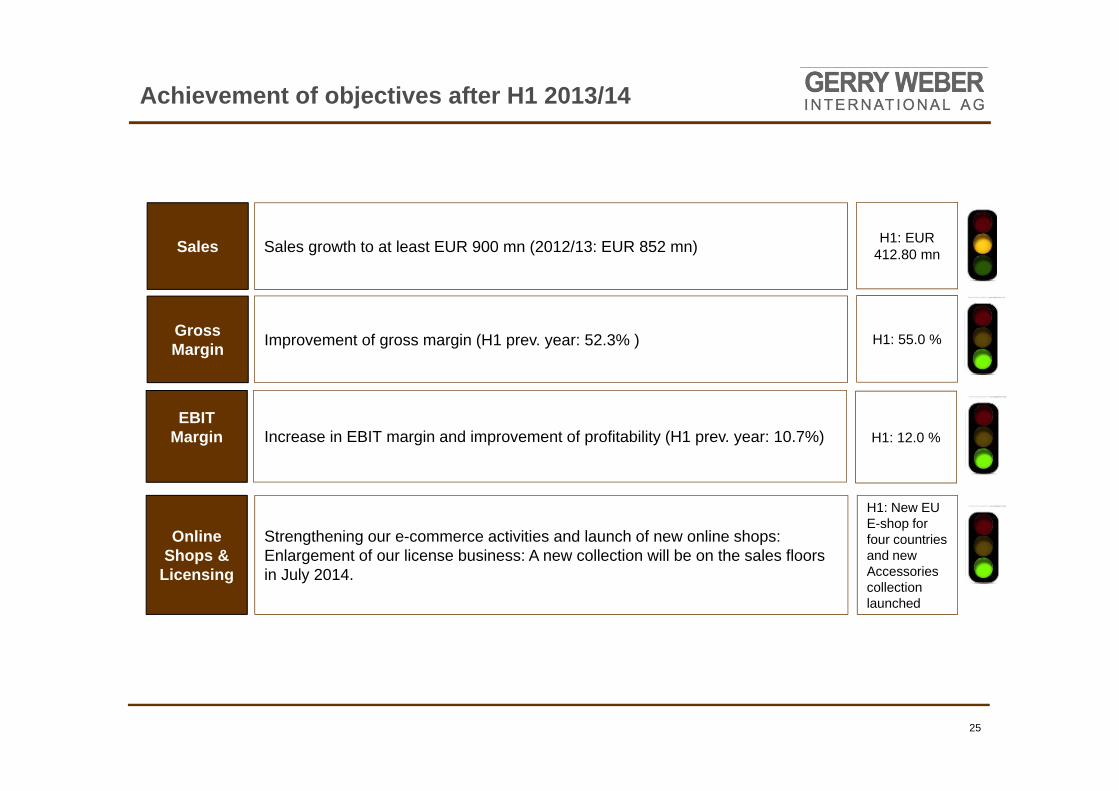
Achievement of objectives after H1 2013/14
Sales Sales growth to at least EUR 900 mn (2012/13: EUR 852 mn)
Gross Margin
EBIT Margin
Online Shops &
Licensing
Strengthening our e-commerce activities and launch of new online shops: Enlargement of our license business: A new collection will be on the sales floors in July 2014.
H1: EUR 412.80 mn
H1: 55.0 %
H1: New EU E-shop forfour countries and newAccessoriescollectionlaunched
Increase in EBIT margin and improvement of profitability (H1 prev. year: 10.7%)
Improvement of gross margin (H1 prev. year: 52.3% )
H1: 12.0 %

26
Mid-term Perspective – Verticalisation!
Expansion of the Retail segment
- with Houses of GERRY WEBER out of Germany, e.g. Poland, Netherlands, Eastern European Countries, Scandinavia
- with Monolabel Stores in our core markets Germany, Austria and Netherlands
Strengthen our e-commerce business and launch of three to four new country online shops
STRATEGIC FOCUS
OPERATIONAL TOPICS
Further optimisation of sourcing, transport and logistic
RETAIL WHOLESALE
Internationalisation of distribution structures and expansion of the global market presence
- development of existing customer relations - cautious and considered expansion strategy in
North America- step into new markets
Deepening the international market penetration of TAIFUN and SAMOON
Enlarge number of trusted wholesale partners in Germany and abroad

27
Thank you for your Attention
To be always updated, please have a look on our website
www.gerryweber.com
GERRY WEBER International AGClaudia KellertHead of Investor RelationsNeulehenstraße 8, D-33790 Halle / Westphaliaphone: +49 (0)5201 185 8422eMail: [email protected]
FINANCIAL CALENDAR
Publication of the First Half Year Report 2013/14 13 June 2014
Roadshow London (Berrenberg) 25 June 2014
Publication of the Nine Month Report 2013/14 12 September 2014
Merrill Lynch Conference, London 18 September 2014
Berenberg Conference, Munich 23 September 2014
Baader Conference, Munich 24 September 2014
End of the fiscal year 2013/14 31 October 2014

28
Appendix
...
412.8
...
SalesOther
operatingincome
Change in inventories
Cost ofmaterials
Personnelexpenses
Depreciation/Amortization
Other operatingexpenses
Financial result
Taxes onincome
Net income of the period
in EUR million
7.1 4.6
-190.3
-73.0
-12.3-98.9 -2.7-14.1
Gross margin of 55.0% increased 270 bps(H1 prev. year: 52.3%)
32.7
EBITDA
61.8 EBIT49.5
DEVELOPMENT OF EARNINGS H1 2013/14

29
Appendix
CONSOLIDATED INCOME STATEMENT H1 2013/14
Q2 2013/14 Q2 2012/13 H1 2013/14 H1 2012/13
in KEUR 01.02. - 30.04.2014 01.02. - 30.04.2013 01.11.2013-30.04.2014 01.11.2012 - 30.04.2013
Sales 222.397,9 218.988,0 412.777,1 403.884,0
Other operating income 2.544,8 3.149,9 7.164,5 7.143,6
Changes in inventories -9.208,0 -22.353,8 4.657,0 -8.052,9
Cost of materials -88.738,1 -85.685,4 -190.339,8 -184.472,9
Personnel expenses -36.899,2 -34.429,9 -73.003,0 -69.268,4
Depreciation/Amortisation -6.220,3 -4.710,4 -12.262,2 -10.069,8
Other operating expenses -52.328,2 -49.152,9 -98.916,7 -95.284,5
Other taxes -287,4 -252,4 -560,3 -512,8
OPERATING RESULT 31.261,5 25.553,1 49.516,6 43.366,2
Financial result -1.349,9 -810,0 -2.701,5 -1.579,8
RESULTS FROM ORDINARY ACTIVITIES 29.911,6 24.743,1 46.815,1 41.786,4
Taxes on income -8.793,2 -6.969,6 -14.106,4 -12.463,7
NET INCOME OF THE REPORTING PERIOD 21.118,4 17.773,5 32.708,7 29.322,7

30
Appendix
Key financials 2012/132012/13 2011/12 Changes in %
in EUR million
Sales 852.0 802.3 6.2%
Domestic 520.2 491.0 6.0%
International 331.8 311.3 6.6%
Sales 852.0 802.3 6.2%
Wholesale 488.3 502.8 -2.9%
Retail 363.7 299.5 21.4%
Sales split by brand
GERRY WEBER 75.2% 76.4% -1.6%
TAIFUN 19.4% 18.3% 6.0%
SAMOON 5.3% 5.3% 0.0%
Earnings key figures
EBITDA 127.4 132.3 -3.6%
EBITDA margin 15.0% 16.5% -1.5%
EBIT 105.8 115.9 -8.7%
EBIT margin 12.4% 14.5% -2.0%
EBT 102.8 113.7 -9.6%
EBT margin 12.1% 14.2% -2.1%
Net income of the year 71.0 78.8 -9.9%
Earnings per share in Euro1 1.55 1.72 -9.9%