strategy of capital structure decisions of banglalink
TRANSCRIPT

INTERNSHIP REPORT
On
Strategy of Capital Structure Decisions of Banglalink
Prepared For:
Muhammad Enamul Haque,
Assistant Professor,
School of Business & Economics,
United International University.
Prepared By:
Sadman Shoumik Ahmed
111 121 187
Submission Date: 12th May, 2016

2
Letter of Transmittal
12th May, 2016
Muhammad Enamul Haque,
Assistant Professor,
School of Business & Economics,
United International University.
Subject: Submission of Internship Report.
Dear Sir,
This is the internship document which I am submitting as part of the requirement of BBA
degree. I have completed my internship in a multinational organization and this report is the
result of that.
I have written this report on a topic that was assigned to me. The topic of this report is
“Strategy of Capital Structure decisions of Banglalink”. In the beginning of the report I have
given information about the telecom industry and Banglalink in particular. After that I have
included theories that led to a deeper financial analysis of the firm. Finally, I have analyzed the
financial performance of Banglalink as well as given an account of future potential.
I appreciate your guidance and hope this report will be accepted. I would like to thank you for
being my course teacher.
Yours faithfully,
Sadman Shoumik Ahmed.

3
Acknowledgement
Successful conclusion of any course requires support from various people and I was privileged
to have that support, coordination, and supervision in every aspect from my internship
supervisors, teachers, friends and others.
First of all I would like to thank Almighty Allah for keeping me in good health always. I would
like to express my deep sense of thankfulness to Mr. Aktar Hossain, Deputy Manager of
Production Support unit for selecting me and giving me the opportunity at Banglalink. I would
also like to thank my supervisor, Mr. Barun Kumar Majumder for guiding me towards practical
knowledge. Then I would like to express my gratitude to my teacher, Muhammad Enamul
Haque, for his candid encouragement as well as guidance in preparing this report. I also
acknowledge my gratitude to the other members of the Production Support unit of Banglalink,
namely to, Mrs. Naima Yasmeen Shahed, Mr. Md. Hasanur Rashid, Mr. Md. Fakhrul Islam, Mrs.
Mst. Mahbuba Rahman, Mr. Md. Forhad Hossain and Mr. Sayemuzzaman. Without their
support this report would have been incomplete.
I also show my utmost gratitude to all the officials of Banglalink, the speed and helpfulness of
the officers really helped me in obtaining the necessary information in time.

4
Executive Summary
This report essentially has 2 parts; the first part gives information about the firm, while the
second part has an analytical study. In the first part, I have given comprehensive information
about the company itself and also some other information about the parent company of
Bangladesh. I have given a background and little bit of history about Banglalink. I have solicited
information from my team members through one-on-one interaction. They were very helpful
and provided me with adequate knowledge. I have demonstrated everything in this report
whatever I have learnt and understood.
In the second part, I have conducted a financial analysis to judge the historical performance of
Banglalink. For doing the financial analysis, I have used annual reports to get numerical
information for the last 5 years. I have extracted information from the financial statements
such as income statements and balances sheets. After extracting the data, I have applied ratios
such as liquidity, profitability and solvency ratios. Ratio analysis is a vital tool for doing financial
analysis. The ratios were then expanded to further to be incorporated into other topics such as
the capital structure and risk analysis. The ratios by themselves weren’t evaluated. Financial
analysis gives a lens to the business of how it’s actually performing. But the numbers by
themselves are useless. It must be compared to other numbers. Hence, I have calculated ratios
for past several years and given a comparison of Banglalink’s performance over the yester
years.

5
Table of Contents
Letter of Transmittal ....................................................................................................................... 2
Acknowledgement .......................................................................................................................... 3
Executive Summary ......................................................................................................................... 4
Chapter 1 – Introduction of the Report .......................................................................................... 7
Background ..................................................................................................................................... 8
Origin ............................................................................................................................................... 8
Objectives........................................................................................................................................ 8
Scope ............................................................................................................................................... 9
Methodology ................................................................................................................................... 9
Limitations..................................................................................................................................... 10
Chapter 2 – About Banglalink and VimpelCom............................................................................. 11
Overview of the Telecom Industry in Bangladesh ........................................................................ 12
About Vimpelcom ......................................................................................................................... 13
About Banglalink ........................................................................................................................... 16
Organizational Structure ............................................................................................................... 17
Functional Departments of Banglalink ......................................................................................... 18
Vision and Values .......................................................................................................................... 19
Chapter 3 – Capital Structure Theory ........................................................................................... 21
Capital Structure ........................................................................................................................... 22
Leverage ........................................................................................................................................ 22
Pie Model of Capital Structure ...................................................................................................... 23
Modigliani-Miller Theorem ........................................................................................................... 24
Modigliani and Miller: Proposition I (No Taxes) ........................................................................... 25
Key Assumption ............................................................................................................................ 25
Modigliani and Miller: Proposition II (No taxes) ........................................................................... 26
Modigliani and Miller: Proposition I (Corporate Taxes) ............................................................... 28
Present Value of Tax Shield .......................................................................................................... 29
Value of the Levered Firm ............................................................................................................. 30
Modigliani and Miller: Proposition II (Corporate Taxes) .............................................................. 31

6
The WACC, RWACC, and Corporate Taxes ....................................................................................... 31
Optimal capital structure .............................................................................................................. 32
Bankruptcy risk or bankruptcy cost? ............................................................................................ 32
Direct Costs ................................................................................................................................... 33
Indirect costs of Financial distress ................................................................................................ 33
Cost of Capital ............................................................................................................................... 35
Chapter 4 – Determining the value of the firm ............................................................................ 37
Debt Ratio ..................................................................................................................................... 38
Increase in Cash Flows .................................................................................................................. 39
Calculation of Discount Rate ......................................................................................................... 40
Application of MM Proposition I (corporate taxes) ...................................................................... 42
Value of Unlevered firm ................................................................................................................ 43
Present Value of Tax shield ........................................................................................................... 44
Chapter 5 – Financing Options & Risk Analysis ............................................................................. 46
Financing options of Banglalink .................................................................................................... 47
Short Term Financing .................................................................................................................... 47
Long Term Financing ..................................................................................................................... 50
Risk Analysis .................................................................................................................................. 52
DuPont Analysis ............................................................................................................................ 55
Chapter 6 – Conclusion ................................................................................................................. 58
Conclusion ..................................................................................................................................... 59
Recommendation .......................................................................................................................... 59
References .................................................................................................................................... 60

7
Chapter 1 – Introduction

8
Background
The internship experience was a way to get a flavor of the corporate scenario which will
definitely help me to transition into the next phase of my career. This report is a necessary part
of doing an internship in any organization. A report of this sort shows the learning achieved
through a formal venture. The financial analysis part was a separate study as I wasn’t interning
in the Finance department. The analysis has many parts such as capital structure analysis, risk
analysis as well as DuPont analysis. The analysis that I have done in this report is part of the
work to show the advantages and the disadvantages of having huge debts that the firm
currently services.
Origin
This report is a requirement to complete the BBA degree successfully. As part of the BBA
program of United International University, the course Internship/Project (INT-4399) consists of
3 credits. The student must either do a practical training in a corporate organization of his/her
choice known as ‘Internship’ or he/she must do research on a particular topic to submit a
report known as ‘Project’. Regardless of the student’s choice, a report must be submitted to a
faculty supervisor which exhibits practical learning in the field of study.
Objectives
General – The major objective of this report was to find out the value of the firm. The theories
had to be examined in order to be able to implement the theory into the applicable data. The
optimal capital structure policy was also looked into. The risk analysis was also conducted in
order to understand the debt burden of the firm.
Specific – The specific objectives of this study are:-
To know about the organization and its parent in details and the ownership structures of
both the entities.
To have an understanding on the products and services offered by Banglalink Digital
Communications Ltd.

9
To find the value of the firm through techniques learnt in the courses of academic setting to
demonstrate understanding of the knowledge.
To analyze the financial performance of Banglalink Digital Communications Ltd. with
historical figures.
Scope
This report has very limited information based on comprehensive empirical data. Most of the
opinions and interpretations are assumption supported. Although I cannot say this for the
financial analysis part, as the analysis was based on my knowledge. But since the financial
statements themselves do not have adequate data, I couldn’t give a truer picture of the
financial situation. Banglalink is not a publicly listed company, but simply a brand that is part of
a larger portfolio of Vimpelcom, and hence the limited information in annual reports. My
internship experience is limited by the duration of 3 months, so I could only give a small
account of what I gained from corporate experience.
Methodology
To make this report more expressive and presentable, both primary and secondary sources of
data were used widely.
Primary Data: Primary data used in this report is fundamentally collected from the executives
and managers of the organization and besides that the working process of different units is
expressed based on my experience on those units. During my internship period I have
interviewed different officials of the company and this also provided qualitative data.
Secondary Data: Secondary data was collected from articles of different journals and
newspapers. Moreover, to prepare this report I have gone through different websites and most
importantly annual reports of different telecom industries have been explored in order to get
quantitative data.

10
Limitations
Information on the telecom industry is scarce and therefore difficulties have to be dealt with
while preparing this report. Moreover, as an intern I did not have access to all the files and
folders because of the organization’s confidentiality policy and I have very limited scope to
reveal financial data in this report. Other than Grameenphone, other players in the telecom
industry are not yet listed in the stock exchange and because of it the financial data of other
telecom companies are not made public and this are kept as highly confidential. Therefore, this
emerged as a big challenge to give a pure picture of the financial performance.

11
Chapter 2 – About Banglalink and VimpelCom

12
Overview of the Telecom Industry in Bangladesh
Among the south Asian countries Bangladesh adopted cellular technology first back in 1993 by
introducing Advanced Mobile Phone System (AMPS).The first mobile license was issued in 1989
but it failed to cater the market with good products and services in a lower cost. The
subscription price was way too high to attract the mass people and the tariff was highest in the
history, yet the network coverage and the quality of network was unbelievably poor. In 1996,
the government awarded three GSM licenses aimed at breaking the monopoly and making the
cellular technology affordable to the general masses. Since then, the telecom industry played
significant role in improving the quality of life of people through providing information
technology and a new era of communication started. This telecom sector has brought largest
foreign direct investment the country has ever experienced, paid substantial amount of tax in
every year, created new opportunities by generating employment and most importantly
because of the availability of this particular service the socio-economic development of the
country has boosted up drastically. It has brought changes in the country by providing value-
added services and creating employment from direct/indirect firms in the telecommunications
sector, increasing productivity in businesses, increasing the involvement and engagement of its
population with news and current affairs. The inflow of foreign direct investment (FDI) grew by
26 per cent with telecommunication sector making highest growth in the 2008-09 fiscal years
over that of the previous fiscal. A total of around US $ 430 million was invested in the country's
telecommunication sector, particularly by fast-growing mobile phone companies in FY 09," a
recent study of Bangladesh Bank reveals. Investment from this industry as of December 2008
stands around BDT 3,000 (Three Thousand) billion. It has generated direct and indirect
employment of 675,000 (six hundred seventy five thousand) people till 2006-07 FY which has
increased further in recent years. In the year 2011 Bangladesh faced a new version of financial
service which is mobile banking. The easiest way of money transfer and lot more. In this service
mobile customers can use their mobile phone numbers to hold or open an account and with
the account they can transfer money to one another without going to the bank. The main
purpose of launching this service is to reach the unbanked population with appropriate
financial services using cellphone technology. The telecom sector has also made possible the

13
availability of data enabling services across Bangladesh. Mobile internet has helped, and will
likely continue, to bridge the digital divide between people with access to information and
services, and those without paving the way for materializing the dream of "Digital Bangladesh".
This is especially also given the greater mobile coverage reaching 97% of the population which
extends into areas beyond the fixed-lines network. It was estimated that there were over 5
million mobile internet users. Geographic location as a result will become less of a barrier to
social and economic inclusion, especially amongst those within the rural areas, helping support
local development, avoiding unnecessary migration and improving socio-geographic structure.
In the year 2013, to accelerate the internet data usage the government of Bangladesh has
issued 3g license to four telecom operators of Bangladesh.
About Vimpelcom
Banglalink is more than 99.99% owned by Telecom Ventures Ltd. of Malta, which is a fully
owned subsidiary of Global Telecom Holding s.a.e. of Egypt. Following the business
combination in April 2011 between VimpelCom Ltd. and Wind Telecom S.p.A, VimpelCom Ltd.
holds 51.9% shares of Global Telecom Holding. VimpelCom Ltd, headquartered in Amsterdam,
is a global telecom company operating in 14 countries.
VimpelCom is one of the world’s largest integrated telecommunications services operators
providing voice and data services through a range of traditional and broadband mobile and
fixed technologies in Russia, Italy, Ukraine, Kazakhstan, Uzbekistan, Tajikistan, Armenia,
Georgia, Kyrgyzstan, Laos, Algeria, Bangladesh, Pakistan, and Zimbabwe. VimpelCom’s
operations around the globe cover territory with a total population of approximately 740
million people. VimpelCom provides services under the “Beeline”, “Kyivstar”, “WIND”,
“Mobilink”, “banglalink”, “Telecel”, and “Djezzy” brands. In 2014, VimpelCom had annual
revenue of USD 19.6 billion, EBITDA of USD 8.0 billion, and a mobile customer base of 222
million. VimpelCom's ADSs are traded on the NASDAQ Global Select Market under the symbol
VIP.

14
Figure 1
Ownership Structure
Telecom ventures Ltd. is currently operating its business in Bangladesh under the brand name
Banglalink Digital Communications Ltd. Telecom Ventures Ltd. It is a Malta-based
telecommunication company which was formerly known as Orascom Telecom Ventures Ltd.
and now it is a fully owned subsidiary of Global Telecom Holding S.A.E. (former Orascom
Telecom Holding S.A.E.). A business combination between VimpelCom of Russia and Wind
Telecommunication of Italy took place in April 2011 and after this combination world’s sixth
largest telecom operator VimpelCom now owns 51.92% voting shares of Global Telecom
Holding S.A.E and therefore, VimpelCom is the ultimate parent company of Banglalink Digital
Communications Ltd. Although VimpelCom is the ultimate owner of Banglalink, the structure of
shareholders is shown in Figure 2:

15
Figure 2
The ownership structure of VimpelCom is also very interesting. The parent company of
Banglalink’s main competitor in Bangladesh is Telenor and very surprisingly Telenor has good
amount of stake in VimpelCom. Altimo of Alpha Group has 56.2% economic rights and 47.9%
voting rights in VimpelCom. Altimo is one of the Russia’s largest investment firms and it has its
stake in oil and gas, commercial and investment banking, asset management, insurance, retail
trade, telecommunications, water utilities and special situation investments. Their business
portfolio includes many large corporations and they are successful in investing on diversified
sectors to reduce business risk which is also popular as unsystematic risk. The other
shareholder of VimpelCom is Telenor group of Norway. This Norwegian giant holds 33%
economic rights and 43% voting rights in VimpelCom. This group has its fame in operating large
telecom companies in 29 countries around the world. Therefore, in Bangladesh whether
someone uses Grameenphone or Banglalink Telenor is being benefitted substantially. The rest

16
10.8% economic rights and 9.2% voting rights belong to the minor shareholders. This sums up
the 100% ownership structure of VimpelCom.
About Banglalink
Banglalink digital communications limited (previously orascom telecom Bangladesh limited) is
fully owned by telecom ventures ltd. (previously orascom telecom ventures limited) of Malta,
which is a 100% owned subsidiary of global telecom holding (www.gtelecom.com). Following
business combination, in April 2011, between vimpelcom ltd. and wind telecom s.p.a,
VimpelCom owns 51.92% shares of global telecom holding. vimpelcom (www.vimpelcom.com)
is one of the world’s largest integrated ltd. telecommunications services operators providing
voice and data services through a range of traditional and broadband mobile and fixed
technologies in Russia, Italy, Ukraine, Kazakhstan, Uzbekistan, Tajikistan, Armenia, Georgia,
Kyrgyzstan, Laos, Algeria, Pakistan, Zimbabwe and Bangladesh. Vimpelcom is headquartered in
Amsterdam, The Netherlands and listed on the NASDAQ global select market under the symbol
“vip”.
Since Banglalink’s launch in February 2005, its impact was felt immediately: overnight mobile
telephony became an affordable option for customers across a wide range of market segments.
Banglalink’s initial success was based on a simple mission: “bringing mobile telephony to the
masses” which was the cornerstone of its strategy. Banglalink changed the mobile phone status
from luxury to a necessity, brought mobile telephone to the general people of Bangladesh and
made a place in their hearts. The mobile phone has become the symbol for positive change in
Bangladesh. The brand slogan of “start something new” is in essence derived from Banglalink’s
promise of empowering people with affordable communication solutions so that they can take
new initiatives in life. The company believes that, it is through such new initiatives that positive
change will occur for the overall betterment of the nation.
Banglalink attained 1 million subscribers by December 2005 and 3 million subscribers in
October 2006. In less than two years which is by December 2007, Banglalink overtook Aktel to
become the second largest operator in Bangladesh with more than 7.1 million customers.

17
Banglalink currently has 31.9 million subscribers as of February 2016, representing a market
share of 24.4%.
Banglalink’s growth over the preceding years have been fuelled with innovative products and
services targeting different market segments, aggressive improvement of network quality and
dedicated customer care, creating an extensive distribution network across the country, and
establishing a strong brand that emotionally connected customers with Banglalink.
Figure 3
Organizational Structure
The present management team of Banglalink is led by nine highly qualified people. They are the
power house of decision making and strategy forming. This management team is headed by
Erik Aas who is the current CEO and Managing Director of Banglalink. He was appointed by the
Board of Directors as the CEO of Banglalink in January 2013. The Chief Financial Officer (CFO),
Chief Technology Officer (CTO), Chief Commercial Officer (CCO), Chief Information & Customer
Excellence Officer (CICEO), Human Resources & Administration Director, Government Relations

18
Senior Director, Regulatory Affairs Senior Director and Company Secretary & Local Compliance
Officer are the members of the management team.
Figure 4
Functional Departments of Banglalink
Sales division
Marketing Division
Human Resources Divisions
IT and Billing division
Administration Division
Customer Care Division
Finance Division
Technical Division

19
Vision and Values
Vision
To understand people’s needs best and develop appropriate communication services to
improve people’s lives and make it simple
Mission
Segmented approach in terms of products and services
Delivering superior benefits in every phase of customer experience (before, during and after
sales)
Creating optimum shareholder value4
Core Values
All employees of Banglalink are expected to demonstrate the following core values in day-to-
day activities to:-
“Start something new” in every area of our operations in the “Banglalink” way:
Innovative
What makes us Innovative:
Being open minded and flexible
Discouraging false pride and challenging the normal way to do things
Learning and adopting best practices from others
Thinking of a situation from various points of view
Creating an environment where others can put forth their ideas without hesitation or fear
Straightforward
What makes us Straightforward:
Communicating clearly and effectively
Listening empathically and asking questions to seek out and understand different views

20
Practicing what we preach
Leading by example
Accepting responsibility for successes and failures
Reliable
What makes us Reliable:
Generating trust and reliability
Being understanding and focusing on a solution that everyone can benefit from
Delivering results by deadlines
Thinking before making a commitment and sticking to it
Making honest decisions based on facts & figures, not feelings or opinions
Passionate
What makes us Passionate:
Striving to achieve goals
Believing in self and team’s ability to achieve targets
Driving for excellence in execution
Using information/resources available in the best possible way to achieve targets
Reaching the desired goal through trying out different options with determination

21
Chapter 3 – Capital Structure Theory

22
20%
80%
High Leverage Firm
Equity Debt
80%
20%
Low Leverage Firm
Equity Debt
Figure 8 Figure 9
Capital Structure
In finance, capital structure is the way a corporation finances its assets through some
combination of equity, debt, or hybrid securities. It is a mix of a company's long-term debt,
specific short-term debt, common equity and preferred equity. The capital structure is how a
firm finances its overall operations and growth by using different sources of funds. A firm's
capital structure is the composition of its liabilities. For example, a firm that has $20 billion in
equity and $80 billion in debt is said to be 20% equity-financed and 80% debt-financed. In
reality, capital structure may be highly complex and include dozens of sources of capital.
Leverage
Leverage is any technique in finance to multiply gains and losses. Most often it involves buying
more of an asset by using borrowed funds, with the belief that the income from the asset or
asset price appreciation will be more than the cost of borrowing. Companies that are financed
by high proportion of debt are ‘high leverage firms’ and companies that have low proportion of
debt are called ‘low leverage firms’. Equity owners of businesses leverage their investment by
having the business borrow a portion of its needed financing. The more it borrows, the less
equity it needs, so any profits or losses are shared among a smaller base and are
proportionately larger as a result.

23
The firm on Figure 8 is highly leveraged as the majority of its assets are financed with debt
(80%). The firm on Figure 9 is lowly leveraged as the majority of its assets are financed with
equity and it has a very low level of debt (20%).
What is the optimal way of financing a company? What composition of debt and equity
should be included? I will address these problems using the pie model of capital structure. The
pie represents the value of the company. The value of the firm consists of the equity and debt.
Let’s take the value of the firm in a simple way:
V = B + S
In the above equation, B is the market value of the debt and S is the market value of the equity.
The figures below show two possible ways of slicing this pie between stock and debt: 30
percent–70 percent and 70 percent–30 percent.
Pie Model of Capital Structure
Figure 10
30%
70%
Value of Firm
Stocks Bonds

24
Figure 11
The goal of the financial manager is to make the firm as valuable as possible. To do this, the
firm should pick the debt-equity ratio that makes the pie or the total value – as big as possible.
Modigliani-Miller Theorem
The Modigliani-Miller theorem 1958, proposed by Franco Modigliani and Merton Miller, forms
the basis for modern thinking on capital structure, though it is generally viewed as a purely
theoretical result since it disregards many important factors in the capital structure process
factors like fluctuations and uncertain situations that may occur in the course of financing a
firm. The theorem states that, in a perfect world, how a firm is financed is irrelevant to its
value. A perfect world means where there are no bankruptcy, agency or taxation costs. It also
means that the financial markets are strong form efficient. However, in the real world, how a
firm is financed is crucial if the real world factors such as taxes and transaction costs are taken
into account. In the MM proposition (1 & 2) of no taxes, capital structure is irrelevant. But the
MM proposition (1 & 2) with taxes, presents a case where the value of the firm can be
maximized if taxes are taken into consideration. Financial economists have argued that real
world factors have been left out of the theory and hence we would like to examine some
practical factors. In my analysis of Banglalink, real world factors will be considered to determine
the value of Banglalink. Let’s look at the theories part by part:-
70%
30%
Value of Firm
Stocks Bonds

25
Modigliani and Miller: Proposition I (No Taxes)
Modigliani and Miller (MM) have a convincing argument that a firm cannot change the total
value of its outstanding securities by changing the proportions of its capital structure. In other
words, the value of the firm is always the same under different capital structures. In still other
words, no capital structure is any better or worse than any other capital structure for the firm’s
stockholders. This rather pessimistic result is the famous MM Proposition I. Their argument
compares a simple strategy, which is called Strategy A, with a two-part strategy, which is called
Strategy B. The combination of both A & B is known as ‘Homemade Leverage’. Homemade
leverage is a substitution of risks that investors may undergo in order to move from overpriced
shares in highly levered firms to those in unlevered firms by borrowing in personal accounts. It
is the situation where individuals borrowing on the exact same terms as large firms can
duplicate corporate leverage through purchasing and financing options. The payoff to the
investor will be the same whether the firm has debt or not. Thus the firm neither helps nor
hurts the investor by adding debt to capital structure.
VL = Value of levered firm (firm with debt)
VU = Value of unlevered firm (firm with no debt)
VL = VU
The above expression implies that the value of the levered firm equals the value of unlevered
firm. Hence, the value of both firms stay same regardless of capital structure.
Key Assumption
The MM result hinges on the assumption that individuals can borrow as cheaply as
corporations. If, alternatively, individuals can borrow only at a higher rate, we can easily show
that corporations can increase firm value by borrowing. Now the question is, is this assumption
valid? Corporations issue debt in substantial amounts for expenditure in large projects involving
expensive fixed assets. They also have a wider scope when choosing a lender. Before issuing
debt, they assign collateral which involves very expensive assets and that way the lenders
perceive the corporation as less risky. And hence, the corporations can avail loans with low
interest rates. On the other hand, individuals usually do not have much collateral to mitigate

26
the risk perceived by lenders. Hence, they usually have to borrow on much higher rates. Thus is
it difficult to argue that individuals must borrow at higher rates than corporations.
Modigliani and Miller: Proposition II (No taxes)
Here MM argue that the expected return on equity is positively related to leverage because the
risk to equity holders increases with leverage. To develop this position, we must start from the
firm’s weighted average cost of capital, RWACC. A higher debt-to-equity ratio leads to a higher
required return on equity, because of the higher risk involved for equity-holders in a company
with debt. The formula is derived from the theory of weighted average cost of capital (WACC).
RWACC = 𝐒
𝐁+𝐒 x RS +
𝐁
𝐁+𝐒 x RB
RB = Cost of Debt
RS = the expected return on equity or stock, also called the cost of equity
RWACC = the firm’s weighted average cost of capital.
B = the value of the firm’s bonds or debt.
S = the value of the firm’s stock or equity.
These propositions are true under the following assumptions:
No transaction costs exist, and
Individuals and corporations borrow at the same rates.
These results might seem irrelevant (after all, none of the conditions are met in the real world),
but the theorem is still taught and studied because it tells something very important. That
is, capital structure matters precisely because one or more of these assumptions is violated. It
tells where to look for determinants of optimal capital structure and how those factors might
affect optimal capital structure.

27
Figure 12
RS = R0 + (R0 – RB) B/S
RS is the cost of equity.
RB is the cost of debt.
R0 is the cost of capital for an all-equity firm.
RWACC is a firm’s weighted average cost of capital. In a world with no taxes, RWACC for a
levered firm is equal to R0.
R0 is a single point whereas RS, RB & RWACC are all entire lines.
The cost of equity capital, RS, is positively related to the firm’s debt-equity ratio. The firm’s
weighted average cost of capital, RWACC, is invariant to the firm’s debt-equity ratio.
Figure 12 graphs the RS equation. As you can see, we have plotted the relation between the
cost of equity, RS, and the debt-equity ratio, B/S, as a straight line. What we witness in RS
equation and illustrate in the figure is the effect of leverage on the cost of equity. As the firm
raises the debt-equity ratio, each dollar of equity is levered with additional debt. This raises the
risk of equity and therefore the required return, RS, on the equity.

28
The figure also shows that RWACC is unaffected by leverage, a point we had already made. It is
important to realize that RS, the cost of capital for an all-equity firm, is represented by a single
dot on the graph. By contrast, RWACC is an entire line.
Modigliani and Miller: Proposition I (Corporate Taxes)
In the previous cases of ‘no debt’, it was shown that firm value is unrelated to debt in a world
without taxes. In this section I will show that in the presence of corporate taxes, the firm’s
value is positively related to its debt. The basic intuition can be seen from a pie chart, such as
the one in Figure 13. Consider the all-equity firm on the left. Here both equity holders and the
IRS have claims on the firm. The value of the all-equity firm is, of course, that part of the pie
owned by the equity holders. The proportion going to taxes is simply a cost. The pie on the right
for the levered firm shows three claims: Equity holders, debt-holders, and taxes. The value of
the levered firm is the sum of the value of the debt and the value of the equity. In selecting
between capital structures, a financial manager should choose the one with the higher value.
Assuming that the total area is the same for both pies, value is maximized for the capital
structure paying the least in taxes. This means that there is a higher claim left for the equity
holders and bondholders combined. This leads to higher firm value. A financial manager should
choose a capital structure that pays the least in taxes.
Figure 13

29
Due to the way interest is treated in the financial statements, taxes can easily be decreased by
taking on debt to finance operations. Interest is deducted after the operating profit is
calculated. If the firm takes more debt, then it will definitely have to pay more interest. As
interest payments are higher, a larger proportion of operating profit is consumed. Now comes
taxation. The taxes are deducted right after interest deduction and this is where the
opportunity comes in. The taxable income is now reduced due to higher interest payments. The
government gets less revenue simply because a financial manager has altered the capital
structure to have a higher debt ratio. This leads to higher firm value.
Present Value of Tax Shield
The previous discussion shows a tax advantage to debt. We now want to value this advantage.
The dollar interest is:
Interest = RB x B
As I said earlier, interest is tax deductible. So the interest payment will lead to a reduction to
corporate taxes that can be expressed by the following equation:-
tC x RB x B
That is, whatever the taxes that a firm would pay each year without debt, the firm will pay tCRBB
less with the debt of B. This equation is often called the tax shield from debt. Note that it is an
annual amount.
As long as the firm expects to be in a positive tax bracket, we can assume that the cash flow in
the above equation has the same risk as the interest on the debt. The value of this tax shield
can be found out by discounting the tax shield at the cost of debt, RB. Assuming the cash flows
are perpetual, the present value of the tax shield is:-
𝐭𝐂𝐑𝐁𝐁
𝐑𝐁 = tCB

30
Value of the Levered Firm
After finding out present value of tax shield, the next step is to calculate the value of the
levered firm. The annual after-tax cash flow of an unlevered firm is:
EBITDA x (1 – tC)
EBITDA = Earnings before interest, taxes, depreciation and amortization.
The value of an unlevered firm is the present value of EBITDA x (1 – tC):
VU = 𝐄𝐁𝐈𝐓𝐃𝐀∗ (𝟏 − 𝐭𝐂)
𝐑𝟎
VU = Present value of an unlevered firm.
EBITDA x (1 – tC) = Firm cash flows after corporate taxes.
tC = Corporate tax rate.
R0 = Cost of capital to an all-equity firm. As can be seen from the formula, R0 now discounts
after-tax cash flows.
As shown previously, leverage increases the value of the firm by the tax shield, which is tcB for
perpetual debt. Thus we merely add this tax shield to the value of the unlevered firm to get the
value of the levered firm. The following is the equation of levered firm value:
VL = 𝐄𝐁𝐈𝐓𝐃𝐀∗(𝟏 − 𝐭𝐂)
𝐑𝟎 +
𝐭𝐂𝐑𝐁𝐁
𝐑𝐁 = VU + tCB
The above equation is MM Proposition I under corporate taxes. The first term in the equation is
the value of the cash flows of the firm with no debt tax shield. In other words, this term is equal
to VU, the value of the all-equity firm. The value of the levered firm is the value of an all-equity
firm plus tcB, the tax rate times the value of the debt. tCB is the present value of the tax shield
in the case of perpetual cash flows. Because the tax shield increases with the amount of debt,
the firm can raise its total cash flow and its value by substituting debt for equity. Later on, I will
show the value of Banglalink under this theory.

31
Modigliani and Miller: Proposition II (Corporate Taxes)
MM Proposition II under no taxes posits a positive relationship between the expected return on
equity and leverage. This result occurs because the risk of equity increases with leverage. The
same intuition also holds in a world of corporate taxes. The exact formula in a world of
corporate taxes is this:-
RS = R0 + 𝐁
𝐒 x (1 – tC) x (R0 – RB)
Whenever R0 > RB, RS increases with leverage, a result that we also found in the no-tax case. As
stated earlier in this chapter, R0 should exceed RB. That is, because equity (even unlevered
equity) is risky, it should have an expected return greater than that on the less risky debt. To
confirm the theory we can use the RS to find the value of levered equity:-
S = (𝐄𝐁𝐈𝐓𝐃𝐀−𝐑𝐁𝐁) ∗ (𝟏−𝐭𝐂)
𝐑𝐒
The WACC, RWACC, and Corporate Taxes
As I had mentioned earlier, the value of the levered firm is:
VL = S + B
The weighted average cost of capital of the firm is result of the weighted product with the
return from each investor:
RWACC = 𝐒
𝐕𝐋 RS +
𝐁
𝐕𝐋 RB (1 – tC)
The cost of debt capital, RB, is multiplied by (1 – tC) because interest is tax deductible at the
corporate level. However, the cost of equity, RS, is not multiplied by this factor because
dividends are not deductible. In the no-tax case, RWACC is not affected by leverage. This result
is reflected in Figure 14, which was discussed earlier. However, because debt is tax-advantaged
relative to equity, it can be shown that RWACC declines with leverage in a world with corporate
taxes. This result can be seen in the figure.
VL = 𝐄𝐁𝐈𝐓 ∗ (𝟏−𝐭𝐂)
𝐑𝐖𝐀𝐂𝐂

32
Figure 14
Optimal capital structure
In the MM proposition with taxes, it was shown that in a world with taxes, the value of the firm
increases with leverage, implying that firms should take on as much debt as possible. But it
leaves out many real world implications. This will leave many confused. Is this the whole story?
Should financial managers really set their firms’ debt ratios near 100%? If so, why do real-world
companies have rather modest levels of debt? There are good reasons for modest capital
structures. I will begin with the concept of bankruptcy costs. These costs increase with debt,
offsetting the tax advantage of leverage.
Bankruptcy risk or bankruptcy cost?
As mentioned previously, debt provides tax benefits to the firm. However, debt puts pressure
on the firm because interest and principal payments are obligations. If these obligations are not
met, the firm may risk some sort of financial distress. The ultimate distress is bankruptcy,
where ownership of the firm’s assets is legally transferred from the stockholders to the
bondholders. These debt obligations are fundamentally different from stock obligations.
Although stockholders like and expect dividends, they are not legally entitled to dividends in
the way bondholders are legally entitled to interest and principal payments.

33
Direct Costs
During a bankruptcy, lawyers are involved throughout all the stages before and during
bankruptcy. With fees often in the hundreds of dollars an hour, these costs can add up quickly.
In addition, administrative and accounting fees can substantially add to the total bill. And if a
trial takes place, we must not forget expert witnesses. Each side may hire a number of these
witnesses to testify about the fairness of a proposed settlement. Their fees can easily rival
those of lawyers or accountants.
Indirect costs of Financial distress
Impaired ability to conduct business – Bankruptcy hampers conduct with customers and
suppliers. Sales are frequently lost because of bot fear of impaired service and loss of trust. For
example, in 2008, both General Motors and Chrysler were experiencing significant financial
difficulties, and many people felt that one or both companies would eventually file for
bankruptcy (both later did). As a result of the bad news surrounding the companies, there was a
loss of confidence in their automobiles. A study showed that 75 percent of Americans would
not purchase an automobile from a bankrupt company because the company might not honor
the warranty, and it might be difficult to obtain replacement parts. This concern resulted in lost
potential sales for both companies, which only added to their financial distress. It is quite
difficult to measure these indirect costs.
Agency Costs – When a firm has debt, conflicts of interest arise between stockholders and
bondholders. Because of this, stockholders are tempted to pursue selfish strategies. These
conflicts of interest, which are magnified when financial distress is incurred, impose agency
costs on the firm. Stockholder use something that we call “Selfish strategies”. Stockholders use
these strategies to hurt the bondholders and help themselves. These strategies are costly
because they will lower the market value of the whole firm.
Integration of Tax Effects and Financial Distress Costs – Modigliani and Miller argue that the
firm’s value rises with leverage in the presence of corporate taxes. Because this relationship
implies that all firms should choose maximum debt, the theory does not predict the behavior of
firms in the real world. Other authors have suggested that bankruptcy and related costs reduce

34
the value of the levered firm. The integration of tax effects and distress costs appears in Figure
15.
Figure 15
Figure 16
In Figure 15, the diagonal straight line represents the value of the firm in a world without
bankruptcy costs. The -shaped curve represents the value of the firm with these costs. This

35
curve rises as the firm moves from all equity to a small amount of debt. Here, the present value
of the distress costs is minimal because the probability of distress is so small. However, as more
and more debt is added, the present value of these costs rises at an increasing rate. At some
point, the increase in the present value of these costs from an additional dollar of debt equals
the increase in the present value of the tax shield. This is the debt level maximizing the value of
the firm and is represented by B* in the figure. In other words, B* is the optimal amount of
debt. Bankruptcy costs increase faster than the tax shield beyond this point, implying a
reduction in firm value from further leverage.
In Figure 16, the weighted average cost of capital (RWACC) falls as debt is added to the capital
structure. After reaching B*, the weighted average cost of capital rises. The optimal amount of
debt produces the lowest weighted average cost of capital.
Our discussion implies that a firm’s capital structure decision involves a trade-off between the
tax benefits of debt and the cost of financial distress. In fact, this approach is frequently called
the trade-off or the static trade-off theory of capital structure. The implication is that there is
an optimal amount of debt for any individual firm. This amount of debt becomes the firm’s
target debt level. Because financial distress costs cannot be expressed in a precise way, no
formula has yet been developed to determine a firm’s optimal debt level exactly.
Cost of Capital
The cost of capital must be found so that the value of Banglalink can be determined. The cost of
capital will used to discount the earnings of the company ultimately it will help to find the fair
value of the firm.
Whenever a firm has extra cash, it can take one of two actions. It can pay out the cash directly
to its investors. Alternatively, the firm can invest the extra cash in a project, paying out the
future cash flows of the project. Which action would the investors prefer? If investors can
reinvest the cash in a financial asset (stock or bond) with the same risk as that of the project,
the investors would desire the alternative with the highest expected return. In other words, the
project should be undertaken only if its expected return is greater than that of a financial asset

36
of comparable risk. A firm's cost of equity represents the compensation that the market
demands in exchange for owning the asset and bearing the risk of ownership.

37
Chapter 4 – Determining the Value of the Firm

38
In the earlier chapter, I had explained the different theories of capital structure. Choosing an
appropriate capital structure is crucial to achieving the maximum return on investment. In real
life, the capital structure does matter and firms have do have a target debt ratio. The following
is the analysis of debt ratio in Banglalink
Debt Ratio
Figure 17
Debt ratio is a solvency ratio that measures a firm's total liabilities as a percentage of its total
assets. In a sense, the debt ratio shows a company's ability to pay off its liabilities with its
assets. In other words, this shows how many assets the company must sell in order to pay off all
of its liabilities.
This ratio measures the financial leverage of a company. Companies with higher levels of
liabilities compared with assets are considered highly leveraged and more risky for lenders. This
helps investors and creditors analysis the overall debt burden on the company as well as the
firm's ability to pay off the debt in future, uncertain economic times.
As the investment is increasing for Banglalink every year, they are becoming more and more
dependent on external funds. This is due to the fact that debt is being obtained cheaply. The
2010 2011 2012 2013 2014
Debt to Assets 0.22 0.31 0.32 0.32 0.59
0.00
0.10
0.20
0.30
0.40
0.50
0.60
0.70
Rat
io
Year
Debt to Assets

39
company has increased its reliance debt drastically as that can be seen by an increase in debt to
59% of total assets in 2014. The massive change had occurred due to the $300 million bonds
that were issued.
Increase in Cash Flows
Earlier it was shown that in the presence of corporate taxes, the firm’s value is positively
related to its debt. The value is maximized for the capital structure paying the least in taxes.
This is because more earnings is left after paying of interest. If the earnings increases, then the
value of firm also increases. This is because the after-tax earnings are used to find the value of
the firm by discounted cash flow (DCF) method. Later in the section I will show how the value of
the firm has enhanced due to issuance of more debt. Interest is tax deductible, hence lesser
taxes are paid by highly leveraged firms. The following example shows how the value of
Banglalink can be enhanced. The information is from the year of 2014:-
No Debt Debt ratio = 0.59
EBITDA 17,301,000,000 17,301,000,000
Interest (@ 9.5%) 0 5,186,018,175
Earnings Before Taxes 17,301,000,000 12,114,981,825
Taxes (EBT * 45%) 7,785,450,000 5,451,741,821
Earnings After taxes 9,515,550,000 6,663,240,004
Total cash flow (stockholders and bondholders) 9,515,550,000 11,849,258,179
Table 1
In the no debt case, we can see that the firm pays a large portion of its operating profit as taxes.
This is because no interest is paid before deducting the taxes. In the case of debt, we can see
that the total cash flow to both claimants (equity holders and bondholders) have increased by
Tk. 2,333,708,179. This is because the government receives Tk. 2,333,708,179 less in the form
of taxes. What this capital structure does is that, it essentially ‘transfers’ wealth from the
government to the owners of the firm.

40
The above calculations are based on the current capital structure of 2014. The debt ratio in
2014 was 0.59, which means debt amounted to a total of Tk. 54,589,665,000. Now, we will
increase the debt ratio little bit, to show how the value of the firm can be maximized further.
Debt Ratio = 0.59 Debt Ratio = 0.80
EBITDA 17,301,000,000 17,301,000,000
Interest (@ 9.5%) 5,186,018,175 7,024,587,128
Earnings Before Taxes 12,114,981,825 10,276,412,872
Taxes (EBT * 45%) 5,451,741,821 4,624,385,792
Earnings After taxes 6,663,240,004 5,652,027,080
Total cash flow (stockholders and bondholders) 11,849,258,179 12,676,614,208
Table 2
Here, the debt is increased to 80% which is now Tk. 73,943,022,400. It leads to a further
decrease in taxes to the government which again translates to higher gains for the owners of
the firm. The tax bill is now lower by Tk. 827,356,029. The total cash flow also increases by the
same amount which again enhances the value of the firm. Now I proven how the firm value can
enhanced. The firm values for each year will now be determined step by step.
Calculation of Discount Rate
Finding the cost of capital is the very step to find out the value of a firm. I will apply the MM
proposition I (taxes) theory to show the value of Banglalink. The cost of capital is the minimum
rate of return that must be given to the investors of the firm. I will find out the cost of capital by
the use of the Capital Asset Pricing Model (CAPM). The CAPM is one of the most crucial
concepts of modern finance. Throughout the study, I will refer to the cost of capital as ‘discount
rate’, as they are synonymous terms.

41
The following are the variables used for CAPM calculation for the period of 5 years from 2010
to 2014:-
2010 2011 2012 2013 2014
RF 11.04% 12.10% 13.19% 12.20% 13.45%
RM 15.00% 15.80% 17.00% 18.20% 18.80%
(RM - RF) 3.96% 3.70% 3.81% 6.00% 5.35%
Cov(RB, RM) 0.002151 0.010248 0.009775 0.011094 0.010951
Var(RM) 0.005884 0.016109 0.019344 0.024767 0.022709
0.37 0.64 0.51 0.45 0.48
RS 12.49% 14.45% 15.12% 14.89% 16.03%
RB 13.50% 13.50% 13.50% 13.50% 13.50%
Table 3
RF – This is the rate that can be availed by the investors if they invest in the government bonds
or T-bills. As the government has the supreme power to issue bills and control the money
supply, they can guarantee the bills as virtually riskless. The investors will demand an excess
return above this particular rate. It will also be used to find out the equity risk premium.
RM – This is the return that investors expected from the other competitors in the telecom
industry. It is the return on the market portfolio. Initially, it was difficult to get data for this
particular variable as there aren’t many listed telecom firms in the stock market.
Grameenphone is the only listed firm from the telecom industry. The returns of Teletalk was
also considered as a proxy to find the best possible value of market return.
Market Risk Premium (RM – RF) – This is simply the extra return that investors will demand
above the risk-free return on treasury bonds. This is also known as excess return. Investors will
demand excess return to compensate for the risk that they are willing to take by investing in
the firm.
Covariance – It is the variance of the returns between Banglalink and the other market players.
Variance – The variance measures the variability of returns between different states of the
world in the market portfolio.
42
Beta () – This variable shows how Banglalink’s return will behave relative to the rest of the
market. More specifically it shows how the return moves in response to actual return on the
market. For example, if the beta is 1, then Banglalink’s change in return will be exactly the same
as the market. If the beta is 0, then there is no correlation. But usually, that is not the case
because the market has similar firms like Banglalink.
RS – The discount rate was finally determined using the CAPM method. This rate will be used to
discount the cash flows of Banglalink.
RB – The interest rate on debt was taken as same for all the years. The reason is that the
composition of short term and long term debt couldn’t be identified.
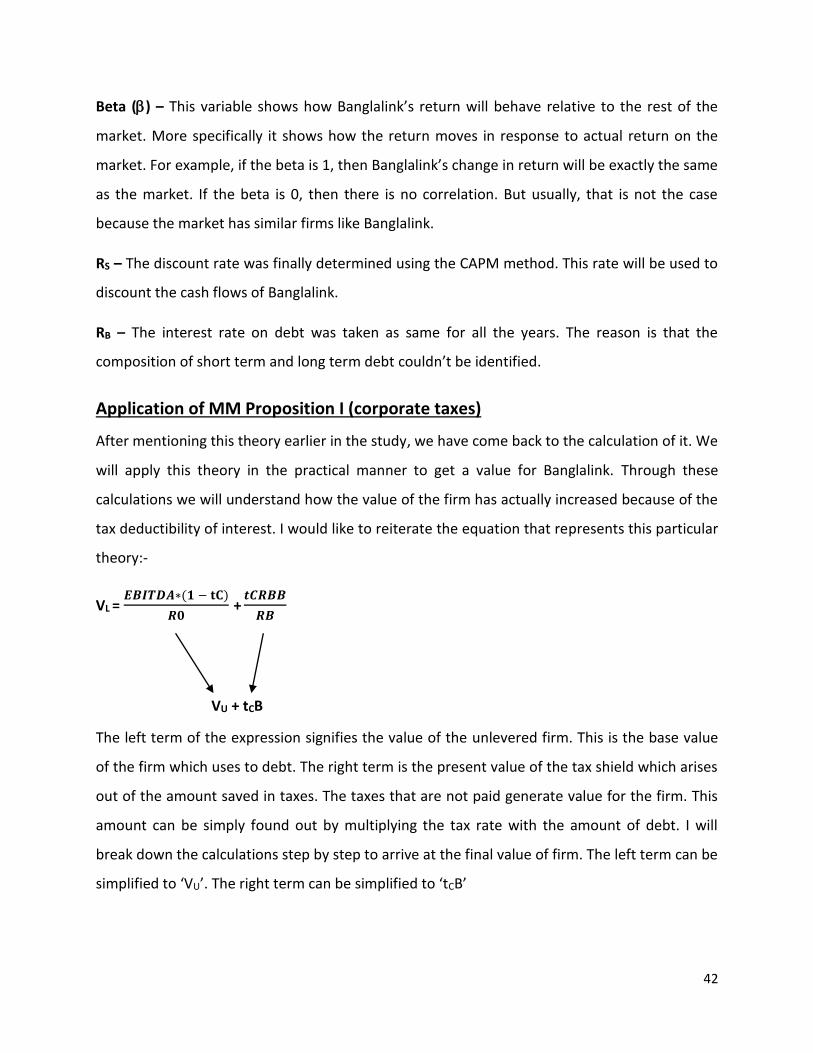
Application of MM Proposition I (corporate taxes)
After mentioning this theory earlier in the study, we have come back to the calculation of it. We
will apply this theory in the practical manner to get a value for Banglalink. Through these
calculations we will understand how the value of the firm has actually increased because of the
tax deductibility of interest. I would like to reiterate the equation that represents this particular
theory:-
VL = 𝑬𝑩𝑰𝑻𝑫𝑨∗(𝟏 − 𝐭𝐂)
𝑹𝟎 +
𝒕𝑪𝑹𝑩𝑩
𝑹𝑩
VU + tCB
The left term of the expression signifies the value of the unlevered firm. This is the base value
of the firm which uses to debt. The right term is the present value of the tax shield which arises
out of the amount saved in taxes. The taxes that are not paid generate value for the firm. This
amount can be simply found out by multiplying the tax rate with the amount of debt. I will
break down the calculations step by step to arrive at the final value of firm. The left term can be
simplified to ‘VU’. The right term can be simplified to ‘tCB’

43
Value of Unlevered firm
The EBITDA is the first step to finding the value of the firm. The EBITDA is easily found from the
financial statements. The EBITDA has to be deducted with taxes. After deducting the taxes the
EBITDA will change to the after-tax cash flows for the firm. The following table contains the
values:-
Values displayed in ‘000 (thousands)
2010 2011 2012 2013 2014
EBITDA 9,895,398 12,310,675 15,700,000 14,600,000 17,900,000
EBITDA x (1 - tC) 5,442,468 6,770,871 8,635,000 8,030,000 9,845,000
Table 4
Now the value will be discounted using the rates we found earlier. The value of an unlevered
firm is the present value of EBITDA x (1 – tC):-
VU = 𝐄𝐁𝐈𝐓𝐃𝐀 ∗ (𝟏 − 𝐭𝐂)
𝐑𝟎
The results obtained from the equation are given below:- Values displayed in ‘000 (thousands)
2010 2011 2012 2013 2014
EBITDA x (1 - tC) 5,442,469 6,770,871 8,635,000 8,030,000 9,845,000
R0 0.1249 0.1445 0.1512 0.1489 0.1603
VU 43,582,065 46,844,651 57,127,504 53,936,973 61,416,371
Table 5
Leverage increases the value of the firm by the tax shield, which is tCB for perpetual debt. Thus
we merely add this tax shield to the value of the unlevered firm to get the value of the levered
firm. The following is the equation of levered firm value:
VL = 𝐄𝐁𝐈𝐓𝐃𝐀∗(𝟏 − 𝐭𝐂)
𝐑𝟎 +
𝐭𝐂𝐑𝐁𝐁
𝐑𝐁
= VU + tCB

44
Present Value of Tax shield
Interest is tax deductible, hence the debt is advantageous to the firm. If debt increases, then
the interest expense will also increase. The present value of the firm will increase with the
interest.
Interest = RB x B
The taxable income will now be RBB less because of the debt. This amount will escape the
taxation bracket as it is wiped away from the operating profit due to interest payments. Now
because the corporate tax rate is tC. the reduction in corporate taxes is now:
Reduction in taxes = tC x RB x B
That is, whatever the taxes that a firm would pay each year without debt, the firm will pay tCRBB
less with a debt of B. The above equation is known as the tax shield. The value of this tax shield
can be found out by discounting the tax shield at the cost of debt, RB. Assuming the cash flows
are perpetual, the present value of the tax shield is:-
𝐭𝐂𝐑𝐁𝐁
𝐑𝐁 = tCB
The value of the tax shield for each year is as follows:-
Values displayed in ‘000 (thousands)
2010 2011 2012 2013 2014
Debt (B) 16,908,879 29,590,581 29,713,048 30,909,923 54,589,665
RB 0.1350 0.1350 0.1350 0.1350 0.1350
Interest (RB*B) 2,282,699 3,994,728 4,011,261 4,172,840 7,369,605
tC 45% 45% 45% 45% 45%
Tax Shield (tC*RB*B) 1,027,214 1,797,628 1,805,068 1,877,778 3,316,322
PV of Tax Shield 7,608,996 13,315,761 13,370,872 13,909,465 24,565,349
Table 6

45
If the tax shield is simply added to the value of the unlevered firm, then we can obtain the value
of the levered firm:-
Values displayed in ‘000 (thousands)
VU tCB VU + tCB
2010 43,582,065 7,608,996 51,191,061
2011 46,844,651 13,315,761 60,160,413
2012 57,127,504 13,370,872 70,498,376
2013 53,936,973 13,909,465 67,846,438
2014 61,416,371 24,565,349 85,981,720
Table 7
Figure 18
51,191,061,026
60,160,412,938
70,498,376,02267,846,438,202
85,981,719,987
0
10,000,000,000
20,000,000,000
30,000,000,000
40,000,000,000
50,000,000,000
60,000,000,000
70,000,000,000
80,000,000,000
90,000,000,000
100,000,000,000
2010 2011 2012 2013 2014
VU + tCB
Year
Value of Firm

46
Chapter 5 – Financing Options & Risk Analysis

47
Financing options of Banglalink
Banglalink is a fast growing telecom company which needs substantial amount of money for
CAPEX (Capital Expenditure). The money has to be sourced for capital expenditure like payment
for LC of network equipment, maintenance of network equipment and many more. The fact is
Banglalink does not have enough current assets to finance its CAPEX and it does not have
enough capacity to pay for the capital expenditure. For this reason, different financing options
have to be sought to pay for capital expenditure. The treasury unit works consistently to
finance so that the company can have its pace towards growth. Usually, there are two types of
financing methods available for treasury when it faces cash deficiency. The company finances
the projects either through short term liability or through long term liability. There are different
types of short term and long term liability which are described below:
Short Term Financing
The liabilities which are taken for a period of less than a year are known as short term liability.
There are different types of short term liabilities that the company takes for financing and
those are described below:-
Bank Loans – Bank loans are the widely used short-term loans that Banglalink uses. In most of
the cases, whenever there is a shortfall of money Banglalink goes for short-term bank loans. It
takes the bank loans from the reputed multinational and local banks based on the negotiation
with the banks. The loans are usually taken for a period of 90 days and in most of the cases at
the end of 90th day the loans are taken again after settling the principal and interest. This is
known as revolving loan. The bank loans are taken without pledging any collateral; a letter of
guarantee from the parent company stating the parent company will repay if Banglalink fails to
pay back the principal and interest charged on the loan. This is an easy way to get a bank loan
without any collateral. The following graph shows the percentage of current liabilities as of
total debt. The total amount of current liabilities consists of bank loans, LC’s and also bridge
financing.

48
Figure 19
The current liabilities are the least in 2014 out of all the previous years. A falling trend can be
noticed from the graph. It shows that the firm is decreasing its reliance on short term debt and
relying more on long term debt to finance operations. In 2010, a large chunk of the current
liabilities used to occupy the debt. This is advantageous for the firm, as the interest rates on
short term debt are much higher.
Figure 20
2010 2011 2012 2013 2014
Current Liabilities 63.66% 56.69% 56.95% 59.63% 37.43%
Percentage of Total Debt (%)
Year
Current Liabilities
2010 2011 2012 2013 2014
Current Ratio 0.18 0.13 0.19 0.11 0.18
Ratio
Year
Current Ratio

49
The current ratio is a financial ratio that measures whether or not a firm has enough resources
to pay its debts over the next 12 months. It compares a firm's current assets to its current
liabilities. The fact that the current liabilities is decreasing is a good sign because it means that
existing current assets will be enough to pay off the current liabilities. If one looks closely at the
current ratio, it can be noticed that the current ratio has increased due to decrease in burden of
current liabilities.
Bridge Financing – This is a special type of financing option that Banglalink has with standard
chartered bank. Every bank can only provide a certain amount loan to a corporate. If Banglalink
exceeds the facility limit with standard chartered bank, then it can go for bridge financing. In
this type of financing the parent company of Banglalink makes a FDR with standard chartered
bank. Standard chartered bank takes the prior approval from Bangladesh Bank. When it gets
the approval it provides Banglalink 90% of the FDR amount yielded by the parent of Banglalink,
using the FDR as a lien.
Letter of Credit (LC) – As it was described before, after opening a LC; from the day of shipment
Banglalink gets 360 days’ time to make the payment for that LC. As the maturity is less than a
year it also works like a short term financing option.

50
Long Term Financing
The liabilities which are taken for a period of more than a year are known as long term liability
and the different types of long term liability that the company uses are given.
Long Term Liability – Figure 21 shows the long term debt as a percentage of the total debt.
Figure 21
The long term debt increase is contributing to the debt burden of the firm. It takes heavy toll on
the firm and also increases the default risk. It may hurt the firm the company by increasing the
chances of bankruptcy.
Bank Loans – The bank loans that have a maturity period of more than a year is considered to
be long term liability for Banglalink. Banglalink gets this types of loan from the foreign financial
institutions (i.e. Hermes, DFI). These foreign institutions work as intermediary between
Banglalink and foreign financial institutions. They form a syndicate and provide loan to
Banglalink.
Local Bond – Banglalink had procured substantial amount of money through issuing local
bonds. The local bonds were called back in the mid of May as the company issued international
2010 2011 2012 2013 2014
Long Term Liability 29.98% 35.36% 35.04% 32.94% 62.52%
Percentage of Total Debt (%)
Year
Long Term Liability

51
bond. Terminating the local bond was a condition from the government regulatory bodies to
issue international bond.
International Bond – The treasury team of Banglalink has recently issued $300 million
international bond to restructure the company’s existing debt. Banglalink is the first
Bangladeshi corporate to issue international bonds for 8.625% coupon and 8.875% YTM. In
terms of geographic distribution, 64% of the bonds were sold in Asia, 29% in Europe and 7% in
the US. This bond has a maturity of 5 years. Money raised from selling this bond will be used for
two purposes; one is to pay off existing debt obligation and the other one is to support 3g
expansionary project that Banglalink has taken.
Shareholder Loan – The shareholders of Banglalink also provide credit to Banglalink. The parent
is not providing equity in its operation here rather it provides loan to Banglalink as providing
debt to the company benefits the parent more than by providing it equity.
Figure 22
2010 2011 2012 2013 2014
Inter-company Payable 6.36% 7.95% 8.01% 7.43% 0.04%
Percentage of Total Debt (%)
Year
Inter-company Payables

52
The shareholders from the parent company lend money to Banglalink in order to decrease the
interest burden. As is evident from the graph, Banglalink has decreased its reliance on
shareholder debt in 2014.
Lease Financing – Banglalink has car lease facility with commercial bank of Ceylon and IDLC
Finance Ltd. The vehicles of Banglalink are taken as lease and the mentioned financial
institutions facilitate the process.
Huawei Factoring – Banglalink has another financing facility with Huawei which is the provider
of capital goods. Whenever Banglalink makes a deal with Huawei to procure capital equipment
from it, there is a credit term which is mentioned in the agreement. For example, if a credit
term with Huawei states net 180(n/180), Banglalink is bound to settle the payable to Huawei
within 180 days. However, Huawei provides a facility to Banglalink using which Banglalink can
exceed the credit period, but it has to pay interest on the money outstanding amount after the
period of 180 days has elapsed.
Risk Analysis
Every large firm faces risks that may affect the business either in the short term or the long
term. The risks that Banglalink faces can be divided into the following categories:-
Financial risk
The possibility that shareholders will lose money when they invest in a company that has debt,
if the company's cash flow proves inadequate to meet its financial obligations. When a
company uses debt financing, its creditors will be repaid before its shareholders if the company
becomes insolvent. Financial risk also refers to the possibility of a corporation or government
defaulting on its bonds, which would cause those bondholders to lose money.
We will measure the financial risk with the help of ‘Degree of Financial Leverage’. The degree of
financial leverage (DFL) is the leverage ratio that sums up the effect of an amount of financial
leverage on the earning per share of a company. The degree of financial leverage or DFL makes

53
use of fixed cost to provide finance to the firm and also includes the expenses before interest
and taxes. If the Degree of Financial Leverage is high, the Earnings per Share or EPS would be
more unpredictable while all other factors would remain the same. The degree of financial
leverage or DFL helps in calculating the comparative change in net income caused by a change
in the capital structure of business. This ratio would help in determining the fate of net income
of the business. This ratio also helps in determining the suitable financial leverage which is to
be used to achieve the business goal. The higher the leverage of the company, the more risk it
has, and a business should try and balance it as leverage is similar to having a debt.
The DFL can be calculated with the following formula:
DFL = % 𝐂𝐡𝐚𝐧𝐠𝐞 𝐢𝐧 𝐄𝐏𝐒
% 𝐂𝐡𝐚𝐧𝐠𝐞 𝐢𝐧 𝐄𝐁𝐈𝐓
Figure 23
Compliance risk
Compliance risk is defined as the risk of legal sanctions, material financial loss, or loss to
reputation the firm may suffer as a result of its failure to comply with laws, its own regulations,
code of conduct, and standards of best/good practice. Sometimes it’s also referred to as
integrity risk, because a firm’s reputation is closely connected with its adherence to principles
of integrity and fair dealing.
2010 2011 2012 2013 2014
Degree of FL 3.09 4.02 1.96 3.71 1.28
Ratio
Year
Degree of Financial Leverage

54
Operational risk
Operational risk is a form of risk that summarizes the risks a company or firm undertakes when
it attempts to operate within a given field or industry. Operational risk is the risk that is not
inherent in financial, systematic or market-wide risk. It is the risk remaining after
determining financing and systematic risk, and includes risks resulting from breakdowns in
internal procedures, people and systems.
We will measure the operational risk using the ‘Degree of Operating Leverage’. The Degree of
Operating Leverage (DOL) is the leverage ratio that sums up the effect of an amount of
operating leverage on the company’s earnings before interests and taxes (EBIT). Operating
Leverage takes into account the proportion of fixed costs to variable costs in the operations of a
business. If the degree of operating leverage is high, it means that the earnings before interest
and taxes would be unpredictable for the company, even if all the other factors remain the
same. If the operating leverage is high, then a smallest percentage change in sales can increase
the net operating income. The net operating income is the amount of income that is left after
payments of fixed cost are made, regardless of how much sales has been made. Since the DOL
helps in determining how the change in sales volume would affect the profits of the company, it
is important to ascertain the value of degree of operating leverage in order to minimize the
losses to the company.
The formula used for determining the DOL is as follows:
DOL = % 𝐂𝐡𝐚𝐧𝐠𝐞 𝐢𝐧 𝐄𝐁𝐈𝐓
% 𝐂𝐡𝐚𝐧𝐠𝐞 𝐢𝐧 𝐒𝐚𝐥𝐞𝐬

55
Figure 24
Strategic risk
Strategic risks can be defined as the uncertainties and untapped opportunities embedded in
your strategic intent and how well they are executed. As such, they are key matters for the
board and impinge on the whole business, rather than just an isolated unit. Strategic risk
management is the organization’s response to these uncertainties and opportunities. It
involves a clear understanding of corporate strategy, the risks in adopting it and the risks in
executing it. These risks may be triggered from inside or outside your organization.
DuPont Analysis
DuPont Analysis is an expression which breaks ROE (return on equity) into three parts. The
name comes from the DuPont Corporation that started using this formula in the 1920s. DuPont
explosives salesman Donaldson Brown invented this formula in an internal efficiency report in
1912.
The ratios of ROA and ROE are involved here. The difference between these two profitability
measures reflects the use of debt financing or financial leverage. The deep down analysis of the
ROE helps to explain the factors driving the ROE. The following is a breakdown of ROE:-
Return on Equity = 𝐍𝐞𝐭 𝐈𝐧𝐜𝐨𝐦𝐞
𝐓𝐨𝐭𝐚𝐥 𝐄𝐪𝐮𝐢𝐭𝐲
2010 2011 2012 2013 2014
Degree of OL 0.50 1.28 1.39 0.59 2.45
Ratio
Year
Degree of Operating Leverage

56
We can now split the ROE by multiplying the top and bottom by Assets.
Return on Equity = 𝐍𝐞𝐭 𝐈𝐧𝐜𝐨𝐦𝐞
𝐓𝐨𝐭𝐚𝐥 𝐄𝐪𝐮𝐢𝐭𝐲 =
𝐍𝐞𝐭 𝐈𝐧𝐜𝐨𝐦𝐞
𝐓𝐨𝐭𝐚𝐥 𝐄𝐪𝐮𝐢𝐭𝐲 x
𝐀𝐬𝐬𝐞𝐭𝐬
𝐀𝐬𝐬𝐞𝐭𝐬
= 𝐍𝐞𝐭 𝐈𝐧𝐜𝐨𝐦𝐞
𝐀𝐬𝐬𝐞𝐭𝐬 x
𝐀𝐬𝐬𝐞𝐭𝐬
𝐓𝐨𝐭𝐚𝐥 𝐄𝐪𝐮𝐢𝐭𝐲
The ROE is now expressed as a product of two other ratios – ROA and the equity multiplier.
ROE = ROA x Equity Multiplier
We can further decompose ROE by multiplying the top and bottom by total sales:-
ROE = 𝐒𝐚𝐥𝐞𝐬
𝐒𝐚𝐥𝐞𝐬 x
𝐍𝐞𝐭 𝐈𝐧𝐜𝐨𝐦𝐞
𝐀𝐬𝐬𝐞𝐭𝐬 x
𝐀𝐬𝐬𝐞𝐭𝐬
𝐓𝐨𝐭𝐚𝐥 𝐄𝐪𝐮𝐢𝐭𝐲
After rearranging, the ROE looks like this:-
ROE = 𝐍𝐞𝐭 𝐈𝐧𝐜𝐨𝐦𝐞
𝐒𝐚𝐥𝐞𝐬 x
𝐒𝐚𝐥𝐞𝐬
𝐀𝐬𝐬𝐞𝐭𝐬 x
𝐀𝐬𝐬𝐞𝐭𝐬
𝐓𝐨𝐭𝐚𝐥 𝐄𝐪𝐮𝐢𝐭𝐲
= Profit margin x Total asset turnover x Equity multiplier
What we have now done is to partition ROA into its two component parts, profit margin and
total asset turnover. The final expression is called the DuPont identity.
Year Profit Margin Total Asset Turnover Equity Multiplier ROE
2010 -8.95% 0.42 1.75 -6.63%
2011 -18.49% 0.40 2.22 -16.30%
2012 -7.82% 0.49 1.96 -7.45%
2013 -11.15% 0.41 2.05 -9.36%
2014 -7.26% 0.47 1.94 -6.66%
Table 8
The DuPont identity tells us that ROE is affected by three things:
Operating Efficiency (as measured by profit margin).

57
Asset Use efficiency (as measured by total asset turnover).
Financial Leverage (as measured by the equity multiplier).
Weakness in either operating or asset use efficiency (or both) will show up in a diminishing
return on assets, which will translate into lower ROE. In this situation, we can see that
Banglalink has been experiencing negative profit margin for the past 5 years. As the profit
margin itself is negative, the asset turnover or the equity multiplier is of no help. Even if the
latter 2 metrics were good, the ROE would still turn out to be negative.

58
Chapter 6 – Conclusion

59
Conclusion
I have had an experience of a lifetime at this company. Although this was just an internship, I
was able to learn many things. I enjoyed a lot while working in my team. I was really privileged
to be a part of the Banglalink family. My line manager was such that he had always kept his
partners entertained. Production Support plays a vital role in the ND department and I have
tried to show the functions as vividly as possible. But it’s not possible to learn everything within
3 months. However, the fullest measure was taken to make this report fruitful and informative.
Although the financial analysis does not provide an outstanding image of the organization, the
company has very good potential because it has got highly skilled people and they know better
than anyone how to take this organization in a better position. The company is changing with
the trends in the technology landscape. The company is now striving to transform to a digital
services company. I believe that Banglalink will grow further and it surely has the potential to
become a market leader.
Recommendation
Banglalink should find the optimal network locations where they can place the towers. The
investment in towers should be selected carefully so that it benefits the customers most.
The firm must make use of the capital structure policies to create value for the
shareholders. They must balance the real world factors with the theories of MM to create
an optimal capital structure.
Being a technology based organization; Banglalink should create a benchmark in using latest
software that others will follow. It needs to transform its ERP system to SAP from Oracle.
Banglalink should increase its debt ratio even further to take advantage of lesser taxes.

60
References Brigham F. and Gapenski C. (eds). (2013). Fundamentals of Financial Management. United
States: The Dryden Press.
Slideshare [online]. (2016). Available from: <http://www.slideshare.net/jissahmed/a-
presentation-on-promotional-tools-of-banglalink> [Accessed 25th April, 2016]
Banglalink [online]. (2016). Available from: <http://www.banglalink.com.bd/> [Accessed 22nd
April, 2016]
VimpelCom [online]. (2016). Available from: <http://www.vimpelcom.com/#Profile/History/>
[Accessed 26th April, 2016]
Wikipedia [online]. (2016). Available from: <http://en.wikipedia.org/wiki/VimpelCom_Ltd.>.
[Accessed 2nd May, 2016]