strategy to increase the chery qq sales
TRANSCRIPT
STRATEGY TO INCREASE THE CHERY QQ SALES
By
Divanti Oenang 011200700006
A thesis presented to the Faculty of Economics President University
in partial fulfillment of the requirements for Bachelor Degree in Economics Major in Management
August 2010
PANEL OF EXAMINERS
APPROVAL SHEET
The Panel of Examiners declare that the thesis entitled “Strategy To
Increase The Chery QQ Sales” that was submitted by Divanti Oenang
majoring in International Business from the faculty of Economy was
assessed and approved to have passed the Oral Examinations on 20
September 2010
Andreas Yumarma
Chairman
Ir. Muhril Ardiansyah, M.Sc., Ph.D. Panel 1
nnnnnn Panel 2

DECLARATION OF ORIGINALITY
I declare that this thesis, entitled “Strategy to Increase the Chery QQ
Sales” is, to the best of my knowledge and belief, an original piece of
work that has not been submitted, either in whole or in part, to another
university to obtain a degree.
Cikarang, Indonesia, 31 August 2010
Divanti Oenang

ABSTRACT
The research is conducted to discover the dominant variable of Marketing Mix that
makes the sales of Chery QQ decreasing. The research is very important because it
will investigate and give clear explanation of what aspects influence the decreasing
sales of Chery QQ.
Quantitative research is applied so that it can be analyzed through mathematical
expression; and then it can used to identify the study in this research. Questionnaire
is used to collect all the necessary data. It is made with five answers. There are 20
questions in the questionnaire. As the respondents are the consumer of Chery QQ. 74
people as the sample they were chosen using purposive convenience sampling
method. The population, which is selected consumer, in this study is consumer of
Chery QQ in North Jakarta. Total consumer is 242 people.
The result of the research is the product variables as the dominant factor that cause of
the decreasing of Chery QQ.

ACKNOWLEDGMENT
Thanks god for the blessing and guidance that you have given to me, to finish my
thesis entitled “STRATEGY TO INCREASE CHERY QQ SALES”. This thesis is
one of requirements to accomplish Bachelor Degree for Faculty of Economics in
President University. In addition, the writing of this thesis has been supported by
many people who have directly involved both directly and indirectly help the writer
to finish this thesis. I would like to give my special thanks to:
My Beloved Dad, Mom you are the best parents in this world, thanks for everything
that you gave to me, especially for your support and advising me in doing this thesis.
My lovely Sisters and brother, thanks for motivation and supporting me in doing this
thesis
My thesis adviser Mr. Ir. Muhril Ardiansyah, M.Sc., Ph.D. for the guidance and
sugesstion along the time doing this thesis from the beginning till the end.
Mr. Ir. B.M.A.S Anaconda Bangkara, MT, for his knowledgeable information,
advices, suggestion, great discussion for my thesis.
My friend, my brother, and my best Tofan Taruna Anindita, for his advices,
support, and patient in helping me finish this thesis.
Power Ranger (Cheche, Lady, Nindy, Bagas, Hana), thank you very much for the
togetherness in last 3 years. Hope this friendship will last forever.
All my F1 Dormate: Mba Nana, Friza, Ria, Icha, Anggi, thanks for your support.
All student batch 2007: Yopie, Faza, Andi, Vina, Felix, Hakim, Marcel, Haris, and
others that I cannot mention it one by one. Thanks for keep supporting each others.

Mr. Musetayin, thanks for your great advice and help, you’re my last savior.
My senior batch 2005, thanks for all your great advice and motivating me to do this
thesis
All Lecturer, thank you for your teach and share your knowledge to me.
To all people who can not I mentioned on this paper. Thank you for your support
1
CHAPTER I
INTRODUCTION
1.1. Background of the study Currently, the entire community has a rival in business. Producers must have a very
high creativity in order to survive in a competitive business. As we know that, the
economic development in today's business world very quickly. No exception is also
effected the growth in transportation vehicles such as motorcycles, cars, trucks, and
bus. In this case, the national transportation system has an important role in
supporting the national development by facilitating all aspects of people’s activities
socially as well as economically. It promotes the population mobility and flow of
goods and services from one region to another. Land transportation, as part of
national transportation system, has been played the most important role. It can be
observed that regions, which have good land transportation facilities generally, have
a better economic growth than others. Eventhough the global economics crisis attack
almost all the countries in this world, the demand of vehicles still high, especially in
Indonesia (Figure 1.1.). The global economics crisis also effect the oil price, in this
year the price is reach around $70-80 per barrel (source: mediaindonesia.com). Many
automotive manufacture are compete each other to create more affordable vehicles
that use less gasoline than other manufactures, this efficient vehicle are expected that
can be accepted in the market.

2
Figure 1.1. Statistic Data of Car Sales in Indonesia Source: Badan Pusat Statistik
In Indonesia car market, the strong competitions not only happen in the Multi
Purpose Vehicle (MPV) such as Toyota Innova, Isuzu Panther, and Honda CRV. But,
it also happens in the city car such as Karimun Estilo, Chery QQ, Hyundai Atoz, and
Kia Picanto. To merge in the market competition, every car manufacture must
prepare the best for their own product and also how to the market product. Prepare
the product can show with defining the marketing concept such as target market,
customer needs, intergrated marketing, and profits through the customer satisfaction.
Every car manufacture can maintain their market share not only with launching all
new products, but they can do a small change with the facility model and adding
some new accessories. Chery QQ first launched on September 2006, it is a city car
brand by Chery and it segmented in the low end class. During four years production,
Chery QQ already sold 2500 unit. PT. Indomobil Tbk through PT. Unicor Prima
0
2000000
4000000
6000000
8000000
10000000
12000000
2004 2005 2006 2007 2008
Uni
ts
Year
3
Motor launch Chery try to give an option to the market in city car segment. Actually,
In China, Chery was the first Chinese automobile maker to export its products, and as
of 2009 it remains the top exporter among Chinese automakers. Chery has received
the fourth position for automotive brands with the highest number of car sales.
Besides that, Chery also represents the largest vehicle exported in China (source:
wikipedia.com)
1.2. History of Chery QQ Chery was founded in 1997 to prop up the economy of Wuhu, a region of China that
has received little industrial development. Its first factory used machines and engine
technology purchased from Ford Europe for US$25 million. It began auto production
in 1999 using a licenced chassis from SEAT's Toledo. The company was an
illegitimate company under Chinese law of the time and had to be registered as a
"Car Parts Supplier." Thus, the company was not able to obtain a license to sell their
cars in all of China. In 2001, Shanghai Automotive Industry Corporation (SAIC)
bought a 20% stake in the company, allowing Chery to use SAIC's national retail
sales license. In 2001, Chery began exporting its cars to Syria, becoming China's first
car exporter. Chery also received its ISO-9001 certification. In September 2002,
Chery received its ISO/TS 16949 certification, the highest quality certification at the
time (source: chinacarforums.com).The Chery QQ is a city car produced by the
Chinese manufacturer Chery Automobile. It is a Completely Knock down (CKD) car,
their engine and materials are impoted from China. In Indonesia, Chery is marketed
by PT Unicor Prima Motor (UPM). PT Unicor Prima Motor began marketing the
Chery vehicles in Indonesia since September 2006. PT UPM is a subsidiary under the
banner of Indomobil Group, one of Indonesia's leading automotive industries. The
first Chery product that launched in Indonesia is the Chery QQ, which is a city car
vehicle. View to improved market opportunities, the event coincided with Indonesia
Motor Show in 2007, PT UPM launched Chery Tiggo, SUV 2000 cc. Today, UPM
has marketed two models Chery vehicles in Indonesia. Each year, PT UPM will add
4
a new model of Chery vehicles to be marketed in Indonesia. In addition to serving
the sales of Chery vehicles, PT UPM also committed to providing appropriate care
service, quick, and satisfying for their customers. Currently, Chery already has 23
outlets located on the island of Java, Bali, Sumatra, Kalimantan, and Sulawesi, where
21 outlets of which have been equipped with workshop facilities and spare parts. In
China, Chery occupies the fourth position for automobile brands with the highest
number of car sales. Chery Automobile Co. Ltd. as a principal Chery is listed as
state-owned enterprises in China.
1.2.1. Exterior The shape of the body is very stylish, soft, and cute. The exterior parts consist of
Front & Rear Fog Lamps, Rear Window Wiper, Front & Rear Bumper Sporty, Front
& Rear Body Kit, Side Visor, and Chrome Tail Pipe. Chery QQ is suitable for daily
use because of the body is very small. It has a smooth shape from front to back, and
its picture out the sense of movement. The design of the body is similar to Daewoo
Matiz and Chevrolet Spark.
1.2.2. Interior The car is known as “The little sprinter”, comes with power windows interior
features, automatic close window that activated when the cental door remote is
active. The key and remote are complemented by the Anti Theft System. The interior
of QQ is so simple. It has a power steering, auto close window, central lock, keyless
entry, electric miror, and radio type, fog lamp (front and rear), rear wiper, velg
standar, side skirt, rear spoiler, high mount stop lamp, 4 (four) safety belts, and audio
with CD/DVD/Radio/MP3 plus LCD Monitor 3 Inch. It is a four-door sedan which is
based on a platform self-developed by Chery. The QQ was designed to appeal the
younger buyers with is rounded body. The interior was particularly arranged for
comfort during a long journey.
5
1.2.3. Performance
At first, Chery QQ first launch only one model which is QQ 0.8, but today the QQ
0.8 replaced with the new QQ 1.1. The QQ 1.1 has 3 variant, types S, Type G
Elegant, and the last is Type G Sporty. All variant is in manual transmision. Chery
QQ 1.1 using engine SQR472, 16-valve, four-cylinder in line with electronic
multipoint injection system. The QQ have maximum power of 68hp at 6000 rpm,
while tourque is 90Nm at 3800rpm. PT Unicor Prima Motor claimed that QQ can
reach top speed until 140 km/h.
1.2.4. Safety & Comfort
The comfort consist of Power Steering, Front & Rear Power Windows, Electrically
Adjustable Outside Mirrors, Air Conditioning, Intergrated audio with Single CD,
DVD, MP3 & Radio, and Automatic Close Windows. While, the safety consist of
Child Safety Lock, Front & Rear Seat Belt, Central Door Locking, Intergrated
Remote Key with Anti Theft System, and Rear Window Deffoger.
1.3. Problem Identified
Chery QQ 0.8 first launched and promoted on 2006 and chery QQ 1.1 promoted on
Indonesia International Motor Show 2008. When first marketed, QQ’s not too
booming. It’s only sold 269 units in 2006. But, in 2007 the sales is increasing to
300% that reach 758 units. The sales continue to rise till 851 units on 2008. But, in
the year 2009 the sales of QQ is decline to 407 units (Figure 1.2). The decreasing of
the demand is affected because of many competitors in the same model of Chery QQ
such as Toyota Yaris, Kia Picanto, and Honda Jazz.

6
Figure 1.2. Statistic Data of Chery QQ Source: PT. Indomobil, Tbk
Based on the observations from researchers that analyze this problem, the researchers
found a very drastic decline in the year 2009.
1.4. Statement of the Problem
From the description above, there are objectives that the researcher wants to achieve
during the research. The objectives of this research can be expressed in answering the
following questions:
a. What is the important factor that influence the sales of chery QQ sales
b. What is the factor/s that needs to be improved to push the Chery QQ sales?
1.5. Research Objectives
The objectives of this research are to analyze the factors that affected the declining
demand of Chery QQ during 2009.
0
100
200
300
400
500
600
700
800
900
2006 2007 2008 2009
Uni
ts
Year

7
a. To know what the factors that influences the sales of Chery QQ based on
Marketing Mix
b. To know what is the factors need to be improved to push the sales of
Chery QQ.
1.6. Significant of Study
The significant of study are:
1.6.1. Researcher
The researcher will be able to know how important the Marketing Mix in sales of
some product. In this case are Chery QQ sales. To make some product we should
know how to analyze the marketing mix factors to compete in market.
1.6.2. The company
The company was able to solve their problem which is the sales of chery QQ is
decrease in 2009 using the analysis that has been done and published by the
researcher. This is hoped to help the company to have a good reputation and they can
increase their sales.
1.6.3. Academy
The academy will gain more knowledge and understanding about the problem from
this research. The theory studied by students will have different application in the
real working world. It would be better for the universities to have different approach
on teaching the theory by the combination with case study exercise, this will
definitedly helps students being trained to solve problems and not focused on
proposed theory without observing the real business condition.

8
1.7. Scope and Limitation of Study
Chery QQ will be the object of the observation and will be limited specifically in PT.
Unicor Prima Motor as the subsidiary under the banner of PT Indomobil Group as a
manufacture and distribution companies of Chery QQ in Indonesia. The study will
focus on analyzing the factors, process, and issues that related with Chery QQ. Since
the Chery QQ first launched on September 2006 until the end of 2009, the sales show
increasing demand significantly. In contrary, when entering year 2009, the demand is
declining. In this case, the researchers only take the data from 2006 until 2009 for
data analysis.
In addition, the study was limited to the information gathered from interview and the
researcher observation in PT. Indomobil Tbk from the sales department. Thus, the
study would analyze the data available in that department. And also researcher spread
the questionnaire to gather the information about the Marketing Mix of the Chery
QQ. The questionnaire consists of Marketing Mix which are Product, Place, Price
and Promotion.
1.8. Theoretical Framework To fulfill the needs of research, the writer elaborate the theory of research as below:
Figure 1.3. Theoretical Frameworks
Decreasing
Sales
Demand Theory Marketing Mix (4Ps)
Customer Satisfaction Customer Behavior
9
1.9. Assumptions and Hypothesis 1. Null Hypothesis
Ha:
Decreasing of Chery QQ sales is caused by product factor according to
Marketing Mix.
Alternate Hypothesis
Ho:
Decreasing of Chery QQ sales was not caused by the product factor according
to Marketing Mix.
2. Null Hypothesis
Ha:
Decreasing of Chery QQ sales is caused by price factor according to
Marketing Mix.
Alternate Hypothesis
Ho:
Decreasing of Chery QQ sales was not caused by the price factor according to
Marketing Mix.
3. Ha:
Decreasing of Chery QQ sales is caused by promotion factor according to
Marketing Mix.

10
Alternate Hypothesis
Ho:
Decreasing of Chery QQ sales was not caused by the promotion factor
according to Marketing Mix.
4. Ha:
Decreasing of Chery QQ sales is caused by place factor according to
Marketing Mix.
Alternate Hypothesis
Ho:
Decreasing of Chery QQ sales was not caused by the place factor according
to Marketing Mix.
1.10. Definition of Terms 1) Motor Vehicles are any kind of vehicles motorized by machine in those
vehicles. Usualy used for carrying peoples and goods on roads except those
vehicles moved along a railway line.
2) Passenger Cars are motor vehicles which have seats for more than eight
passengers, not included the driver. It can be with or without the boot
3) Buses are passengers cars which have seats for more than eight passengers,
not included the driver. It can be with or without the boot.
4) Trucks are motor vehicles to carry goods other than passenger cars, buses,
and motorcycles.

11
5) Motorcycles are any kind of two wheeled motor vehicles.
6) Marketing mix (4Ps) is the set of controllable tactical marketing tools-
Product, Place, Price, and Promotion- that the firm blends to produce the
response it wants in the target market. (Kolter & Aramstrong, 2005)
12
CHAPTER II
LITERATURE REVIEW
This chapter is about the literature used in this thesis to provide a clear
background or theoretical grounding to the research.
2.1. Marketing Kotler and Amstrong (2005) define marketing as the process by which companies
create value for customers and build strong customer relationship in order to capture
value from customer in return.
In addition, McDaniel, Lamb, and Hair (2006) describe, marketing is an
organizational function and a set of processes for creating, communicating, and
delivering value to customers and for managing customer relationships in ways that
benefit the organization and its stakeholders.
The more complete explanation about marketing is defined by John A. Howard of
Columbia University in 1973, which is the process of identifying customer needs,
conceptualizing those needs in terms of an organization capacity to produce,
communicating that conceptualization to the appropriate laws of power in the
organization, conceptualizing the consequent output in terms of the customer needs
earlier identified, and communicating those conceptualization to customers (Ries and
Trout, 2006).
In their study, Kotler and Amstrong (2005) develop the simple five step model of the
marketing process. Conversely, McDaniel et all (2006) classify four competing
philosophies that strongly influence an organization’s marketing activities.
The figure below shows the simple five steps model of the marketing process
developed by Kotler and Amstrong (2005). The marketing process consists of

13
creating value for customer and building relationship with customer, and then
capturing values form customers. To create value and build a relationship, company
should understand its target market, then designing a strategy and marketing
programs that attract customers, so that the relation can be built through delighting
customers. When the relationship is established, company can capture values such as
profits and loyalty from customers.
This figure show the model of the marketing process
---------------------------------------------------
Figure 2.1. Simple Model of The Marketing Process Source: Pearson, 2005
Understand the market place and customer needs and wants
Design a customer-driven marketing strategy
Capture value from customers to create profits and customer
quality
Build profitable relationships and create customer delight
Construct a marketing program that delivers superior value
Create value for customers and build
customer relationships
Capture value from customers in return

14
The first stage of the marketing process understands the target market’s needs and
wants. The core of marketing is human needs, which are the states of felt deprivation.
Human needs include basic physical needs for food, clothing, warmth, and safety;
social needs for belonging, and affection; and individual needs for knowledge and
self-expression.
Different from needs, wants are the form human needs take as they are shaped by
culture and individual personality. Wants are shaped by one’s society and are
described in terms of objects that will satisfy needs. Human wants that are backed by
buying power is called demand. People who have wants and resources will demand
products with benefits that add up to the most value and satisfaction.
Consumer needs and wants are fulfilled through a marketing offer, which is some
combination of products, services, information, or experiences offered to a market to
satisfy a need or want.
Marketing management is used to design a customer-driven marketing strategy. The
definition of marketing management by Kotler and Amstrong (2005) is the art and
science of choosing target markets and building profitable relationships with them by
creating, delivering, and communicating superior customer value. Marketing
management is devived into five alternative concepts, which are:
• The production concept
This idea holds that consumers will favor products that are available and
highly affordable.
• The product concept
The idea is that consumers will favor product that offers the most in quality,
performance, and features and that the organization should therefore devote
its energy to make continuous product improvements.

15
• The selling concept
This concept holds that consumers will not buy enough of the firm’s products
unless it undertakes a large-scale selling and promotion effort.
• The marketing concept
It is the marketing management philosophy that holds that achieving
organizational goals depends on knowing the needs and wants of target
markets and delivering that desired satisfactions better than competitors do.
• The societal marketing concept
This is a principle of enlightened marketing that holds that a company should
make good marketing decisions by considering consumer’s wants, the
company’s requiremments, consumer long-run interest, and society’s long run
interests.
The marketing program builds customer relationships by transforming the marketing
strategy into action. The program consists of the firm’s marketing mix, the set of
marketing tools the firm uses to implement its marketing strategy. Marketing mix
tools are classified into four groups, called four Ps: product, price, place, and
promotion. In delivering value, the firm must create a need-satisfying marketing offer
(product). Then, the firm decides how much it will charge for the offer (price) and
how it will make the offer available to target consumers (place). Last, the firm must
communicate with target customers about the offer and persuade them of its merits
(promotion).
2.2. Marketing Mix 4Ps Marketing mix is the sets of marketing tools that work together to achieve company
objectives. It is also known as 4 P’s. Cullition (1948) stated that a marketing decision
should be a result of something similar to a recipe. In addition, Borden (1953) stated
in his American Marketing Association presidential address, took the recipe idea one

16
step further and coined the term “marketing mix”. A prominent marketer, McCarthy,
proposed a 4 P classification in 1960, which has seen wide use. The marketing mix is
a bundle of variables including the product or service itself (its advantages); its
availability (the place where and when it is available, delivered or distributed); its
image (the way it is promoted) and, of course, the price which should be charged.
There are literally dozen of marketing – mix tools. McCharty (1996) stated that a
popularized a four – factor classification pof these tools called four Ps: Product,
Price, Place (i.e., distribution), and Promotion.
2.2.1. Product Product plays the most significant role in marketing mix. Pricing, promotion, and
place are also important. However, if the products and services company offer are not
potential customer’s desire and are willing to buy, it will not matter how low the
price is, how attractive the advertising is, or whether it has good and convenient
location.
Kotler and Armstrong (2004) define a product as anything that can be offered to a
market for consumption that might satisfy a want or need. They further define a
consumer product bought by final consumer for personal consumption. According to
Ferrell (2005), the product is the core of the marketing mix strategy in which retailers
can offer consumers symbolic and experiental attributes to differentiate products
from competitors. In addition, Borden (1984) define product is about quality, design,
features, brand name, and sizes.
Products that are marketed include physical goods, services, persons, places,
organizations, and ideas.
According to Tan, et.al (1999), in planning its market offering, the marketer needs to
think through five product levels (see Figure 2.2.).

17
Figure 2.2. Five Product Level Source: Kotler, Ang, Leong &Tan (1999)
1. The most fundamental level is the core benefit, namely the fundamental
service or benefit that the consumer is really buying.
2. At the second level, the marketer has to turn the core benefit into a basic
product, namely a basic version of the product.
3. At the third level, the marketer prepare an expected product, a set of
attributes and conditions that buyers normally expect and agree to when
they purchase this product..
4. At the fourth level, the marketer prepares an augmented product that
meets the consumer’s desires beyond expectations.
5. At the fifth stands the potential product, encompassing all the
augmentations and transformations that this product might ultimately
undergo in the future. While the augmented product describes what is
included in the product today, the potential product points to its
consumers and distinguish their offer.
5
4
3
2
1

18
Many attributes of a company’s products, including quality, brand name, packaging,
branding can affect consumer preferences. According to Gasperz (1997),
performances, features, reliability, conformance to specification, durability,
serviceability, aesthetic, and perceived quality are the product’s attribute that
expected by the consumers. Therefore, the product’s management plays an important
role to be success.
2.2.2. Price According to Tan, et.al (1999), the firm must decide where to position its
product on quality and price. A company can position its product at one of
seven levels:
1. Ultimate; there is an ultimate brand (the gold standard)
2. Luxury; just below the ultimate
3. Special Needs; brands that meet a special need
4. Middle; usually there are a large number of brands in the middle level
5. Ease / Convenience; brands that provide mainly the functional benefit
sought
6. Me Too, But Cheaper; cheaper brands that nevertheless perform
satisfactorily
7. Price Alone; brands whose only appeal is price.
Table 2.1.shows nine possible price-quality strategies. The diagonal strategies
1, 5, and 9 involve one firm offering a high-quality product at a high price,
another firm offering an average-quality product at an average price, and still
another firm offering a low-quality product at a low price. All three

19
competitors can coexist as long as the market consists of three groups of
buyers – those who insist on quality, those who insist on price, and those who
balance the two considerations.
Table 2.1. Nine Price / Quality Strategy
Price
High Medium Low
Pr
oduc
t Qua
lity
High 1. Premium
Strategy
2. High-value
Strategy
3. Super-value
Strategy
Medium 4. Overcharging
Strategy
5. Medium- value
Strategy
6. Good-value
Strategy
Low 7. Rip-off
Strategy
8. False economy
Strategy
9. Economy
Strategy
Source: Kotler (1999)
Positioning strategies 2, 3, and 6 represent ways to attack the diagonal
positions. Strategy 2 says, “Our product has the same high quality as product
1 but we charge less.” Strategy 3 says the same thing and offers an even
greater saving. If quality-sensitive consumers believe these competitors, they
will sensibly buy from them and save money (unless firm 1’s product has
acquired snob appeal).
Positioning strategies 4, 7, and 8 amount to overpricing the product relative to
its quality. The consumers will feel “taken” and will probably complain or
20
spread bad word-of-mouth about the company. These strategies should be
avoided by professional marketers.
Furthermore, the company first decides what it wants to accomplish with a
particular product. If the company has selected its target market and market
positioning carefully, then its marketing–mix strategy, including pricing, will
be fairly straightforward. The clearer a company’s objectives, the easier is it
to set proc. It can pursue any of six major objectives through its pricing:
a. Survival; Companies pursue survival as their major objective if plagued
with overcapacity, intense competition, or changing consumer wants. To
keep the plant operating and the inventories turning over, they will often
cut prices. Profit is less important than survival.
b. Maximum Current Profit; many companies try to set the price that will
maximize current profit.
c. Maximum Current Revenue; Some companies will set a price to
maximize sales revenue.
d. Maximum Sales Growth; Companies wanting to maximize unit sales
believe that a higher sales volume will lead to lower unit costs and higher
long-run profit.
e. Maximum Market Skimming; Many companies favor setting high
prices to “skim” the market.
f. Product Quality Leadership; A company might aim to be the product-
quality leader in the market and charge premium prices.
g. Other Pricing Objectives; Nonprofit and public organizations may adopt
other pricing objectives.
21
Price is a central to marketing where it is one of the four variables in the marketing
mix that business people use to develop a marketing plan. A number of studies have
found that consumers rely on price as an indicator of product quality. More
expensive the product is, better the quality it is. A later study found out that
consumers use price to evaluate the prestige of the product. Nowdays, many
consumers buy products more on the basis of price that other attributes (Peter and
Donnely, 2007).
2.2.3. Place Kotler and Armstrong (2005), define place or distribution as a set of interdependent
organizations involved in the process of making product available for use or
consumption by consumers. It is very important to select locations that are accessible
to the target market because the availability will affect the sales.
Marketing-channel decisions are among the most critical decisions facing
management. The company’s chosen channels intimately affect all the other
marketing decisions. The company’s pricing depends on whether it uses mass
merchandisers or high-quality boutiques. He firm’s sales force and advertising
decisions depend o how much training and motivation the dealers need. In addition,
the company’s channel decisions involve relatively long-term commitments to other
firms. Corey (1991) observed:
“A distribution system … is a key external resource. Normally it takes years to build, and it is not easily changed. It ranks in importance with key internal resources such as manufacturing, research, engineering, and field sales personnel and facilities. It represents a significant a significant corporate commitment to large numbers of independent companies whose business is distribution – and to the particular markets they serve. It represents, as well, a commitment to a set of policies and practices that constitute the basic fabric in which is woven an extensive set of long-term relationship.”
Most producers work with marketing intermediaries to bring their products to the
market. The marketing intermediaries make up a marketing channel (also called trade
22
channel or distribution channel). We will use Stern and El-Ansary’s (1996) definition
of marketing channels:
“Marketing channels are sets of interdependent organizations involved in the process of making a product or services available for use or consumption.”
The use of intermediaries largely boils down to their superior efficiency in making
goods widely spread and accessible to target markets. Marketing intermediaries,
through their contacts, experience, specialization, and scale of operation, offer the
firm more than it can usually achieve on its own. According to Stern and El-Ansary’s
(1996) definition of marketing channels:
“Intermediaries smooth the flow of goods and services … This procedure is necessary in order to bridge the discrepancy between the assortments of goods and service generated by the producer and the assortment demanded by the consumer. The discrepancy results from the fact that manufacturers typically produce a large quantity of a limited variety goods, whereas consumers usually desire only a limited quantity of a wide variety goods.”
Furthermore, companies must decide on how many intermediaries to use at each
channel level. According to Stroh (1978), three strategies are available:
• Exclusive Distribution; involves severely limiting the number of
intermediaries handling the company’s goods or services.
• Selective Distribution; involves the use of more than a few but less than
all of the intermediaries who are willing to carry a particular product.
• Intensive Distribution; is characterized by placing the goods or services
in as many outlets as possible. When the consumer requires a great deal of
location convenience, it is important to offer greater intensity of
distribution. This strategy is generally used for convenience items such as
instant noodles.
23
2.2.4. Promotion According to Cravens and Piercy (2006), the marketing communication mix
(also called the promotion mix) consists of five major tools:
1. Advertising: Any paid form of non personal presentation and promotion
of ideas, goods, or services by n identified sponsor.
2. Sales Promotion: Short-term incentives to encourage trial or purchase of
a product or service.
3. Public Relation and Publicity: Programs designed to promote and/or
protect a company’s image or its individual products.
4. Personal selling: Face-to-face interaction with one or more prospective
purchasers for the purpose of making presentation, answering questions,
and procuring orders.
5. Direct marketing: Use a mil, telephone, fax, e-mail, and other
nonpersonal contact tools to communicate with or solicit a direct response
from specific consumers and prospects.
The figure below is about the Marketing Mix that the researcher use to construct the questionnaire

24
Figure 2.3. The Marketing Mix
Source : Kotler
2.3. Customer Satisfaction According to Moven (2000), Customer satisfaction is defined as the overall attitude
regarding a good or service after its acquisition and use. Another argument from
Jerry and Peter (2005), customer satisfaction is defined as the degree to which a
products performance exceeds the consumer expectations.
From those definitions, it can be concluded that customer satisfaction is the attitude
of the customer regarding to which perceived product or service meets or greater the
customer’s expectations, which might leads to brand loyalty as well as profitability.
Based on Hawkins and Looney (1997), there are attributes that create customer
satisfaction has known as “The Big Eight” are as following:
Marketing Mix
Price Place
- Variety - Quality - Design - Feature - Brand Name
- Advertising - Personal Selling - Sales - Promotion
- Channels - Coverage - Locations
- List Price - Discounts - Payment Period - Credit terms
Product Promotion
25
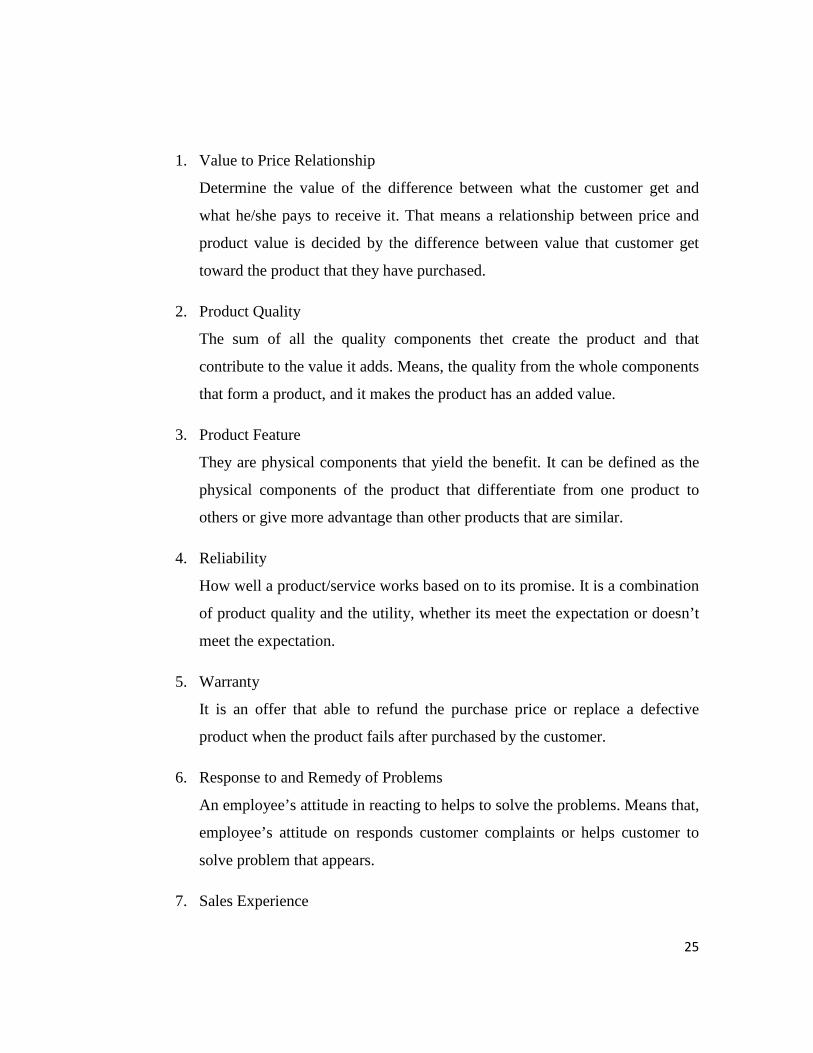
1. Value to Price Relationship
Determine the value of the difference between what the customer get and
what he/she pays to receive it. That means a relationship between price and
product value is decided by the difference between value that customer get
toward the product that they have purchased.
2. Product Quality
The sum of all the quality components thet create the product and that
contribute to the value it adds. Means, the quality from the whole components
that form a product, and it makes the product has an added value.
3. Product Feature
They are physical components that yield the benefit. It can be defined as the
physical components of the product that differentiate from one product to
others or give more advantage than other products that are similar.
4. Reliability
How well a product/service works based on to its promise. It is a combination
of product quality and the utility, whether its meet the expectation or doesn’t
meet the expectation.
5. Warranty
It is an offer that able to refund the purchase price or replace a defective
product when the product fails after purchased by the customer.
6. Response to and Remedy of Problems
An employee’s attitude in reacting to helps to solve the problems. Means that,
employee’s attitude on responds customer complaints or helps customer to
solve problem that appears.
7. Sales Experience

26
It is about interpersonal relationship between employees with customer in
communication that related in purchasing the item, whether the customer
feels happy or comfortable when communicated with the employee that might
lead to satisfaction.
8. Convenience of Acquisition
Can be defined as easiness the product can be obtained or the convenience
that given by the company to the customer toward product accessiblity.
Parasuraman, et.al (1990) had discovered 10 general dimensions that used to measure
customer satisfaction, they are:
1. Tangible
The physical facilities, appearance of personnel, tools or equipment used to
provide service and physical representation of the service.
2. The reliability
It involves consistency of performance and dependability of the products or
services, examples: the firm performs the service right the first time, accuracy
in billing, etc.
3. The Responsiveness
Concern the willingness or readiness of employees to provide service. It
involves timeless of service, example: mailing a transaction ship immediately,
calling the customer back quickly, etc.
4. The competence
Depends on the skills and knowledge of the employees when perform the
service, example: knowledge and skill of the personnel, etc.
5. The courtesy

27
Courtesy is related to the politeness, respect, consideration and friendliness of
the employee and the cleanliness, meet appearance of public contact
personnel.
6. The credibility
Is the result of the trustworthiness, believability, honesty, and having
customer best interest at heart on the products or services.
7. The security
Is viewed as the freedom from danger, risk, or doubt, for example: physically
saftey while using service, financial safety and confidentiality.
8. The Needs
Understanding and knowing the customer are important in term of customer
perceptions and satisfaction. This means the effort of the company to
understand customer’s needs.
9. The access
Consist of the approachability and ease of contact, for example: the service is
easily accessible by telephone, the waiting time to receive service is not
extensive.
10. The communication
It is means keep customer informed in language they can understand and
listening to them, whether complains or suggestions.
But later investigation showed that, in fact, some the 10 of dimensions were
correlated, according to Parasuraman, et.al (1990), customer satisfaction can be
evaluated based on five specific dimensions:
28
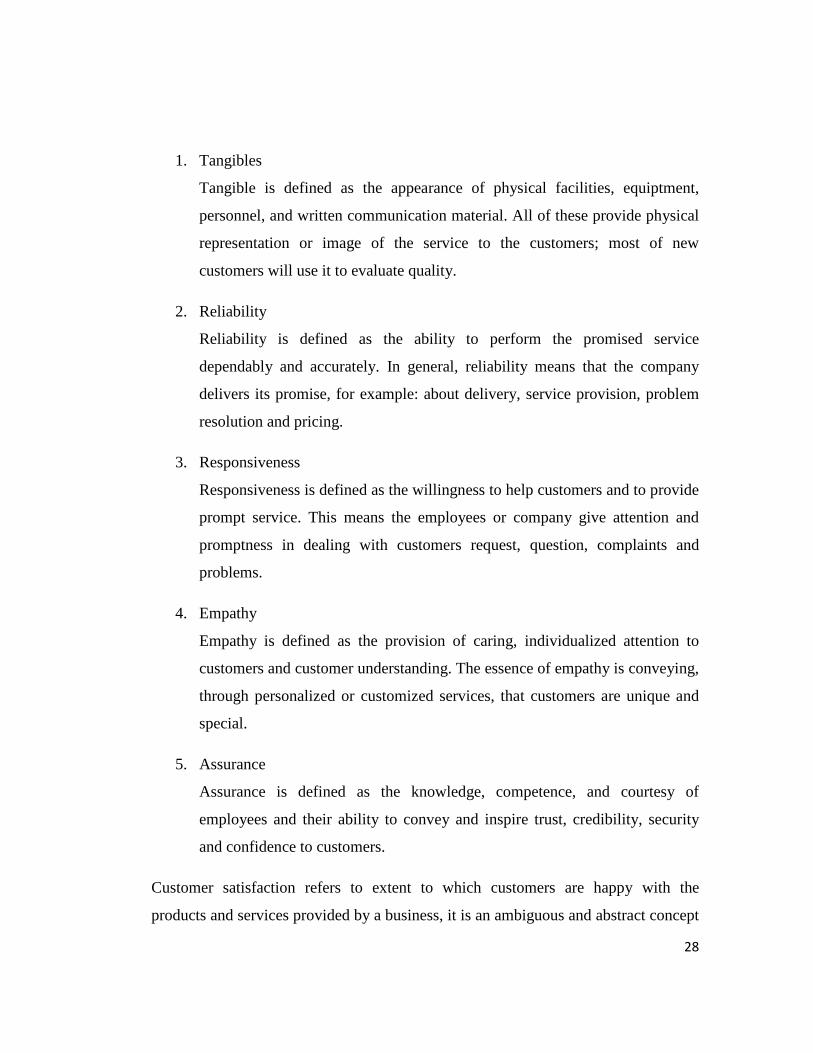
1. Tangibles
Tangible is defined as the appearance of physical facilities, equiptment,
personnel, and written communication material. All of these provide physical
representation or image of the service to the customers; most of new
customers will use it to evaluate quality.
2. Reliability
Reliability is defined as the ability to perform the promised service
dependably and accurately. In general, reliability means that the company
delivers its promise, for example: about delivery, service provision, problem
resolution and pricing.
3. Responsiveness
Responsiveness is defined as the willingness to help customers and to provide
prompt service. This means the employees or company give attention and
promptness in dealing with customers request, question, complaints and
problems.
4. Empathy
Empathy is defined as the provision of caring, individualized attention to
customers and customer understanding. The essence of empathy is conveying,
through personalized or customized services, that customers are unique and
special.
5. Assurance
Assurance is defined as the knowledge, competence, and courtesy of
employees and their ability to convey and inspire trust, credibility, security
and confidence to customers.
Customer satisfaction refers to extent to which customers are happy with the
products and services provided by a business, it is an ambiguous and abstract concept

29
and the actual manifestation of the state of satisfaction will vary from person to
person and product or service to product or service. The state of satisfaction depends
on a number of both psychological and physical variables which correlate with
satisfaction can also vary depending on other options the customer may have and
other products against which customer can compare the organizations’s products
according to Saparudin, (2008).
Rust (1994) stated that satisfaction is a consumer’s post purchase evaluation of the
overall service experience (process and outcome). It is an affective (emotion) state or
feeling reaction in which the consumer’s needs, desires, and expectations during the
course of the service experience have been met or exceeded.
A lot of scholar have described customer satisfaction; overall of the description can
be explained on three main components: (1) Customer satisfaction is a response
(emotional or cognitive) (2) the response related to a certain focus (expectation,
product, consumer experience, etc) and (3) Response happened on a certain time
(after consumption, after product choosing, based on accumulative experience, etc)
(Saparudin, 2008).
According to Paul (2005)
Customer satisfaction is a critical concept in marketing thought and consumer research. It is generally argued that if consumers are satisfied with a product, service, or band, they will be more likely to continue to purchase it and tell others about their products or bands and complain to manufactureres, retails, and other consumer.
Kotler (2000) stated that “Satisfaction is a person’s feeling of pleasure or
disapointment resulting from comparing a product’s perceived performance (or
outcome) in relation to his or her expectation”.
Customer satisfaction is a collective outcome of perception, evaluation and
psychological reaction to the consumption experience with a product/service. By Yi
(1990)
30
Satisfaction is a function of customer’s belief that he or she was treated fairly. By
Hunt 1991
“Customer satisfaction is considered a prerequisite for customer retention and loyalty
and obviously helps in realizing economic goals like profitability, market share,
return on investment, etc.” (Sureshchander, 2002).
2.4. Consumer Behavior Consumer behavior is the study of individuals, groups, or organizations and the
processes they use to select, secure, use, and dispose of products, services,
experiences, or ideas to satisfy needs and the impacts that these processes have on the
consumer and society. All marketing decisions and regulations are based on
assumptions about consumer and the marketing practice designed to influence
consumer behavior influences the firm, the individual, and society (Hawkins, Best
and Coney, 2004)
Marketers have always been interested in how consumers spend their money. How
they spend defines who they are. Consumer’s product and service preferences are
constatntly changing. In order to address this constant state of flux and to create a
proper marketing mix for a wel-defied market, marketing managers must have a
through knowledge of consumer behavior. Consumer behavior describes how the
consumer makes purchase decisions and uses and disposes of the purchased goods
and services.the study of consumer behavior also include the analysis of the factors
that influence purchase decisions and product use. (Hawkins, best and coney, 2004)
Customers have several activities before they decide to purchase. Usually, customers
find the products based on their needs, and then they evaluate the products. The
activities done by customers before and after they purchase is called consumer
behavior. There are several quotations of the definition of consumer behavior:
31
Solomon (2007) defines consumer behavior as the study of the processes involved
when individuals or groups select, purchase, use, or dispose of products, services,
ideas, or experiences to satisfy needs and desires.
In addition, Berman and Evans (2004) in their book entitled Retail Management
explain Consumer Behavior as the process by which people determine whether, what,
when, how, from, whom, and how often to purchase goods and services.
The definition of consumer behavior based on Peter and Olson (2005) is the thoughts
and feelings people experience and the actions they perform in consumption process
including all the things in the environment that influence these thoughts, feeling, and
actions.
McDaniel et all (2006) describe how consumers make purchase decisions and how
they use and dispose of the purchased goods or services as the definition of consumer
behavior.
Before purchasing a product, consumers usually through a process of recognizing
that they need a particular product, and then they obtain information about which
product suits their needs, after that they will find several kinds of products to be
evaluated before they decide to buy a product. In the end, it will result whether the
product is satisfactory or not.
2.5. Demand Demand represents the consumer or buyer side of the market. According to Clayton
(2008), demand itself is s microeconomic concept which contains theory that deals
with behavior and decision making by individual units, such as people and firms. It is
defined as the desire, ability, and willingness to buy a product (Clayton, 2008). Only
those who have demand can compete with others who have similar demands
(Clayton, 2008).

32
The concept of demand is quiet simple since it involves only two variables which are
the price and quantity of a certain product at a given point in time. It is not that other
things like preferences, population can be excluded from factors affecting demand,
but basically demand is described and measured using prices and quantity. The
quantity demanded of a good or service is the amount that consumers plan to buy
during a given time period at a particular price (Parkin et al, 2005). Prices influence
consumer behavior so that quantities of an item demanded will be different at
different prices.
The demand curve is graphically illustrated as a downward sloping line showing
different quantity demanded at different prices. The curve is downward sloping
because people are in general willing to purchase more of something when its price
decreases and purchase less when the price increases. The market demand curve is
not exactly the same as individual demand curve as one’s sensivity towards price
changes can be slightly different from the others. However, both curves are similar.
2.5.1. The law of Demand According to Clayton (2008), the law of demand has a concept that the quantity
demanded varies inversely with its price. The law of demand states that when the
price of good rises and everything else remains the same, the quantity of the good
demanded will fall (Hall and Lieberman, 2003). Likewise, when the price goes down,
quantity demanded goes up (Clayton, 2008).
Baumol and Blinder (2003) mentioned that economics laws are not always obeyed,
and the law of demand is not without exceptions. It is called as a law in social
science because it usually holds and it has been proven by study and through
observation that people will buy more when prices are low and less when prices are
high. Like in the market when people notice that there is a sale or that prices are
higher than usual, their reactions will be different and that can be measured by the
inverse changes in quantity they purchase at different prices.
33
The other theory that can help explain the law of demand could be the throty of
‘marginal utility’ – the extra satisfaction someone will gets from possessing or
consuming one more unit of an item. The more of a good a customer has, the less
marginal utility an additional unit contributes to overall satisfaction, if all other
things remain unchanged (Baumol and Blinder, 2003). In other words, people have
diminishing satisfaction every time they purchase more amount of product. Because
of the diminishing satisfaction, people are not willing to pay as much for the second,
third, fourth,
34
CHAPTER III
METHODOLOGY
3.1. Research Methodology
In this research, the researcher prefers to use quantitative method than qualitative.
People will easily to receive what we aim when we give argumentation based on the
valid numerical data rather than use observation or interview result. Based on Cooper
and Schindler (2006) defined quantitative research attempts precise measurement of
something. Such methodology answer questions related to how much, how often, and
how many and who. In quantitative research, Schiffman and Kanuk (2004) state that
the researcher analyses the data by using objective, standardized, statistical method
consisting mainly of comparisons of averages among the predefined variables and
significance test that estimate the extent two which the result represent the universe.
Beside that quantitative method has strengths that have beneficiaries for the research.
Matveev in his article mentioned that:
The strengths of the quantitative method include:
1. Clearly and precisely specifying both independent and the dependent variables under
investigation;
2. Stating the research problem in very specific and set term (Nachiamas & Nachiamas,
2000)
3. Following firmly the original set of research goals, arriving at more objective
conclusions, testing hypothesis, determining the issues of casualty;
4. Eliminating or minimizing subjectivity of judgment (Kealey & Portheroe, 1996).

35
5. Achieving high levels of reliability of gathered data due to controlled observation,
laboratory experiments, mass survey, or other form of research manipulation
(Balsey,1970);
6. Allowing for longitudinal measures of subsequent performance of research subject.”
(Matveev, 2008,)
From citation above the quantitative method is better than qualitative for this topic.
The topic is casualty issue, two variable dependent and independent and high level of
reliability for self construct questionnaire. We can also eliminate subjective opinion
of the researcher. The researcher prefers to use quantitative method for the research
rather than qualitative method.
3.2. Research Model
This model constructed by the researcher to figured out the variable that are used in
the multiple regression method.
Figure 3.1. The Research Model Source: constructed by researcher
X2
Price Y
Overall Customer
Satisfaction X3
Place
X4
Promotion
X1
Product
36
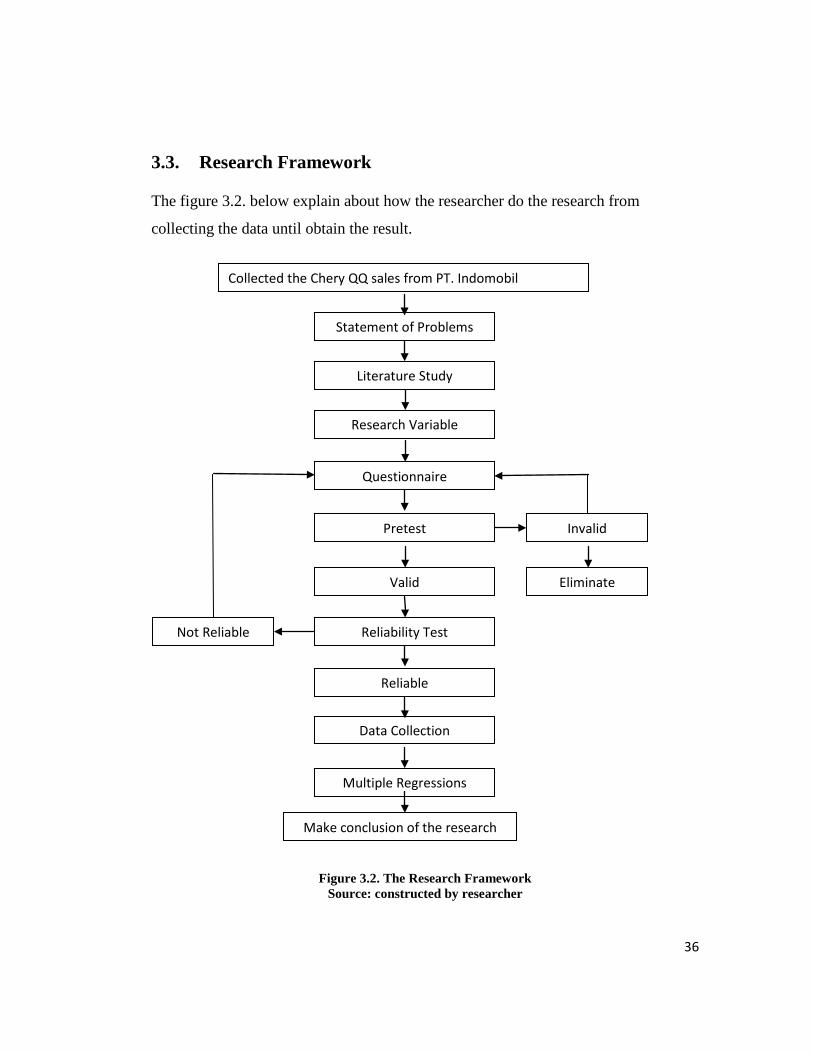
3.3. Research Framework
The figure 3.2. below explain about how the researcher do the research from
collecting the data until obtain the result.
Figure 3.2. The Research Framework Source: constructed by researcher
Statement of Problems
Literature Study
Research Variable
Questionnaire
Pretest
Valid
Reliability Test
Reliable
Data Collection
Multiple Regressions
Make conclusion of the research
Eliminate
Invalid
Not Reliable
Collected the Chery QQ sales from PT. Indomobil

37
3.4. Research Instrument
This research uses self constructed questionnaire instrument to collect data. Before
decided to make self constructed questionnaire the researcher have search
questionnaire from other research but the questionnaire that researcher has got did
not match with the theory that researcher used. So the researcher has decided to
construct the questionnaire based on the related theory that is used in the research
and will do reliability and validity test. The reason behind self construct
questionnaire, as mention by Sumarni and Wahyuni (2006) were as follow:
1. Faster and cheaper to gather data.
2. The research was conducted in the operational activity of the company.
3. It invited big scope of respondent.
4. The researcher could explain more detail each question to prevent
misunderstanding.
5. To reduce sampling error as a result of unreturned questionnaire.
To complete this study, the researcher developed and constructed the sets of
instrument in form of survey questionnaire as follows:
Questionnaire is constructed to evaluate the elements of marketing mix of Chery QQ
perceived by consumers which is consisted of several variables such as:
a. Product; that covers variables such as: the quality of Chery QQ car, the varieties
of product of Chery QQ, the interior and exterior design of the product, and the
brand awareness.
b. Place; that covers variables such as the show room, location, and coverage.
c. Price; that evaluates pricing strategy, price of Chery QQ, Price of Chery QQ
stable, Price is good value for its product.

38
d. Promotion; that evaluates Chery QQ has joined the big automotive event in
Indonesia. Chery QQ advertising is attractive or not, and distributor active
recommend the product or not.
3.5. Testing Instrument
If we built the questionnaire, we should test it to make sure that questionnaire is
proper to measure the research itself. The tests needed to be conducted are validity
test and reliability.
a. Validity testing
Validity is the extent to which a test measures what we actually wish to measure
(Cooper and Schindler, 2006). There are two main things which need to get the
validity testing. Content and Construct Validity. Content Validity was done earlier
before the questionnaires were distributed to the respondents. This was done through
the judgments of a panel of persons on how well the instrument meets the standards.
For this research purposes, the questionnaire has been reviewed by thesis mentor and
view lecturers.
In testing the construct validity, the writer used Pearson’s correlation coefficient.
This formula is also used to test items validity. This coefficient of correlation can be
computed from a computational formula based on the actual values of X and Y. The
formula is:
𝑟 = 𝑁 (∑𝑋𝑌) − (∑𝑋) (∑𝑌)
�{𝑁∑𝑋2 − (∑𝑋)2}{𝑁∑𝑌2 − (∑𝑌)2}
Equation 3.1. Pearson Correlation Coefficient Source : Cooper and Schindler, 2006

39
Where:
r = numeral of correlation
N = quantity of respondent
X = question score from respondent
Y = total score of respondent
The correlation techniques to determine item validity was used because it is the most
popular technique used up until now (Masrun, 1979 cited in Sugiyono, 2006).
To determine the validity of both constructs and items, the researcher compares the r
computation with the r table. If the r computation is greater than r table means than
the constructs and items in the questionnaire are valid. In the execution, the writer
would use a significant level of 0.05 since it is commonly used. The score standard
for validity is from -1 to 1, 1 is the best score. From the calculation results, this study
is 50% valid (See in APPENDIX), from 10 questions only valid 5 question per
variable and has been distributed to 74 respondents.
b. Reliability
Reliability is not as valuable as validity, but it is much easier to access. It is
concerned with estimates of the degree to which a measurement is free of unstable
error (Cooper, Donald and Schindler, Pamela S, p.352). For this study, the researcher
using Cronbach Alpha formula to determine the reliability.
The Cronbach Alpha formula was used to measure this reliability testing:
α = 2 �1 − 𝑆12 + S22
Sx2�
40
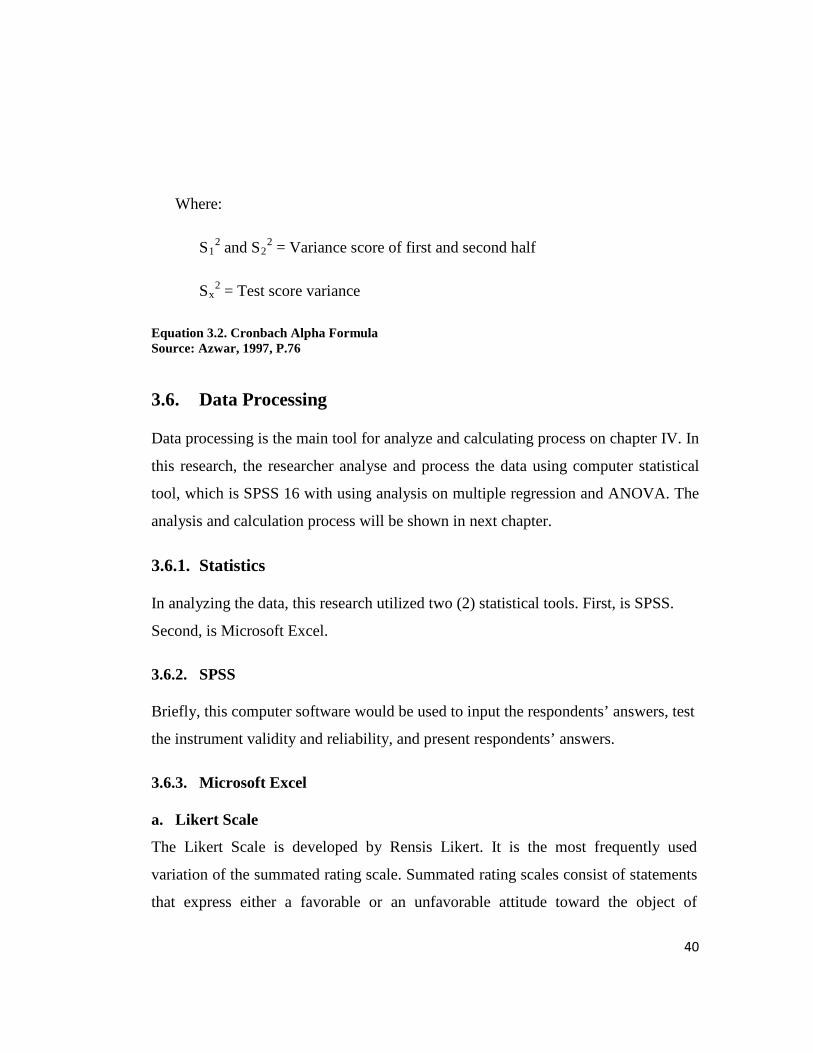
Where:
S12 and S2
2 = Variance score of first and second half
Sx2 = Test score variance
Equation 3.2. Cronbach Alpha Formula Source: Azwar, 1997, P.76
3.6. Data Processing
Data processing is the main tool for analyze and calculating process on chapter IV. In
this research, the researcher analyse and process the data using computer statistical
tool, which is SPSS 16 with using analysis on multiple regression and ANOVA. The
analysis and calculation process will be shown in next chapter.
3.6.1. Statistics
In analyzing the data, this research utilized two (2) statistical tools. First, is SPSS.
Second, is Microsoft Excel.
3.6.2. SPSS
Briefly, this computer software would be used to input the respondents’ answers, test
the instrument validity and reliability, and present respondents’ answers.
3.6.3. Microsoft Excel
a. Likert Scale
The Likert Scale is developed by Rensis Likert. It is the most frequently used
variation of the summated rating scale. Summated rating scales consist of statements
that express either a favorable or an unfavorable attitude toward the object of

41
interest. The participant is asked to agree or disagree with each statement. Each
response is given a numerical score to measure the participants overall attitude.
(Cooper and Schlinder, 2006).
The author chose Likert Scale for this study because of several reasons as follows:
• It is common, very convenience, and most widely used (Cooper and Schlinder,
2006).
• It is probably more reliable and provides a greater volume of data than many other
scales (Cooper and Schlinder, 2006).
• It is applicable to this study both that focus on the object or respondents study
(Brunt and Paul, 1998).
In this study, data were interpreted using five-Likert scale (Malhotra, 2004) as the
same serves as basis for the interpretation of the results of the computed data where
the boundary of numeral and option includes:
Table 3.2. Relative Grading Statement for Each Dimension
Relative Grading Statement Score
Strongly Agree (SA) 5
Agree (A) 4
Naither Agree nor Disagree / Neutral (N) 3
Disagree (D) 2
Strongly Disagree (SD) 1
42
3.7. Testing Hypothesis and Data Analysis Method
3.7.1. Multiple Regression
The researcher use Multiple Regression model which is to learn more about the
relationship between several independent or predictor variables and a dependent or
criterion variable and analysis of variancze (ANOVA) which helps to examine the
significant mean differences among more than two groups on an interval or ratio
scaled dependent variable (Sekaran ,2003).
In any regression model, there is an implicit assumption (which can be tested) that a
relationship exists between the variables. There is also some random error that cannot
be predicted. Referring to the research objective to examine the variables that affect
the customer satisfaction of the Chery QQ customer, the underlying multiple
regression will be used:
Y = a + bX1 + cX2 + dX3+ eX4
Where:
Y = Overall customer satisfaction
a = Intercept
X1 = Product
X2 = Price
X3 = Place
X4 = Promotion
b, c, d, e = regression cooeficient of independent variable

43
The purposed of regression analysis is to come up with an equation of a line that fits
through of points with the minimal amount F deviations from the line. It also has
functions to understand the relationship between the variables and to predict value of
one based on the other. Montgomery (1928) outlines the following four purposes for
running a regression analysis:
1. Description – The analyst is seeking to find an equation that describes or
summarizes the relationship between two variables. This purpose makes the
fewest assumptions.
2. Coefficient Estimation – This is a popular reason for doing regression analysis.
The analyst may have a theoretical relationship in mind, and the regression
analysis will confirm this theory. Most likely, there is a specific interest in the
magnitude and signs of the coefficients. Frequently, this purposed for regression
overlaps with others.
3. Prediction – The prime concern here is to predict the response variable. These
predictions may be very crucial in planning, monitoring, or evaluating some
process or system. There are many assumptions and qualifications that must be
made in this case. Interval estimates require that normality assumption to hold.
4. Control – Regression model may be used for monitoring and controlling a
system. When a regression model is used for control purposes, the independent
variable must be related to the dependent variable in a causal way. Furthermore,
this functional relationship must continue over time. If it does not, continual
modification of the model must occur.
The result from this regression analysis will be used to accept or to reject the
hypothesis as to whether there is any effect or not between each independent
variable with dependent variable. To decide whether to reject or not to reject the
hypothesis, the criteria is α = 0.05.
44
3.7.2. Statistics Implementation
1. Measuring the Variability of the Regression Model.
a. Coefficient of Determination (R2)
Coefficient of Determination measures the variability in Y that is explained by
the regression equation. The R2 value can range from a low of 0 to a high 1
(0≤R2≤1):
If R2 = 0, X explains 0% of the variability in Y
If R2 = 1, X explains 100% of the variability in Y
b. Coefficient of Correlation (R)
Coefficient Correlation can be divided as the following:
1) 0.70 – 1.00 (either plus or minus) shows high correlation
2) 0.40 - <0.70 (either plus or minus) shows substantial correlation
3) 0.20 - <0.40 (either plus or minus) shows low correlation
4) <0.20 (either plus or minus) shows no correlation
2. Testing the Model for significance
Coefficient pf Correlation shows the degree or strenght of the linear relationship.
It can be stated at any number between +1 and -1. The value of R is the square
root of R2. In the hypothesis testing, the researcher use F test and t test.

45
a. F-test
F-test determines whether or not there is a relationship between the set of
independent variables and dependent variable simultaneously. An F-test is used
to statistically test the null hypothesis that there is no linear relationship between
X and Y variable. If the significance level for F-test is below 0.05, we reject H0
and conclude there is a linear relationship, and vice versa.
Ho: b = c = d = e = 0
(If significant F < 0.05, reject H0)
Ha: At least one coefficient ≠ 0
(If significant F > 0.05 do not reject H0)
c. t-Test
t-Test is applied to determine the partial relationship between each independent
variable (coefficient) and the dependent variable. The null hypothesis is that the
coefficient of X (i.e. the slope of the line) is 0. If the significance level for t-test
is low (significance level α used is 0.05), we reject H0 and conclude that there is
a linear relationship, and vice versa.
Ho: b = 0, if significance t < 0.05, reject Ho
Ha: b ≠ 0, if significance t > 0.05, do not reject Ho
Ho: c = 0, if significance t < 0.05, reject Ho
Ha: c ≠ 0, if significance t > 0.05, do not reject Ho

46
Ho: d = 0, if significance t < 0.05, reject Ho
Ha: d ≠ 0, if significance t > 0.05, do not reject Ho
Ho: e = 0, if significance t < 0.05, reject Ho
Ha: e ≠ 0, if significance t > 0.05, do not reject Ho
3.8. Sampling Design
3.8.1. Size of Population
Population simply is general area that consists of: object or subject has quantity and
certain characteristic considered by the researcher to be studied and then taken
conclusion. The size of population is 242 taken from number of sales of Chery QQ in
North Jakarta from it is launched in 2006.
3.8.2. Sampling Technique Applied
Sample is the part of the population that we actually examine in order to gather
information. So we can apply the concept to this research. There are several sampling
method that’s can be used to collect the data. Those method such as random
sampling, cluster sampling and so on.
The researcher uses purposive convenience sampling method for the research to
gather the data from the respondent. The amount of data taken is targeted to have
confidence level of 90%, and a margin error of 10%.
The sample size population was determined using the formula Slovin, (1960) as
follows:

47
𝐧 =𝑵
𝟏 + 𝑵𝒆𝟐
Where :
n = sample size
N = population size
e = desired margin of error
𝑛 = 242
1 + (242(.1)2
n = 70.7
The result of computation above shows n = 70.7
The researcher round it up to 74 respondents
3.9. Who the Respondents are
The respondents for this research are the customer of Chery QQ from North Jakarta
only.
3.10. Limitations
In doing this research, there were some limitations faced by the researcher such as lack of
supporting data of Chery QQ customers when submitting the questionnaire. Some customers
are not willing to fill the questioner, and some of them did not bringing back the questioner
to the researcher. The researcher has a short time to finding the customer of Chery QQ
because it is not easy to find this car in the road. The researchers only distribute the
questioner from the customer of Chery QQ in North Jakarta only.

48
CHAPTER IV
ANALYSIS OF DATA AND INTERPRETATION OF
RESULTS
4.1. Research Objectives Description
In this chapter, the researcher presents full analysis of the data gathered, from
respondents’ profile to the interpretation of results. The purpose of this research is to
find out the most dominant factor that affects the decreasing sales of Chery QQ. In
other to know if there is any significant influence from the factors mentioned before,
the researcher use Multiple Regression Method. In this research objective, the
researcher collected the data from the consumer of Chery QQ by distributing the
questionnaire.
4.2. Regression Analysis and Model Result
The basic assumptions tests for regression model are normally test, autocorrelation
test and multicollinearity test. If the regression model does not fulfill the test, so the
explaining variables are not efficient.
4.2.1. Autocorrelation Test
Durbin Watson Test is used to test the autocorrelation. This test objective is to see
whether the correlation between dependent variable with itself exists or not. Santoso
(1999) said that the value of Durbin-Watson used to test the autocorrelation with the
stipulation if the value in range between (-2) until (2) means there is no
autocorrelation.

49
Table 4.1. Autocorrelation
Model Durbin-Watson
1 1.062
4.2.2. Coefficient of Correlation and Determination
Coefficient Determination is used to test goodness-of-fit from regression model.
From the table below, we can see the coefficient correlation (R) of the regression
model is 0.364 which means that there is low relationship of the combination of
indpendent variables to the dependent variable. The coefficient of determination (R2)
is 0.132, which means 13.2% variability in the dependent variable, customer
satisfaction of Chery QQ can be explained by the variability in the combination of 4
(four) independent variables which are Product, Price, Promotion, and Place. We can
see the R and R2 in the table 4.2 below.
Table 4.2. Model Summary
Model R R Square Adjusted R
Square Std. Error of the Estimate Durbin-Watson
1 .364a .132 .082 .69177 1.062
a. Predictors: (Constant), x4, x3, x1, x2
b. Dependent Variable: Y
Source: Appendix, SPSS Result

50
4.2.3. Significance of the Model
1. Simultaneous Influence F-test (P value)
ANOVA (analysis of variance) shows the value of F calculation. Simultaneous effect
or F-test is used to see whether independent variables altogether or simultaneously
affect the dependent variable.
The significance level F for a given hypothesis test is a value for which P-value
(sig.F) less than or equal to α is considered statistically significant. Typical value for
α used in this research is 0.05 (confidence level).
From the table 4.3. below, it shows that the value of F test is 2.63 with significance
value of 0.042 (<0.05). Therefore, the significance value is less than 0.05, it
concludes that Product, Price, Promotion, and Place are affecting the customer
satisfaction of Chery QQ. In conclusion of the F test, there is a simultaneous affect of
Product, Price, Promotion, and Place.
Table 4.3. ANOVA
Model Sum of Squares df Mean Square F Sig.
1 Regression 5.034 4 1.259 2.630 .042a
Residual 33.020 69 .479
Total 38.054 73
a. Predictors: (Constant), x4, x3, x1, x2
b. Dependent Variable: Y
Source: Appendix, SPSS Result
51
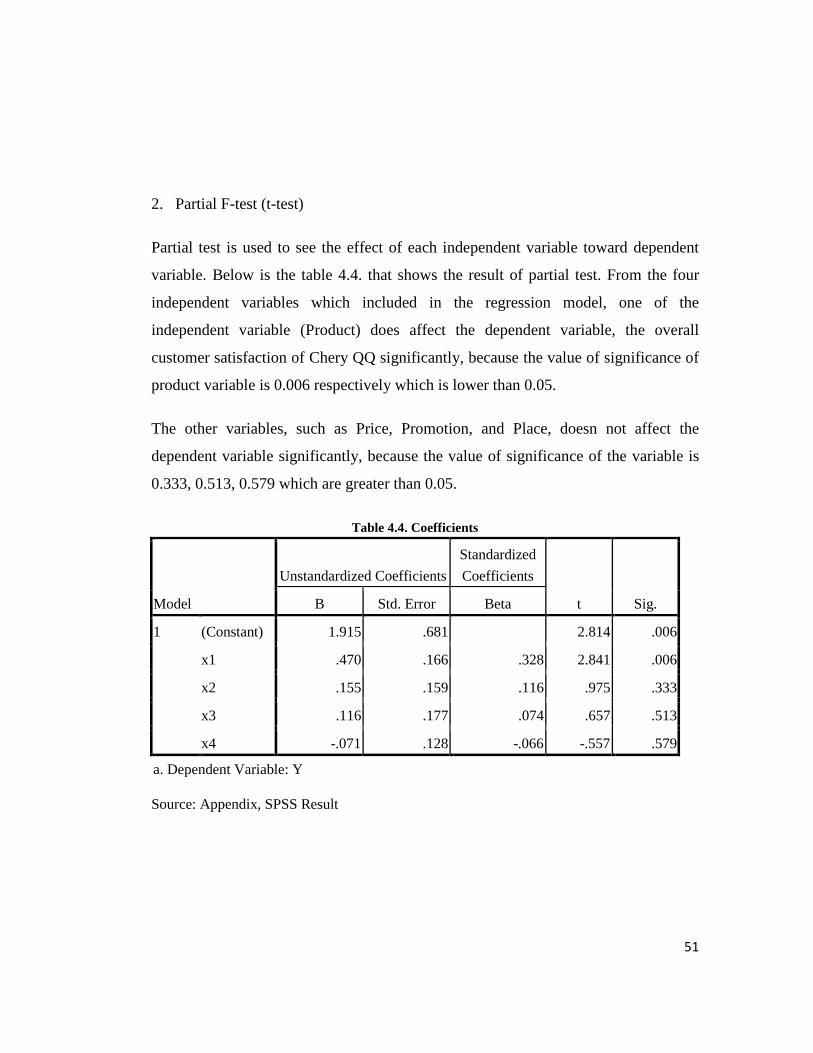
2. Partial F-test (t-test)
Partial test is used to see the effect of each independent variable toward dependent
variable. Below is the table 4.4. that shows the result of partial test. From the four
independent variables which included in the regression model, one of the
independent variable (Product) does affect the dependent variable, the overall
customer satisfaction of Chery QQ significantly, because the value of significance of
product variable is 0.006 respectively which is lower than 0.05.
The other variables, such as Price, Promotion, and Place, doesn not affect the
dependent variable significantly, because the value of significance of the variable is
0.333, 0.513, 0.579 which are greater than 0.05.
Table 4.4. Coefficients
Model
Unstandardized Coefficients Standardized Coefficients
t Sig. B Std. Error Beta
1 (Constant) 1.915 .681 2.814 .006
x1 .470 .166 .328 2.841 .006
x2 .155 .159 .116 .975 .333
x3 .116 .177 .074 .657 .513
x4 -.071 .128 -.066 -.557 .579
a. Dependent Variable: Y
Source: Appendix, SPSS Result

52
3. Multiple Regression Model
The regression model that already discussed in analysis method in chapter 3, the
researcher fulfills the calculation result (intercept and cooficients) from table 4.3 into
the multiple regression models.
Y = 1.915 + 0.470X1 + 0.155X2 + 0.116X3 - 0.071X4
Where:
Y = Overall customer satisfaction
a = Intercept
X1 = Product
X2 = Price
X3 = Promotion
X4 = Place
b, c, d, e = regression coeficient of independent variable

53
4.2.4. Detailed Hypothesis Discussion Table 4.5. Coefficients
Model
Unstandardized Coefficients Standardized Coefficients
T Sig. B Std. Error Beta
1 (Constant) 1.915 .681 2.814 .006
x1 .470 .166 .328 2.841 .006
x2 .155 .159 .116 .975 .333
x3 .116 .177 .074 .657 .513
x4 -.071 .128 -.066 -.557 .579
a. Dependent Variable: Y
Source: Appendix, SPSS Result
Coefficient of determination (R2) of the model is 0.132. It means that 13.2%
variability of the dependent variable in this research which is the customer
satisfaction of Chery QQ can be explained by the variability combination of Product,
Price, Promotion, and Place. The rest are explained by other variables out of the
model.
The partial (t-test) is done to see the effect of each independent variable individually
toward the dependent variable in the regression model. In this research, the partial
test (t-test) was conducted in order to see whether the Product, Price, Promotion, and
Place are individually affecting the customer satisfaction of Chery QQ.
Therefore, the hypotheses of this t-test are:
Ho: ß = 0, if t significant < 0.05, reject Ho
Ha: ß ≠ 0, if significant t > 0.05, do not reject Ha

54
Simultaneous effect test (F-test) is done for this research to see if the independent
variables altogether affects the dependent variable. In this research, the test is done to
see whether the Product, Price, Promotion, and Place altogether affect the customer
satisfaction of Chery QQ.
The hypotheses of this F test are:
Ho: b = c = d = e = 0, if significant F < 0.05, reject Ho
Ha: At least one coefficient = 0, if significant F > 0.05, do not reject H0
According to the hypothesis test, there is no sufficient evidence to reject Ha or not to
reject Ho at the significance level 0.00. In another calculation result, the value of F is
2.63, since the F calculation greater than F table (0.05) = 2.53, so the conclusion
same with above, accept Ho. It means that Product, Price, Promotion, and Place
altogether affect the customer satisfaction of Chery QQ significantly.
The explanations of each t test are stated below:
1. Test of Product
Based on the calculation, the value of significance is 0.006 it is less than 0.05.
According to the hypothesis test, there is sufficient evidence to reject Ho. It means
that Product affecting the overall customer satisfaction of Chery QQ significantly.
2. Test of Price
Based on the calculation, the value of significance is 0.333 it is greater than 0.05.
According to the hypothesis test, there is sufficient evidence to reject Ho. It means
that Price does not affect the overall customer satisfaction of Chery QQ significantly.
55
3. Test of Promotion
Based on the calculation, the value of significance is 0.513 it is greater than 0.05.
According to the hypothesis test, there is sufficient evidence not to reject Ho. It
means that Promotion does not affect the overall customer satisfaction of Chery QQ
significantly.
4. Test of Place
Based on the calculation, the value of significance is 0.579 it is greater than 0.05.
According to the hypothesis test, there is no sufficient evidence not to reject Ho. It
means that Place does not affect the overall customer satisfaction of Chery QQ
significantly.
56
CHAPTER V
CONCLUSION AND RECOMMENDATIONS
5.1. Conclusions
The research has been conducted and lead to a clearer view about the problem.
Therefore, this chapter would be the answer of the research statement in the chapter
1. The conclusion was built based on the data analysis of the research and some
calculation in chapter IV. Through the observation and analysis that had been done,
the researcher able to answered the most crucial question in the statement problem.
Based on calculation result by the researcher, so that the researchers take the
conclusions:
1. The result from calculating by using multiple regression model in the R2 shown
value 0.132 it is mean how well the regression model fit the fact data 13.2% can
explain and describe the researcher data and the result is significant.
2. The result from calculating by using multiple regression models in the F table
shown significant value 0.042, it is mean all independent variables which are
Marketing Mix dimensions have a strong relation with dependent variable which
is the customer satisfaction of Chery QQ.
3. The result from calculating by using multiple regression models in the t table
shown one significant value there is 0.006 from independent variable which is
Product that has strong relationship with dependent variable which is the
customer satisfaction of Chery QQ.
4. The most important factor that causes the decline in sales of Chery QQ is the
product aspect. The quality of Chery QQ is not good, because the engine of

57
Chery QQ is not good and caused the car unstable. The feature of Chery is not
much, this cause the customer not interested to purchase this car.
5. The factor that needs to be improved to push the Chery QQ sales is the product
aspect. Chery should increase the feature and design of Chery QQ and keep
improving their quality.
5.2. Recommendation
In my conclusion, the decreasing sales of Chery QQ are caused by the quality of the
product, because the product of Chery QQ is not good, and these causes the
customers not satisfy to buy the car.This problems cause the sales of Chery QQ to
decrease. Based on the result of the analysis, Chery QQ should mantain the price of
product that had been well accepted by consumer. The weakness of Chery QQ is on
their product, then, the quality of Chery QQ should be increased to gaining more
customers.
1. For the product aspect, Chery QQ should increase the quality of the product.
Consumer look forward to the qualtiy of product in make decision to buy
something. If they look the quality of products are poor so they will not consider
to buy those product.
2. Chery QQ should add more feature for the product, it will make the customer
interest in purchasing the product.
3. The colour of Chery QQ car is not many they should make another colour for the
car. To give the customers option in chosing the colour of the car.
4. Chery QQ should refresh the design interior & exterior of the car. It will make
the customer not to get bored.
5. For further studies or research related to this topic, the researcher recommends
doing the research using other appropriate settings, variables, instruments, and
respondents.

58
REFERENCES
Books
Baumol, William J. & Blinder, Alan S. (2003). Economics: Principle and Policy 9th
Ed. South Western, USA: Thompson.
Clayton, G.E. (2008). Economics: Principles and Practices. McGraw-Hill.
Cooper, Donald R. and Schindler, Pamela. (2006). Marketing Research. Boston:
McGraw-Hill.
Cravens, David W. & Piercy, Nigel F. (2006), Strategic Marketing. Singapore:
McGraw-Hill.
Del I. Hawkins, Roger J. Best & Kenneth A. Coney (2004), Consumer Behavior:
Building Marketing Strategy, International Edition, McGraw Hill.
Hawkins and Looney (2004). Consumer Behavior 9th Ed. McGraw-Hill
J.Paul Peter, Jerry C. Olson (2003). Consumer behavior & Marketing Strategy (7th
Edition). Mcgraw-Hill.
Kotler, Philip & Armstrong, Gary. (2005). Principle of Marketing, USA: Prentice
Hall.
Kotler, Philip., Ang, Swee Hoon., Leong, Siew Meng. & Tan, Chin Tiong. (1999).
Marketing Management. Singapore: Prentice Hall.
McDaniel, Carl. (2006). Introduction to Marketing 9th Ed. Thomson South Western.
Naresh K. Malhotra. Marketing Research. Pearson Prentice-Hall International Inc,
1996

59
Nachiamas, C.F. & Nachiamas D. (2000). Research methods in the social sciences
(5th Ed.). London: St. Martins Press Inc.
Parkin, M., Powell, M., & Matthews, K. (2005). Economics (6th Ed.). London:
Pearson Education.
Santoso, Singgih. (1999). Buku Latihan SPSS Statistik Parametrik. PT. Elex Media
Komputindo, Jakarta.
Sekaran, Umar. (2003). Research Method For Business, (4th ed) USA: John Wiley.
Stern, Louis W. & El – Ansary, Adel I. (1996), Marketing Channels. New Jersey :
Prentice Hall.
Company
PT. Indomobil, Tbk.
Badan Pusat Statistik
Internet
http://www.chery-indomobil.com/qq.htm
http://chery-qq.blogspot.com/
www.wikipedia.com

60
APPENDICES
Product
Correlations
1 2 3 4 5 6 7 8 9 10 Total
1 Pearson Correlation 1 .803** .329 .597 .410 .613 .363 .552 .353 .062 .933**
Sig. (2-tailed) .005 .353 .069 .239 .060 .303 .098 .317 .866 .000
N 10 10 10 10 10 10 10 10 10 10 10
2 Pearson Correlation .803** 1 .224 .483 .245 .402 .113 .388 .488 -.383 .678*
Sig. (2-tailed) .005 .535 .158 .495 .250 .756 .268 .153 .274 .031
N 10 10 10 10 10 10 10 10 10 10 10
3 Pearson Correlation .329 .224 1 .554 -.456 .195 .477 -.342 .600 .343 .530
Sig. (2-tailed) .353 .535 .097 .185 .590 .163 .334 .067 .332 .115
N 10 10 10 10 10 10 10 10 10 10 10
4 Pearson Correlation .597 .483 .554 1 .000 .447 .525 -.164 .453 .142 .737*
Sig. (2-tailed) .069 .158 .097 1.000 .195 .120 .652 .189 .695 .015
N 10 10 10 10 10 10 10 10 10 10 10
5 Pearson Correlation .410 .245 -.456 .000 1 .328 -.308 .576 -.299 .157 .309
Sig. (2-tailed) .239 .495 .185 1.000 .355 .387 .082 .402 .666 .385
N 10 10 10 10 10 10 10 10 10 10 10
6 Pearson Correlation .613 .402 .195 .447 .328 1 -.061 .439 .431 -.139 .660*
Sig. (2-tailed) .060 .250 .590 .195 .355 .868 .205 .214 .703 .038
N 10 10 10 10 10 10 10 10 10 10 10
7 Pearson Correlation .363 .113 .477 .525 -.308 -.061 1 .073 -.074 .477 .500
Sig. (2-tailed) .303 .756 .163 .120 .387 .868 .841 .840 .164 .141
N 10 10 10 10 10 10 10 10 10 10 10
8 Pearson Correlation .552 .388 -.342 -.164 .576 .439 .073 1 -.241 -.027 .430
Sig. (2-tailed) .098 .268 .334 .652 .082 .205 .841 .503 .941 .215

61
N 10 10 10 10 10 10 10 10 10 10 10
9 Pearson Correlation .353 .488 .600 .453 -.299 .431 -.074 -.241 1 -.356 .398
Sig. (2-tailed) .317 .153 .067 .189 .402 .214 .840 .503 .313 .255
N 10 10 10 10 10 10 10 10 10 10 10
10 Pearson Correlation .062 -.383 .343 .142 .157 -.139 .477 -.027 -.356 1 .720
Sig. (2-tailed) .866 .274 .332 .695 .666 .703 .164 .941 .313 .468
N 10 10 10 10 10 10 10 10 10 10 10
Total Pearson Correlation .933** .678* .530 .737* .309 .660* .500 .430 .398 .720 1
Sig. (2-tailed) .000 .031 .115 .015 .385 .038 .141 .215 .255 .468
N 10 10 10 10 10 10 10 10 10 10 10
**. Correlation is significant at the 0.01 level (2-tailed).
*. Correlation is significant at the 0.05 level (2-tailed).
Price
Correlations
1 2 3 4 5 6 7 8 9 10 Total
1 Pearson Correlation 1 .544 .447 .000 .597 .000 .453 .525 .554 .483 .737*
Sig. (2-tailed) .104 .195 1.000 .069 1.000 .189 .120 .097 .158 .015
N 10 10 10 10 10 10 10 10 10 10 10
2 Pearson Correlation .544 1 .451 .296 .823** .299 .548 .074 .218 .976** .693*
Sig. (2-tailed) .104 .191 .406 .003 .402 .101 .840 .545 .000 .026
N 10 10 10 10 10 10 10 10 10 10 10
3 Pearson Correlation .447 .451 1 .205 .613 .328 .431 -.061 .195 .402 .660*
Sig. (2-tailed) .195 .191 .569 .060 .355 .214 .868 .590 .250 .038
N 10 10 10 10 10 10 10 10 10 10 10
4 Pearson Correlation .000 .296 .205 1 .629 .130 -.062 .517 .107 .383 .551
Sig. (2-tailed) 1.000 .406 .569 .052 .720 .864 .126 .768 .274 .099

62
N 10 10 10 10 10 10 10 10 10 10 10
5 Pearson Correlation .597 .823** .613 .629 1 .410 .353 .363 .329 .803** .933**
Sig. (2-tailed) .069 .003 .060 .052 .239 .317 .303 .353 .005 .000
N 10 10 10 10 10 10 10 10 10 10 10
Pearson Correlation .000 .299 .328 .130 .410 1 -.299 -.308 -.456 .245 .309
Sig. (2-tailed) 1.000 .402 .355 .720 .239 .402 .387 .185 .495 .385
N 10 10 10 10 10 10 10 10 10 10 10
7 Pearson Correlation .453 .548 .431 -.062 .353 -.299 1 -.074 .600 .488 .398
Sig. (2-tailed) .189 .101 .214 .864 .317 .402 .840 .067 .153 .255
N 10 10 10 10 10 10 10 10 10 10 10
8 Pearson Correlation .525 .074 -.061 .517 .363 -.308 -.074 1 .477 .113 .500
Sig. (2-tailed) .120 .840 .868 .126 .303 .387 .840 .163 .756 .141
N 10 10 10 10 10 10 10 10 10 10 10
9 Pearson Correlation .554 .218 .195 .107 .329 -.456 .600 .477 1 .224 .530
Sig. (2-tailed) .097 .545 .590 .768 .353 .185 .067 .163 .535 .115
N 10 10 10 10 10 10 10 10 10 10 10
10 Pearson Correlation .483 .976** .402 .383 .803** .245 .488 .113 .224 1 .678*
Sig. (2-tailed) .158 .000 .250 .274 .005 .495 .153 .756 .535 .031
N 10 10 10 10 10 10 10 10 10 10 10
Total Pearson Correlation .737* .693* .660* .551 .933** .309 .398 .500 .530 .678* 1
Sig. (2-tailed) .015 .026 .038 .099 .000 .385 .255 .141 .115 .031
N 10 10 10 10 10 10 10 10 10 10 10
*. Correlation is significant at the 0.05 level (2-tailed).
**. Correlation is significant at the 0.01 level (2-tailed).

63
Promotion
Correlations
1 2 3 4 5 6 7 8 9 10 Total
1 Pearson Correlation 1 -.544 .043 .288 .169 .239 .113 -.068 .029 -.617 .775
Sig. (2-tailed) .104 .905 .420 .641 .506 .756 .853 .937 .058 .286
N 10 10 10 10 10 10 10 10 10 10 10
2 Pearson Correlation -.544 1 .498 -.502 -.603 -.261 -.508 .282 -.422 .021 -.504
Sig. (2-tailed) .104 .143 .139 .065 .467 .134 .429 .224 .954 .138
N 10 10 10 10 10 10 10 10 10 10 10
3 Pearson Correlation .043 .498 1 -.185 -.656* -.246 .038 .090 -.615 -.339 -.182
Sig. (2-tailed) .905 .143 .609 .039 .494 .918 .805 .058 .338 .614
N 10 10 10 10 10 10 10 10 10 10 10
4 Pearson Correlation .288 -.502 -.185 1 .160 .188 .110 .185 .383 .128 .816**
Sig. (2-tailed) .420 .139 .609 .659 .602 .763 .609 .275 .724 .004
N 10 10 10 10 10 10 10 10 10 10 10
5 Pearson Correlation .169 -.603 -.656* .160 1 .039 -.177 .626 .052 .216 .685
Sig. (2-tailed) .641 .065 .039 .659 .915 .625 .053 .887 .549 .815
N 10 10 10 10 10 10 10 10 10 10 10
6 Pearson Correlation .239 -.261 -.246 .188 .039 1 .113 .101 .173 -.214 .559
Sig. (2-tailed) .506 .467 .494 .602 .915 .756 .780 .632 .552 .093
N 10 10 10 10 10 10 10 10 10 10 10
7 Pearson Correlation .113 -.508 .038 .110 -.177 .113 1 -.022 .432 -.113 .730
Sig. (2-tailed) .756 .134 .918 .763 .625 .756 .952 .212 .756 .317
N 10 10 10 10 10 10 10 10 10 10 10
8 Pearson Correlation -.068 .282 .090 .185 .626 .101 -.022 1 .135 -.271 .271
Sig. (2-tailed) .853 .429 .805 .609 .053 .780 .952 .710 .449 .449
N 10 10 10 10 10 10 10 10 10 10 10
9 Pearson Correlation .029 -.422 -.615 .383 .052 .173 .432 .135 1 .339 .704
Sig. (2-tailed) .937 .224 .058 .275 .887 .632 .212 .710 .338 .065
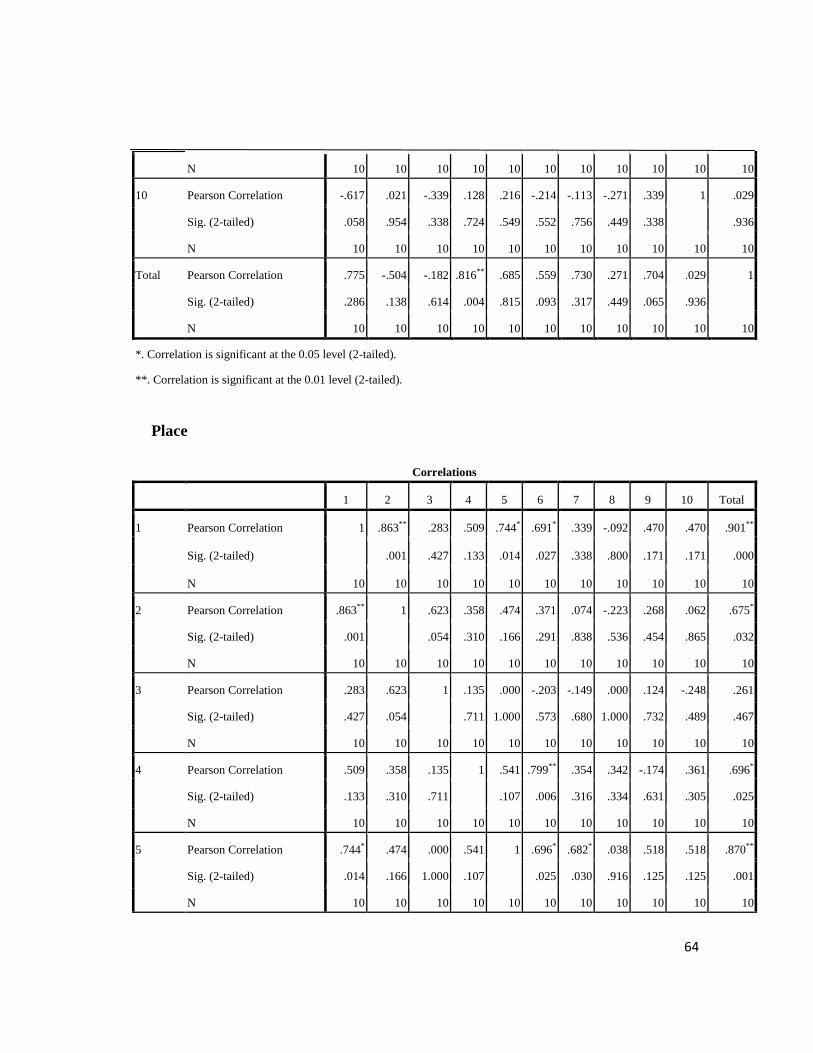
64
N 10 10 10 10 10 10 10 10 10 10 10
10 Pearson Correlation -.617 .021 -.339 .128 .216 -.214 -.113 -.271 .339 1 .029
Sig. (2-tailed) .058 .954 .338 .724 .549 .552 .756 .449 .338 .936
N 10 10 10 10 10 10 10 10 10 10 10
Total Pearson Correlation .775 -.504 -.182 .816** .685 .559 .730 .271 .704 .029 1
Sig. (2-tailed) .286 .138 .614 .004 .815 .093 .317 .449 .065 .936
N 10 10 10 10 10 10 10 10 10 10 10
*. Correlation is significant at the 0.05 level (2-tailed).
**. Correlation is significant at the 0.01 level (2-tailed).
Place
Correlations
1 2 3 4 5 6 7 8 9 10 Total
1 Pearson Correlation 1 .863** .283 .509 .744* .691* .339 -.092 .470 .470 .901**
Sig. (2-tailed) .001 .427 .133 .014 .027 .338 .800 .171 .171 .000
N 10 10 10 10 10 10 10 10 10 10 10
2 Pearson Correlation .863** 1 .623 .358 .474 .371 .074 -.223 .268 .062 .675*
Sig. (2-tailed) .001 .054 .310 .166 .291 .838 .536 .454 .865 .032
N 10 10 10 10 10 10 10 10 10 10 10
3 Pearson Correlation .283 .623 1 .135 .000 -.203 -.149 .000 .124 -.248 .261
Sig. (2-tailed) .427 .054 .711 1.000 .573 .680 1.000 .732 .489 .467
N 10 10 10 10 10 10 10 10 10 10 10
4 Pearson Correlation .509 .358 .135 1 .541 .799** .354 .342 -.174 .361 .696*
Sig. (2-tailed) .133 .310 .711 .107 .006 .316 .334 .631 .305 .025
N 10 10 10 10 10 10 10 10 10 10 10
5 Pearson Correlation .744* .474 .000 .541 1 .696* .682* .038 .518 .518 .870**
Sig. (2-tailed) .014 .166 1.000 .107 .025 .030 .916 .125 .125 .001
N 10 10 10 10 10 10 10 10 10 10 10
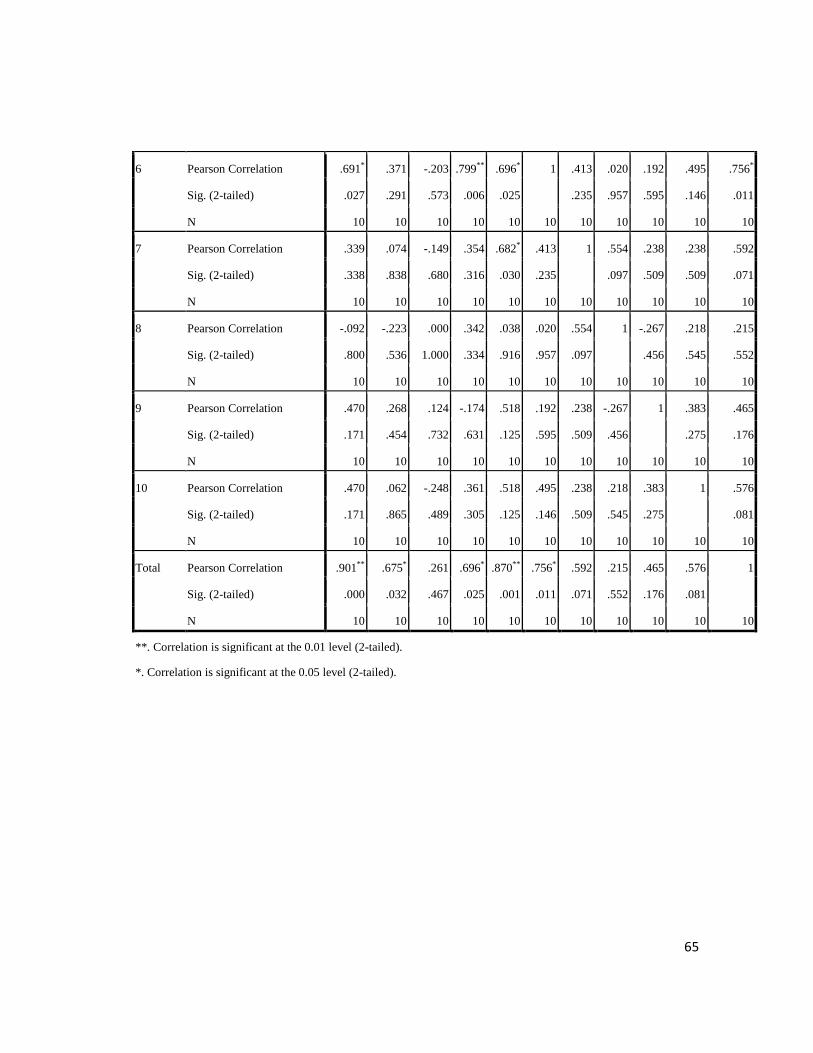
65
6 Pearson Correlation .691* .371 -.203 .799** .696* 1 .413 .020 .192 .495 .756*
Sig. (2-tailed) .027 .291 .573 .006 .025 .235 .957 .595 .146 .011
N 10 10 10 10 10 10 10 10 10 10 10
7 Pearson Correlation .339 .074 -.149 .354 .682* .413 1 .554 .238 .238 .592
Sig. (2-tailed) .338 .838 .680 .316 .030 .235 .097 .509 .509 .071
N 10 10 10 10 10 10 10 10 10 10 10
8 Pearson Correlation -.092 -.223 .000 .342 .038 .020 .554 1 -.267 .218 .215
Sig. (2-tailed) .800 .536 1.000 .334 .916 .957 .097 .456 .545 .552
N 10 10 10 10 10 10 10 10 10 10 10
9 Pearson Correlation .470 .268 .124 -.174 .518 .192 .238 -.267 1 .383 .465
Sig. (2-tailed) .171 .454 .732 .631 .125 .595 .509 .456 .275 .176
N 10 10 10 10 10 10 10 10 10 10 10
10 Pearson Correlation .470 .062 -.248 .361 .518 .495 .238 .218 .383 1 .576
Sig. (2-tailed) .171 .865 .489 .305 .125 .146 .509 .545 .275 .081
N 10 10 10 10 10 10 10 10 10 10 10
Total Pearson Correlation .901** .675* .261 .696* .870** .756* .592 .215 .465 .576 1
Sig. (2-tailed) .000 .032 .467 .025 .001 .011 .071 .552 .176 .081
N 10 10 10 10 10 10 10 10 10 10 10
**. Correlation is significant at the 0.01 level (2-tailed).
*. Correlation is significant at the 0.05 level (2-tailed).

66
Draft questionnaire before the validity & realibility test (Indonesian Version)
5 = Sangat Setuju 4 = setuju 3 = netral 2 = tidak setuju 1 = sangat tidak setuju
PRODUCT
1 Bentuk mobil Chery QQ tidak ketinggalan jaman, stylish, aerodinamis.
Nilai Anda
2 Kualitas mobil Chery QQ memuaskan
Nilai Anda
3 Features yang diberikan telah sesuai dengan harapan
Nilai Anda
4 Merk Chery QQ cukup dikenal masyarakat
Nilai Anda
5 Chery QQ memiliki pilihan jenis dan warna yang cukup menarik
Nilai Anda
6 Konsumsi bahan bakar Chery QQ effisien/irit
Nilai Anda
7 Mesin Chery QQ bandel, gesit
Nilai Anda
8 Suspensi Chery QQ empuk dan stabil
Nilai Anda
9 Warna dan design Chery QQ sangat menarik perhatian
Nilai Anda
10 Chery QQ memiliki beberapa variant atau jenis yang sangat menarik
Nilai Anda
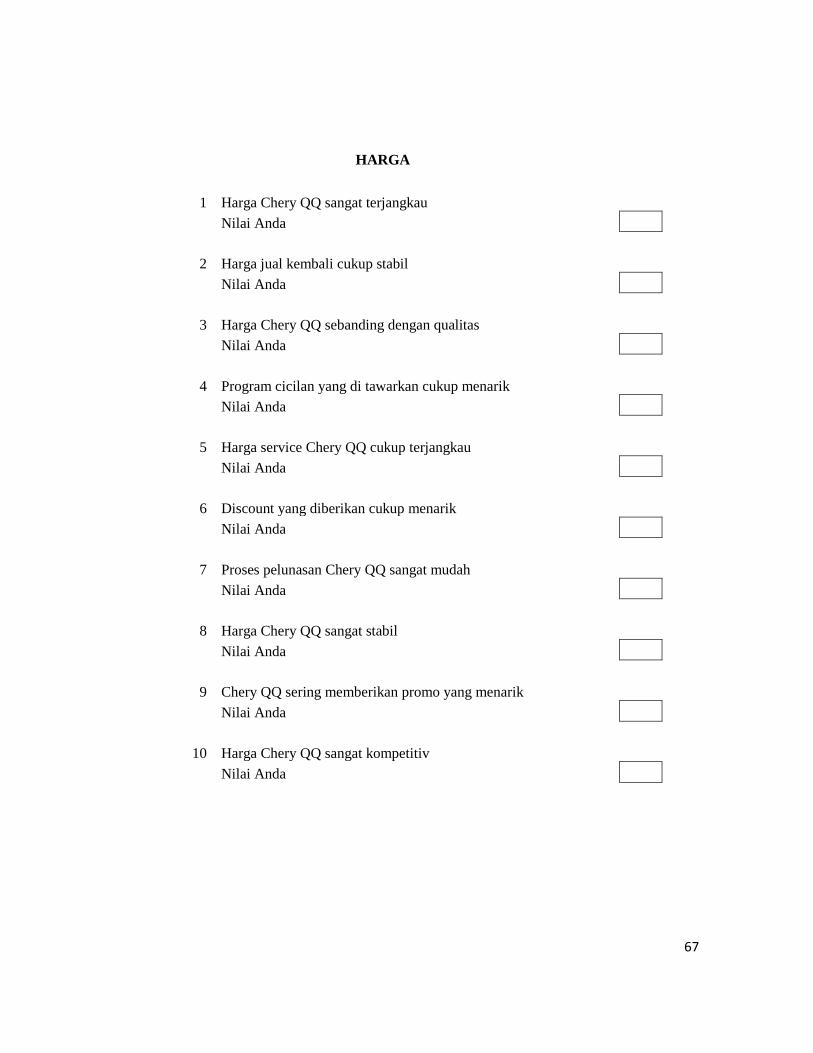
67
HARGA
1 Harga Chery QQ sangat terjangkau
Nilai Anda
2 Harga jual kembali cukup stabil
Nilai Anda
3 Harga Chery QQ sebanding dengan qualitas
Nilai Anda
4 Program cicilan yang di tawarkan cukup menarik
Nilai Anda
5 Harga service Chery QQ cukup terjangkau
Nilai Anda
6 Discount yang diberikan cukup menarik
Nilai Anda
7 Proses pelunasan Chery QQ sangat mudah
Nilai Anda
8 Harga Chery QQ sangat stabil
Nilai Anda
9 Chery QQ sering memberikan promo yang menarik
Nilai Anda
10 Harga Chery QQ sangat kompetitiv
Nilai Anda
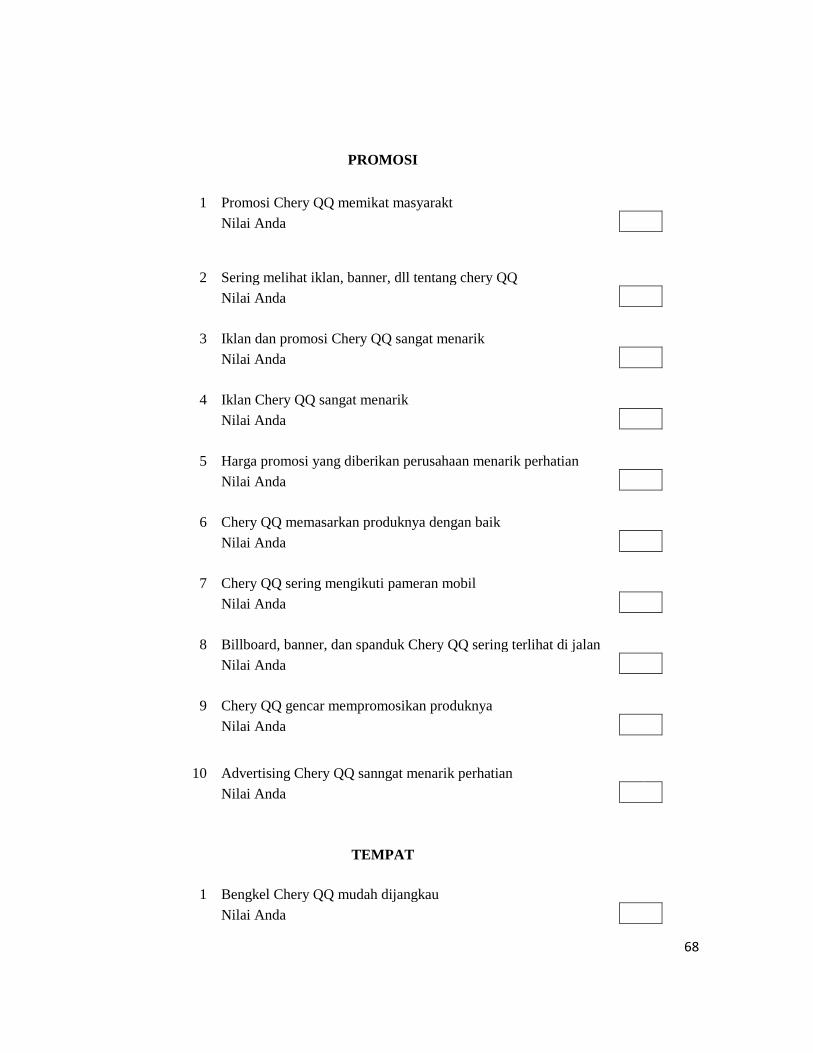
68
PROMOSI
1 Promosi Chery QQ memikat masyarakt
Nilai Anda
2 Sering melihat iklan, banner, dll tentang chery QQ
Nilai Anda
3 Iklan dan promosi Chery QQ sangat menarik
Nilai Anda
4 Iklan Chery QQ sangat menarik
Nilai Anda
5 Harga promosi yang diberikan perusahaan menarik perhatian
Nilai Anda
6 Chery QQ memasarkan produknya dengan baik
Nilai Anda
7 Chery QQ sering mengikuti pameran mobil
Nilai Anda
8 Billboard, banner, dan spanduk Chery QQ sering terlihat di jalan
Nilai Anda
9 Chery QQ gencar mempromosikan produknya
Nilai Anda
10 Advertising Chery QQ sanngat menarik perhatian
Nilai Anda
TEMPAT
1 Bengkel Chery QQ mudah dijangkau
Nilai Anda

69
2 Suku Cadang mudah didapat dan harga murah
Nilai Anda
3 Pusat penjualan dan perawatan tidak sulit ditemui
Nilai Anda
4 Show room Chery QQ berada di kota-kota besar, sehingga mudah untuk ditemui
Nilai Anda
5 Service Chery QQ tidak memakan waktu yang lama
Nilai Anda
6 Tempat service Chery berada di kota-kota besar, sehingga mudah dijangkau
Nilai Anda
7 Pusat penjualan dan perawatan tersebar di seluruh pelosok Indonesia
Nilai Anda
8 Chery QQ memiliki bengkel yang tersebar di seluruh kota besar di Indonesia
Nilai Anda
9 Customer Chery QQ dapat dengan mudah menemukan tempat service mobil tersebut
Nilai Anda
10 Chery QQ memudahkan customer dalam menemukan tempat service
Nilai Anda
Overall
1 Secara keseluruhan Chery QQ sangat nyaman dan saya puas menggunakan Chery QQ
Nilai Anda

70
Valid Questionnaire (Indonesian Version)
Berilah nilai dari 1 - 5 dari pertanyaan berikut. 5 = Sangat Setuju 4 = setuju 3 = netral 2 = tidak setuju 1 = sangat tidak setuju
PRODUCT
1 Bentuk mobil Chery QQ tidak ketinggalan jaman, stylish, aerodinamis.
Nilai Anda
2 Kualitas mobil Chery QQ memuaskan
Nilai Anda
3 Merk Chery QQ cukup dikenal masyarakat
Nilai Anda
4 Konsumsi bahan bakar Chery QQ effisien/irit
Nilai Anda
5 Chery QQ memiliki beberapa variant atau jenis yang sangat menarik
Nilai Anda
HARGA
1 Harga Chery QQ sangat terjangkau
Nilai Anda
2 Harga jual kembali cukup stabil
Nilai Anda
3 Harga Chery QQ sebanding dengan qualitas
Nilai Anda
4 Harga service Chery QQ cukup terjangkau
Nilai Anda
5 Harga Chery QQ sangat kompetitiv
Nilai Anda

71
PROMOSI
1 Promosi Chery QQ memikat masyarakt
Nilai Anda
2 Iklan Chery QQ sangat menarik
Nilai Anda
3 Harga promosi yang diberikan perusahaan menarik perhatian
Nilai Anda
4 Chery QQ sering mengikuti pameran mobil
Nilai Anda
5 Chery QQ gencar mempromosikan produknya
Nilai Anda
TEMPAT
1 Bengkel Chery QQ mudah dijangkau
Nilai Anda
2 Suku Cadang mudah didapat dan harga murah
Nilai Anda
3. Show room Chery QQ berada di kota-kota besar, sehingga mudah untuk ditemui
Nilai Anda
4 Service Chery QQ tidak memakan waktu yang lama
Nilai Anda
5 Tempat service Chery berada di kota-kota besar, sehingga mudah dijangkau
Nilai Anda
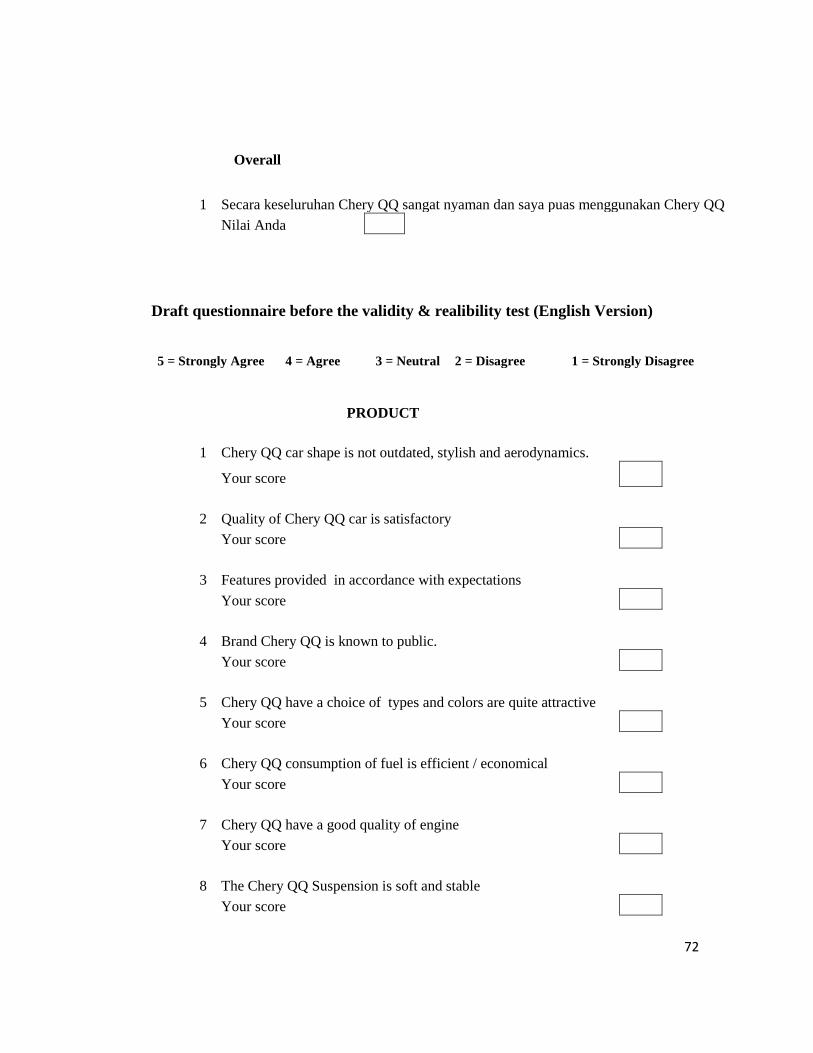
72
Overall
1 Secara keseluruhan Chery QQ sangat nyaman dan saya puas menggunakan Chery QQ
Nilai Anda
Draft questionnaire before the validity & realibility test (English Version)
5 = Strongly Agree 4 = Agree 3 = Neutral 2 = Disagree 1 = Strongly Disagree
PRODUCT
1 Chery QQ car shape is not outdated, stylish and aerodynamics.
Your score
2 Quality of Chery QQ car is satisfactory
Your score
3 Features provided in accordance with expectations
Your score
4 Brand Chery QQ is known to public.
Your score
5 Chery QQ have a choice of types and colors are quite attractive
Your score
6 Chery QQ consumption of fuel is efficient / economical
Your score
7 Chery QQ have a good quality of engine
Your score
8 The Chery QQ Suspension is soft and stable
Your score
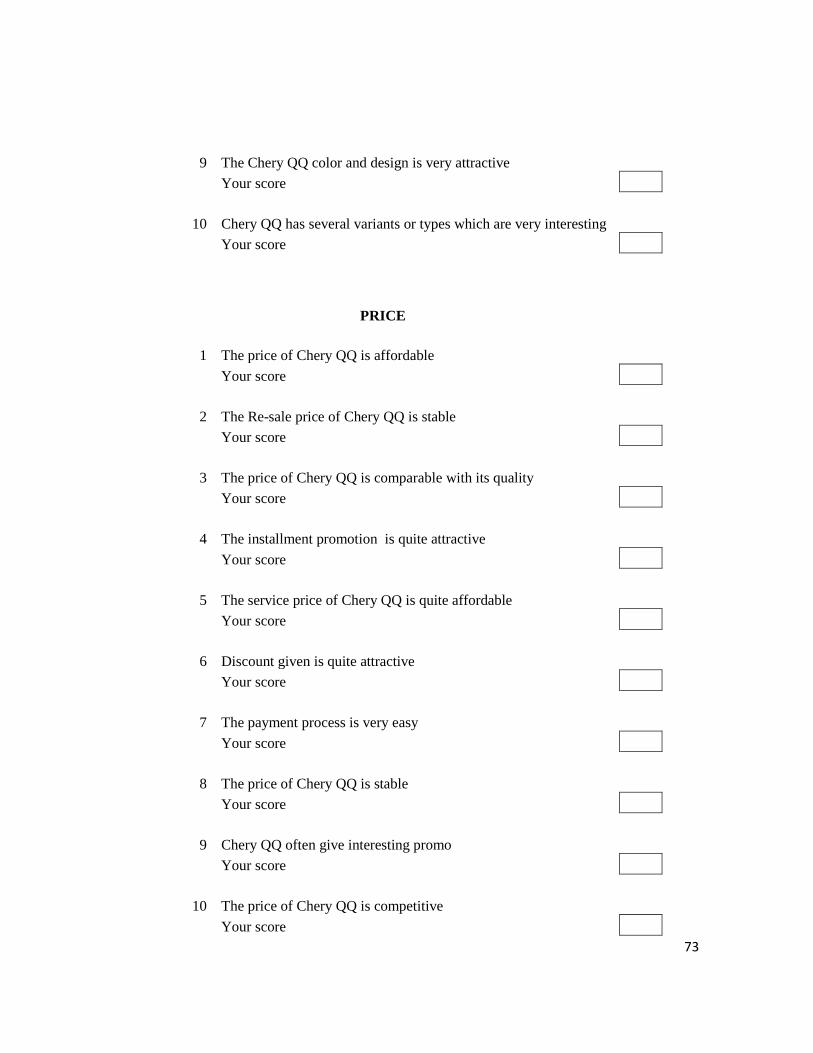
73
9 The Chery QQ color and design is very attractive
Your score
10 Chery QQ has several variants or types which are very interesting
Your score
PRICE
1 The price of Chery QQ is affordable
Your score
2 The Re-sale price of Chery QQ is stable
Your score
3 The price of Chery QQ is comparable with its quality
Your score
4 The installment promotion is quite attractive
Your score
5 The service price of Chery QQ is quite affordable
Your score
6 Discount given is quite attractive
Your score
7 The payment process is very easy
Your score
8 The price of Chery QQ is stable
Your score
9 Chery QQ often give interesting promo
Your score
10 The price of Chery QQ is competitive
Your score
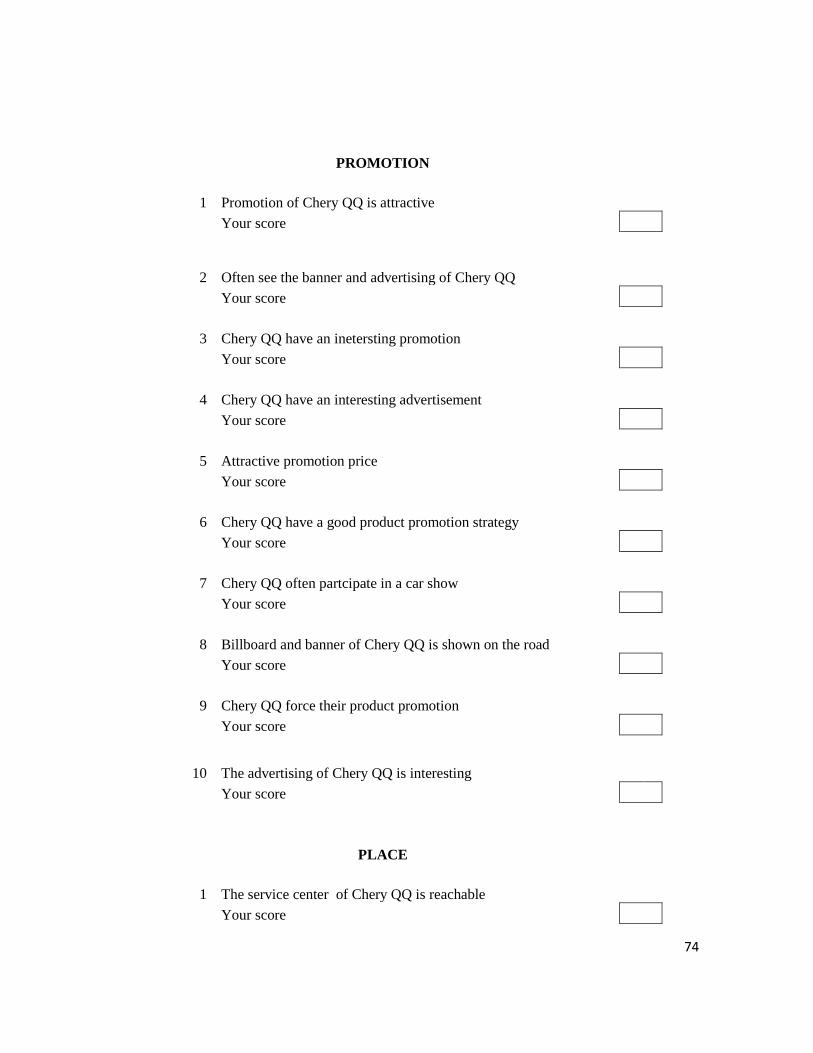
74
PROMOTION
1 Promotion of Chery QQ is attractive
Your score
2 Often see the banner and advertising of Chery QQ
Your score
3 Chery QQ have an inetersting promotion
Your score
4 Chery QQ have an interesting advertisement
Your score
5 Attractive promotion price
Your score
6 Chery QQ have a good product promotion strategy
Your score
7 Chery QQ often partcipate in a car show
Your score
8 Billboard and banner of Chery QQ is shown on the road
Your score
9 Chery QQ force their product promotion
Your score
10 The advertising of Chery QQ is interesting
Your score
PLACE
1 The service center of Chery QQ is reachable
Your score

75
2 Spareparts of Chery QQ is easily available and cheap
Your score
3 Sales and maintenance center is not difficult to find
Your score
4 Chery QQ showrrom located in major cities, making it easy to find
Your score
5 Chery QQ service does not take too long time
Your score
6 Chery service places in big cities, so its easy to reach
Your score
7 Sales and maintenance center spread all over Indonesia
Your score
8 Chery QQ have a garage that spread across major city in Indonesia
Your score
9 Customers Chery QQ can easily find the service place fpr the car
Your score
10 Chery QQ facilitate customers in finding the service place
Your score
Overall
1 Overall Chery QQ is very comfortable , and I am comfortable for using this car
Your score

76
Valid Questionnaire (Indonesian Version)
Berilah nilai dari 1 - 5 dari pertanyaan berikut. 5 = Sangat Setuju 4 = setuju 3 = netral 2 = tidak setuju 1 = sangat tidak setuju
PRODUCT
1 Bentuk mobil Chery QQ tidak ketinggalan jaman, stylish, aerodinamis.
Nilai Anda
2 Kualitas mobil Chery QQ memuaskan
Nilai Anda
3 Merk Chery QQ cukup dikenal masyarakat
Nilai Anda
4 Konsumsi bahan bakar Chery QQ effisien/irit
Nilai Anda
5 Chery QQ memiliki beberapa variant atau jenis yang sangat menarik
Nilai Anda
HARGA
1 Harga Chery QQ sangat terjangkau
Nilai Anda
2 Harga jual kembali cukup stabil
Nilai Anda
3 Harga Chery QQ sebanding dengan qualitas
Nilai Anda

77
4 Harga service Chery QQ cukup terjangkau
Nilai Anda
5 Harga Chery QQ sangat kompetitiv
Nilai Anda
PROMOSI
1 Promosi Chery QQ memikat masyarakt
Nilai Anda
2 Iklan Chery QQ sangat menarik
Nilai Anda
3 Harga promosi yang diberikan perusahaan menarik perhatian
Nilai Anda
4 Chery QQ sering mengikuti pameran mobil
Nilai Anda
5 Chery QQ gencar mempromosikan produknya
Nilai Anda
TEMPAT
1 Bengkel Chery QQ mudah dijangkau
Nilai Anda
2 Suku Cadang mudah didapat dan harga murah
Nilai Anda
1. Show room Chery QQ berada di kota-kota besar, sehingga mudah untuk ditemui
Nilai Anda
4 Service Chery QQ tidak memakan waktu yang lama
Nilai Anda
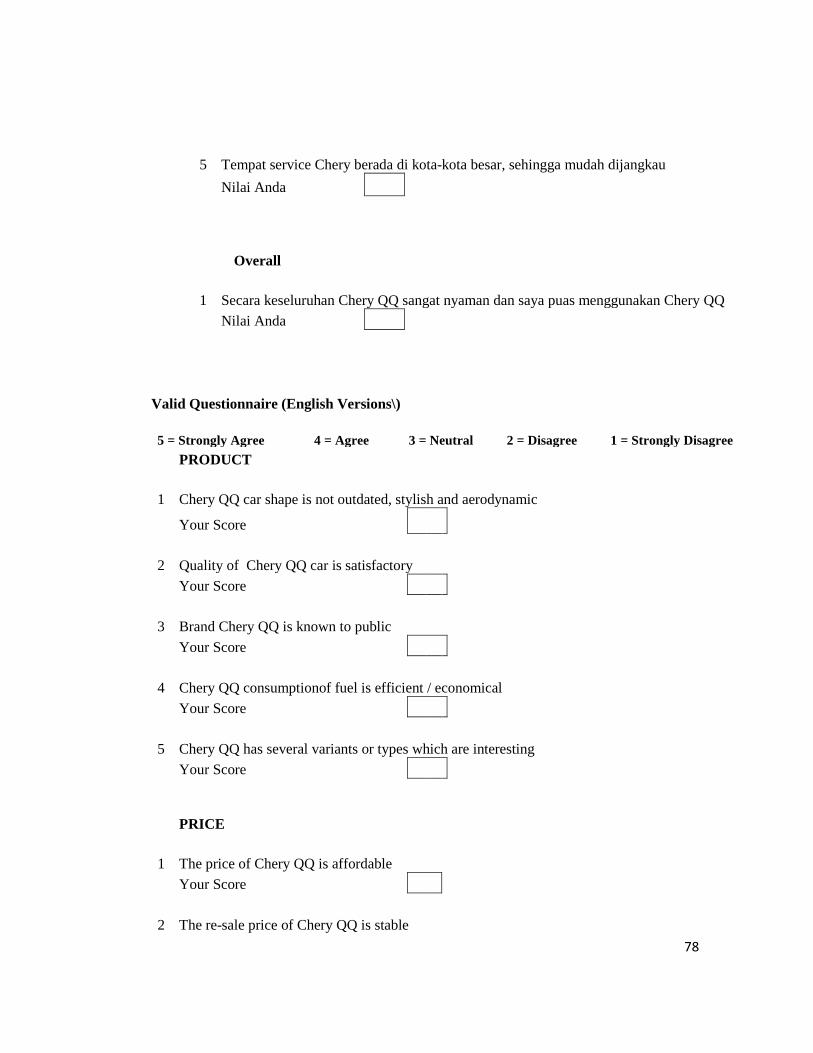
78
5 Tempat service Chery berada di kota-kota besar, sehingga mudah dijangkau
Nilai Anda
Overall
1 Secara keseluruhan Chery QQ sangat nyaman dan saya puas menggunakan Chery QQ
Nilai Anda
Valid Questionnaire (English Versions\)
5 = Strongly Agree 4 = Agree 3 = Neutral 2 = Disagree 1 = Strongly Disagree
PRODUCT
1 Chery QQ car shape is not outdated, stylish and aerodynamic
Your Score
2 Quality of Chery QQ car is satisfactory
Your Score
3 Brand Chery QQ is known to public
Your Score
4 Chery QQ consumptionof fuel is efficient / economical
Your Score
5 Chery QQ has several variants or types which are interesting
Your Score
PRICE
1 The price of Chery QQ is affordable
Your Score
2 The re-sale price of Chery QQ is stable
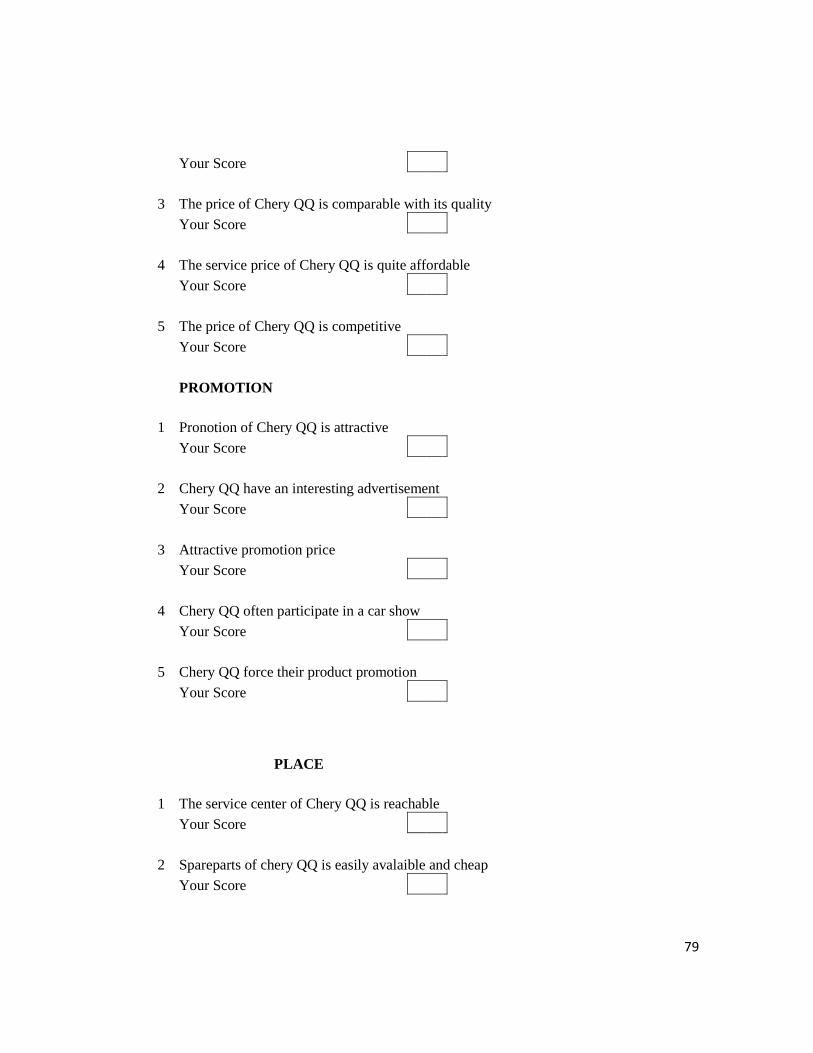
79
Your Score
3 The price of Chery QQ is comparable with its quality
Your Score
4 The service price of Chery QQ is quite affordable
Your Score
5 The price of Chery QQ is competitive
Your Score
PROMOTION
1 Pronotion of Chery QQ is attractive
Your Score
2 Chery QQ have an interesting advertisement
Your Score
3 Attractive promotion price
Your Score
4 Chery QQ often participate in a car show
Your Score
5 Chery QQ force their product promotion
Your Score
PLACE
1 The service center of Chery QQ is reachable
Your Score
2 Spareparts of chery QQ is easily avalaible and cheap
Your Score

80
3 Chery QQ's showroom located in major cities, making it easy to find
Your Score
4 Chery QQ service does not take too long time
Your Score
5 Chery QQ service places in a big cities, so it easy to reach
Your Score
Overall
1 Overal Chery QQ is very comfortable and I am comfortable for using this car
Your Score
RAW DATA PRODUCT VARIABLE x1 x2 x3 x4 x5 1 2 2 3 2 3 2 1 3 4 3 3 3 2 2 3 3 2 4 3 2 3 4 4 5 2 3 4 2 3 6 2 1 1 1 1 7 3 3 2 5 1 8 4 4 2 1 1 9 2 1 2 2 2 10 1 5 2 1 1 11 4 5 1 2 3 12 2 4 2 1 2 13 5 2 2 3 2 14 2 3 2 1 2 15 3 1 2 2 3 16 2 2 2 2 2 17 1 2 1 1 2 18 2 4 2 3 2

81
19 3 4 2 2 2 20 4 4 2 1 2 21 2 3 1 1 4 22 1 3 4 2 3 23 2 4 3 2 2 24 3 2 2 2 2 25 4 2 2 4 2 26 2 2 2 2 1 27 4 2 3 2 2 28 5 3 4 5 4 29 2 3 4 3 4 30 2 2 4 3 2 31 3 4 2 2 4 32 2 2 4 3 3 33 4 4 3 2 2 34 2 2 3 2 2 35 1 3 3 2 2 36 2 2 3 2 2 37 4 1 1 2 1 38 2 2 2 1 1 39 1 2 1 1 1 40 1 1 1 3 2 41 4 2 2 2 1 42 2 3 3 2 2 43 2 2 3 3 2 44 3 2 1 4 3 45 2 5 4 3 3 46 2 3 4 2 2 47 2 3 3 2 2 48 4 3 2 1 1 49 3 1 2 3 3 50 2 4 3 3 2 51 3 1 2 2 4 52 3 3 3 3 3 53 1 2 2 2 1 54 1 2 2 2 2 55 2 3 3 1 2 56 2 3 2 3 1

82
57 3 2 3 2 2 58 4 3 3 1 1 59 2 2 3 2 1 60 2 2 2 1 1 61 3 2 2 1 3 62 2 2 2 1 2 63 2 3 1 1 4 64 3 3 2 1 1 65 1 3 2 2 2 66 4 2 2 1 1 67 3 2 1 1 1 68 2 2 1 1 3 69 1 1 3 2 2 70 1 1 3 2 3 71 1 1 1 2 2 72 1 1 2 2 3 73 2 3 1 2 3 74 2 1 1 1 3
RAW DATA PRICE VARIABLE x1 x2 x3 x4 x5 1 5 4 4 1 4 2 5 5 4 4 4 3 5 4 5 4 4 4 4 4 5 3 3 5 5 4 3 2 3 6 4 4 4 2 3 7 3 3 3 2 3 8 2 2 2 2 2 9 4 4 4 3 2 10 5 5 5 2 4 11 5 4 3 4 5 12 5 4 4 4 4 13 4 4 5 5 4 14 5 4 3 5 4 15 4 5 4 3 5 16 3 4 4 4 4
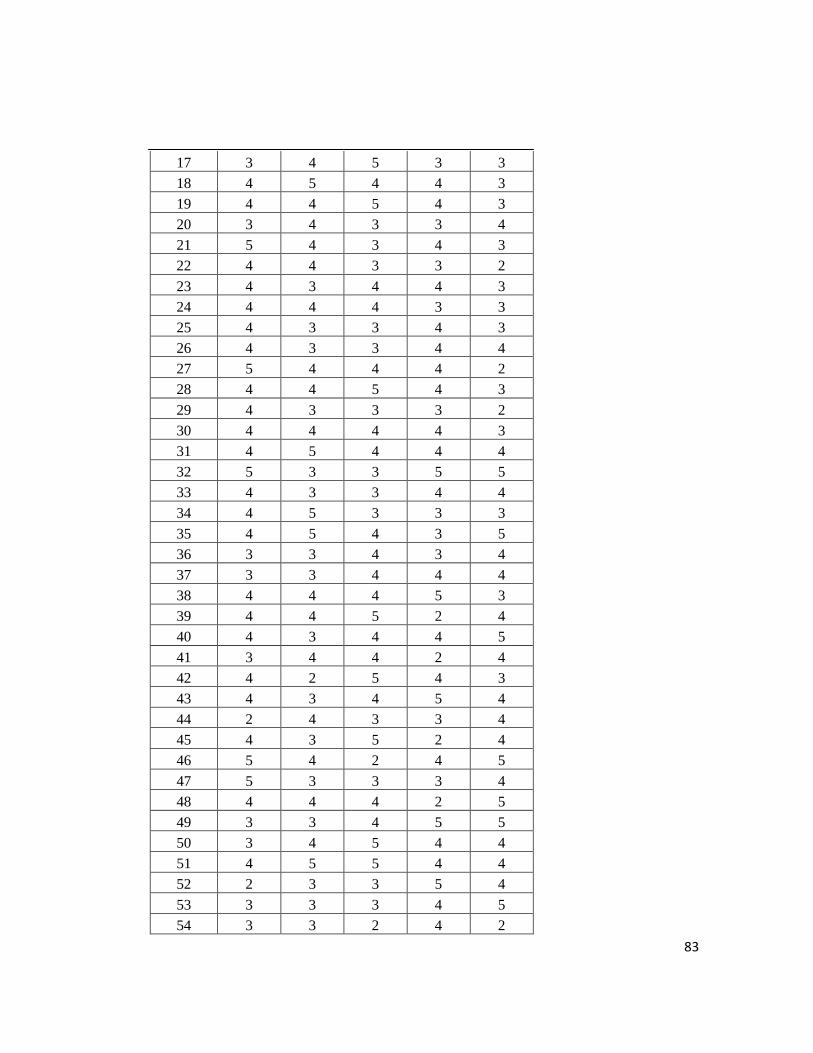
83
17 3 4 5 3 3 18 4 5 4 4 3 19 4 4 5 4 3 20 3 4 3 3 4 21 5 4 3 4 3 22 4 4 3 3 2 23 4 3 4 4 3 24 4 4 4 3 3 25 4 3 3 4 3 26 4 3 3 4 4 27 5 4 4 4 2 28 4 4 5 4 3 29 4 3 3 3 2 30 4 4 4 4 3 31 4 5 4 4 4 32 5 3 3 5 5 33 4 3 3 4 4 34 4 5 3 3 3 35 4 5 4 3 5 36 3 3 4 3 4 37 3 3 4 4 4 38 4 4 4 5 3 39 4 4 5 2 4 40 4 3 4 4 5 41 3 4 4 2 4 42 4 2 5 4 3 43 4 3 4 5 4 44 2 4 3 3 4 45 4 3 5 2 4 46 5 4 2 4 5 47 5 3 3 3 4 48 4 4 4 2 5 49 3 3 4 5 5 50 3 4 5 4 4 51 4 5 5 4 4 52 2 3 3 5 4 53 3 3 3 4 5 54 3 3 2 4 2

84
55 4 4 4 5 4 56 3 4 2 3 4 57 3 2 3 3 4 58 3 3 3 3 4 59 4 3 4 3 3 60 3 4 4 4 4 61 4 3 3 3 5 62 2 4 2 4 4 63 5 4 4 5 5 64 5 4 4 3 4 65 3 4 5 4 5 66 3 4 2 5 4 67 4 3 3 3 3 68 2 4 4 5 4 69 4 5 4 2 3 70 3 3 4 5 4 71 4 3 3 4 1 72 5 5 4 4 4 73 4 2 3 3 5 74 5 4 5 5 4
RAW DATA PROMOTION VARIABLE x1 x2 x3 x4 x5 1 2 1 1 1 1 2 2 2 1 1 2 3 1 1 1 2 4 4 2 2 2 2 2 5 2 1 2 1 2 6 2 2 2 2 2 7 3 2 3 2 2 8 2 2 1 2 3 9 3 1 2 1 1 10 2 2 1 2 2 11 1 1 1 1 1 12 2 2 2 2 2 13 1 1 1 1 1 14 1 1 1 1 1

85
15 2 2 2 2 2 16 1 2 2 1 1 17 1 2 2 2 2 18 2 2 1 1 1 19 1 2 2 2 2 20 1 1 1 1 1 21 1 1 1 2 2 22 2 2 2 2 1 23 1 2 2 2 1 24 2 2 2 2 2 25 1 1 1 1 1 26 1 2 2 2 2 27 1 1 2 1 2 28 1 2 2 1 1 29 1 2 1 2 2 30 1 1 2 2 2 31 1 1 1 1 2 32 2 2 2 2 2 33 2 1 1 1 2 34 2 2 2 2 2 35 1 1 1 1 1 36 2 2 2 2 2 37 1 2 1 1 2 38 1 1 1 1 2 39 3 2 2 2 2 40 1 1 2 2 2 41 3 2 2 2 1 42 2 2 3 3 2 43 2 2 2 1 1 44 2 3 2 2 2 45 2 1 1 3 3 46 2 2 2 2 2 47 1 2 1 2 2 48 3 1 2 1 2 49 2 2 1 1 1 50 2 1 1 2 3 51 1 1 1 2 2 52 2 2 2 3 2
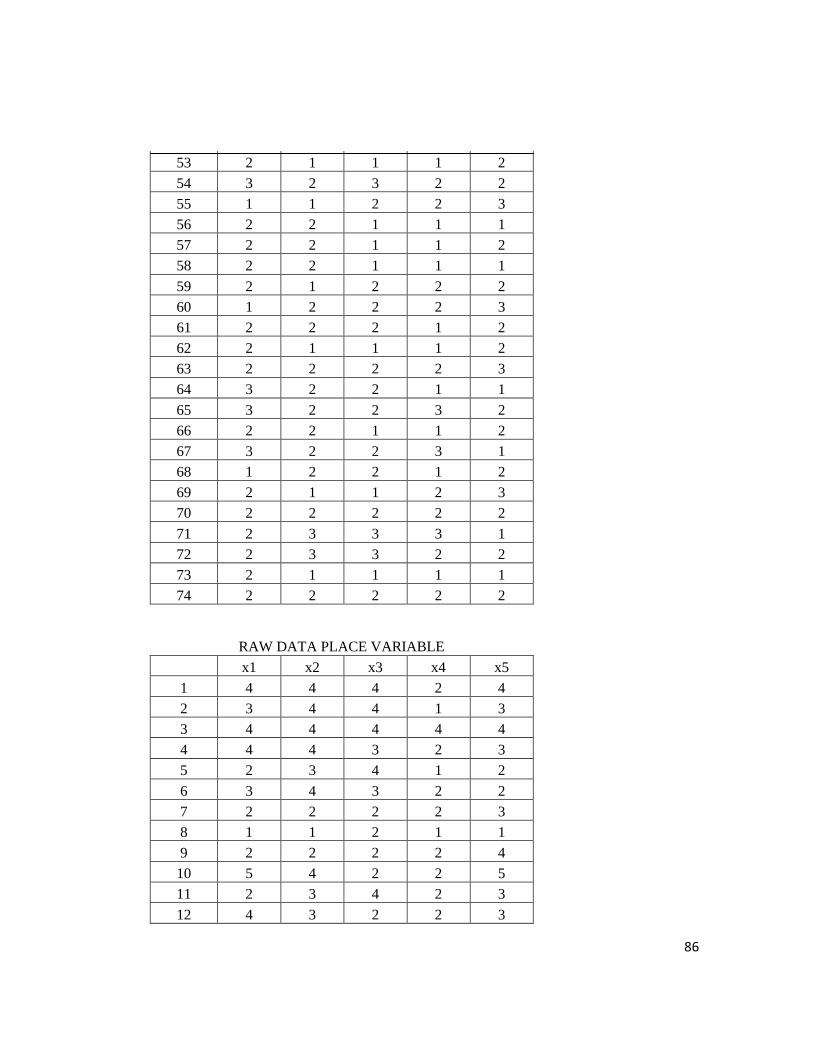
86
53 2 1 1 1 2 54 3 2 3 2 2 55 1 1 2 2 3 56 2 2 1 1 1 57 2 2 1 1 2 58 2 2 1 1 1 59 2 1 2 2 2 60 1 2 2 2 3 61 2 2 2 1 2 62 2 1 1 1 2 63 2 2 2 2 3 64 3 2 2 1 1 65 3 2 2 3 2 66 2 2 1 1 2 67 3 2 2 3 1 68 1 2 2 1 2 69 2 1 1 2 3 70 2 2 2 2 2 71 2 3 3 3 1 72 2 3 3 2 2 73 2 1 1 1 1 74 2 2 2 2 2
RAW DATA PLACE VARIABLE x1 x2 x3 x4 x5 1 4 4 4 2 4 2 3 4 4 1 3 3 4 4 4 4 4 4 4 4 3 2 3 5 2 3 4 1 2 6 3 4 3 2 2 7 2 2 2 2 3 8 1 1 2 1 1 9 2 2 2 2 4 10 5 4 2 2 5 11 2 3 4 2 3 12 4 3 2 2 3
87
13 2 3 4 4 5 14 3 2 4 5 3 15 3 3 4 4 3 16 4 3 3 3 4 17 4 3 3 3 3 18 3 4 5 3 3 19 3 3 3 2 2 20 4 3 2 3 3 21 4 3 3 4 3 22 3 3 2 2 3 23 3 4 4 3 4 24 3 3 2 2 3 25 4 4 3 3 3 26 3 2 2 2 3 27 3 4 4 3 3 28 3 4 2 2 2 29 3 3 3 4 4 30 4 3 2 2 3 31 3 2 2 3 4 32 4 3 3 2 3 33 2 2 3 3 4 34 3 4 3 4 3 35 3 3 2 2 2 36 3 4 4 4 3 37 3 3 2 2 2 38 3 3 4 3 3 39 3 2 2 2 3 40 2 2 2 3 4 41 3 3 4 2 4 42 4 4 3 3 3 43 4 3 3 3 3 44 3 3 3 4 4 45 4 3 4 4 4 46 4 4 3 3 3 47 5 3 4 5 5 48 5 5 4 4 4 49 4 5 4 4 3 50 3 5 5 4 3

88
51 3 5 5 5 4 52 4 3 3 4 5 53 2 2 3 3 4 54 4 4 5 5 4 55 3 4 4 5 3 56 3 3 3 3 5 57 4 2 3 3 5 58 3 3 3 4 4 59 3 4 3 4 3 60 4 3 4 5 3 61 3 3 3 4 3 62 3 3 3 4 3 63 4 3 5 4 4 64 4 2 3 3 3 65 3 5 5 3 4 66 4 3 3 2 3 67 3 3 2 5 3 68 3 4 4 5 3 69 2 5 5 3 5 70 3 4 5 5 5 71 4 5 5 3 4 72 3 5 5 3 3 73 2 1 1 1 1 74 2 2 2 2 2
Model Summaryb
Model R R Square Adjusted R Square
Std. Error of the
Estimate Durbin-Watson
1 .364a .132 .082 .69177 1.062
a. Predictors: (Constant), x4, x3, x1, x2
b. Dependent Variable: Dependent

89
ANOVAb
Model Sum of Squares df Mean Square F Sig.
1 Regression 5.034 4 1.259 2.630 .042a
Residual 33.020 69 .479
Total 38.054 73
a. Predictors: (Constant), x4, x3, x1, x2
b. Dependent Variable: Y
Coefficientsa
Model
Unstandardized Coefficients
Standardized
Coefficients
t Sig. B Std. Error Beta
1 (Constant) 1.915 .681 2.814 .006
x1 .470 .166 .328 2.841 .006
x2 .155 .159 .116 .975 .333
x3 .116 .177 .074 .657 .513
x4 -.071 .128 -.066 -.557 .579
a. Dependent Variable: Y

90

91