strategy update - amazon web servicesintertek-cdn.s3.amazonaws.com/ · strategy update 2 march 2016...
TRANSCRIPT

www.intertek.com
Strategy Update
2 March 2016
André Lacroix
Chief Executive Officer
Portfolio Focus on Attractive
Growth and Margin Opportunities

2
Disclaimer
This presentation contains certain forward-looking statements with respect to the financial
condition, results, operations and business of Intertek Group plc.
These statements and forecasts involve risk and uncertainty because they relate to events
and depend upon circumstances that will occur in the future.
There are a number of factors that could cause actual results or developments to differ
materially from those expressed or implied by these forward-looking statements and
forecasts.
Nothing in this presentation should be construed as a profit forecast.
2 March 2016

www.intertek.com
Intertek 5 Fundamental Strengths
Attractive Growth Opportunities
Intertek Quality Assurance Proposition
Strategy for Sustainable Growth
Short Term Priorities in 2016
Agenda
01
02
03
04
05
www.intertek.com
Intertek 5
Fundamental
Strengths
01
Video: Looking Back at Our History

5
Track Record of Sustainable Growth
Revenue
Operating Profit
2002 2015 Change
11,192 41,434 +30,242
£461m £2,166m +£1,705m
£77m £343m +£266m
£0.6bn¹ £4.5bn +£3.9bn
864%²
Market Cap
TSR
1 As at IPO 29 May 2002
² TSR since IPO to 31 December 2015
Employees

6
5 Fundamental Strengths
Global Network of State of the
Art Facilities
Powerful Portfolio with Leadership
Positions
Depth and Breadth of Quality
Assurance Solutions
Passionate and
Entrepreneurial Culture
High Margin and Strongly Cash
Generative Earnings Model
01
02
03
04
05

7
Powerful Portfolio with Leadership Positions
• Softlines
• Hardlines
• Electrical and Wireless
• Business Assurance
• Government and Trade Services
• Cargo and Analytical Assessment
• Agriculture
• Industry Services
8 Global Business Lines (GBLs)
• Transportation Technologies
• Building Products
• Food
• Product Assurance
• Minerals
• Health, Environmental and Regulatory Services
• Chemicals and Pharma
• Exploration and Production
8 Regional Business Lines (RBLs)
£1,670m 2015 Revenue
77% of Group Revenue
£496m 2015 Revenue
23% of Group Revenue
Regional scale and strength
Attractive regional growth prospects
Global scale and
leadership positions
Attractive global growth prospects

8
Scale Positions in Top 30 Countries
Top 30 Countries
92%
of Intertek Revenue
80%
of Global GDP
76%
of Global Trade
91%
of Global Production
Brazil
Canada
Mexico
USA
Americas EMEA (Europe, Middle East & Africa)
Asia Pacific
Belgium
France
Germany
Italy
Netherlands
Norway
South Africa
Sweden
Switzerland
Turkey
UAE
UK
Australia
Bangladesh
China
Hong Kong
India
Indonesia
Japan
Korea
Malaysia
Philippines
Singapore
Taiwan
Thailand
Vietnam

9
Strong Portfolio at Local Business Unit Level
8 Global Business Lines 8 Regional Business Lines
Softlines Hardlines Electrical &
Wireless
Business
Assurance
GTS Cargo
& AA
Agriculture Industry
Services
Food Building
Products
Trans.
Tech
Product
Assurance
Minerals HERS C&P E&P
To
p 3
0 C
ou
ntr
ies
Australia
Bangladesh
Belgium
Brazil
Canada
China
France
Germany
Hong Kong
India
Indonesia
Italy
Japan
Korea
Malaysia
Mexico
Netherlands
Norway
Philippines
Singapore
South Africa
Sweden
Switzerland
Taiwan
Thailand
Turkey
UAE
UK
USA
Vietnam
• In-depth portfolio review
• C. 300 business units
• High quality portfolio
• Positioned strongly for growth

10
Balance Sheet
Revenue £2bn+
c. 20%
140%
5% of Revenue
c. 40%
£150m
1.7x Net Debt to EBITDA
High Quality Earnings Model ¹
EBITDA Margin
Cash Conversion²
Capex
Dividend Payout
FCF³
1 Based on 2015 Actuals
² Cash from operations
³ After Capex and Dividends

Attractive Growth
Opportunities
02
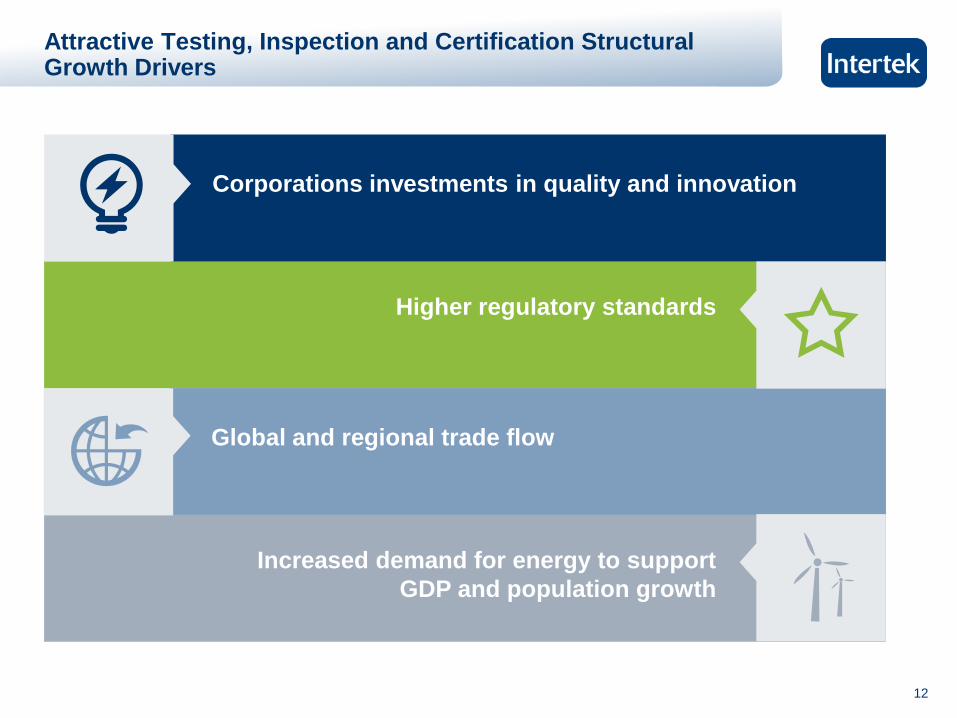
12
Higher regulatory standards
Corporations investments in quality and innovation
Attractive Testing, Inspection and Certification Structural Growth Drivers
Global and regional trade flow
Increased demand for energy to support
GDP and population growth

13
Customers Expect Total Quality Assurance
• Quality and safety of physical components, products and assets
• Reliability of operating processes and quality management systems
Assurance Structural Growth Drivers
• Increasingly complex operations with decentralised supply chains
• Greater customer focus on risk management to manage systemic operational risk
• Customers require Quality Assurance solutions beyond TIC
Attractive Assurance Structural Growth Drivers
Industry Evolution From “TIC” to “ATIC”
Certification Assurance Testing Inspection
Video: The Future of Our Industry

14
Global Intertek Network Strongly Positioned for ATIC Growth
Global Market
Leader in TIC
1,000+
lab and offices
100+
countries
Global ATIC Business with 41,434 Employees
Global Market Leader in
Assurance
3,000
auditors
90,000+
audits

15
Long-term growth
Capex & opex investment
supporting world economic growth
Servicing oil & gas and other sectors of
the economy 10%
Structural Growth Drivers Mid-Long Term
Growth
‘Global GDP Plus’ Organic Revenue
Growth
Profit Mix1
68%
Continuing growth
from expanding
investment in
quality & innovation
Quality solutions for end-products, their
components, processes and R&D
Product variety, brand and supply chain
expansion, innovation and regulations
Increasing quality and sustainability
demands by developed and emerging
economies
Increased Corporate focus on risk
22% Trade-flow growth:
global & regional
Global and regional trade-driven, through
GDP growth
Increased customer focus on quality and
quantity controls
(1) 2015 adjusted operating profit. (2) 2015 revenues
Portfolio Geared for GDP+ Organic Growth
Products
CG, C&E, C&P, Food &
Business Assurance
51% Revenue
Trade
Cargo & Analytical,
Government Services
& Agri
25% Revenue
Resources
Industry Services &
Minerals
24% Revenue
Economic Sectors
2
2
2

Intertek Quality
Assurance
Proposition
03
17
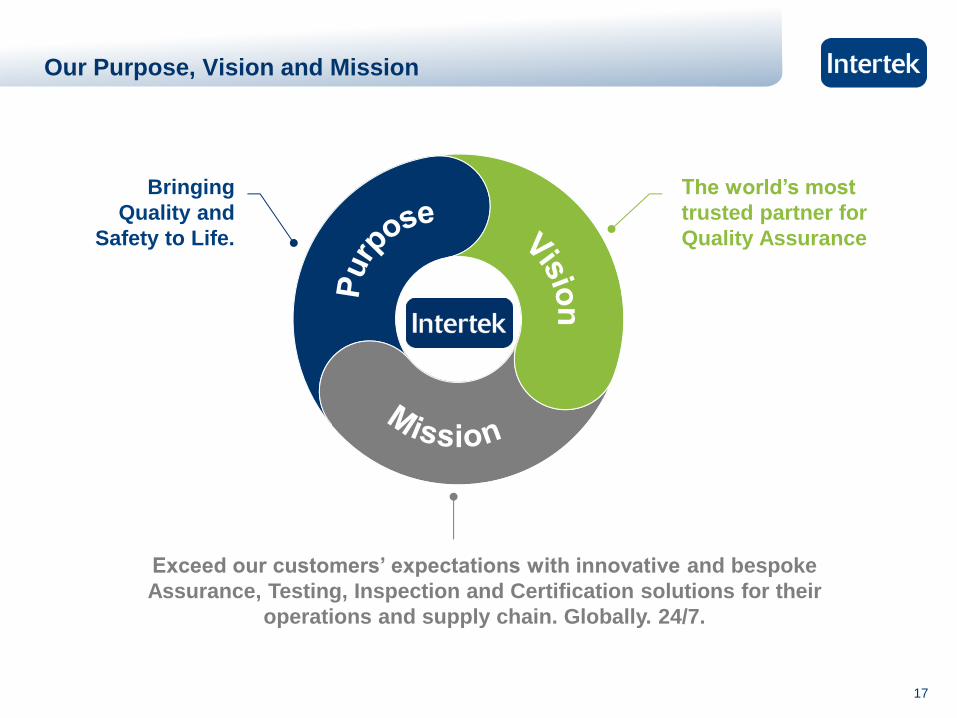
Our Purpose, Vision and Mission
Bringing
Quality and
Safety to Life.
The world’s most
trusted partner for
Quality Assurance
Exceed our customers’ expectations with innovative and bespoke
Assurance, Testing, Inspection and Certification solutions for their
operations and supply chain. Globally. 24/7.

18
Strong Business Model to Seize Growth Opportunities
What We Do Everyday Which Economic
Sectors Where
Assurance
Testing
Inspection
Certification
Products
Trade
Resources
100+ countries
1,000+ laboratories
41,434 people

19
Well Diversified Revenue Streams Across Sectors, Geographies and Services
35%
36%
29%
Americas Asia Pacific EMEA
10%
52%
30%
8%
Assurance Testing Inspection Certification
51%
25%
24%
Products Trade Resources
Sector Geographic Service
Revenue Split¹
• Largest by Revenues
• Highest margin
• Fastest organic growth
• Asia Pacific largest
• Americas strong position
• Good exposure to fast
growing markets
• Testing largest service
offering
• Assurance fastest
growing
Strength in Products
Excellent exposure to fast
growing markets
Breadth and Depth of ATIC
Solutions
(1) Based on 2015

20
• Management Systems
• Benchmarking in
Quality & Performance
• Sustainability &
environment
• Facility / Plant &
Equipment
• Legal & Regulatory
• Product Development
• Vendor Compliance
• Corporate Social
Responsibility
• Failure investigation
• Laboratory Outsourcing
• Risk Management
• Supply Chain
Assessment
Depth and Breadth of ATIC Solutions
• Softlines
• Hardlines
• Automotive
• Biofuels
• Building Product
• Chemical &
Pharmaceutical
• Electrical
• Food
• Health & Beauty
• Mineral
• Packaging
• Pharmaceutical
• Oil & Gas
• Appliance &
Electronic
• Aerospace &
Automotive
• Building Products
• Conformity by
Country
• Eco-Textile
• Food & Food Service
• Hazardous Location
• HVACR
• Industrial Equipment
• IT & Telecom
• Life Safety &
Security
• Lighting
• Medical Device
• Agriculture
• Asset Integrity
• Building Product
• Chemical &
Petrochemical
• Electrical
• Exporter & importer
• Field Labelling
• Industrial
• Mineral
• Oil & Gas
• Site Construction
• Textile & Apparel
Assurance Testing Certification Inspection
(1) Heating Ventilation Air Conditioning and Refrigeration
1

21
Aligned Organisational Structure
Intertek Organisational Structure
Geographic Areas Business Lines Functional Areas
Products
Trade
Americas, Pacific and
North East Asia
China
South and
South-East Asia
Middle East and Africa
ATIC Operational
Excellence
Corporate Development
HR
Finance and IT
Legal and Compliance Europe
Resources
Softlines, Hardlines, Electrical &
Wireless, Business Assurance,
Building Products, Transportation
Technologies, Chemicals & Pharma
and Food
Cargo & Analytical Assessment,
Agriculture and Government & Trade
Services
Industry Services and Minerals
22
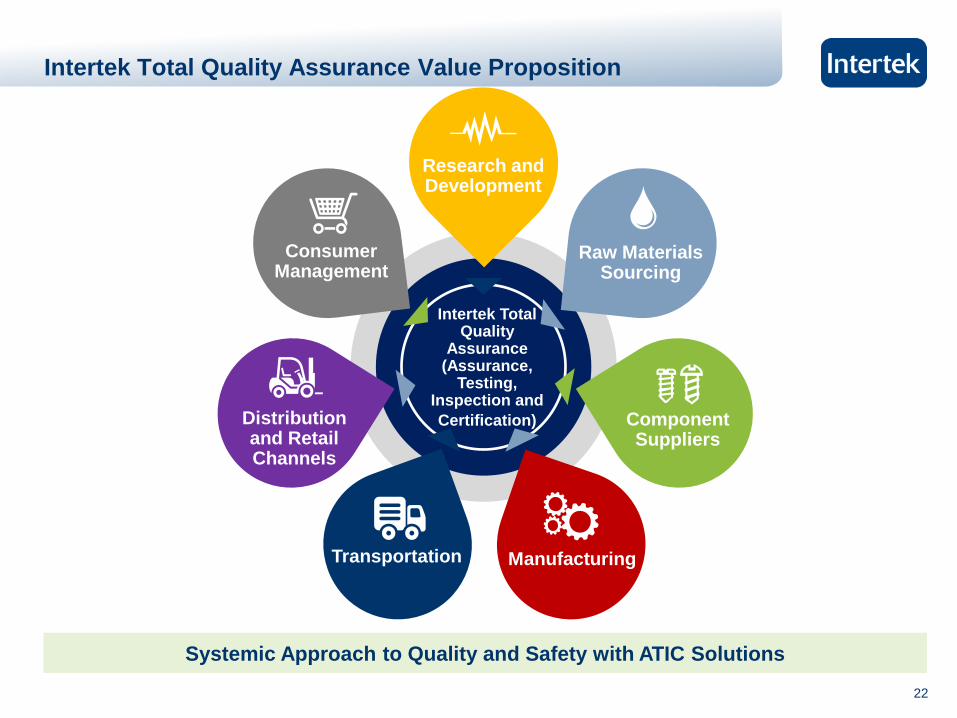
Intertek Total Quality Assurance Value Proposition
Systemic Approach to Quality and Safety with ATIC Solutions
Intertek Total Quality
Assurance (Assurance,
Testing, Inspection and
Certification)
Research and Development
Raw Materials Sourcing
Component Suppliers
Manufacturing
Transportation
Distribution and Retail Channels
Consumer Management

Strategy for
Sustainable
Growth
04
24
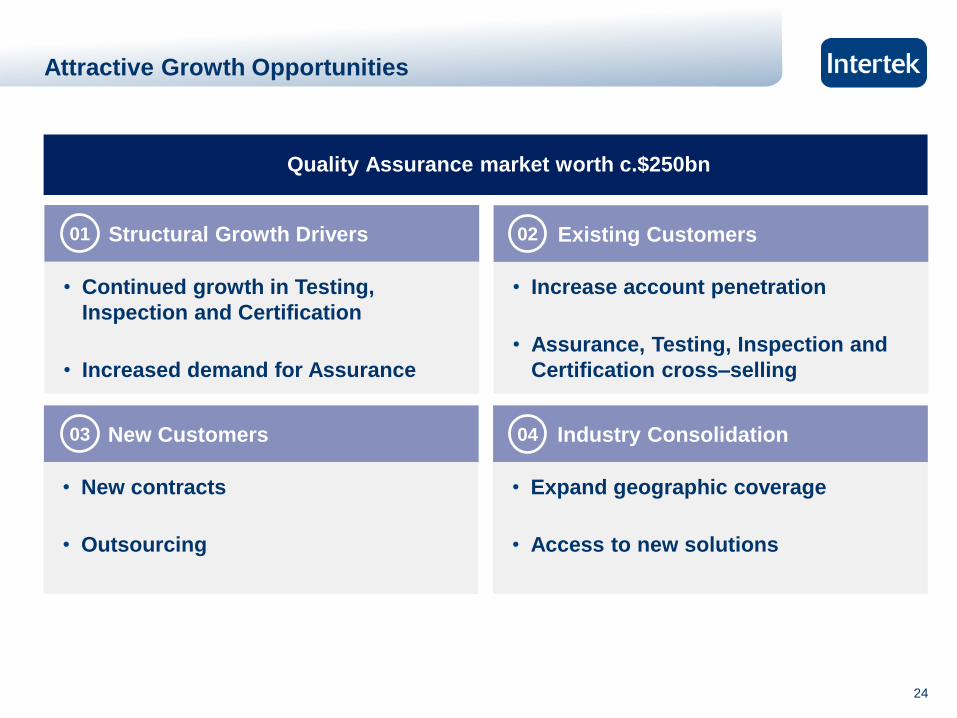
Attractive Growth Opportunities
• Continued growth in Testing,
Inspection and Certification
• Increased demand for Assurance
• Increase account penetration
• Assurance, Testing, Inspection and
Certification cross–selling
• New contracts
• Outsourcing
• Expand geographic coverage
• Access to new solutions
Structural Growth Drivers Existing Customers
New Customers Industry Consolidation
Quality Assurance market worth c.$250bn
01
03
02
04

25 25
Fully engaged employees in a safe
working environment
Deliver superior customer service
Margin accretive organic revenue growth
based on GDP + organic growth
Strong cash conversion from operations
Accretive disciplined capital allocation policy
for both capex (5% of Revenue) and M&A
Corporate Medium to Long Term Goals
01
02
03
04
05

26
5 Strategic Priorities
Strong Brand
Proposition 01
Superior
Customer
Service 02
Effective Sales
Strategy 03
Growth and
Margin
Accretive
Portfolio
04
Operational
Excellence 05
Strategic Priorities
Position Intertek as leading Quality Assurance provider
Improve brand awareness across sectors and geographies
Compelling Total Quality Assurance Brand positioning
Build customer loyalty and win new customers
Measure quality of customer service delivery
Develop innovative ATIC solutions
Increase existing account penetration
Drive ATIC cross selling
Business development with new accounts
Prioritised business lines, geographies and service areas
Invest in areas with good growth and good margin prospects
Disciplined resource, capital and people allocation
Continuous improvement to drive productivity
Best in class management to reduce span of performance
Eliminate non–essential costs - facilities/offices/processes/ purchasing
Action Plans KPIs
NPS Customer retention Customer acquisition Pricing power Growth from innovation
Growth from existing customers
Growth from new customers
Customer cross selling Customer profitability
Revenue growth Margin accretion Portfolio mix ROCE Capital allocation
Direct costs Overheads Productivity per
employee Site capacity utilisation ROCE
Revenue growth New leads Customer acquisitions Pricing power A&P effectiveness
27
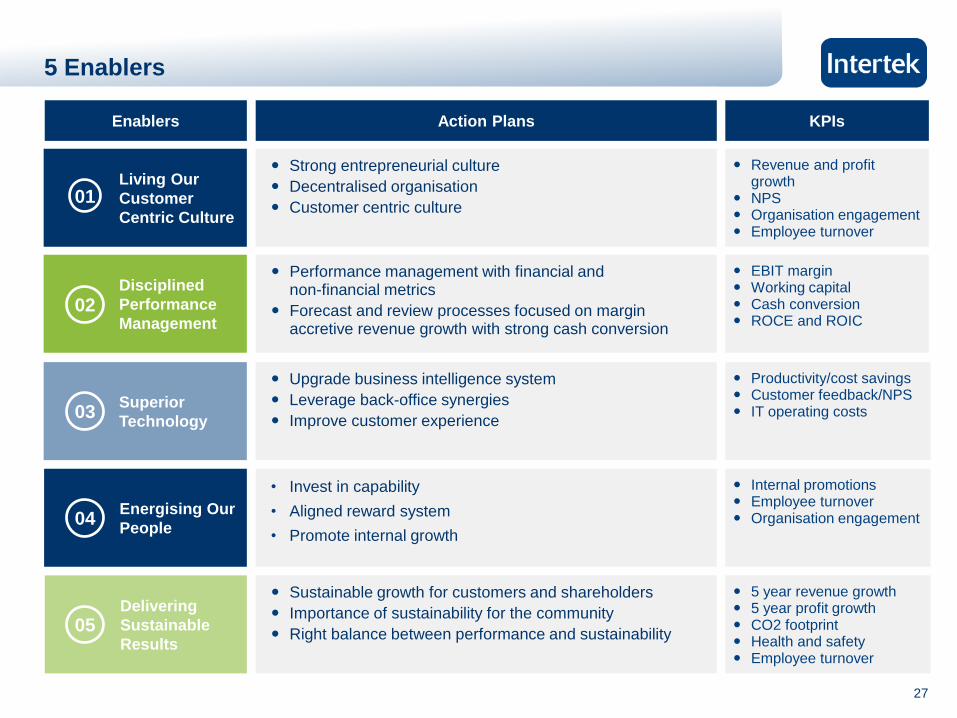
5 Enablers
Living Our
Customer
Centric Culture
01
Disciplined
Performance
Management 02
Superior
Technology 03
Energising Our
People 04
Delivering
Sustainable
Results 05
Enablers
Strong entrepreneurial culture
Decentralised organisation
Customer centric culture
Performance management with financial and non-financial metrics
Forecast and review processes focused on margin accretive revenue growth with strong cash conversion
Upgrade business intelligence system
Leverage back-office synergies
Improve customer experience
• Invest in capability
• Aligned reward system
• Promote internal growth
Sustainable growth for customers and shareholders
Importance of sustainability for the community
Right balance between performance and sustainability
Action Plans KPIs
EBIT margin Working capital Cash conversion ROCE and ROIC
Productivity/cost savings Customer feedback/NPS IT operating costs
Internal promotions Employee turnover Organisation engagement
5 year revenue growth 5 year profit growth CO2 footprint Health and safety Employee turnover
Revenue and profit growth
NPS Organisation engagement Employee turnover

28
5x5 Strategy for Growth
Bringing Quality and Safety to Life
The world’s most trusted partner for Quality Assurance
Our Innovative Assurance, Testing, Inspection and Certification solutions delivered
24/7 with precision, pace and passion enabling you to power ahead safely
Purpose
Vision
Customer
Promise
5x5
5 Strategic Priorities
5 Enablers
Strong Brand Proposition
Superior Customer Service
Effective Sales Strategy
Growth and Margin Accretive Portfolio
Operational Excellence
Living Our Customer Centric Culture
Disciplined Performance Management
Superior Technology
Energising Our People
Delivering Sustainable Results

29
Three Tier Portfolio Strategy
Grow Scale
Businesses Improve Performance
Invest in Fast Growing
Businesses
• Softlines
• Hardlines
• Electrical & Wireless
• Cargo & Analytical
Assessment
• Government & Trade
Services
• Industry Services
• Minerals
• Business Assurance
• Agriculture
• Building Products
• Transportation
Technologies
• Food
• North America
• Greater China
• Australia
• Europe
• South Asia
• South East Asia
• South America
• Middle East and Africa
01 02 03
GB
L
Geo
gra
ph
ic

30
Efficient balance sheet with flexibility to invest in growth with Net
Debt / EBITDA target of 1.5x - 2.0x
M&A focused on strong growth and margin prospects in
businesses with leading market positions or in new exciting
growth areas, geographies or services
Accretive Disciplined Allocation of Capital
Sustainable shareholder returns through payment of progressive
dividends
Capex and working capital investment to support organic growth
(target c.5% of revenue in capex) 01
02
03
04
31
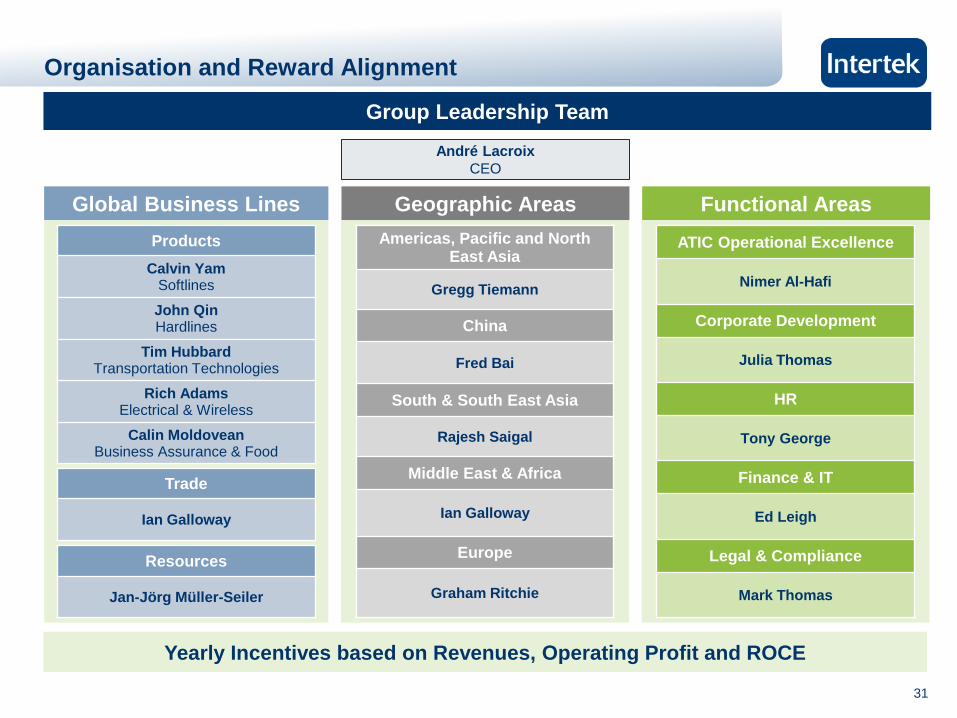
Organisation and Reward Alignment
Yearly Incentives based on Revenues, Operating Profit and ROCE
Group Leadership Team
Geographic Areas Global Business Lines Functional Areas
Products
Calvin Yam Softlines
John Qin Hardlines
Tim Hubbard Transportation Technologies
Rich Adams Electrical & Wireless
Calin Moldovean Business Assurance & Food
Trade
Ian Galloway
Resources
Jan-Jörg Müller-Seiler
Americas, Pacific and North East Asia
Gregg Tiemann
China
Fred Bai
South & South East Asia
Rajesh Saigal
Middle East & Africa
Ian Galloway
Europe
Graham Ritchie
ATIC Operational Excellence
Nimer Al-Hafi
Corporate Development
Julia Thomas
HR
Tony George
Finance & IT
Ed Leigh
Legal & Compliance
Mark Thomas
André Lacroix
CEO

www.intertek.com
Short Term
Priorities in 2016
05

33
Internal Alignment to Execute Our 5x5 Strategy
What we have done
• Implemented organisational structure to support our business model
• Strategy communicated to top 200 leaders
• New short-term incentive system and 2016 targets communicated to all
What we will do
• Cascade 5x5 strategy throughout the organisation
• Increase internal communication efforts to share best practice
• Performance management focus on financial and non-financial metrics

34
Focused 2016 Plans to Deliver Revenue Growth
• Implement NPS to measure customer service delivery on monthly basis
• Drive ATIC cross selling with existing and new customers
• Launch innovative ATIC solutions in Products, Trade and Resources
• Performance management based on financial and non-financial metrics
• Capex investments in businesses with good growth and good margin prospects
SOFTLINES • Growth in
footwear and footwear electronics
• Launch of Chemical Smart Screening
HARDLINES • Supply chain
expansion in India and Mexico
• Launch of innovative technology for factory inspections
ELECTRICAL & WIRELESS • EMC expansion in
S.Korea and Mexico • Regulatory changes
in Energy Efficiency • Internet of Things
BUILDING PRODUCTS • Growth of
Commercial and Civil construction markets in the USA
• Integration of PSI
TRANSPORTATION TECHNOLOGIES • Focus on electrical
and hybrid vehicles
CHEMICALS & PHARMA • New pharma
products in the USA and UK
• Increased corporate focus on regulatory risk
CARGO & AA • New lab openings
in Australia, PNG, Texas
• Increased shipment of refined products
GTS • Increased scope
in Saudi Arabia • New programmes
in new markets
MINERALS • Cost and capacity
control
AGRI • Business
development with existing and new accounts in fast growing markets
FOOD • Integration of FIT • Development of
food services
BA • Leverage
leadership position in supply chain management
INDUSTRY SERVICES • Cost and capacity
control in capex related activities
• Continue diversification in opex related activities with NDT
Business Line and Country Initiatives
Group
Initiatives

35
Disciplined Margin and Cash Management
• Q4 2015 cost restructuring
− Headcount reduction of 207
− Full year cost reduction of £4m
• Manage capacity and costs tightly
− Industry Services
− Minerals
• Continuous focus on costs
− Consolidation of facilities
− Consolidation of offices
− Process streamlining
− Purchasing synergies
Cost Management
Benchmarking/Productivity
Cash Management
• Drive best-in-class performance
management
− Site span of performance reduction with
Best in Class tool
− Business line and country monthly
benchmarking with financial and non-
financial metrics
• Tight controls on working capital
• Business line and country monthly
benchmarking

36
51 34
65 76
208 234
2014 2015
Resources Trade Products
324 343
572 519
514 537
1,008 1,111
2014 2015
Resources Trade Products
2,093 2,166
2015 Performance Based on Future Disclosures
Growth
2014 2015
Products 20.6% 21.1%
Trade 12.7% 14.1%
Resources 9.0% 6.5%
Group 15.5% 15.9%
% Group
Revenue
% Group
Profit
Organic
Revenue
Growth¹
Products 51% 68% 6.0%
Trade 25% 22% 5.4%
Resources 24% 10% (10.2)%
Group 1.6%
1 At constant rates
Revenue (£m) Adjusted Operating Profit (£m)
(33.9)%
15.9%
12.5%
5.9%
Growth
(9.2)%
4.4%
10.2%
3.5%
Margin Key Metrics

37
• Track record of sustainable growth and
shareholder value creation
• High margin and strongly cash generative
earnings model
• Attractive growth prospects in the Quality
Assurance market
• Portfolio focus on attractive growth and
margin opportunities
• Disciplined approach to performance
management and capital allocation
Summary

www.intertek.com 38
Strategy Update
Presentation
Appendix

39
Financial Performance by Sector in 2015 and 2014
2015
£m
2014
£m
Change at
actual rates
Change at
constant
rates
Organic1
change at
constant
rates
Products
Revenue 1,110.6 1,007.9 10.2% 7.7% 6.0%
Adjusted operating profit 233.8 207.9 12.5% 8.4%
Adjusted operating margin 21.1% 20.6% 50bps 10bps
Trade
Revenue 536.6 513.9 4.4% 5.5% 5.4%
Adjusted operating profit 75.7 65.3 15.9% 18.3%
Adjusted operating margin 14.1% 12.7% 140bps 150bps
Resources
Revenue 519.1 571.5 (9.2)% (7.3)% (10.2)%
Adjusted operating profit 33.9 51.2 (33.8)% (32.7%)
Adjusted operating margin 6.5% 9.0% (250)bps (250)bps
Group
Revenue 2,166.3 2,093.3 3.5% 3.2% 1.6%
Adjusted operating profit 343.4 324.4 5.9% 4.0%
Adjusted operating margin 15.9% 15.5% 40bps 20bps

40
Financial Performance by Sector in 2015, H1 and H2
H1
£m
H2
£m
FY
£m
Products
Revenue 531.7 578.9 1,110.6
Adjusted operating profit 109.9 123.9 233.8
Adjusted operating margin 20.7% 21.4% 21.1%
Trade
Revenue 267.3 269.3 536.6
Adjusted operating profit 36.9 38.8 75.7
Adjusted operating margin 13.8% 14.4% 14.1%
Resources
Revenue 261.2 257.9 519.1
Adjusted operating profit 17.6 16.3 33.9
Adjusted operating margin 6.7% 6.3% 6.5%
Group
Revenue 1,060.2 1,106.1 2,166.3
Adjusted operating profit 164.4 179.0 343.4
Adjusted operating margin 15.5% 16.2% 15.9%

41
Testing is evaluating how products and services meet and
exceed quality, safety, sustainability and performance
standards
Assurance ensures our customers identify and mitigate
the intrinsic risk in their operations, supply chain and
quality management systems
Broad Based ATIC Services to Deliver Total Quality Assurance
Inspection is validating the specifications, value and safety
of raw materials, products and assets
Certification is certifying that products and services meet
trusted standards
A
T
I
C