strengthening democracy by increasing youth political
TRANSCRIPT
Strengthening Democracy by Increasing Youth Political
Knowledge and Engagement
Laura Langer
Bemidji State University
Political Science Senior Thesis Bemidji State University
Dr. Patrick Donnay, Advisor April 2015
Langer 1
Abstract
Even though the United States had historically high voter turnout in 2008 and 2012, there
remains troubling patterns pertaining to political engagement and knowledge among its least
educated youth. The literature and theory suggests that if the United States educational systems
increase the amount of civic education courses, extracurricular activity, and youth volunteering
opportunities in high schools, especially among the most disadvantaged youth, it will lead to an
increase in political knowledge and engagement. I test this idea with data from the Center for
Information and Research on Civic Learning and Engagement (CIRCLE) post-2012 election
youth survey. The CIRCLE data set looks at 4,483 cases and takes 511 variables into account.
Tentative results show that civic education does have an effect on varying demographics,
including different racial and ethnic groups, along with those with low socioeconomic statuses
as well. These results confirm that civic education enhances democratic values most
dramatically among more disadvantaged groups.
Langer 2
Introduction
Even though the United States had reached historically high voter turnout in 2008 and
2012, there remains undesirable numbers pertaining to political engagement and knowledge
among its citizens. The problem with this is that in order for the US democracy to operate at its
full potential, it has to have an engaged citizenry. Increasing civic knowledge and engagement
among youth voters will result in the presence of a stronger democracy. In order to increase
knowledge and engagement, the United States has to start by expanding civics education courses
in its educational system, including classes, volunteering opportunities, and increasing
extracurricular participation within its high schools. We must also address the socioeconomic
issues that magnify the engagement discrepancies.
There are four parts that that affect civic knowledge and engagement among youth. The
first part I look at is how civic education is defined. There are a variety of sub fields that fit into
civics, and there are different ways to interpret this concept. The second part that I look at is
volunteering and extracurricular involvement. Research has been done to see if volunteering and
extracurricular activities affect civic engagement, and I will critically examine that research. The
third part that I believe effects civic engagement is socioeconomic status. The last part that I will
examine includes looking at political socialization.
Literature Review
Defining Civic Education
In the past decade schools have increased their focus on the STEM programs; science,
technology, engineering, and mathematics. With a technologically advancing society, it is
believed that programs such as these are important in developing the workforce (Godsay, 2012).
These types of programs, however, fail to address the consequences of leaving out classes such
Langer 3
as civics, which include American government, US history, and other social studies classes as
well.
What is civics education? First, civics education is meant to develop three fundamentals
of democratic citizenship. These include civic disposition, knowledge, and skills (IFES, 2014).
Civic disposition involves citizens developing confidence in order to participate civically and
becoming civically engaged. It helps citizens better understand their roles in government and the
rights and responsibilities they have as a citizen of a democratic system. It also helps them to
become open and tolerant when exercising their rights and responsibilities (IFES, 2014). The
second fundamental is civic knowledge. This means that citizens understand their political
context, social and economic rights, and political and civil rights (IEFS, 2014). The third
fundamental is civic skills. This means that, by developing their skills, citizens are gaining the
ability to evaluate, analyze, explain, defend a position, interact and understand political outcomes
(IEFS, 2014).
Together, these 3 fundamentals accomplish five results. First, they develop confidence in
participation in civic life and they increase engagement in the political process. They allow for
the acceptance of rights and responsibilities of a citizen in a democracy. The fundamentals
achieved include knowing social, economic, and political rights. Students would be able to
participate informatively in the political process (IFES, 2014). To avoid a decline of democracy,
developing these three fundamentals through education is necessary (Boundless, November
2014).
Research by the Center for Information and Research on Civic Learning and Engagement
(CIRCLE) shows key educational policies on a state by state basis (CIRCLE, 2014). They found
a substantial variation in civic education requirements and assessments by state (CIRCLE, 2014).
Langer 4
Some states required three credits of high school social studies for graduation, some require five,
while others do not require these classes at all (CIRCLE, 2014). As education policies involved
with civic education continue to vary, the basic civic knowledge will continue to change while
skills for a competent democracy will continue to decline (Hart, 2001).
Volunteering and Extracurricular Involvement
Community service can have a variety of meanings for different people and participation
occurs for many reasons. Some are forced into it while others have experienced the benefits of
volunteering. Service-learning has been shown to be important in developing a more politically
aware and active participant in civic duties (Hart, 2007). If in individual is participating in
community service, they are becoming involved in political issues rather than going about it
abstractly (Hart, 2007). Hart’s 2007 study shows that community service and extracurricular
activities lead to an increase in voting and volunteering among adults.
Extracurricular activities develop skills in public speaking, influencing others, holding
meetings and writing formal documents (Hart, 2007). They also help develop a better
understanding of and relationships with people from various backgrounds. They help engage
people in discussions with adults that can act as mentors or role models. These are types of
studies and skills that increase the likelihood of civic engagement (Hart, 2007).
Socioeconomic Status and Political Socialization
I also examine how socioeconomic issues that relate to political socialization effect
participation rates among American youth. Examining the issues that come with low
socioeconomic status (SES) will lead to showing how low SES negatively affects educational
opportunities, and how that leads to inequalities in representation. Lastly, I look at the
Langer 5
importance of increasing the representation of disadvantaged groups and how civics education
leads to disproportionate gains in participation rates among disadvantaged groups.
SES measures a combination of education, income and occupation (APA, 2014). If an
individual has low educational attainment, low income, is unemployed, or working at a low
paying job, their SES is low. Research indicates that children from low SES households and
communities develop academic skills more slowly and have lower educational attainment than
those who come from high SES groups (APA, 2014). SES affects places of education as well.
Schools within areas of low SES have minimal resources, which negatively impacts students’
progress in academia. Those students are at higher risks of dropout or obtaining low educational
attainment, and maintaining low SES (APA, 2014).
Those with low SES face more inequalities than those with high SES. Those that are
more privileged have more resources and are more able to become politically engaged.
According to Brad, Verba, and Schlozman's (1995) research on looking beyond SES, they
analyzed four resources. They included time, money, civic skills, along with SES as resources
that drive political participation. Using the resource model, (Brady et al, 1995) found that these
activities affect participation in that an increase in one, such as time, will increase participation. I
theorize that individuals who have ordinary changes in their lives, such as an increase in free
time, will likely raise their political participation.
Addressing SES issues is necessary in order to mobilize disadvantaged populations,
including racial minorities, or those from different ethnic backgrounds. It is important to note
what attempts have been made to mobilize these groups and how civics education helps increase
their participation rates.
Langer 6
Understanding that low SES negatively affects disadvantaged groups is important. This
understanding shows the need for increasing civics education can lead to positive outcomes, such
as increasing their representation and increases their participation rates, which in turn strengthens
democracy.
By addressing these issues and increasing civic knowledge and engagement, it will make
the political socialization process more beneficial. I will discuss what the political socialization
process is and its primary agents for political transmission. Then, it will discuss how important
family transmission is for the socialization process, followed by showing that increasing civics
education along with socialization factors increases participation rates.
Political socialization is "the learning of social patterns corresponding to social positions
as mediated through various agencies of society (Dudley & Gitelson, 2002)". The primary agents
of this process include family/parents, schools, and peer groups. Family is the first agent, which
includes parents, siblings, grandparents and extended family members. These are the agents that
teach a child what they need to know through teaching and learning a variety of ideas,
(Boundless, July 2014). Schools are the next agent in the socialization process. While in school,
children develop a sense of understanding of how the system works by using teamwork, books or
going on a set schedule (Boundless, July 2014). Last are peer groups. These groups include
people from around the same age, who share the same interests, and typically share a similar
social status (Boundless, July 2014). Socialization through peer groups is analogous to the family
socialization process, but their views and socialization occurs from their peers.
Looking at the concept of family transmission will help to understand the importance of
political socialization in increasing civic knowledge. Intergenerational transmission is "the
movement, passage, or exchange of some good or service between one generation and another
Langer 7
(Jennings, 2009)". In this case, the transmission of political views and how they shape the
political socialization process. Research shows that parents/guardians that are more consistent
with the transmission of their political beliefs and attitudes to children will come from more
politicized family environments (Jennings, 2009). Active transmission of political beliefs is
positively viewed because families with high SES will be more capable of obtaining this than
those with low SES. Therefore, increasing civic engagement and participation in more
disadvantaged groups will increase participation and will increase the quality of socialization
through family transmission.
Summary
The socialization of civic engagement through family transmission strongly correlates
with having a civically engaged head of household. The process is carried out more efficiently if
the parent/guardian who is politically knowledgeable and engaged themselves. Youth that come
out of high SES families are more likely to experience success in the transmission process than
those that come from low SES families.
Increasing civics education among disadvantaged groups increases their participation
rates. It will also decrease the inequalities among disadvantaged groups, and increase their
opportunity and capability of becoming politically engaged. Through the rise of political
participation, communities with low SES can improve the quality of education and the amount of
resources available to them. And from this, it will result in better representation from elected
officials, allowing for proper representation of their interests and views.
Increasing the opportunities that school-aged youth have to become involved in their
communities through service learning projects and community service options will add to their
socialization process, ultimately increasing the rates of civic participation. Those that come from
Langer 8
low SES families and do not experience the full potential of family transmission socialization,
they can learn from their peers. And those who have civics courses in high school and an
increased opportunity to become involved in their communities will be more likely to become
civically engaged and knowledgeable than those without the same opportunities.
I have made it clear that it is important to increase civics education in the US education
system. Previously I have only looked at a comparison of three variables, two of which include if
the respondent voted and if they took a civics course. Just because a young person has voted does
not necessarily mean that they know what they are voting on or how the voting process works. I
believe that in a comparison of individuals, those that participated in more class activities within
their civics courses in high school will be more likely to become an informed voter than those
that did not take part in as many activities.
Throughout my analysis, I look at a generalized civics course, yet there is more to it.
Earlier in the paper, I mentioned that some states may not require civics credits and some require
six credits. These can be different forms of civics courses as well, such as US history, US
politics, or classes that require community service projects. Those that have more classes that
expand on these different topics will be more knowledgeable than those that go to schools that in
states that don’t require such courses. Further, disadvantaged groups will benefit more than
advantaged groups from having different fundamentals within civics education.
Methods and Analysis
Hypothesis I
Looking at factors that increase civic engagement, the socialization process has been an
area of focus that has caught my attention the most, after looking at disadvantaged groups. From
the literature, I developed the following hypothesis: in a comparison of individuals, those that do
Langer 9
not discuss politics with their parents often will be more likely to benefit from having a civics
course in high school than those individuals that discuss politics with their family.
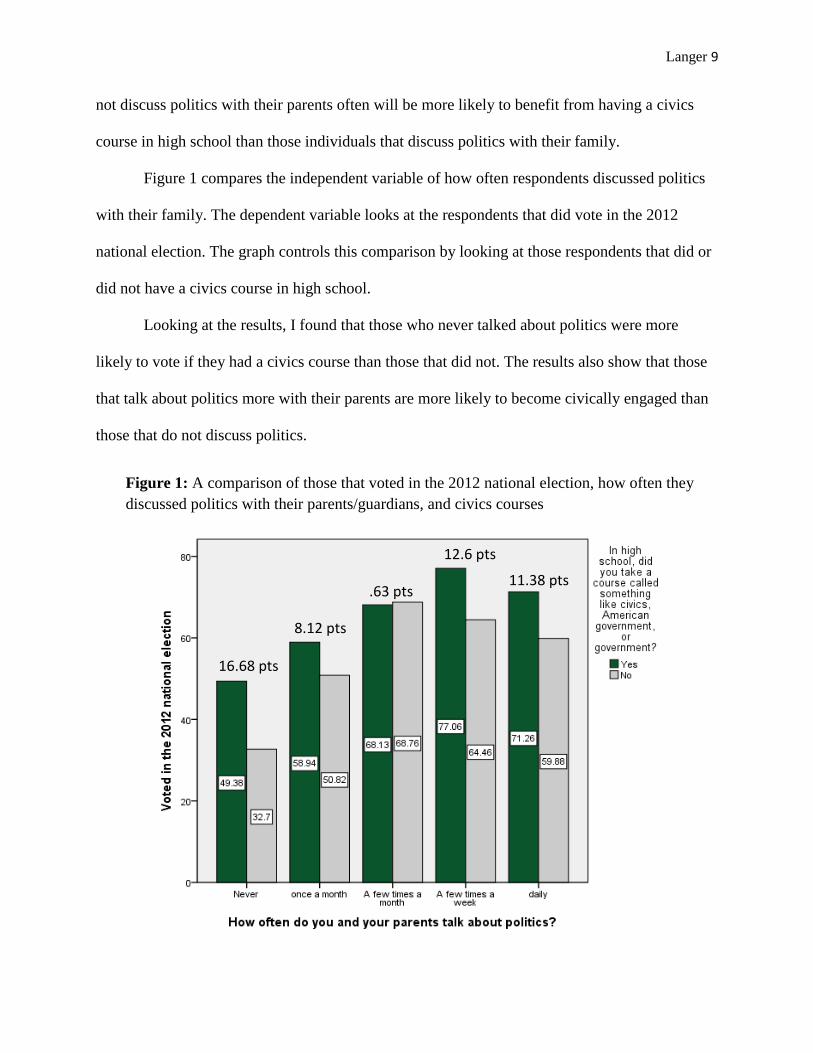
Figure 1 compares the independent variable of how often respondents discussed politics
with their family. The dependent variable looks at the respondents that did vote in the 2012
national election. The graph controls this comparison by looking at those respondents that did or
did not have a civics course in high school.
Looking at the results, I found that those who never talked about politics were more
likely to vote if they had a civics course than those that did not. The results also show that those
that talk about politics more with their parents are more likely to become civically engaged than
those that do not discuss politics.
Figure 1: A comparison of those that voted in the 2012 national election, how often they
discussed politics with their parents/guardians, and civics courses
8.12 pts
.63 pts
12.6 pts
11.38 pts
16.68 pts
Langer 10
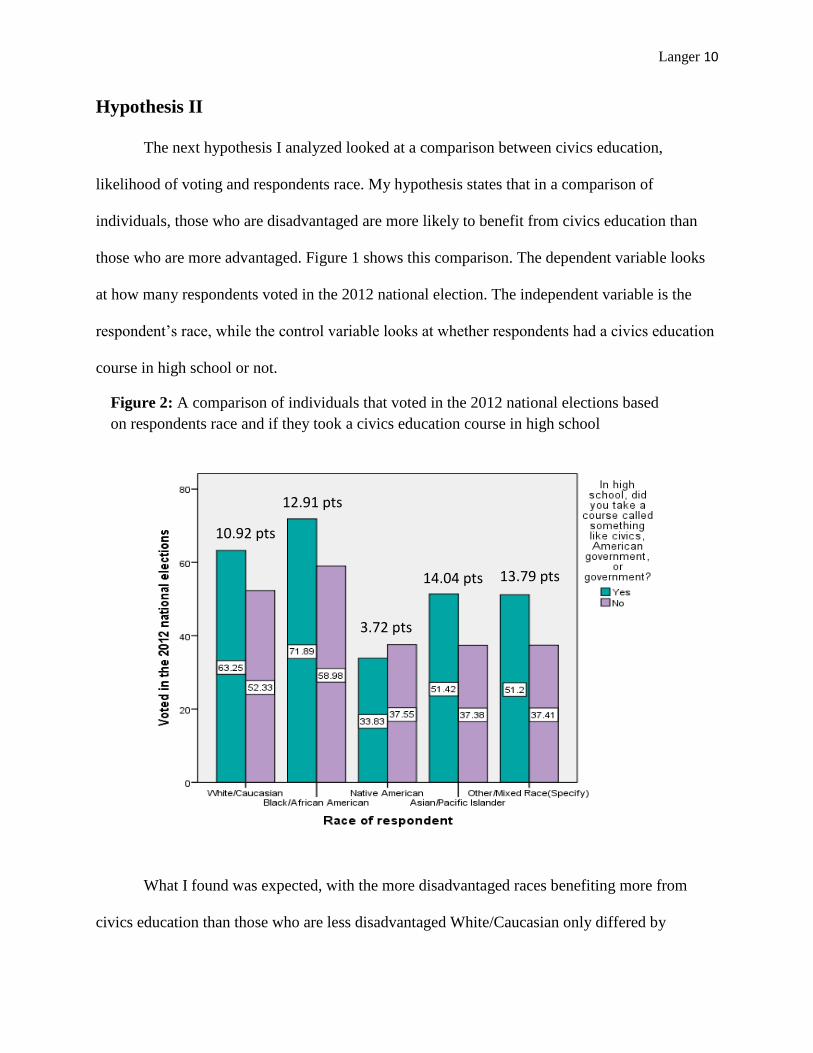
Hypothesis II
The next hypothesis I analyzed looked at a comparison between civics education,
likelihood of voting and respondents race. My hypothesis states that in a comparison of
individuals, those who are disadvantaged are more likely to benefit from civics education than
those who are more advantaged. Figure 1 shows this comparison. The dependent variable looks
at how many respondents voted in the 2012 national election. The independent variable is the
respondent’s race, while the control variable looks at whether respondents had a civics education
course in high school or not.
What I found was expected, with the more disadvantaged races benefiting more from
civics education than those who are less disadvantaged White/Caucasian only differed by
Figure 2: A comparison of individuals that voted in the 2012 national elections based
on respondents race and if they took a civics education course in high school
10.92 pts
12.91 pts
3.72 pts
14.04 pts 13.79 pts
Langer 11
10.92% between those that did and did not have a civics course in high school. Black/African
differed by 12.91%, Asian/Pacific Islander differed by 14.04%, and other/Mixed race differed by
13.41%.
What I found the most interesting was the difference between Native American
respondents. The other groups had higher percentages in those that did have a civics education
course and lower percentages in those that did not have civics education. Native American
respondents had lower percentages in the yes category and higher percentages in the no category.
Upon further research, I first noticed that they only had a total of 86 respondents. All of the other
races had well over 100 respondents each.
Hypothesis III
While researching civics education and its effects on civic participation, I developed the
following hypothesis: in a comparison of individuals, those that participated in extracurricular
activities are more likely to become civically engaged than those that did not participate in
extracurricular activities. Also, those that did not participate in extracurricular activities but had a
civics course in high school were more likely to become civically engaged than those that did not
have the civics course in high school.
Table 1 shows the cross tabulation between the independent variable, which looked at
how many of the respondents participated in organized groups or clubs at school. The dependent
variable shows how many of the respondents voted in the national election in 2012. The control
variable asked the respondents if they took a civics course in high school or not.
The Chi-Square for yes is significant while the Chi-Square for no is not significant. This
means that if it is significant, that the relationship between the independent and dependent
variable did not happen by chance. Because the relationship between the dependent and

Langer 12
independent variable for no is not significant, shows that the relationship happened by chance,
providing little predictive power. The Cramer’s V for yes shows a weak relationship between the
independent and dependent variable. Cramer’s V for no shows a weak relationship between the
two variables as well.
Looking at those that were in at least 1 group and took a civics course in high school,
60.2% of the respondents voted in the 2012 national elections. Looking at the same group and
those that did not take a civics course in high school, only 42.9% of the respondents in the
category voted. As group participation goes up, the wider the gap between those that took a
civics course and those that did not, gets. Also, looking at all the categories, it can be seen that
group participation has an effect on voting. Those individuals that did not take a civics course
but did vote, saw an increase in voting as group participation went up
Table 1: Cross tabulation between Voting and Civics Course and Level of Group Participation Did you take a civics course in
high school?
How many groups did you participate in during high school
1 group 2 groups 4-5
groups
6-9
groups
10 or
more
groups
Total
Yes Did you
vote in the
2012
National
Election?
Yes 203
60.2%
276
64.5%
255
76.8%
76
78.4%
16
66.7%
826
67.8%
No 134
39.8%
152
235.5%
77
23.3%
21
21.6%
8
33.3%
392
32.2%
Total 337
100.0%
428
100.0%
332
100.0%
97
100.0%
24
100.0%
1218
100.0%
No Did you
vote in the
2012
National
Election?
Yes 21
42.9%
50
59.5%
25
61.0%
9
69.3%
3
75.0%
108
56.5%
No 28
57.1%
34
40.5%
16
39.0%
4
30.8%
1
25.0%
83
43.5%
Total 49
100.0%
84
100.0%
41
100.0%
13
100.0%
4
100.0%
191
100.0%
Total Did you
vote in the
2012
National
Election?
Yes 224
58.0%
326
63.7%
280
75.1%
85
77.3%
19
67.9%
934
66.3%
No 162
42.0%
186
36.3%
93
24.9%
25
22.7%
9
32.1%
475
33.7%
Total 386
100.0%
512
100.0%
373
100.0%
110
100.0%
28
100.0%
1409
100.0%
Chi-Square: [YES-Value] 28.287 [Approx. Sig.] .000
[NO- Value] 5.773 [Approx. Sig.] .217
Cramer’s V: [YES- Value] .151 [YES - Approx. Sig.] .000
[NO – value] .174 [NO – Approx. Sig.] .217
Langer 13
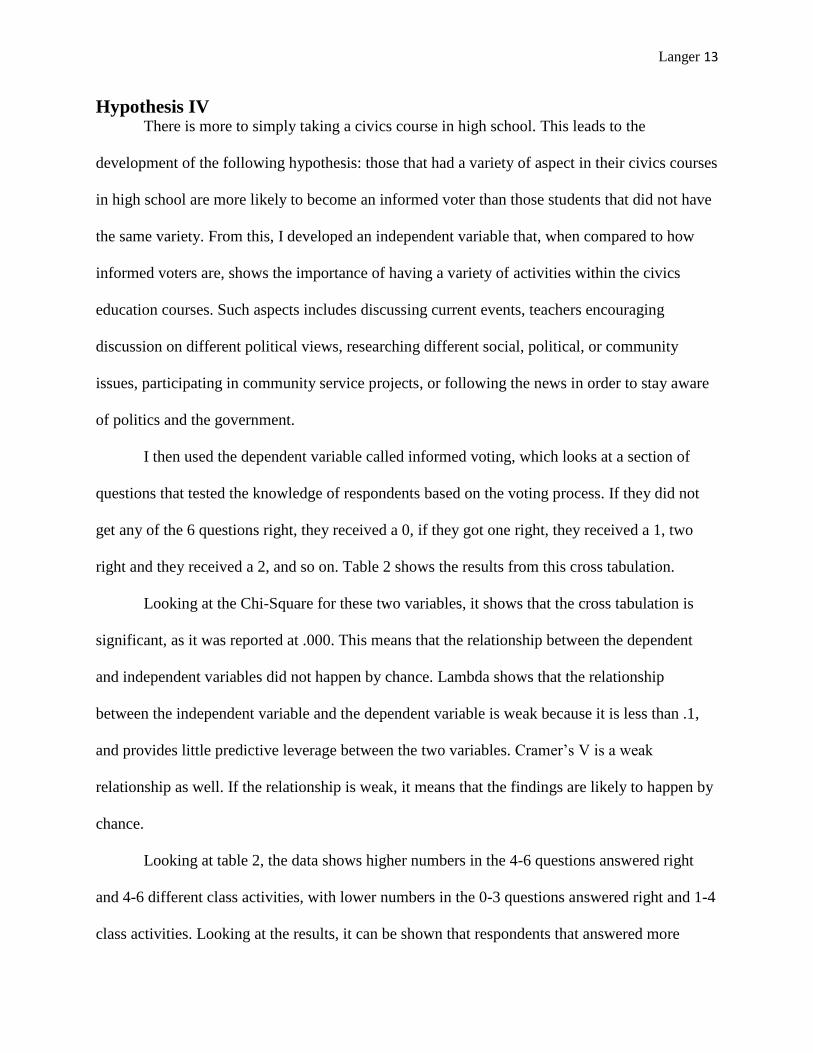
Hypothesis IV There is more to simply taking a civics course in high school. This leads to the
development of the following hypothesis: those that had a variety of aspect in their civics courses
in high school are more likely to become an informed voter than those students that did not have
the same variety. From this, I developed an independent variable that, when compared to how
informed voters are, shows the importance of having a variety of activities within the civics
education courses. Such aspects includes discussing current events, teachers encouraging
discussion on different political views, researching different social, political, or community
issues, participating in community service projects, or following the news in order to stay aware
of politics and the government.
I then used the dependent variable called informed voting, which looks at a section of
questions that tested the knowledge of respondents based on the voting process. If they did not
get any of the 6 questions right, they received a 0, if they got one right, they received a 1, two
right and they received a 2, and so on. Table 2 shows the results from this cross tabulation.
Looking at the Chi-Square for these two variables, it shows that the cross tabulation is
significant, as it was reported at .000. This means that the relationship between the dependent
and independent variables did not happen by chance. Lambda shows that the relationship
between the independent variable and the dependent variable is weak because it is less than .1,
and provides little predictive leverage between the two variables. Cramer’s V is a weak
relationship as well. If the relationship is weak, it means that the findings are likely to happen by
chance.
Looking at table 2, the data shows higher numbers in the 4-6 questions answered right
and 4-6 different class activities, with lower numbers in the 0-3 questions answered right and 1-4
class activities. Looking at the results, it can be shown that respondents that answered more
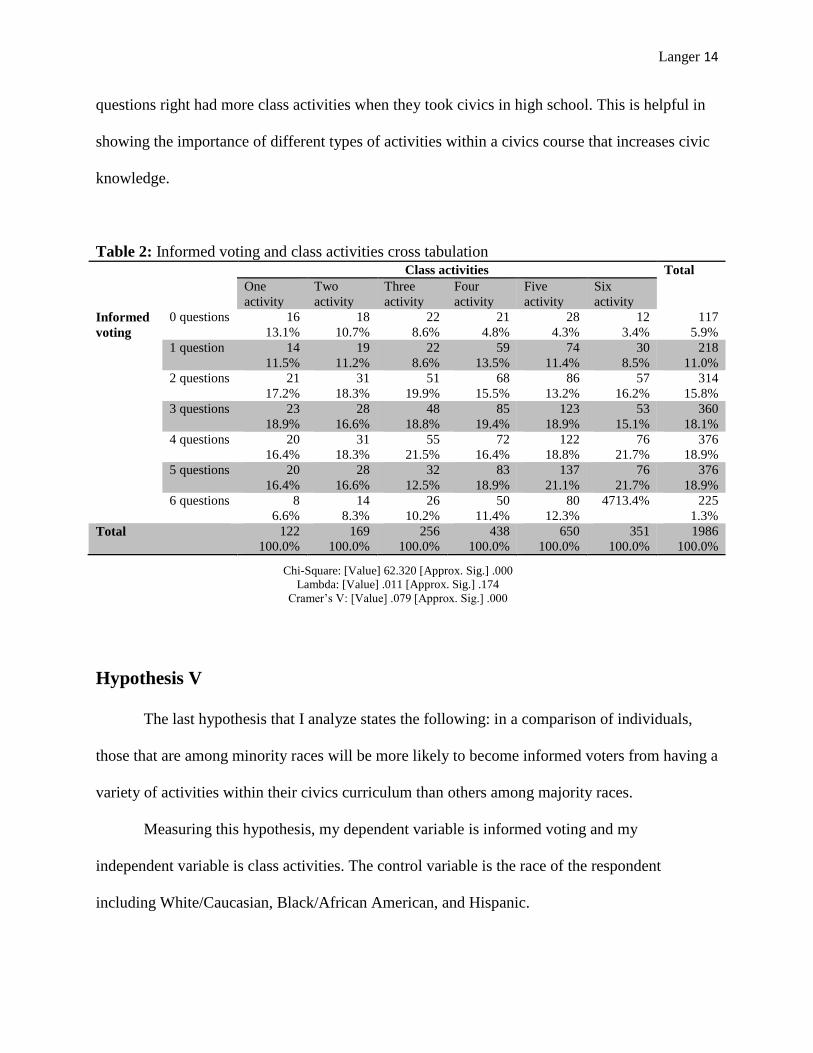
Langer 14
questions right had more class activities when they took civics in high school. This is helpful in
showing the importance of different types of activities within a civics course that increases civic
knowledge.
Table 2: Informed voting and class activities cross tabulation Class activities Total
One
activity
Two
activity
Three
activity
Four
activity
Five
activity
Six
activity
Informed
voting
0 questions 16
13.1%
18
10.7%
22
8.6%
21
4.8%
28
4.3%
12
3.4%
117
5.9%
1 question 14
11.5%
19
11.2%
22
8.6%
59
13.5%
74
11.4%
30
8.5%
218
11.0%
2 questions 21
17.2%
31
18.3%
51
19.9%
68
15.5%
86
13.2%
57
16.2%
314
15.8%
3 questions 23
18.9%
28
16.6%
48
18.8%
85
19.4%
123
18.9%
53
15.1%
360
18.1%
4 questions 20
16.4%
31
18.3%
55
21.5%
72
16.4%
122
18.8%
76
21.7%
376
18.9%
5 questions 20
16.4%
28
16.6%
32
12.5%
83
18.9%
137
21.1%
76
21.7%
376
18.9%
6 questions 8
6.6%
14
8.3%
26
10.2%
50
11.4%
80
12.3%
4713.4% 225
1.3%
Total 122
100.0%
169
100.0%
256
100.0%
438
100.0%
650
100.0%
351
100.0%
1986
100.0%
Hypothesis V
The last hypothesis that I analyze states the following: in a comparison of individuals,
those that are among minority races will be more likely to become informed voters from having a
variety of activities within their civics curriculum than others among majority races.
Measuring this hypothesis, my dependent variable is informed voting and my
independent variable is class activities. The control variable is the race of the respondent
including White/Caucasian, Black/African American, and Hispanic.
Chi-Square: [Value] 62.320 [Approx. Sig.] .000
Lambda: [Value] .011 [Approx. Sig.] .174
Cramer’s V: [Value] .079 [Approx. Sig.] .000

Langer 15
Table 3: Informed voting, respondents race, and class activities cross tabulation
Respondents race Class activities
1
activity
2
activities
3
activities
4
activities
5
activities
6
activities
Black/
African
American
Informed 0 correct 4 5 4 8 6 4
14.3% 12.2% 5.9% 6.9% 4.1% 4.5%
1-2
correct
5 10 21 31 24 25
17.9% 24.4% 30.9% 26.7% 16.6% 28.1%
3-4
correct
13 20 29 45 66 34
46.4% 48.8% 42.6% 38.8% 45.5% 38.2%
5-6
correct
6 6 14 32 49 26
21.4% 14.6% 20.6% 27.6% 33.8% 29.2%
Total 28 41 68 116 145 89
100.0% 100.0% 100.0% 100.0% 100.0% 100.0%
White/
Caucasian
Informed 0 correct 11 11 15 9 18 5
16.2% 11.1% 9.4% 3.8% 4.7% 2.5%
1-2
correct
19 29 42 65 100 47
27.9% 29.3% 26.4% 27.3% 25.9% 23.6%
3-4
correct
20 28 65 82 131 71
29.4% 28.3% 40.9% 34.5% 33.9% 35.7%
5-6
correct
18 31 37 82 137 76
26.5% 31.3% 23.3% 34.5% 35.5% 38.2%
Total 68 99 159 238 386 199
100.0% 100.0% 100.0% 100.0% 100.0% 100.0%
Hispanic Informed 0 correct 1 1 3 5 4 4
4.0% 3.7% 11.1% 5.9% 3.5% 6.6%
1-2
correct
11 10 10 31 37 14
44.0% 37.0% 37.0% 36.5% 32.2% 23.0%
3-4
correct
9 11 8 30 45 23
36.0% 40.7% 29.6% 35.3% 39.1% 37.7%
5-6
correct
4 5 6 19 29 20
16.0% 18.5% 22.2% 22.4% 25.2% 32.8%
Total 25 27 27 85 115 61
100.0% 100.0% 100.0% 100.0% 100.0% 100.0%
Looking at table 3, I found that among the three races, as class activities increased the
more questions the respondents answered correctly. However, looking at the Chi-Square for each
race shows if the relationship between the independent and dependent variable is significant. The
number reported, at .001, shows that it is significant, meaning that it did not occur by chance.
The other two races Chi-Square show that there is not statistical significance and that the
Chi-Square:
Black/African American [Value] 32.560 [Approx. Sig.] .342
White/ Caucasian [Value] 60.680 [Approx. Sig.] .001 Hispanic [Value] 28.396 [Approx. Sig.] .549
Cramer’s V:
Black/African American [Value] .259 [Approx. Sig.] .342 White/Caucasian [Value] .230 [Approx. Sig.] .001
Hispanic [Value] .288 [Approx. Sig.] .549
Lambda: Black/African American [Value] .018 [Approx. Sig.] .561
White/Caucasian [Value] .002 [Approx. Sig.] .070
Hispanic [Value] .065 [Approx. Sig.] .043
Langer 16
relationships have occurred by chance. The Lambda scores show a weak relationships among all
three races, which provides little predictive leverage between the independent and dependent
variables. Looking at Hispanic, however, shows the strongest relationship of the three.
Conclusion
Civics education has a significant impact on increasing the likelihood of voting by filling
in areas of school-aged youth that have disadvantages that keep them from becoming politically
informed and engaged. I found that, after doing the necessary research and examining data, there
are a variety of ways to increase civic knowledge and engagement.
I found that those that are more advantaged compared to their peers, that they see little
effect in increasing civic education in the US education system. It is those that are
disadvantaged, those that have little resources or come from low SES backgrounds that benefit
the most from increasing civics education. Those that are seen as disadvantaged youth, and are
participating in different civic activities at their school, may benefit by becoming more
politically informed. I cannot, however, say that this is the only cause that disadvantaged youth
become politically informed. In order to do so, more research would need to be carried out.
If the US government were to begin to focus more on increases in civics courses in the education
system, it would increase turnout rates, ultimately leading to the strengthening of democracy.
I can say, that those that have less resources while growing up and don’t experience
family transmission of political views, will benefit more than those that do have such resources.
These disadvantaged youth can gain civic knowledge and become more involved it there is other
ways to go through the political socialization process. In order to increase the civically engaged
and knowledgeable American youth, all factors must be addressed, including increases civics
education, volunteering opportunities and extracurricular participation within the United States

Langer 17
high school education system. And not only that, but we must address socioeconomic issues that
magnify engagement discrepancies to increase civic engagement among American youth.
Langer 18
Bibliography APA. (2014). Education and Socioeconoimc Status. Retrieved December 15, 2014, from American
Psychological Association: http://www.apa.org/pi/ses/resources/publications/factsheet-
education.aspx
Banducci, S. A., Donovan, T., & Karp, J. A. (2004). Minority representation, Empowerment, and
participation. Southern Political Science Association, 534-556.
Boundless. (2014, November 10). Factors Affecting Voter Turnout. Retrieved November 11, 2014, from
Boudless political science: https://www.boundless.com/political-science/textbooks/boundless-
political-science-textbook/political-participation-and-voting-9/voter-turnout-69/factors-
affecting-voter-turnout-382-10708/
Boundless. (2014, July 3). Family, Peers, Church, and School. Retrieved December 15, 2014, from
Boundless Political Science: https://www.boundless.com/political-science/textbooks/boundless-
political-science-textbook/public-opinion-6/forming-public-opinion-45/family-peers-church-and-
school-260-5674/
Brady, H. E., Verba, S., & Schlozman, K. L. (1995). Beyond SES: A Reource Model of Political Participation.
American Political Science Review, 271-294.
CIRCLE. (2014, June 4). High School Civics Requirements and Assessments Vary Across the US. Retrieved
December 15, 2014, from Civic Youth : http://www.civicyouth.org/high-school-civics-
requirements-and-assessments-vary-across-the-u-s/?cat_id=10
Dudley, R. L., & Gitelson, A. R. (2002). Political Literay, Civic Education, and Civic Engagement: A Return
to Political Socialization. Applied Developmental Science, 175-182.
Galston, W. A. (2001). Political Knowledge, Political Engagement, and Civic Education. Annual Review of
Political Science, 217-234.
Godsay, S., Henderson, W., Levine, P., & Littenberg-Tobias, J. (2012, October 19). State Civic Eduacation
Requirements. Retrieved December 15, 2014, from Civic Youth: http://www.civicyouth.org/wp-
content/uploads/2012/10/State-Civic-Ed-Requirements-Fact-Sheet-2012-Oct-19.pdf
Government, U. (2014). Who are Socially Disadvantaged Individuals? Retrieved November 18, 2014,
from U.S. Small Business Administration: https://www.sba.gov/content/who-are-socially-
disadvantaged-individuals
Hart, D., Thomas, M. D., James, Y., & Robert, A. (2007). High School community Service as a Predictor of
adult Voting and Volunteering. American Educational Research Journal, 197-219.
IFES. (2014). Civic Education. Retrieved November 18, 2014, from International Foundation for Electoral
Systems: http://www.ifes.org/Content/Publications/Civic-
Education/2012/~/media/Files/Events/2012/Libya/Overview%20of%20Civic%20Education.pdf
Langer 19
Jennings, M. K., Stoker, L., & Bowers, J. (2009). Politics Across Generations: Family Transmission
Reexamined. The Journal of Politics, 782-799.
Lawless, J. L., & Fox, R. L. (2001). Political Participation of the Urban Poor. Social Problems, pp. 362 - 385.
Legal, U. (2014). Disadvantaged youth law and legal definition. Retrieved November 18, 2014, from
USlegal.com: http://definitions.uslegal.com/d/disadvantaged-youth/
Press, O. U. (2014). Oxford Dictionary. Retrieved November 18, 2014, from Oxford Dictionaries:
http://www.oxforddictionaries.com/us/definition/american_english/advantage