stress shielding at the bone-implant interface: influence
TRANSCRIPT
HAL Id: hal-02926452https://hal.archives-ouvertes.fr/hal-02926452
Submitted on 29 Dec 2020
HAL is a multi-disciplinary open accessarchive for the deposit and dissemination of sci-entific research documents, whether they are pub-lished or not. The documents may come fromteaching and research institutions in France orabroad, or from public or private research centers.
L’archive ouverte pluridisciplinaire HAL, estdestinée au dépôt et à la diffusion de documentsscientifiques de niveau recherche, publiés ou non,émanant des établissements d’enseignement et derecherche français ou étrangers, des laboratoirespublics ou privés.
Stress shielding at the bone-implant interface: influenceof surface roughness and of the bone-implant contact
ratioMaria Letizia Raffa, Vu-Hieu Nguyen, Philippe Hernigou, Charles-Henri
Flouzat- Lachaniette, Guillaume Haiat
To cite this version:Maria Letizia Raffa, Vu-Hieu Nguyen, Philippe Hernigou, Charles-Henri Flouzat- Lachaniette, Guil-laume Haiat. Stress shielding at the bone-implant interface: influence of surface roughness and ofthe bone-implant contact ratio. Journal of Orthopaedic Research, Wiley, 2020, �10.1002/jor.24840�.�hal-02926452�
Submitted to Journal of Orthopaedic Research 1
Stress shielding at the bone-implant interface: influence of surface roughness and of
the bone-implant contact ratio
Maria Letizia Raffaa, Vu-Hieu Nguyena, Philippe Hernigoub,c, Charles-Henri Flouzat-
Lachanietteb,c Guillaume Haiata,*
a CNRS, Laboratoire Modélisation et Simulation Multi Echelle, MSME UMR 8208, CNRS,
UPEC, F-94010, Créteil, France
b Service de Chirurgie Orthopédique et Traumatologique, Hôpital Henri Mondor AP-HP,
CHU Paris 12, Université Paris-Est, 51 avenue du Maréchal de Lattre de Tassigny, 94000
Créteil, France.
c INSERM U955, IMRB Université Paris-Est, 51 avenue du Maréchal de Lattre de Tassigny,
94000 Créteil, France.
*Corresponding author: Guillaume Haiat; Tel: (+33) 1 45 17 14 41; Fax: (+33) 1 45 17 14
33; E-mail: [email protected]
Running title: Stress shielding at the bone-implant interface
Authors' contributions
MLR performed the computation and wrote the first draft. VHN worked on the computation
and the study design. PH and CHFL critically revised the work. GH supervised the work. All
authors read and approved the final manuscript.
2
Abstract
Short and long-term stabilities of cementless implants are strongly determined by the
interfacial load transfer between implants and bone tissue. Stress-shielding effects arise from
shear stresses due to the difference of material properties between bone and the implant. It
remains difficult to measure the stress field in periprosthetic bone tissue. This study proposes
to investigate the dependence of the stress field in periprosthetic bone tissue on i) the implant
surface roughness, ii) material properties of bone and of the implant, iii) the bone-implant
contact ratio. To do so, a microscale 2-D finite element model of an osseointegrated bone-
implant interface was developed where the surface roughness was modeled by a sinusoidal
surface. The results show that the isostatic pressure is not affected by the presence of the
bone-implant interface while shear stresses arise due to the combined effects of a geometrical
singularity (for low surface roughness) and of shear stresses at the bone-implant interface (for
high surface roughness). Stress-shielding effects are likely to be more important when the
bone-implant contact ratio value is low, which corresponds to a case of relatively low implant
stability. Shear stress reach a maximum value at a distance from the interface comprised
between 0 and 0.1 time roughness wavelength λ and tend to 0 at a distance from the implant
surface higher than λ, independently from bone-implant contact ratio and waviness ratio. A
comparison with an analytical model allows validating the numerical results. Future work
should use the present approach to model osseointegration phenomena.
Keywords: bone-implant interface; surface roughness; stress-shielding; osseointegration;
finite element modeling
3
1. Introduction
Cementless implants have been used clinically for more than forty years, leading to important
progresses in orthopedic surgery. However, despite their routine clinical use, short and long-
term implant failures still occur and remain difficult to anticipate. After surgery, the high
contrast of mechanical properties between periprosthetic bone tissue and the implant
biomaterial may causes bone resorption1, a phenomenon defined as “stress-shielding” that is
visible radiographically2. Stress-shielding may cause aseptic loosening and a loss of bone
mineral density that increases the risk of periprosthetic fracture and makes revision surgery
more difficult3. Although some studies on total hip arthroplasty found that stress-shielding
may also have no clinical consequences2, even at a very-long term with anatomic
hydroxyapatite femoral components with high wear rates4, monitoring and preventing stress-
shielding has been recognized as an important action to obtain long-term fixation of joint
arthroplasties3.
Different authors have developed new biomaterials with lower mechanical properties
compared to titanium alloy, leading to a reduction of stress-shielding related effects5,6.
Long-term stability (also referred to as “secondary” stability) is obtained after the healing
processes corresponding to osseointegration phenomena7. The implant primary stability is
reinforced by the creation and maturation of newly formed bone tissue around the bone-
implant interface (BII)8,9. Osseointegration phenomena are stimulated by stresses applied to
bone tissue through the BII and the bone microstructure has been shown to be aligned along
the principal local loading direction, suggesting that mechanical stimuli act as local
regulators10. The quality of osseointegration phenomena is strongly influenced by the implant
surface roughness11, which can be obtained using different processes such as sand blasting12,
plasma spraying13 or laser blasting14. Interfacial load transfer between implants and bone
4
tissue determines osseointegration phenomena. Many biomechanical factors, including i)
external loading, ii) implant material properties, geometry and surface properties and iii)
periprosthetic bone tissue quality and quantity (defined by the bone-implant contact ratio,
denoted as BIC) strongly affect stress and strain fields distribution around osseointegrated
implants. All these intercorrelated features have a multiscale (from the nanometric scale up to
the organ scale) and multitime (from seconds up to several months) nature and contribute to
the evolution of the biomechanical properties of the BII. As a consequence, the mechanical
and microstructural properties of bone tissue around the implant surface (at a distance of up to
around 200µm from the implant) are determinant for the evolution of the implant stability as
well as for the surgical success15.
Despite the development of experimental techniques based on acoustical methods 10,16–18 to
characterize the BII properties, it remains difficult to measure the biomechanical properties of
the BII in vivo and there is a lack of experimental data at the scale of 1 to 100 µm19. In this
context, finite element (FE) modeling represent an interesting modality because all parameters
can be controlled and investigated independently, which is not possible when following an
experimental approach. Numerical simulations have been extensively used to investigate the
stress field in bone tissue at the scale of the implant (macroscale)20–25, allowing to investigate
the influence of implant design and mechanical properties on the implant stability.
Nevertheless, the effects of changes of micromechanical properties (such as the BIC ratio,
surrounding bone properties and the implant surface roughness) on the spatial variation of the
stress field around the BII remain unclear.
The aim of this study is to investigate the dependence of the local stress field in bone tissue
located around the BII on the implant mechanical properties and environment. To do so, a

5
microscale 2-D FE model based on previous work by authors26 is proposed. The model
accounts for the effects of implant surface roughness, of the bone and implant stiffness and of
the BIC ratio on the local stress field in bone tissue under tensile loading. The spatial
variation of the stress field in the direction perpendicular to the implant interface is also
investigated.
2. Material and methods
2.1. Mechanical model
2.1.1. Geometry
A 2-D micromechanical model of the contacting region between a cementless implant and
bone tissue is proposed in what follows. The model comprises two half-spaces corresponding
to an implant and to bone tissue respectively, separated each other by an irregular interphase
(i.e. a zone comprising the implant surface, bone tissue in partial contact with the implant and
a region filled with void in the simulation), as shown in Fig.1.
The implant surface in contact with bone tissue was assumed to be rough and was modeled by
a sinusoidal description, similarly as what was done in previous studies 27–29. The one-
dimensional sinusoidal surface of the implant of amplitude 2∆ and wavelength λ was
geometrically defined as:
𝐹(𝑥) = ∆ [1 − cos (2π𝑥
λ)] , 𝑥 ∈ [0,
λ
2] (1)
where F is the coordinate of the implant surface as a function of the local abscissa x, as shown
in Fig. 1c. Note that the standard parameters used in surface engineering to describe a surface
roughness (i.e. the arithmetical mean roughness Ra and the mean spacing Sm) can be related to

6
∆ and λ by : Ra ≅2∆
𝜋 and Sm ≅ λ. The waviness ratio ∆/λ was assumed as a model parameter
varying between 0.01 and 0.5. We verified that computations realized with different values of
∆ and λ but identical values of waviness ratio ∆/λ gave the same results, which justifies the
choice of the waviness ratio as a suitable parameter of the propsed model. The lowest limit
(0.01) of the waviness ratio represents a “microscopic” roughness corresponding to an
implant surface roughness obtained by sandblasting and/or acid etching, while the highest
limit corresponds to a “macroscopic” roughness due to the implant threading, for example in
the case of the pedicle screws20. The value 0.1 was taken as the reference value for ∆/λ in
what follows.
Due to the symmetry of the proposed configuration, a region of interest (ROI) comprising a
half period λ/2 of the BII (see Fig. 1b,c) was considered. The origin of the reference system
was defined at the point O shown in Fig. 1c. The ROI shown in Fig. 1c comprised bone tissue
and implant domains having a same thickness H = 1 mm along the y-direction.
The BIC ratio, which corresponds to the ratio of the bone in direct contact with the implant
surface, was described by the parameter h defined in Fig. 1c. Due to the sinusoidal geometry
of the implant roughness, the BIC ratio can be obtained geometrically as follows:
BIC = 𝐿𝑃
𝐿𝑇= 1 −
𝐸(2π𝑥𝑇
λ|−4𝜋2(
Δ
𝜆)
2)
2𝐸(−4𝜋2(Δ
𝜆)
2)
, (2)
where LP and LT represent the arc length of the sinusoidal implant surface in contact with
bone tissue and the total arc length of the implant boundary, respectively. LP and LT depend
on the amplitude ∆ and the wavelength λ of the sinusoidal implant surface through the
operators 𝐸(𝑧) = 𝐸 (𝜋
2|𝑧) and 𝐸 = (𝑧|𝑚) = ∫ √1 − 𝑚 sin2(𝑡)
𝑧
0d𝑡, which represent the
7
complete and incomplete elliptic integral of the second kind, respectively. In Eq. (2), xT
corresponds to the abscissa of the point T, as indicated in Fig. 1c.
The BIC ratio is a parameter of the proposed model and it assumed to vary between 5% and
80%15. For each BIC, ∆ and λ values the parameter h (see Fig. 1c) was calculated following
this two-step procedure:
i. the value of abscissa xT was explicitly derived from Eq. (2);
ii. the obtained abscissa was injected in Eq. (1) to calculate the corresponding value of h.
2.1.2. Materials
All materials were assumed to be linear-elastic and to have homogeneous isotropic
mechanical properties. Three different implant materials used in orthopedic applications were
considered: i) a titanium alloy (Ti-6Al-4V) with a Young’s modulus E of 113 GPa30; ii) a Ti-
Nb-Zr alloy (Ti-28Nb-35.4Zr) with E = 51 GPa 31 and iii) a metal-polymer composite (Ti-
35BPA) with E = 4.4 GPa 32. Two values of the bone Young’s modulus Eb were tested in
order to simulate i) cortical bone tissue: Eb = 2 GPa 33 and ii) trabecular bone: Eb = 0.2 GPa34.
All materials had a Poisson ratio ν equal to 0.3.
2.1.3. Boundary conditions and assumptions
The boundaries conditions, represented in Fig. 1c, were symmetric (u𝑥 = 0) on the
boundaries parallel to the y-axis. The boundary condition was fixed (u𝑦 = 0) on the lower
boundary (y = -H) of the bone domain. A uniaxial normal tension 𝜎0 = 25 MPa was applied
on the upper implant boundary (y = 2Δ+H). Continuity in terms of displacement and normal
stress fields holds at the contacting surfaces between bone and implant, which corresponds to
a perfect contact condition. Since the out-of-plane dimension of the ROI was assumed to be
8
larger than its height (2𝐻 + 2Δ) and the applied load was homogeneous, the assumption of
plane strain was made.
2.2. Numerical simulations
A standard linear elastic problem was solved by the finite element (FE) method. All
numerical analyses were carried out using Comsol Multiphysics® (Stockholm, Sweden).
2.2.1. Mesh generation and convergence
The finite element mesh used to run the numerical simulation, which was slightly changed
depending on the geometrical parameters, typically contained around 5700 second-order
triangular Lagrange elements, leading to a global system with about 21700 degrees of
freedom. The interpolation functions for the displacement field were quadratic.
A convergence study was performed to choose the suitable element size for all values of ∆/λ
considered in the present study. Note that the mesh size had to be lower at the tip of the non-
contact zone at the BII in order to better describe the stress concentration, which occurs
especially for lower values of ∆/λ. The minimum element size was set equal to 3×10⁻⁵ m.
With the chosen mesh size, the local error related to the displacement along y u𝑦 , is
‖u𝑦𝑟 −u𝑦
𝑎‖𝐿2
‖u𝑦𝑟 ‖
𝐿2= 0.006%, where ‖‖𝐿2 indicates the L2 norm, u𝑦
𝑟 and u𝑦𝑎 are respectively the
reference displacement obtained with a finest mesh size and the approximated displacement
calculated with the chosen mesh size (defined through the convergence study).
2.2.2. Parametric study and stress field indicators
Parametrical analyses were carried out in order to investigate the influence of the BIC ratio
(between 5% and 80%) and of the waviness ratio ∆/λ (between 0.01 and 0.5) on the spatial
variation of the stress field in periprosthetic bone tissue. For each configuration, two values of
9
the bone Young’s modulus (Eb = 0.2 and 2 GPa) and three different implant materials with
Young’s modulus E equal to 113 GPa, 51 GPa and 4.4 GPa were tested. The reference
configuration corresponds to the following parameters: BIC = 50%, ∆/λ = 0.1, E = 113 GPa
(Ti alloy) and Eb = 2 GPa (cortical bone).
In order to characterize the spatial variation of the stress fields in bone tissue, two parameters
were chosen: the maximal shear stress 𝜏𝑚𝑎𝑥 and the isostatic pressure𝑝𝑖𝑠𝑜. Both parameters
are associated to the principal stresses of the material as follows:
𝜏max(𝑥, �̃�) =𝜎𝑝1−𝜎𝑝3
2 , (3)
𝑝𝑖𝑠𝑜(𝑥, �̃�) =𝜎𝑝1+𝜎𝑝2+𝜎𝑝3
3, (4)
where �̃� =−𝑦
𝜆 is the non-dimensional coordinate indicating the distance from the implant
surface (see Fig. 1c), x is the local abscissa and 𝜎𝑝1, 𝜎𝑝2, 𝜎𝑝3 were the first, second and third
principal stresses in bone tissue, respectively (with 𝜎𝑝1 > 𝜎𝑝2 > 𝜎𝑝3).
The mean value of 𝜏𝑚𝑎𝑥 and of 𝑝𝑖𝑠𝑜 as a function of x was then determined for each values of
�̃� following:
⟨𝜏𝑚𝑎𝑥⟩(�̃�) =2
𝜆∫ 𝜏𝑚𝑎𝑥(𝑥, �̃�)
𝜆
20
𝑑𝑥, (5)
⟨𝑝𝑖𝑠𝑜⟩(�̃�) =2
𝜆∫ 𝑝𝑖𝑠𝑜(𝑥, �̃�)
𝜆
20
𝑑𝑥. (6)
The average values ⟨𝜏𝑚𝑎𝑥⟩(�̃�) and ⟨𝑝𝑖𝑠𝑜⟩(�̃�) were used as indicators of the level of the stress
field in periprosthetic bone tissue.
In order to compare the results obtained with different implant materials, the following
parameters were defined:
∆𝜏̅̅ ̅𝑇𝑖,𝑍𝑟(�̃�) =
2
𝜆∫ |𝜏𝑚𝑎𝑥
𝑇𝑖 (𝑥, �̃�)-𝜏𝑚𝑎𝑥𝑍𝑟 (𝑥, �̃�)|
𝜆
20
𝑑𝑥, (7)
∆𝜏̅̅ ̅𝑇𝑖,𝐵𝑃𝐴(�̃�) =
2
𝜆∫ |𝜏𝑚𝑎𝑥
𝑇𝑖 (𝑥, �̃�)-𝜏𝑚𝑎𝑥𝐵𝑃𝐴 (𝑥, �̃�)|
𝜆
20
𝑑𝑥, (8)
10
where 𝜏𝑚𝑎𝑥𝑇𝑖 (𝑥, �̃�) (respectively 𝜏𝑚𝑎𝑥
𝑍𝑟 (𝑥, �̃�) and 𝜏𝑚𝑎𝑥𝐵𝑃𝐴 (𝑥, �̃�)) corresponds to the value of the
maximum shear stress when considering titanium alloy (respectively Ti-Nb-Zr alloy and
metal-polymer composite) as the biomaterial used for the implant (obtained by Eq. (3)). The
indicator ∆𝜏̅̅ ̅𝑇𝑖,𝑍𝑟(�̃�) (respectively ∆𝜏̅̅ ̅
𝑇𝑖,𝐵𝑃𝐴(�̃�)) corresponds to the difference between the
maximum shear stress in bone when the implant is made of titanium alloy and the maximum
shear stress in bone when implant is made of Ti-Nb-Zr alloy (respectively metal-polymer
composite) averaged along x at each distance �̃� from the implant surface.
Note that ∆𝜏̅̅ ̅𝑇𝑖,𝑍𝑟(�̃�) and ∆𝜏̅̅ ̅
𝑇𝑖,𝐵𝑃𝐴(�̃�) depend on the waviness ratio ∆/λ and are indicators of
the reduction of the stress-shielding effect due to the modification of the implant material.
3. Results
3.1. Effect of the variation of the BIC ratio
⟨𝑝𝑖𝑠𝑜⟩/𝜎0 was shown to weakly vary as a function of �̃�. For all values of the BIC and of the
waviness ratio ∆/λ, the maximum relative variation between ⟨𝑝𝑖𝑠𝑜⟩/𝜎0 and 0.6191 was always
lower than 0.07%, the value of ⟨𝑝𝑖𝑠𝑜⟩/𝜎0 = 0.6191 corresponding to the solution obtained
for the planar BII. Consequently, the variation of the isostatic pressure will not be studied in
what follows and only the results in terms of the maximal shear stress will be considered.
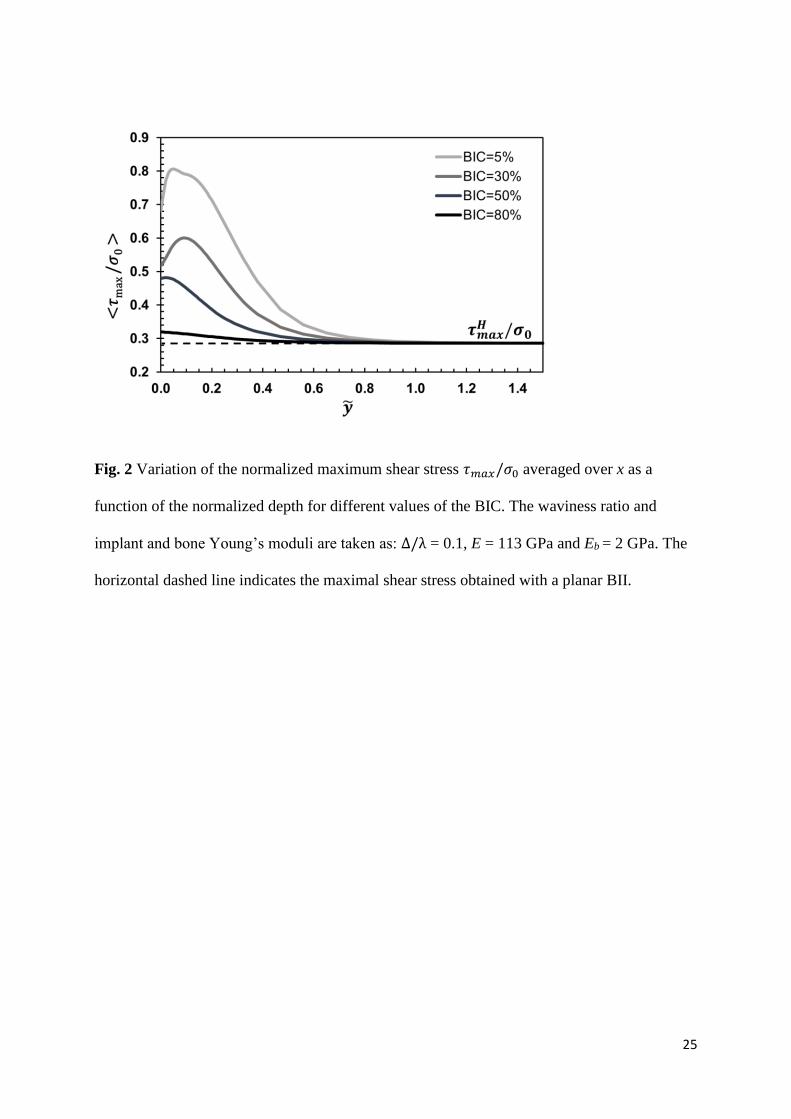
Figure 2 shows the effect of the BIC on the variation of the normalized maximum shear stress
𝜏𝑚𝑎𝑥/𝜎0 averaged over x as a function of the normalized depth �̃�. The waviness ratio, the
implant and the bone Young’s moduli are taken equal to the reference configuration: ∆/λ =
0.1, E = 113 GPa and Eb = 2 GPa. The maximum shear stress decreases as a function of the
BIC for all values of �̃�. Moreover, the maximum value of the maximum shear stress is
obtained for relatively low values of �̃� comprised between 0 (for high BIC values) and 0.1.

11
For all BIC values, 𝜏𝑚𝑎𝑥/𝜎0 tends towards the same value 𝜏𝑚𝑎𝑥
𝐻
𝜎0= 0.286 when �̃� > 1, which
corresponds to the value of the maximal shear stress obtained with a planar BII.
3.2 Effect of the waviness ratio ∆/𝛌
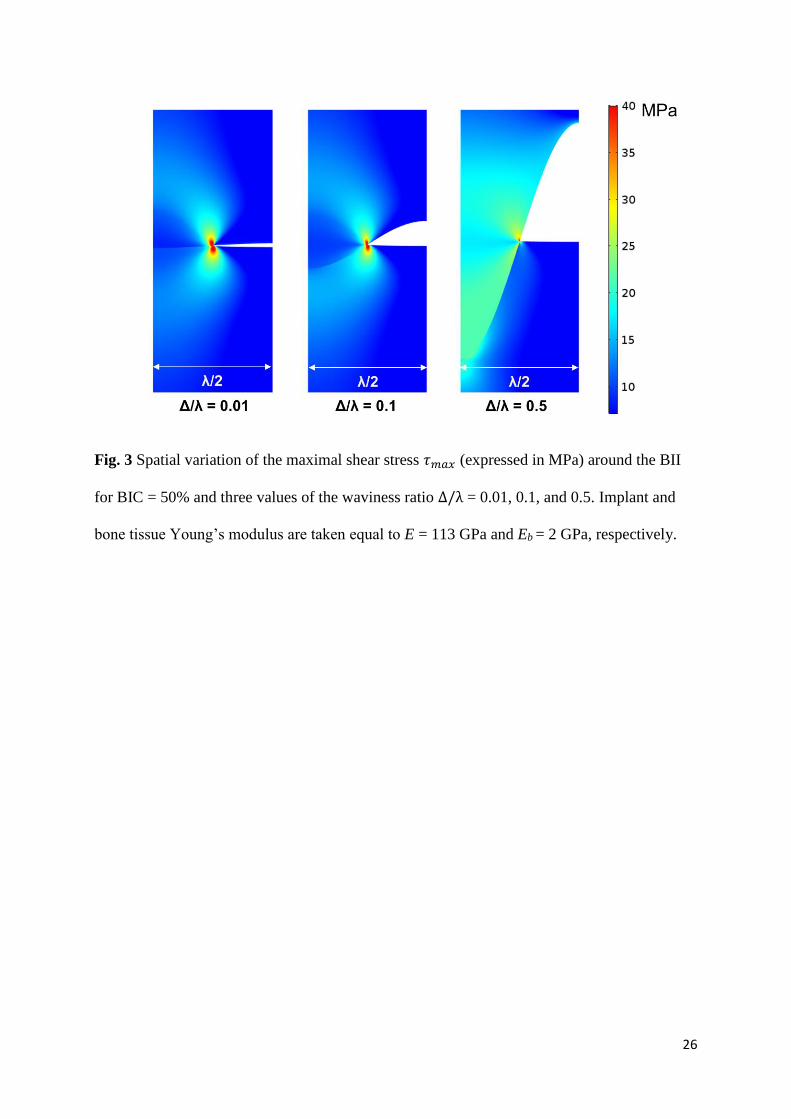
Figure 3 shows the spatial distribution of the maximal shear stress 𝜏𝑚𝑎𝑥 around the BII for a
BIC ratio equal to 50% and three waviness ratios ∆/λ = 0.01, 0.1, and 0.5. A stress
concentration is obtained at the intersection of the implant, bone tissue and of the void, which
can be explained by the singularity present at the crack tip. The stress concentration effect is
shown to be more important for lower values of ∆/λ, which can be explained by the fact that
the configuration becomes closer to a crack tip configuration compared to the cases of higher
values of ∆/λ.
Moreover, the value of the shear stress at the BII increases as a function of ∆/λ, which may be
explained by the fact that the normal of the interface moves from almost parallel to the y axis
for small values of ∆/λ to almost parallel to the x axis for ∆/λ = 0.5. These two competing
phenomena (crack tip related effect and the influence of the normal of the BII) may explain
the spatial variation of 𝜏𝑚𝑎𝑥.
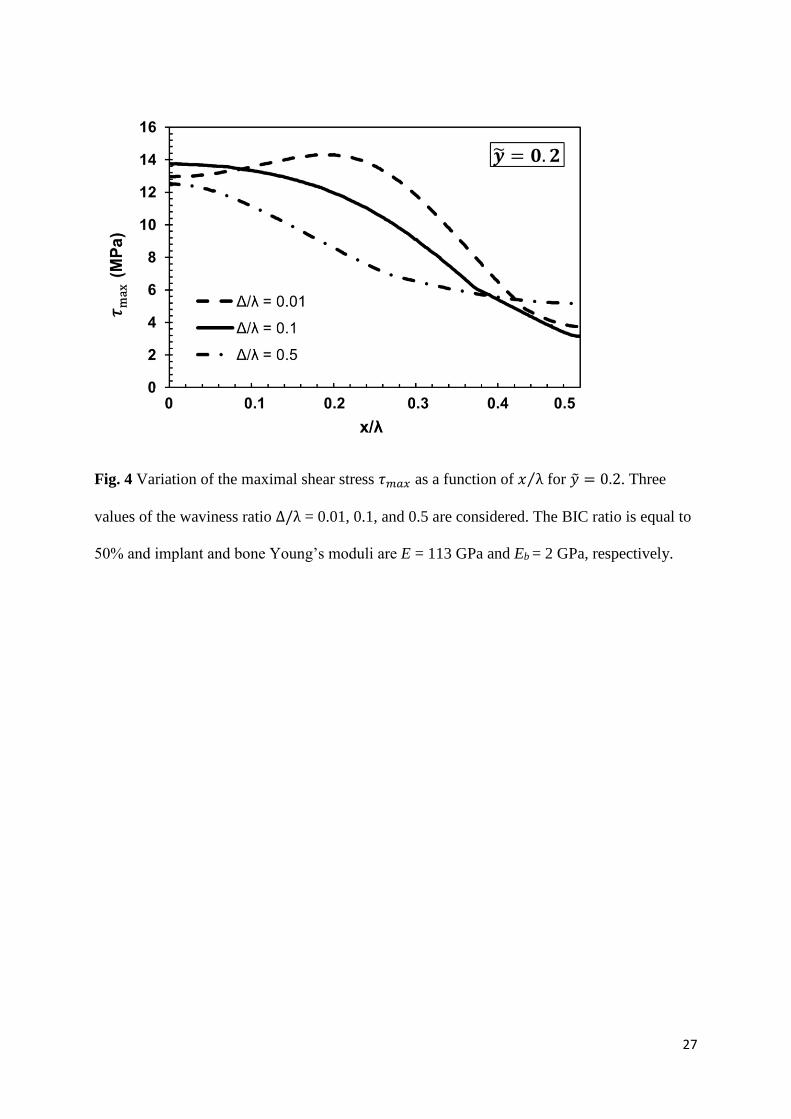
Figure 4 shows the variation of 𝜏max(𝑥, �̃� = 0.2) as a function of 𝑥 λ⁄ for three values of the
waviness ratios ∆/λ = 0.01, 0.1, and 0.5 and for a BIC ratio equal to 50%. Note that plotting
𝜏𝑚𝑎𝑥 for �̃� = 0.2 allows to be sufficiently far from the BII to avoid too strong effects of the
crack tip, and sufficiently close from the BII to obtain a significant spatial variation of 𝜏𝑚𝑎𝑥.
For ∆/λ = 0.01, the maximum value of 𝜏𝑚𝑎𝑥is obtained for 𝑥/λ = 0.2, which can be
explained by the influence of the stress concentration at the crack tip located at 𝑥/λ = 0.25.
However, for ∆/λ ≥ 0.1, the maximum value of 𝜏𝑚𝑎𝑥 is obtained for x = 0 due to the

12
stronger influence of the BII on the spatial distribution of shear stresses (see above and Fig.
3).
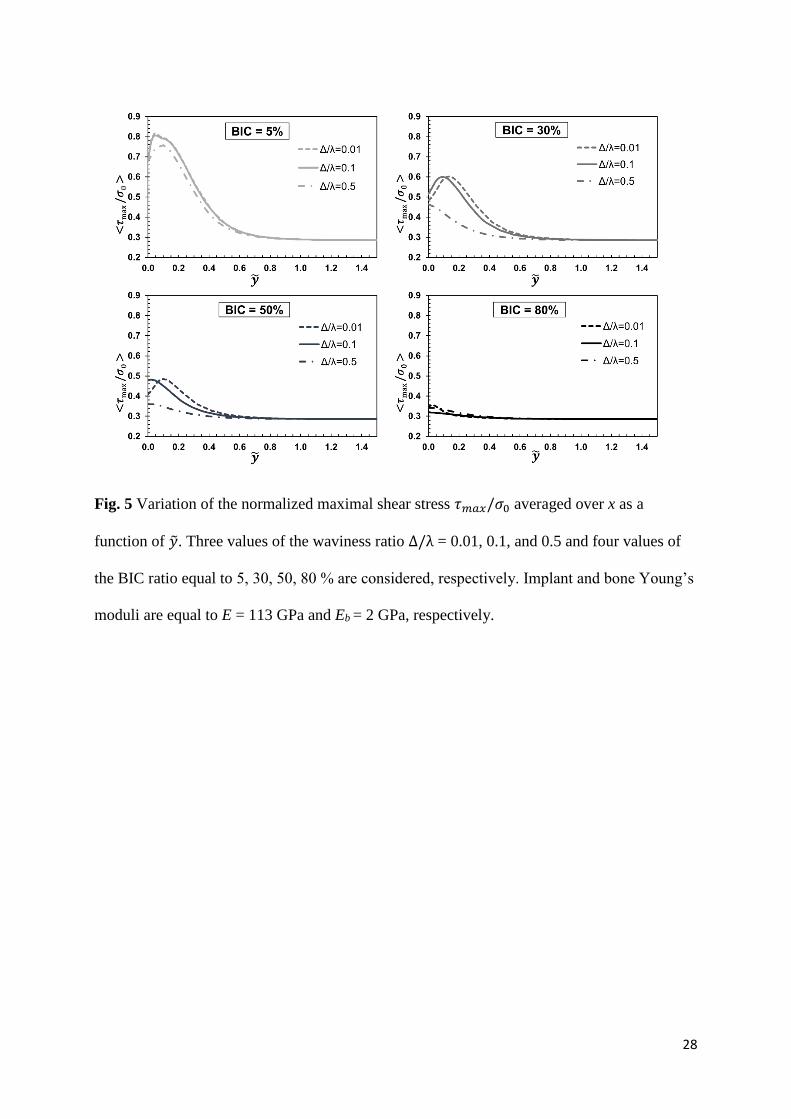
Figure 5 shows the variation of the normalized maximal shear stress 𝜏𝑚𝑎𝑥/𝜎0 averaged over x
as a function of �̃� for different values of ∆/λ and of the BIC. Figure 5 shows that the maximal
value of ⟨𝜏𝑚𝑎𝑥
𝜎0⟩ decreases when the BIC increases. The results obtained for the different values
of the waviness ratio when BIC = 5% are qualitatively similar, while the effect of the
waviness ratio on the distribution of the maximum shear stresses is significant for higher
values of the BIC ratio.
3.3 Effect of the bone Young’s modulus Eb
As indicated in Section 2.1, two bone types have been considered in the present study, i.e.
cortical bone tissue (with Eb = 2 GPa) and trabecular bone tissue (with Eb = 0.2 GPa).
Simulations considering both types of bone tissues were carried out for all values of BIC
(between 5 and 80 %) and waviness ratio (between 0.01 and 0.5). The relative difference
between the maximal shear stresses obtained with trabecular and cortical bone tissues is
always lower than 1.9 %, which indicates that the bone material properties weakly affect the
stress field distribution.
3.4 Effect of the implant stiffness
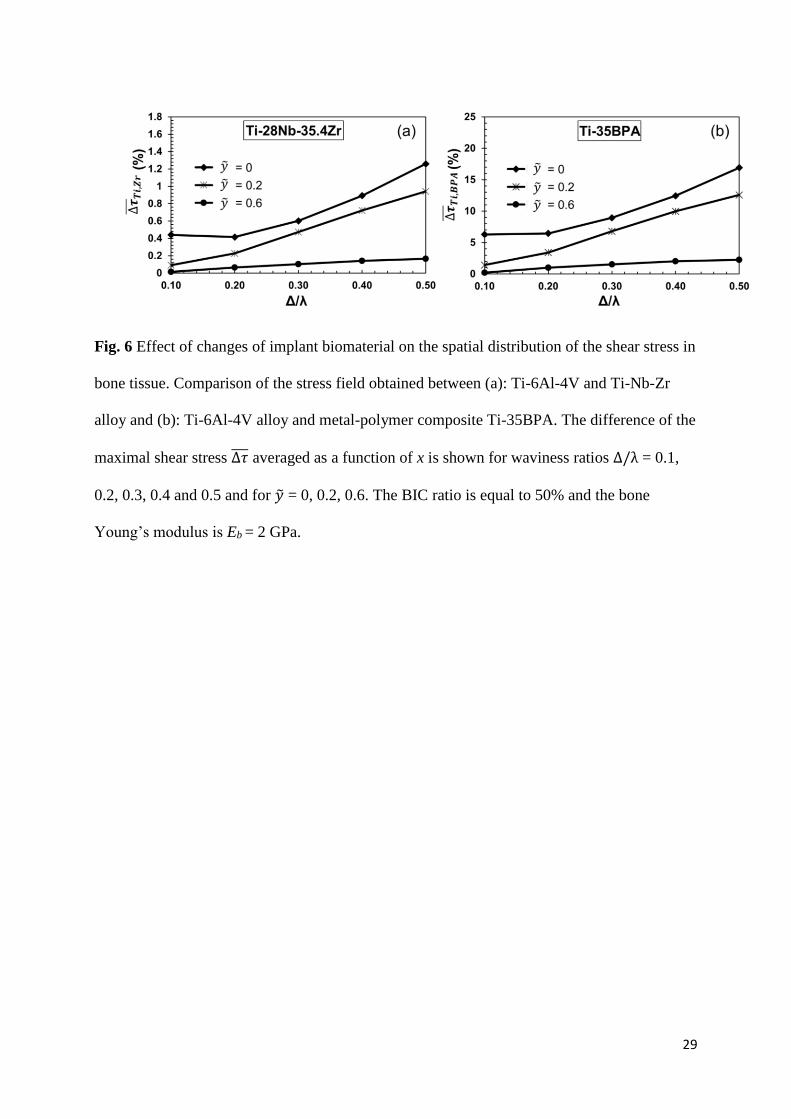
Figure 6 shows the variation of ∆𝜏̅̅ ̅𝑇𝑖,𝑍𝑟(�̃�) and ∆𝜏̅̅ ̅
𝑇𝑖,𝐵𝑃𝐴(�̃�) corresponding to the average
relative variation of the shear stress as a function of the waviness ratio ∆/λ for different
values of �̃� and for a BIC ratio equal to 50%. The results show that the reduction of maximal
shear stresses in bone tissue obtained with an implant made of Ti-Nb-Zr instead of Ti-6Al-4V
is lower than that obtained with an implant made Ti-35BPA instead of Ti-6Al-4V. Moreover,
∆𝜏̅̅ ̅𝑇𝑖,𝑍𝑟 and ∆𝜏̅̅ ̅
𝑇𝑖,𝐵𝑃𝐴 decrease as a function of �̃� and increase as a function of ∆/λ.
13
4 Discussion
A usual assumption made in implant biomechanics consists in considering that
osseointegration phenomena mainly occur in a region of interest located at a distance lower
than around 100-200µm20. Nevertheless, the distribution of the stress field around the BII at
the scale of several hundred micrometers remains unclear due to a lack of experimental
evidences. The originality of the present study is to investigate the spatial distribution of the
local stress field in the periprosthetic bone tissue, which is an important determinant of the
implant stability. To this aim, a microscale 2-D FE model of an osseointegrated BII taking
into account the effects of the implant roughness, of bone and implant stiffnesses and of the
BIC was developed. The influence of these parameters on the spatial variation of the stress
field around the BII is investigated, which leads to an estimation of the region of interest
where the presence of the implant influences the stress field and where osseointegration is
thus likely to be affected by the implant surface roughness.
The stress fields in bone tissue has been characterized in terms of maximal shear stress 𝜏𝑚𝑎𝑥
and isostatic pressure 𝑝𝑖𝑠𝑜 associated to the principal stresses. The results obtained in the
present study show that the isostatic pressure is not influenced by the implant surface
roughness for all values of the waviness ratio and of BIC, which may be explained by the fact
that 𝑝𝑖𝑠𝑜 is related to the changes of the ROI volume that does not occur for the proposed
model. However, the maximum shear stress is shown to be sensitive to the implant surface
roughness. These results are consistent with the work by Anderson et al.35 showing that a
compressive loading condition acting on an elastic body with a wavy interface may induce a
local state of shear stresses along the interface, even if a fully bounded interface is
considered35.

14
Figures 2 and 5 show the effect of the BIC on the maximal shear stress. The results show that
stress-shielding effects are likely to be more important when the BIC value is low, which
corresponds to a case of relatively low implant stability. These results emphasize the
importance of maximizing the BIC ratio in order to maximize the chances of surgical success
because of three reasons. First, increasing the BIC ratio is known to improve the implant
stability, which is a strong determinant of implant success 45. Second, increasing the BIC ratio
is known to favor osseointegration phenomena, which are defined by multiscale and multi-
time phenomena leading to bone apposition around the implant surface. Based on the results
obtained herein, it seems that bone ingrowth (i.e. bone apposition at the implant surface at the
scale of the surface roughness) is more important compared to bone ongrowth (i.e. bone
apposition on the implant surface at the scale of the implant, without considering the surface
roughness). Third, as shown in the present study, stress-shielding effects, which are
detrimental to the implant success, are more important when the BIC ratio decreases.
The maximum shear stress exhibits a maximum value comprised between �̃� = 0 and �̃� = 0.1
(according to the BIC and to the waviness ratio ∆/λ) and then decreases as a function of �̃� and
tends asymptotically to the value 𝜏𝑚𝑎𝑥𝐻 (see subsections 3.1 & 3.2). Note that for relatively
high BIC values (> 50%), the maximum of ⟨𝜏𝑚𝑎𝑥
𝜎0⟩ is always reached for �̃� = 0 (i.e. at the
implant surface) and ⟨𝜏𝑚𝑎𝑥
𝜎0⟩ is then a strictly decreasing function of �̃�. This last result provide
an estimation of the region of interest where stress-shielding are likely to be significant.
The aforementioned distribution of ⟨𝜏𝑚𝑎𝑥
𝜎0⟩ as a function of �̃� may be explained by considering
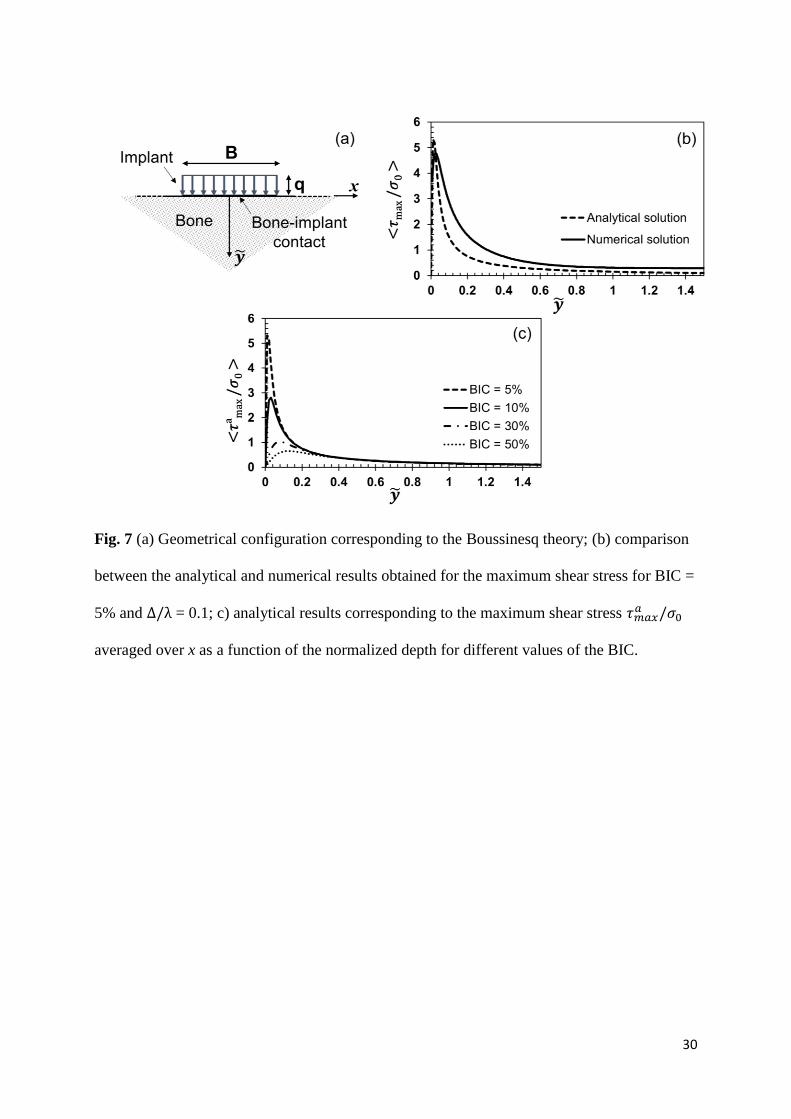
an analytical model corresponding to the Boussinesq theory36. As illustrated in Fig. 7a, the
contact pressure induced by the implant surface is modeled by a linear load applied on a line
of length B acting on a semi-infinite space corresponding to bone tissue, with an amplitude q
that is taken equal to the normal stress averaged over the contacting BII derived from FE
15
model. The value of B is equal to xT (see Fig. 1c). The maximum shear stress 𝜏𝑚𝑎𝑥
𝑎 (�̃�) derived
from this analytical model for x = 0 writes36:
𝜏𝑚𝑎𝑥𝑎 (�̃�) =
𝑞 sin 𝛼
𝜋 , (9)
where 𝛼 = 2 tan−1 (−𝐵
2 𝜆�̃�). The comparison between the analytical solution and the
numerical solution for BIC = 5% and ∆/λ = 0.1 is shown in Fig. 7b. A good agreement is
obtained for the amplitude and the position of the peak of the maximum shear stress. Note
that the numerical solution does not tend to zero, as the analytical solution does, which is due
to the confined boundary conditions assumed in the numerical model (see Fig. 1c). The
slightly difference between analytical and the numerical results shown in Fig. 7b is due to the
difference in terms of the distribution of the contact pressure, which is approximated to a
linear distribution in the analytical case. A good agreement between analytical and numerical
models is obtained also for other values of the BIC as can be appreciated by comparing Fig. 5
and Fig. 7c. The analytical model allows understanding the decrease of the peak value of
⟨𝜏𝑚𝑎𝑥
𝜎0⟩ when BIC increases (see Fig. 7c), which is due to an increasing contact area (contact
length in 2-D case) between implant surface and bone tissue.
As shown in Figs. 3&4, the stress distribution around the BII strongly depends on the
waviness ratio ∆/λ, which may be explained by the fact that the singularity at the tip of the
non-contact zone is stronger for lower values of ∆/λ, as shown in Fig. 3. When ∆/λ = 0.5,
the maximal shear stress 𝜏𝑚𝑎𝑥 is almost uniformly distributed along the implant surface in
contact with bone tissue, and the localization of the stresses at the tip is negligible. This last
result is consistent with the “crack-like” behavior of the non-contact zone that is highlighted
for waviness ratio lower than 0.03 26.

16
As shown in Fig. 5, ⟨𝜏𝑚𝑎𝑥
𝜎0⟩ − ⟨
𝜏𝑚𝑎𝑥𝐻
𝜎0⟩ ≈ 0 when �̃� ≥ 0.8 for all BIC and waviness ratios, which
indicates that the region in the surrounding bone tissue affected by the surface roughness is
located at a distance lower than the amplitude of the implant roughness. This result is
consistent with the belief that the evolution of the bone properties, at a distance of several
hundred micrometers from the interface, are determinant for the implant success; since such
distance corresponds to typical roughness wavelength used in many orthopedic implants20.
The effects of changes of the implant stiffness on stress-shielding phenomena was
investigated in this study. Stress-shielding phenomena come from shear stresses at the BII
generated by the strong gap of mechanical properties between bone tissue and the implant.
The results shown in Fig. 6 provide a quantitative indication of the decrease of stress-
shielding phenomena when using Ti-Nb-Zr alloy and a metal-polymer composite (Ti-35BPA)
compared to titanium implant (Ti-6Al-4V). As expected, it is found a stronger decrease of
stress-shielding effects for Ti-35BPA compared to Ti-28Nb-35.4Zr for all waviness ratio at
all depth �̃� (see Fig. 6). ∆𝜏̅̅ ̅𝑇𝑖,𝑍𝑟 and ∆𝜏̅̅ ̅
𝑇𝑖,𝐵𝑃𝐴 decrease as a function of �̃�, which is due to fact
that the maximal shear stress decrease as a function of �̃� for all implant roughness and BIC
values (see Figs. 2&5).
This study has several limitations. First, a sinusoidal description of the implant surface
roughness is used, similarly as papers 26, 37. This description constitutes a strong
approximation and considering the real surface texture is likely to lead to different results.
However, comparable approaches have already been developed in contact mechanics 27-29,38
and arbitrary irregular surface may be easily generated from a collection of sinusoidal
surfaces, which should be done in the future. Second, bone material properties were assumed
to be linearly elastic, homogeneous and isotropic and fluid-structure interactions were
17
neglected, similarly as what was done in various previous FE-based numerical studies 22-25,39.
However, newly formed bone properties are heterogeneous40 and viscoelastic, which was
neglected herein. The assumption of bone homogeneity implies a simplified modeling of the
bone microstructure, which may include cavities at various scales41,42. Third, it was not
possible to perform an experimental validation due to the difficulty of measuring stress
distribution around the implant. Fourth, adhesion phenomena at the BII43, 44 that may be
important in particular at early stage of osseointegration were not taken into account, which
should be considered in the future.
Conclusion
This study proposes a model of the influence of the implant surface roughness, of the stiffness
of bone and implant and of the BIC on the local stress field in periprosthetic bone tissue. The
proposed FE model shows that the influence of the surface roughness is limited to a distance
corresponding approximately to the wavelength of the surface roughness, which is consistent
with previous results. The results obtained in the present study emphasize the importance of
maximizing the bone-implant contact ratio at the microscopic scale not only to improve
osseointegration phenomena, but also to minimize stress-shielding effects that are shown to occur in
bone tissue mostly in region of interests located at a distance of the order of the surface roughness
from the implant surface.
Based on the computation of the stress field around the implant, future works should focus on
introducing bone remodeling at the local scale in order to model osseointegration phenomena
and the evolution of the BII.
18
Acknowledgements
This project has received funding from the European Research Council (ERC) under the
European Union’s Horizon 2020 research and innovation program (grant agreement No
682001, project ERC Consolidator Grant 2015 BoneImplant).
Conflict of Interest: the authors declare that they have no conflict of interest.
References
1. Paul JP. 1999. Strength requirements for internal and external prostheses. J Biomech.
32(4):381–93.
2. Engh Jr, C. A., Young, A. M., Engh Sr, C. A., & Hopper Jr, R. H. 2003. Clinical
consequences of stress shielding after porous-coated total hip arthroplasty. Clinical
Orthop Relat Res. 417:157-163.
3. Kusano, T., Seki, T., Higuchi, Y., Takegami, Y., Osawa, Y., & Ishiguro, N. 2018.
Preoperative Canal Bone Ratio is Related to High-Degree Stress Shielding: A
Minimum 5-Year Follow-Up Study of a Proximally Hydroxyapatite-Coated Straight
Tapered Titanium Femoral Component. J Arthroplasty. 33(6):1764-1769.
4. García-Rey, E., Carbonell-Escobar, R., Cordero-Ampuero, J., & García-Cimbrelo, E.
2019. Outcome of a hemispherical porous-coated acetabular component with a
proximally hydroxyapatite-coated anatomical femoral component: an update at 23 to
26 years’ follow-up. Bone Joint J. 101(4):378-385.
5. Arabnejad S, Johnston B, Tanzer M, Pasini D. 2017. Fully porous 3D printed titanium
femoral stem to reduce stress‐shielding following total hip arthroplasty. J Orth Res.
35(8):1774-1783.
19
6. Korabi R, Shemtov‐Yona K, Rittel D. 2017. On stress/strain shielding and the material
stiffness paradigm for dental implants. Clin Implant Dentistry Rel Res. 19(5): 935-
943.
7. Albrektsson T, Johansson C. 2001. Osteoinduction, osteoconduction and
osseointegration. Eur Spine J. 10(2):96–101.
8. Abrahamsson I, Berglundh T, Linder E, et al. 2004. Early bone formation adjacent to
rough and turned endosseous implant surfaces. An experimental study in the dog. Clin
Oral Implant Res. 15(4):381–392.
9. Berglundh T, Abrahamsson I, Albouy JP, Lindhe J. 2007. Bone healing at implants
with a fluoride-modified surface: an experimental study in dogs. Clin Oral Implants
Res. 18(2):147–152.
10. Albrektsson T, Dahl E, Enbom L et al. 1988. Osseointegrated oral implants: a Swedish
multicenter study of 8139 consecutively inserted Nobelpharma implants. J
Periodontol. 59(5):287–296.
11. Orr AW, Helmke BP, Blackman BR, Schwartz MA. 2006. Mechanisms of
mechanotransduction. Dev Cell. 10(1):11–20.
12. Rønold HJ, Ellingsen JE. 2002. Effect of micro-roughness produced by TiO2
blasting—tensile testing of bone attachment by using coin-shaped implants.
Biomaterials. 23(21):4211–4219.
13. Wennerberg A, Jimbo R, Stübinger S, et al. 2014. Nanostructures and hydrophilicity
influence osseointegration: a biomechanical study in the rabbit tibia. Clin Oral
Implants Res. 25(9):1041–1050.
20
14. Pető, G., Karacs, A., Pászti, Z., Guczi, L., Divinyi, T., & Joób, A. 2002. Surface
treatment of screw shaped titanium dental implants by high intensity laser pulses.
Applied Surf Sci. 186(1-4):7-13.
15. Götz HE, Müller M, Emmel A, et al. 2004. Effect of surface finish on the
osseointegration of laser-treated titanium alloy implants. Biomaterials. 25(18):4057–
4064.
16. Deng B, Tan KB, Liu GR, Lu Y. 2008. Influence of osseointegration degree and
pattern on resonance frequency in the assessment of dental implant stability using
finite element analysis. Int J Oral Maxillofac Implants. 23(6): 1082-8.
17. Michel A, Bosc R, Vayron R, Haiat G. 2016. Assessing the acetabular cup implant
primary stability by impact analysis: a cadaveric study. PLOS One. 11(11):0166778.
18. Vayron R, Soffer E, Anagnostou F, Haïat G. 2014. Ultrasonic evaluation of dental
implant osseointegration. J Biomech. 47(14):3562–3568.
19. Hecht S, Adams WH, Narak J, Thomas WB. 2011. Magnetic resonance imaging
susceptibility artifacts due to metallic foreign bodies. Vet Radiol Ultrasound.
52(4):409–414.
20. Haiat G, Wang HL, Brunski J. 2014. Effects of biomechanical properties of the bone-
implant interface on dental implant stability: from in silico approaches to the patient’s
mouth. Annu Rev Biomed Eng. 16:187–213.
21. Ryu H-S, Namgung C, Lee J-H, Lim Y-J. 2014. The influence of thread geometry on
implant osseointegration under immediate loading: a literature review. J Adv
Prosthodont. 6(6):547–54.

21
22. Baggi L, Cappelloni I, Maceri F, Vairo G. 2008. Stress-based performance evaluation
of osseointegrated dental implants by finite-element simulation. Simul Model Pract
Theory. 16(8):971–987.
23. Natali AN, Pavan PG, Ruggero AL. 2006. Analysis of bone–implant interaction
phenomena by using a numerical approach. Clin Oral Implants Res. 17(1):67–74.
24. Baggi L, Cappelloni I, Di Girolamo M, et al. 2008. The influence of implant diameter
and length on stress distribution of osseointegrated implants related to crestal bone
geometry: a three-dimensional finite element analysis. J Prosthet Dent. 100(6):422–31.
25. Maceri F, Martignoni M, Vairo G. 2009. Optimal mechanical design of anatomical
post-systems for endodontic restoration. Comput Methods Biomech Biomed Engin.
12(1):59–71.
26. Raffa M L, Nguyen V-H, Haiat G. 2019. Micromechanical modeling of the contact
stiffness of an osseointegrated bone-implant interface. BioMed Engin OnLine 18, 114
doi:10.1186/s12938-019-0733-3
27. Johnson K, Greenwood J, Higginson J. 1985. The contact of elastic regular wavy
surfaces. Int J Mech Sci. 27(6):383–396.
28. Ciavarella M. 2015. Adhesive rough contacts near complete contact. Int J Mech Sci.
104:104–111.
29. Yastrebov VA, Anciaux G, Molinari J-F. 2014. The contact of elastic regular wavy
surfaces revisited. Tribol Lett. 56(1):171–183.
30. Mishra AK, Davidson JA, Poggie RA et al. 1996. Mechanical and tribological
properties and biocompatibility of diffusion hardened Ti-13Nb-13Zr—a new titanium
22
alloy for surgical implants. In: Medical Applications of Titanium and Its Alloys: The
Material and Biological Issues. ASTM International.
31. Xu W, Li M, Wen C, et al. 2018. The Mechanical Properties and In Vitro
Biocompatibility of PM-Fabricated Ti-28Nb-35.4 Zr Alloy for Orthopedic Implant
Applications. Materials. 11(4):E531.
32. Okulov IV, Weißmüller J, Markmann J. 2017. Dealloying-based interpenetrating-
phase nanocomposites matching the elastic behavior of human bone. Sci Rep. 7(1):20.
33. Vayron R, Barthel E, Mathieu V et al. 2012. Nanoindentation measurements of
biomechanical properties in mature and newly formed bone tissue surrounding an
implant. J Biomech Eng. 134(2):021007.
34. Wazen RM, Currey JA, Guo H, et al. 2013. Micromotion-induced strain fields
influence early stages of repair at bone–implant interfaces. Acta Biomater. 9(5):6663–
6674.
35. Anderson E, Li R, Chew HB. 2014. Negative stiffness induced by shear along wavy
interfaces. J Mech Phys Solids. 63:285–97.
36. Boussinesq J. 1885. Application des potentiels à l’étude de l’équilibre et du
mouvement des solides élastiques: principalement au calcul des déformations et des
pressions que produisent, dans ces solides, des efforts quelconques exercés sur une
petite partie de leur surface ou de leur intérieur: mémoire suivi de notes étendues sur
divers points de physique, mathematique et d’analyse. Vol. 4. Gauthier-Villars.

23
37. Hériveaux Y, Nguyen V-H, Haïat G. 2018. Reflection of an ultrasonic wave on the
bone-implant interface: A numerical study of the effect of the multiscale roughness. J
Acoust Soc Am. 144(1):488–99.
38. Kozachok O, Martynyak R. 2019. Contact problem for wavy surfaces in the presence
of an incompressible liquid and a gas in interface gaps. Math Mech Solids. 24(11),
3381–3393
39. Rourke DO, Al-Dirini R, Taylor M. 2018. Primary stability of a cementless acetabular
cup in a cohort of patient-specific finite element models. J Orthop Res. 36(3):1012-
1023.
40. Vayron R, Matsukawa M, Tsubota R, et al. 2014. Evolution of bone biomechanical
properties at the micrometer scale around titanium implant as a function of healing
time. Phys Med Biol. 59(6):1389.
41. Cowin SC. 2001. Bone mechanics handbook. CRC press.
42. Fritsch A, Hellmich C. 2007. "Universal"microstructural patterns in cortical and
trabecular, extracellular and extravascular bone materials: micromechanics-based
prediction of anisotropic elasticity. J Theor Biol. 244(4):597–620.
43. Rojek J, Telega JJ. 1999. Numerical simulation of bone-implant systems using a more
realistic model of the contact interfaces with adhesion. J Theor Appl Mech. 659-686.
44. Immel, K., Duong, T. X., Nguyen, V. H., et al. 2020. A modified Coulomb's law for
the tangential debonding of osseointegrated implants. Biomech Model Mechanobiol.
1-18.

24
45. Mathieu, V., Vayron, R., Richard, G., et al. 2014. Biomechanical determinants of the
stability of dental implants: influence of the bone-implant interface properties. J
Biomech. 47(1):3-13.
Figure legends
Fig. 1 Geometrical configuration of the BII. (a): macroscopic description corresponding to a
femoral stem taken as an example, (b): mesoscopic description of the BII and (c): microscopic
description of the mechanical model of the region of interest.
25
Fig. 2 Variation of the normalized maximum shear stress 𝜏𝑚𝑎𝑥/𝜎0 averaged over x as a
function of the normalized depth for different values of the BIC. The waviness ratio and
implant and bone Young’s moduli are taken as: ∆/λ = 0.1, E = 113 GPa and Eb = 2 GPa. The
horizontal dashed line indicates the maximal shear stress obtained with a planar BII.
26
Fig. 3 Spatial variation of the maximal shear stress 𝜏𝑚𝑎𝑥 (expressed in MPa) around the BII
for BIC = 50% and three values of the waviness ratio ∆/λ = 0.01, 0.1, and 0.5. Implant and
bone tissue Young’s modulus are taken equal to E = 113 GPa and Eb = 2 GPa, respectively.
27
Fig. 4 Variation of the maximal shear stress 𝜏𝑚𝑎𝑥 as a function of 𝑥 λ⁄ for �̃� = 0.2. Three
values of the waviness ratio ∆/λ = 0.01, 0.1, and 0.5 are considered. The BIC ratio is equal to
50% and implant and bone Young’s moduli are E = 113 GPa and Eb = 2 GPa, respectively.
28
Fig. 5 Variation of the normalized maximal shear stress 𝜏𝑚𝑎𝑥/𝜎0 averaged over x as a
function of �̃�. Three values of the waviness ratio ∆/λ = 0.01, 0.1, and 0.5 and four values of
the BIC ratio equal to 5, 30, 50, 80 % are considered, respectively. Implant and bone Young’s
moduli are equal to E = 113 GPa and Eb = 2 GPa, respectively.
29
Fig. 6 Effect of changes of implant biomaterial on the spatial distribution of the shear stress in
bone tissue. Comparison of the stress field obtained between (a): Ti-6Al-4V and Ti-Nb-Zr
alloy and (b): Ti-6Al-4V alloy and metal-polymer composite Ti-35BPA. The difference of the
maximal shear stress ∆𝜏̅̅ ̅ averaged as a function of x is shown for waviness ratios ∆/λ = 0.1,
0.2, 0.3, 0.4 and 0.5 and for �̃� = 0, 0.2, 0.6. The BIC ratio is equal to 50% and the bone
Young’s modulus is Eb = 2 GPa.
30
Fig. 7 (a) Geometrical configuration corresponding to the Boussinesq theory; (b) comparison
between the analytical and numerical results obtained for the maximum shear stress for BIC =
5% and ∆/λ = 0.1; c) analytical results corresponding to the maximum shear stress 𝜏𝑚𝑎𝑥𝑎 /𝜎0
averaged over x as a function of the normalized depth for different values of the BIC.