structure and band gap energies of nano titanium dioxide doped with the fifth group elements
TRANSCRIPT
Chemical and Process Engineering Research www.iiste.org
ISSN 2224-7467 (Paper) ISSN 2225-0913 (Online)
Vol.25, 2014
67
Structure and Band Gap Energies of Nano Titanium Dioxide
Doped With the Fifth Group Elements Mohsin E.Al-Dokheily
[email protected] Qar-Chem. Dept. College of Science / University of Thi
Abstract
Titanium dioxide powders were synthesized by adding different fifth group elements precursors to titanium (IV)
isopropoxide followed by calcination at 500-600 ⁰C. Diffractograms showed the presence of anatase phase
accept for phosphorus which has amorphous- poly crystalline phase then established a rutile phase among
heating above 500⁰C. Particle size distribution and AFM images indicate the nano dimensions of the studied
powders. Particle size distribution varied appreciably in comparison with crystallite size (L) calculated from
Scherer formula. Band gap energies calculated from Uv-Vis spectra of thin films deposited on one side of quarts
substrate. The band gap energies of –Fifth group elements of this work ranged from 2.83 eV for
to2.83 eV for Bi with a steady increase according to atomic radii accepts for antimony which deviated
from that behavior
Keywords: , Doping, fifth group, Dffractograms, AFM, Band gap
1. Introduction
The large band gap energy of anatase crystalline phase (Zaleska 2008) has imposed
significant limitations on its application particularly in the interior places. Titanium dioxide can utilize only a
limited portion of solar radiation, the UV fraction which is at most about 5 percent (Janczarek etal 2007).
Titanium dioxide is an n-type semiconductor, and that behavior arises due to oxygen vacancies and creation of
sites (Pelaeza 2012). Rutile phase posses a wider 3d band gap compared to anatase due to localization of
3d states (Di valentine and Pacchioni 2004).
In spite of rutile phase has a band gap compared to of
anatase phase, yet anatase considered to have superior photocatalytic activity because of its larger surface area
(Sclafani and Hermann 1996). Extending the absorption of light to the visible range and improving
photocatalytic activity require the modification of the band gap.
Implementation of metal and non-metal ions into the lattice of as dopant will bring about a significant
lowering of gap energies. Several methods including various types of dopant (Zaleska 2008, Xz and Fa2001,
Hsuan-Chung etal 2012), those dopants include d- orbital's transition metals, but more recently non-metals
including and . Also various preparation methods were suggested including chemical vapor
deposition (Ding etal 2001) sol gel films(Brinker and Sherar 1990) multilayer deposition (Saciu etal 2009) and
pyrolysis of sprays (Raut etal 2009). Anatase titanium dioxide has a tetragonal crystal
structure, , , while rutile, has a tetragonal crystal structure
, .The presence of d-orbital and anionic dopants impair
pronounced effects on the titanium dioxide properties (Hanaor and Sorrell 2010). Those effects might lead to
reduction of the band gap by creation of new trapping sites which may also control phase transformation to
rutile. Cationic dopants may replace of the anatase lattice or may fall on the boundaries of unit cells
(Mackenzie 1975). In contrary anionic dopants might replace oxygen of the lattice (Asahi etal 2011). However
influence of doping on geometric structure of and virtually optical mechanisms have been calculated by
many researchers, (Guo and Du2012) utilized Cambridge Serial Total Energy Package (CASTEP) to study
and doped anatase . Density functional theory calculations were used to characterize the doping
effects of substituting for in anatase Tran etal 2011). The phase stability in doped was carried
out using all- electron atomic orbital's methods with local density approximation (Hanaor 2012). The effect of
doping on the surface properties of anatase and rutile were performed using photon - energy range UPS
( ) which is extremely surface sensitive (Batzill etal 2006. Substantial efforts have been subjected
toward the commercialization of doped photo catalyses of self cleaning for organic and inorganic
compounds in the environment (Fujishima etal 2006).
In this work the band gap was modified by doping with the elements of the fifth group including
and using a well established sol- gel method. The structure of prepared powders, particle size and
their distribution were identified by XRD and AFM microscopy. The band gap energies were calculated from the
UV spectra.
2. Experimental
2.1 Materials
Titanium dioxide anatase (Degussa, purity 99%) used as received without any further treatments. Doped titanium
dioxide powders were synthesized as follow: to 10 ml titanium (IV) tetraisopropoxide (Aldrich Purity 97%)
Chemical and Process Engineering Research www.iiste.org
ISSN 2224-7467 (Paper) ISSN 2225-0913 (Online)
Vol.25, 2014
68
appropriate amount of dopants precursors were added, stirred (Magnetic stirrer LMS100) at 30 forming a
viscous milky like suspension within 10 minutes ,which is then broke down to a powder after 3 -4 hours of
continuous stirring . The powder filtered, dried (Drying oven Fisher Scientific) at 120 for an hour. The dried
powder calcined at 300- 900 (Muffle furnace LEF1055, Jlabtech) for an extra hour at each preset temperature
.The following precursors were added to titanium (IV) tetraisopropoxide, 5ml of 35% ammonium hydroxide
(Aldrich) for N - , 5 ml of 1M basic solution of ( Fluka) for , 5 ml of 1M of
(BDH) for , 5 ml of 1M basic solution of (BDH) for and 5 ml of 1M of
(Fluka) for . Prepared doped powders have different color shades depending as well as on the
calcinations temperatures.
2.2 Measurements
2.2.1 XRD
Titanium dioxide and doped titanium dioxide powder XRD were recorded on PAN analytical X'pert PRO MPD
using as a source for X-ray radiation of from .
2.2.2 AFM
Two dimensional and three dimensional particles size and their size distribution were recorded by AA2000
atomic force microscope product of Angstrom Advanced Inc.
2.2.3 Band gap energies
For doped titanium dioxides films were calculated from absorbance spectra recorded on double – beam Uv-Vis
spectrophotometer (T90 +) PG instruments. The films were prepared by dipping pre-cleaned quarts substrates
vertically in a beaker containing 0.5 g of the synthesized powder suspended in 25 ml deionized water for 30
minutes. The substrate then air dried first and subsequently in an oven at 105 ⁰C for 2 hours. The films deposited
on one side of quartz substrates were placed in the sample beam, while uncoated substrate placed in the reference
path. The following equation (Mohd etal 2011) was applied
Where ν is the frequency in nm, h is the Planks constant and k is a constant. A plot of ( versus hν (eV)
gives the band gap value in eV at the intersection of a straight line drawn as a tangent with the x- axis at the
absorbance edge.
3. Results and discussions
The fifth group contains two non-metals and , as well as three metals and Bi. It's well accepted that
nitrogen among the best dopants narrowing appreciably the band gap of . According to many theoretical
studies nitrogen and phosphorus also might substitute oxygen in titanium dioxide lattice, while other metal
members of the group might replace the titanium atom in the lattice. The entire group's elements have
, outer shell configuration with atomic radii ranging from for to
for . The group's elements have a correlated opportunity to interact with (atomic radius ) and
of lattice. Therefore the fifth group will present a good model to
evaluate the effects of doping. However titanium dioxide provide three possible accommodation sites for
dopants, the two substitution site for titanium and oxygen already mentioned above, and the third to interstitial
site . The effects of doping include phase transformation from anatase to rutile, and to induce alteration in the
electronic structure leads to band gap narrowing facilitating visible light absorption. Both effects were quite
evident in forthcoming results.
Figure 1 shows XRD patterns of anatase and different calcined doped . Strong diffraction peaks
at , . ,
for anatase . Doping with the fifth group elements by the
stated above method brought some major differences into peaks positions characteristic of bare
. In the two small peaks at and appear on the shoulders of
the strong peak at of bare are being not clear indicating some structural changes.
Showed a rather different peak position at indicating
rutile phase even at early stages of calcinations which was evident at the higher calcinations temperatures. Anew
peak positions were noticed for s at , and
for . Neither nor showed rutile phase. The
ambiguity regarding the effects of the fifth group dopants on the transformation from anatase to rutile may stem
from increased density of anion vacancies as in and dopants as a result from substitution of in anatase
lattice (16)
. Nitrogen as many researchers have agreed might replace oxygen in the anatase lattice efficiently
while phosphorus behaved differently. Figures2and 3 showed the effect of calcinations from for
and doped . For (Fig 2) heating up to will bring about a new weak peak at
referring to emergence of rutile phase. Heating up to 800 will turn the powder totally to a

Chemical and Process Engineering Research www.iiste.org
ISSN 2224-7467 (Paper) ISSN 2225-0913 (Online)
Vol.25, 2014
69
rutile phase which also accompanied by other characteristic rutile peaks at
. The diffraction pattern of (Fig 3) is rather different, at low
calcinations temperatures up to 500 the powder is irregular polycrystalline amorphous with low intensity,
however the prevailing phase was rutile and it's more pronounced above probably due the formation of
well defined crystal dimensions suitable for XRD measurements.
Figure 1: XRD pattern of bare and doped
Figure 2: XRD patterns of calcined at different temperatures
Figure 3: XRD patterns of calcined at different temperatures
Particle size distribution and AFM images Figures (4, 5, 6, 7, 8 and 9) indicate the nano dimensions of the
studied powders. Several measurements have been performed to assure the data. The AFM images showed
distinguished regular, smooth and generally round shapes of particles; however particle size distribution varied
appreciably in comparison with the crystal size (L) measured by Sherar formula(Monshi etal 2002 , Ahmed etal
2014) from XRD diffraction patterns namely for :

Chemical and Process Engineering Research www.iiste.org
ISSN 2224-7467 (Paper) ISSN 2225-0913 (Online)
Vol.25, 2014
70
Where is the Sherar's constant, in the present calculation a value of were adopted. Is the wavelength of
X-ray source ( ), while is the width of half maximum intensity corresponding to Bragg's angle
. Results of average particle size (nm) and the average diameters (nm) from AFM measurements as
well as the crystallite size L (nm) were listed in table 1.
Table 1: Measured average particle size, their size distribution by AFM and calculated crystallite size L,
band gap energies
Band gap (eV)
L(nm) Davg(nm) Particle Size range(nm)
Code
3.2 26.26 84.19 60-135 2.81 26.03 95.68 50-150
2.83 59.64 130.75 80-180
2.85 59.62 90.98 30-135
2.84 49.17 91.24 70-140
2.95 59.62 78.69 55-120
Figure 4: Two and three dimensional AFM images and particle distribution of anatase
Figure 5: Two and three dimensional AFM images and particle distribution of

Chemical and Process Engineering Research www.iiste.org
ISSN 2224-7467 (Paper) ISSN 2225-0913 (Online)
Vol.25, 2014
71
Figure 6: Two and three dimensional AFM images and particle distribution of
Figure 7: Two and three dimensional AFM images and particle distribution of
Figure 8: Two and three dimensional AFM images and particle distribution of

Chemical and Process Engineering Research www.iiste.org
ISSN 2224-7467 (Paper) ISSN 2225-0913 (Online)
Vol.25, 2014
72
Figure 9: Two and three dimensional AFM images and particle distribution of
Figure 11 shows the absorbance spectra of thin films (the curves donated f, g are excluded and they don’t
belong to the fifth group elements). All of the films were considered transparent above about 460 nm although
insignificant absorption tails are still present which probably due to scattered Uv light caused by the thin films
them self’s( Salah 2013) .From figure 11 the extracted absorbance data were plotted as vs. photon
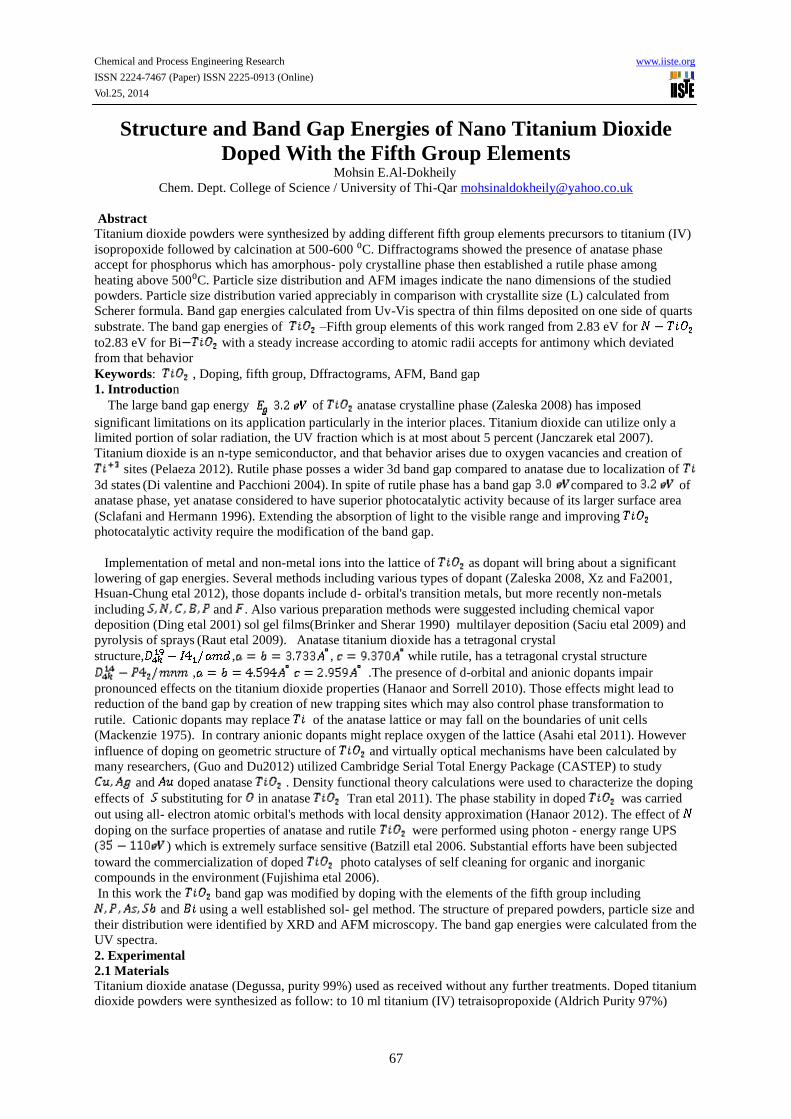
energy (eV) and presented in figures 12,13,14 and 15. Band gap energies of –Fifth group elements of
this work ranged from 2.83 eV for to2.95 eV for Bi with a steady increase according to atomic
radii accepts for antimony which deviated from that trend. Although many researchers reported rather lower
values for and powders which may attributed to the measurements of powder instead of
films and also to the different experimental conditions such as type of precursors, method of annealing and
measurement technique. However doping with the fifth group elements brought about a noticeable correlated
narrowing of the band gap energies compared with that of bare . Janezarek etal 2007 suggested a control
on the band gap energy by varying nitrogen contents through the control of calcination temperatures rather than
varying the nitrogen precursor. Recent study (Hreniak etal 2014) found similar trend for the influence of silver
on optical properties of powder .
Figure 10: Uv-Vis spectra of doped films with the fifth group elements a) b)
c) d) e)

Chemical and Process Engineering Research www.iiste.org
ISSN 2224-7467 (Paper) ISSN 2225-0913 (Online)
Vol.25, 2014
73
Figure 11: as a function of hν for the Film
Figure 12: as a function of hν for the P Film
Figure 13: as a function of hν for the As Film
Figure 14: as a function of hν for the Film
Chemical and Process Engineering Research www.iiste.org
ISSN 2224-7467 (Paper) ISSN 2225-0913 (Online)
Vol.25, 2014
74
Figure 15 as a function of hν for the Film
4. Conclusions
Doping of with the fifth group elements brought a noticeable correlated decrease in the band gap from 3.2
eV for bare anatase phase to about 2.85 eV. Synthesized powders have a nano dimensions and almost anatase
phase except for phosphorus which has amorphous – mixed phase turned to be rutile above 500 ⁰C. The method
of calculating band gap energies gave sharp and easily distinguishable values.
Acknowledgment
This work was supported by the University of Thi-Qar as a part of research and higher studies projects.
References
Ahmed L.M.; Ivanova I.; Hussein F.H.; and Bahnemann D.W.;2014; Role of Platinum on in Photocatalytic
Methanal Oxidation and Dehydrogenation Reactions; Int. J. Photo energy; Article ID 503516
Asahi R.; Morika W.A.; Hawaki K.; Aoki Y.;2011; Visible –Light Photo catalysis in doped Titanium Dioxide
Oxidation ; Science 293,296-271
Batzill M.; Marels E.; and Dieheld U.; 2006; Influence of Nitrogen Doping on Defect Formation and Surface
Properties of Rutile and Anatase; Phy. Review Lett. 96, 026103,
Brinker C.F; and Sherar G.W; 1990; The Physics and Chemistry of Sol Gel Processing, Academic press, London
Di Valentine C; Pacchioni G.;2004; Origin of the Different Photo activity of N-Doped anatase and Rutile ;
Physical Review B, 70(8) 085116
Ding Z.; Hu X, L. Yue PL.; Lu C.Q.; and Greenfield P.F.; 2001; Synthesis of Anatase Supported on Porous
Solids by Chemical Vapor Deposition; Catalyst Today, 681.173-182
Fujishima A.; Zhang X.; and Tryk A.D.; 2004; Heterogeneous Photo catalysis: From Water Photolysis to
Application in Environmental Cleanup; Int. J. Hyd. Energy, 32(14), 2664-2672,
Guo M.; and Du j.;2012; First Principle Study of Electronic Structure and Optical Properties of Cu, Ag and Cu –
Doped Anatase ; arXiv 1203.0701 Chinese National Natural Science Foundation Grant No. 11175128.
Hanaor D. A.H.; Assad M.H.N.; Yu S.A.; and Sorrel C.; 2012; AB Initio Study of Phase Stability in Doped
; Com. Mechanics, 50(2), 185-184
Hanaor D.A.H.; and Sorrell C.C.; 2010; Review of the anatase to rutile phase transformation; J. Mater. Sci.
46:855–874
Hreniak A.; Sikora A.; and Iwan A.; 2014; Influence of Amount of Silver on Structural and Optical Properties of
Powder Obtained by Sol- Gel Method; Int. J. of Mater. Chem, 4(2), 15-2
Hsuan-Chung Wu; Sheng-Hong Li: Syuan-Wei Lin;2012; Effect of Fe Concentration on Fe – Doped From
GGA + U Calculations ; Int. J. Photo energy; Article ID frame, 823498, 6 pages
Janczarek M.; Kisch H.; Hupka J.;2007;Photoelectrochemical Characterization of Nitrogen modified
;Photochemical Problems of Mineral Processing; 41,159-166
Mackenzie KJD; 1975; Calcination of Titania v. Kinetics and Mechanism of the Anatase – Rutile
Transformation in the Presence of Additives; Transactions and Journal of The British Academic Society 74, 77-
84
Mohd A.K.; Rosli Y.; and Min H.; 2011; Uv-Visible Studies of Chemical Bath Deposited NiSe Thin Films; Int.
J. Chem. Res., 3(1), 21-26
Monshi A.; Foroughi M.; and Monshi M.; 2002; Modified Scherer Equation to Estimate More Accurately Nano-
Crystallite Size Using XRD; World J. Nano Sci. Eng., 2,154-160
. Pelaeza M.; NolanbN.T.; Pillaib S.C.; Seeryc M.K.; Falarasd P.; Kontosd A.G.; Dunlope P.S.M.; Hamiltone
J.W; Byrnee A. J., O'Sheaf K.; H. Entezarig M.H.; Dionysioua,D.D. ;2012; A review on the visible light active
titanium dioxide photocatalysts for environmental applications; Appl. Catalysis B: Environ. 125, (21), 331–349

Chemical and Process Engineering Research www.iiste.org
ISSN 2224-7467 (Paper) ISSN 2225-0913 (Online)
Vol.25, 2014
75
Raut N.C; Mathews T.; Sunder S.F ; Sairam T.N; Dash S; Tayqi A.K;2009; Structural and Morphological
Characterization of Thin Films Synthesized by Spray Pyrolysis Technique; J. Nano Science Technol,9(4)
,5298-302
Saciu R.C.; Inderea E. ;2009; Silipas T.D.; Dreve S.I. Rosa M.C.; Popescu V.; Popescu G.; and Nascu H.I.;
Thin Films Prepared by Sol- Gel Method; J.Phy. Conference Series 182, 012080
Salah A. F.; 2013; Structural and Morphological Studies of NiO Thin Films Prepared by Rapid Thermal
Oxidation Method; Int.J. Appl. Annov.Eng&mang, 2(1), 16-21
Sclafani A.; and Herrmann J.M.; 1996; Comparison of Photo electronic and Photocatalytic Activities of Various
Anatase and Rutile Forms of Titania; J.Phy.Chem.'100.13655-13661,
Tran F.; Liu C.; Zhao W. ; Wang X.; Wang Z.; and Yuc J.;2011; Cationic S- Doped Anatase a DFT Study ;
J. Com. Sci. Eng. 1,33-41
XZ L.;FA L.;2001; Study of - Photo catalysis Towards Visible Photoxidation for Water and
Waste Water Treatment; Environ .Sci. Technol. 35,2281- 2387
Zaleska A.; 2008; Doped : A Review; Recent Patents of Engineering: 2,157,157-164

The IISTE is a pioneer in the Open-Access hosting service and academic event
management. The aim of the firm is Accelerating Global Knowledge Sharing.
More information about the firm can be found on the homepage:
http://www.iiste.org
CALL FOR JOURNAL PAPERS
There are more than 30 peer-reviewed academic journals hosted under the hosting
platform.
Prospective authors of journals can find the submission instruction on the
following page: http://www.iiste.org/journals/ All the journals articles are available
online to the readers all over the world without financial, legal, or technical barriers
other than those inseparable from gaining access to the internet itself. Paper version
of the journals is also available upon request of readers and authors.
MORE RESOURCES
Book publication information: http://www.iiste.org/book/
IISTE Knowledge Sharing Partners
EBSCO, Index Copernicus, Ulrich's Periodicals Directory, JournalTOCS, PKP Open
Archives Harvester, Bielefeld Academic Search Engine, Elektronische
Zeitschriftenbibliothek EZB, Open J-Gate, OCLC WorldCat, Universe Digtial
Library , NewJour, Google Scholar