structure based flood control level of service for … based flood control level of service for...

1
S O U T H F L O R I D A W A T E R M A N A G E M E N T D I S T R I C T South Florida Water Management District (SFWMD) Canals in the SFWMD system are operated to accomplish flood control, water supply, water quality and ecosystem restoration objectives. Coastal canals discharge directly to tide through gated spillways, designed by the US Army Corps of Engineers (USACE) using traditional static conditions back in 1950’s and 1960’s. Coastal Spillways are operated to provide drainage, maintaining stages within pre-determined water surface elevations, while at the same time preventing salt water intrusion. The primary SFWMD canals receive drainage from secondary canals (drainage districts and municipalities), which collect from tertiary canals (HOAs/Private Interests). Structure Based Flood Control Level of Service for Coastal Water Control Structures Luis Cadavid Ph.D., PE ([email protected]) , Chen Qi PE, Mark Wilsnack PE and Ken Konyha, Ph.D. PM3 Results PM4 First LOS Pilot Project C-4 Watershed Level of Service (LOS) Methods and Materials Metrics 1 to 5 apply to the primary water management system and measure the amount of flow released from the structures under design conditions, the peak flow capacity of the structure, and water levels upstream of the control structure. Metric 6 measures the ability of secondary and tertiary water management facilities to maintain pre-established water levels that are needed to protect features within the subwatersheds. Hydrologic Engineering Center, 2010a. HEC-RAS River Analysis System v4.1 User Manual (Version 4.1, CPD-68 ed). USACE-HEC, 609 Second St., Davis CA 95616-4687: Hydrologic Engineering Center. Hydrologic Engineering Center, 2010b. HEC-RAS River Analysis System v4.1 Hydraulic Reference Manual (Version 4.1, CPD-69 ed). United States Army Corps of Engineers -HEC, 609 Second St., Davis CA 95616-4687: Hydrologic Engineering Center. South Florida Water Management District (2015, October). Atlas of Flow computations at Hydraulic Structures in the South Florida Water Management District. Technical Publication HHB Report #2015-001. Hydrology and Hydraulics Bureau, South Florida Water Management District, West Palm Beach, FL. October 16, 2015. South Florida Water Management District (2011a, June). Phase I Report - Assessment of Interim Operating Rules for the C-4 Watershed using Uncoupled Groundwater/Hydraulic Models Hydrologic and Environmental Systems Modeling Department, South Florida Water Management District, West Palm Beach, FL. June 7, 2011. South Florida Water Management District (2011b, Aug). Miami Dade County Flood Mitigation program – C-4 Basin. C-4 Basin Operating Plan. South Florida Water Management District, West Palm Beach, FL. August 5, 2011. South Florida Water Management District (2015, December). Flood Protection Level of Service (LOS) Analysis for the C-4 Watershed. Draft Final Hydrology and Hydraulics Bureau, South Florida Water Management District, West Palm Beach, FL. Dec. 29, 2015 158 pp. References The purpose of Flood Protection LOS program is to identify and prioritize long-term SFWMD infrastructure needs. Level of Service projects provide a process to establish flood protection thresholds for each basin. These thresholds will help initiate retrofits and other adaptation efforts. More specifically, LOS describes the amount of flood control protection provided by water management facilities within a watershed. Flood control LOS for needs to be evaluated under highly dynamic (transient) conditions: Rainfall-runoff (different frequencies) Storm surge (different frequencies) Sea level rise (SLR) (different scenarios/projections) LOS determination requires the use transient hydrologic and hydraulic simulation models. Applied to the C-4 Watershed in Miami- Dade County Determine the existing Flood Protection Level of Service for C4 basin Determine the future Flood Protection Level of Service for three sea level rise scenarios Prioritize Flood Protection Issues and initiate basin-specific solutions Includes the C-4, C-2 and C-3 canals Canals discharge to tide through coastal structures: S25B C-4 Spillway and Pumps S22 C-2 Spillway G93 C-3 Spillway These structures were given special attention in the LOS project by examining their behavior through PM3 and PM4 For PM3, the “Effects of sea level rise only” zone (12-hr MA flow prior to the storm surge) characterizes the suppression of flows caused by increases in SLR. Flow capacities in the “Effects of Storm Surge” region are further decreased by the intensity of the storm surge. For PM3, the highlighted value in the 1963 Sea Level curve is the equivalent to USACE design. According to PM3, the S22 structure is the most strongly impacted by sea level rise. For mid SLR sea levels, the capacity of the S25B structure drops to the 600 cfs forward pump capacity for any storm surge with a return period equal to or greater than 5 years. In very few cases the structures have some capacity to deal with 100- yr events. For PM4, maximum structure flow increases with design storm because both runoff and storm surge increase with the design storm. S25B exhibits the larger drop in capacity from the existing conditions to the Low and Mid SLR scenarios. Due to different flow equations being used for PM3 and PM4, cross comparison of results is not possible. For the PM3 analysis, five sea-level scenarios were modeled: 1963 (USACE Design), Current (2015), and Future (2065 Low, Mid, High). For each scenario, a range of six design storm surges were examined (2, 5, 10, 25, 50 and 100-yr). Results of each simulation are further analyzed to determine the minimum 12-hour moving average flow through the structure. The minimum flow values from these 30 model runs were then compared on a single graph. The PM3 analysis process is shown in the frame below. Set of Performance Measures to Evaluate LOS S25B Spillway S-26 S25B Forward Pumps Geometry and operational parameters for water control structures associated with the C-4 Watershed Pictures below depict some examples of the coastal gated spillways in coastal canals in Miami-Dade County Note: S-26 on the C-6 Canal is a sister station to S25B about 1 mi apart HEC-RAS (USACE-HEC) was the transient hydraulics model selected to evaluate LOS in the C-4 basin. Among others, HEC-RAS is capable of collecting and routing runoff through canals and simulating interaction of coastal gated spillways with tidal conditions. Current approved operational protocols for the structures were coded in the HEC-RAS simulations. Also, discharge through structures was computed using both the SFWMD customized equations and intrinsic HEC-RAS equations for spillways. The HEC- RAS simulations output high resolution stage and flow hydrographs throughout the modeling domain, including all water control structures. Coastal spillways are operated by maintaining stages within predetermined ranges. Gates open when headwater (HW) stage is above the Open_HW_Stage and gates close when HW falls below the Close_HW_Stage. (Open_HW_Stage > Close_HW_Stage) When tides are rising, the tailwater (TW) stage is increasing there is a risk of saline water intruding the canal upstream. To prevent this from happening, when the head differential Delta (Delta = HW – TW) is within a given threshold (+0.1 ft) the gates are closed regardless of the upstream water level. Gates will not be allowed to open again until the Delta exceeds a second threshold (+0.3 ft). Pump stations are operated in a similar fashion. Pumps are turned on when the HW stage is higher than the On_HW_Stage. Pumps are secured once HW goes below Off_HW_Stage. (On_HW_Stage > Off_HW_Stage) Method HW Boundary Condition Tw Boundary Condition Hydraulic Tool Result USACE Original Design Single Design HW Stage Value Single Design TW Stage Value Discharge Equation Single Discharge Value PM3 Stage Hydrograph with constant stage approximately at the design value Stage Hydrograph with combined tidal and wind surge effects Simple HEC-RAS model for the structure with short length of canals upstream and downstream with SFWMD flow equations Discharge Hydrograph. Requires further post processing PM4 Stage hydrograph produced by rain storm in the entire basin Stage Hydrograph with combined tidal and wind surge effects Complete HEC- RAS model for the entire basin with HEC-RAS internal flow equations Discharge Hydrograph. Requires further post processing Example of tidal stage hydrographs boundary conditions PM3 Post processing and interpretation The shape of the discharge hydrograph at the structure generated by PM4 simulations will depend on the arrival time of the storm runoff and the arrival of the storm surge at the structure. If the storm surge arrives earlier or later than the storm event the shape of the hydrograph will be dominated mainly by runoff. A sensitivity analysis was performed in which the TW boundary condition was shifted to arrive after the peak of the runoff event. Offsets from 0 to 18 hours were investigated. As shown by the figure on the right, bimodal 12-hour MA flow hydrographs are produced. The selected offset is one that tends to produce similar bimodal peak values. An offset of 13 hours was selected as the best compromise for all the simulations required for PM4. For the PM4 analysis four sea-level scenarios were modeled: Current (2015), and Future (2065 Low, Mid, High). For each scenario, a range of four design storm surges were examined (5, 10, 25, and 100-yr). Results of each simulation are further analyzed to determine the maximum 12-hour MA flow through the structure. The 12-hour moving average (12-hr MA) is used to filter the effect of regular tidal cycles on results. No surge. Capacity to pass flow up to almost high SLR point No surge. Capacity to pass flow up to slightly above the mid SLR point No surge. Capacity to pass flow up to slightly above the mid SLR point Due to canal capacity limitations G93 flows never exceed ~ 400 cfs Effect of sea level rise only flow No surge. Capacity to pass flow up to slightly above the mid SLR point Storm surge quickly decreases flow capacity Little flow capacity for low SLR and small surge This analysis indicated that the offset between the peak rainfall and peak storm surge at the costal structure is an important parameter to consider during design, maybe as important as selecting the magnitude of the rainfall or the peak tidal surge stage.

Upload: vunhan

Post on 27-May-2018

222 views

Category:

Documents


0 download

TRANSCRIPT

S O U T H F L O R I D A W A T E R M A N A G E M E N T D I S T R I C T

South Florida Water Management District (SFWMD)

Canals in the SFWMD system are operated to accomplishflood control, water supply, water quality and ecosystemrestoration objectives. Coastal canals discharge directlyto tide through gated spillways, designed by the US ArmyCorps of Engineers (USACE) using traditional staticconditions back in 1950’s and 1960’s. Coastal Spillwaysare operated to provide drainage, maintaining stageswithin pre-determined water surface elevations, while atthe same time preventing salt water intrusion. Theprimary SFWMD canals receive drainage from secondarycanals (drainage districts and municipalities), whichcollect from tertiary canals (HOAs/Private Interests).

Structure Based Flood Control Level of Service for Coastal Water Control StructuresLuis Cadavid Ph.D., PE ([email protected]) , Chen Qi PE, Mark Wilsnack PE and Ken Konyha, Ph.D.
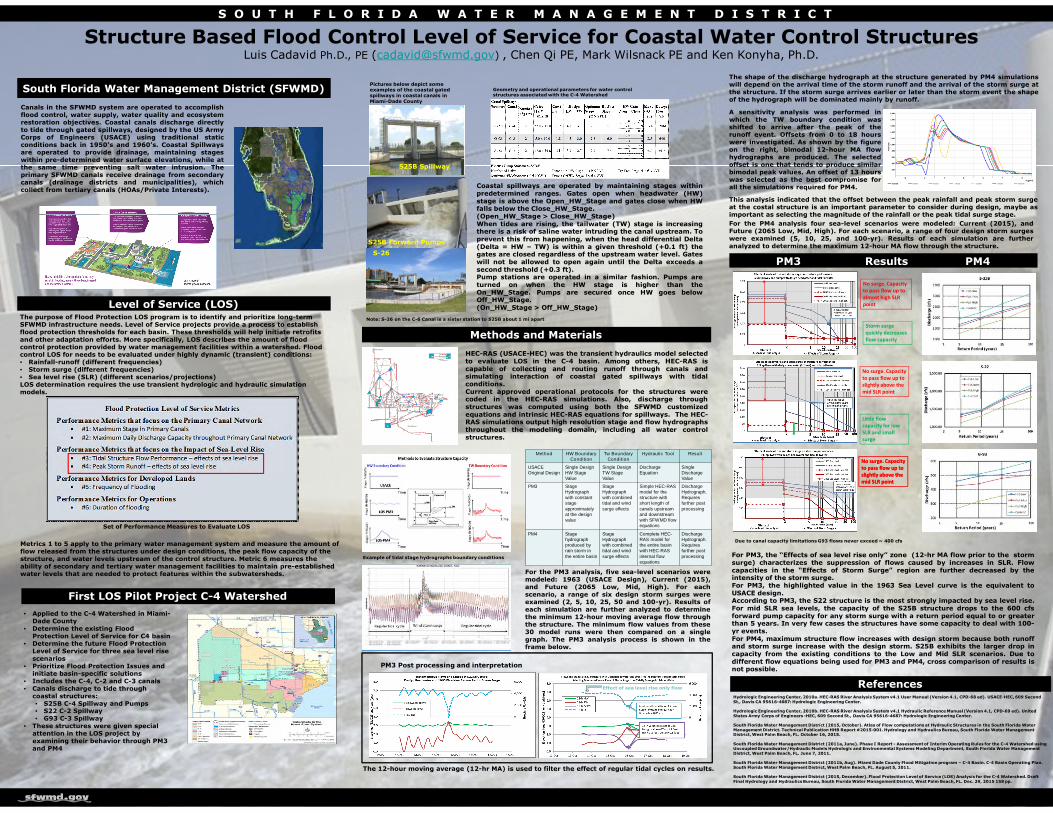
PM3 Results PM4

First LOS Pilot Project C-4 Watershed

Level of Service (LOS)

Methods and Materials

Metrics 1 to 5 apply to the primary water management system and measure the amount of flow released from the structures under design conditions, the peak flow capacity of the structure, and water levels upstream of the control structure. Metric 6 measures the ability of secondary and tertiary water management facilities to maintain pre-established water levels that are needed to protect features within the subwatersheds.

Hydrologic Engineering Center, 2010a. HEC-RAS River Analysis System v4.1 User Manual (Version 4.1, CPD-68 ed). USACE-HEC, 609 Second St., Davis CA 95616-4687: Hydrologic Engineering Center.

Hydrologic Engineering Center, 2010b. HEC-RAS River Analysis System v4.1 Hydraulic Reference Manual (Version 4.1, CPD-69 ed). United States Army Corps of Engineers -HEC, 609 Second St., Davis CA 95616-4687: Hydrologic Engineering Center.

South Florida Water Management District (2015, October). Atlas of Flow computations at Hydraulic Structures in the South Florida Water Management District. Technical Publication HHB Report #2015-001. Hydrology and Hydraulics Bureau, South Florida Water ManagementDistrict, West Palm Beach, FL. October 16, 2015.

South Florida Water Management District (2011a, June). Phase I Report - Assessment of Interim Operating Rules for the C-4 Watershed using Uncoupled Groundwater/Hydraulic Models Hydrologic and Environmental Systems Modeling Department, South Florida Water Management District, West Palm Beach, FL. June 7, 2011.

South Florida Water Management District (2011b, Aug). Miami Dade County Flood Mitigation program – C-4 Basin. C-4 Basin Operating Plan. South Florida Water Management District, West Palm Beach, FL. August 5, 2011.

South Florida Water Management District (2015, December). Flood Protection Level of Service (LOS) Analysis for the C-4 Watershed. Draft Final Hydrology and Hydraulics Bureau, South Florida Water Management District, West Palm Beach, FL. Dec. 29, 2015 158 pp.

References

The purpose of Flood Protection LOS program is to identify and prioritize long-term SFWMD infrastructure needs. Level of Service projects provide a process to establish flood protection thresholds for each basin. These thresholds will help initiate retrofits and other adaptation efforts. More specifically, LOS describes the amount of flood control protection provided by water management facilities within a watershed. Flood control LOS for needs to be evaluated under highly dynamic (transient) conditions:• Rainfall-runoff (different frequencies)• Storm surge (different frequencies)• Sea level rise (SLR) (different scenarios/projections)LOS determination requires the use transient hydrologic and hydraulic simulation models.

• Applied to the C-4 Watershed in Miami-Dade County

• Determine the existing Flood Protection Level of Service for C4 basin

• Determine the future Flood Protection Level of Service for three sea level rise scenarios

• Prioritize Flood Protection Issues and initiate basin-specific solutions

• Includes the C-4, C-2 and C-3 canals• Canals discharge to tide through

coastal structures:• S25B C-4 Spillway and Pumps• S22 C-2 Spillway• G93 C-3 Spillway

• These structures were given special attention in the LOS project by examining their behavior through PM3 and PM4

For PM3, the “Effects of sea level rise only” zone (12-hr MA flow prior to the stormsurge) characterizes the suppression of flows caused by increases in SLR. Flowcapacities in the “Effects of Storm Surge” region are further decreased by theintensity of the storm surge.For PM3, the highlighted value in the 1963 Sea Level curve is the equivalent toUSACE design.According to PM3, the S22 structure is the most strongly impacted by sea level rise.For mid SLR sea levels, the capacity of the S25B structure drops to the 600 cfsforward pump capacity for any storm surge with a return period equal to or greaterthan 5 years. In very few cases the structures have some capacity to deal with 100-yr events.For PM4, maximum structure flow increases with design storm because both runoffand storm surge increase with the design storm. S25B exhibits the larger drop incapacity from the existing conditions to the Low and Mid SLR scenarios. Due todifferent flow equations being used for PM3 and PM4, cross comparison of results isnot possible.

For the PM3 analysis, five sea-level scenarios weremodeled: 1963 (USACE Design), Current (2015),and Future (2065 Low, Mid, High). For eachscenario, a range of six design storm surges wereexamined (2, 5, 10, 25, 50 and 100-yr). Results ofeach simulation are further analyzed to determinethe minimum 12-hour moving average flow throughthe structure. The minimum flow values from these30 model runs were then compared on a singlegraph. The PM3 analysis process is shown in theframe below.

Set of Performance Measures to Evaluate LOS

S25B Spillway

S-26

S25B Forward Pumps

Geometry and operational parameters for water control structures associated with the C-4 Watershed

Pictures below depict some examples of the coastal gated spillways in coastal canals in Miami-Dade County

Note: S-26 on the C-6 Canal is a sister station to S25B about 1 mi apart

HEC-RAS (USACE-HEC) was the transient hydraulics model selectedto evaluate LOS in the C-4 basin. Among others, HEC-RAS iscapable of collecting and routing runoff through canals andsimulating interaction of coastal gated spillways with tidalconditions.Current approved operational protocols for the structures werecoded in the HEC-RAS simulations. Also, discharge throughstructures was computed using both the SFWMD customizedequations and intrinsic HEC-RAS equations for spillways. The HEC-RAS simulations output high resolution stage and flow hydrographsthroughout the modeling domain, including all water controlstructures.

Coastal spillways are operated by maintaining stages withinpredetermined ranges. Gates open when headwater (HW)stage is above the Open_HW_Stage and gates close when HWfalls below the Close_HW_Stage.(Open_HW_Stage > Close_HW_Stage)When tides are rising, the tailwater (TW) stage is increasingthere is a risk of saline water intruding the canal upstream. Toprevent this from happening, when the head differential Delta(Delta = HW – TW) is within a given threshold (+0.1 ft) thegates are closed regardless of the upstream water level. Gateswill not be allowed to open again until the Delta exceeds asecond threshold (+0.3 ft).Pump stations are operated in a similar fashion. Pumps areturned on when the HW stage is higher than theOn_HW_Stage. Pumps are secured once HW goes belowOff_HW_Stage.(On_HW_Stage > Off_HW_Stage)

Method HW Boundary Condition

Tw Boundary Condition

Hydraulic Tool Result

USACE Original Design

Single DesignHW Stage Value

Single DesignTW Stage Value

Discharge Equation

Single Discharge Value

PM3 StageHydrograph with constant stage approximately at the design value

StageHydrograph with combined tidal and wind surge effects

Simple HEC-RAS model for the structure with short length of canals upstream and downstream with SFWMD flow equations

Discharge Hydrograph. Requires further post processing

PM4 Stagehydrograph produced by rain storm in the entire basin

StageHydrograph with combined tidal and wind surge effects

Complete HEC-RAS model for the entire basin with HEC-RAS internal flow equations

Discharge Hydrograph. Requires further post processingExample of tidal stage hydrographs boundary conditions

PM3 Post processing and interpretation

The shape of the discharge hydrograph at the structure generated by PM4 simulationswill depend on the arrival time of the storm runoff and the arrival of the storm surge atthe structure. If the storm surge arrives earlier or later than the storm event the shapeof the hydrograph will be dominated mainly by runoff.

A sensitivity analysis was performed inwhich the TW boundary condition wasshifted to arrive after the peak of therunoff event. Offsets from 0 to 18 hourswere investigated. As shown by the figureon the right, bimodal 12-hour MA flowhydrographs are produced. The selectedoffset is one that tends to produce similarbimodal peak values. An offset of 13 hourswas selected as the best compromise forall the simulations required for PM4.

For the PM4 analysis four sea-level scenarios were modeled: Current (2015), andFuture (2065 Low, Mid, High). For each scenario, a range of four design storm surgeswere examined (5, 10, 25, and 100-yr). Results of each simulation are furtheranalyzed to determine the maximum 12-hour MA flow through the structure.

The 12-hour moving average (12-hr MA) is used to filter the effect of regular tidal cycles on results.

No surge. Capacity to pass flow up to almost high SLR point

No surge. Capacity to pass flow up to slightly above the mid SLR point

No surge. Capacity to pass flow up to slightly above the mid SLR point

Due to canal capacity limitations G93 flows never exceed ~ 400 cfs

Effect of sea level rise only flow

No surge. Capacity to pass flow up to slightly above the mid SLR point

Storm surge quickly decreases flow capacity

Little flow capacity for low SLR and small surge

This analysis indicated that the offset between the peak rainfall and peak storm surgeat the costal structure is an important parameter to consider during design, maybe asimportant as selecting the magnitude of the rainfall or the peak tidal surge stage.