structure determination from powder diffraction data commission
TRANSCRIPT

IN THIS ISSUE
Structure Determination from Powder Diffraction Data(Bill David, Editor)
CPD chairman’s message, Paolo Scardi 2
Editor’s message, Bill David 2
CPD projects: 3Quantitative Phase Analysis RR, Ian MadsenSize-Strain RR, Davor Balzar
WWW sites related to Powder Diffraction 3
IUCr Commission on Powder Diffraction 4
Structure determination from powder diffraction data
Revisiting the 1998 SDPD Round Robin 7A Le Bail and L M D Cranswick
A 117-atom structure from powder diffraction data 9L B McCusker, Ch Baerlocher and T Wessels
Drug polymorphism and powder diffraction 12P Sieger, R Dinnebier, K Shankland and W I F David
Malaria, synchrotron radiation and Monte Carlo 14P W Stephens, S Pagola, D S Bohle and A D Kosar
A case of mistaken identity: metastable Me2SBr2 16A N Fitch, G B M Vaughan and A J Mora
Combined Rietveld and stereochemical- restraintrefinement with high resolution powder diffractionoffers a new approach for obtaining protein-drugstructures 17R B Von Dreele
On the reliablility of Rwp in structure prediction 19L Smrcok and M Durík
Ab-initio structure determination of oligopeptidesfrom powder diffraction data 20K D M Harris, R L Johnston, E Tedesco and G W Turner
Correlating crystal structure with the physicalproperties of pharmaceutical compounds 22N Shankland, W I F David, K Shankland, A Kennedy, CS Frampton and A Florence
EXPO: New developments 23A Altomare, C Giacovazzo, A G G Moliterni and R Rizzi
News from ICDD and IXAS 26
Computer Corner, L M D Cranswick 28
What’s On 35
Companies 36
How to receive the CPD Newsletter 36
Calls for contributions to CPD newsletter 26 36
COMMISSION ON POWDER DIFFRACTION
INTERNATIONAL UNION OF CRYSTALLOGRAPHYhttp://www.iucr.org/iucr-top/comm/cpd/
NEWSLETTER No. 25, July 2001http://www.iucr.org/iucr-top/comm/cpd/Newsletters/ .
ISSN 1591-9552

CPD Chairman’s Message
The CPD Newsletter is a very popular publication – more than 2000 people have now asked to receive a copy. This hasmotivated us to make a number of improvements. As from the present issue, the CPD newsletter will be registered as anofficial publication with an ISSN number (1591-9552). One of the reasons for this is to facilitate reference to articles and newsreported by the newsletter and to provide a permanent forum for powder diffractionists, where new ideas and findings can bereported and disseminated to a large audience of more than 2000 recipients around the world. Following the same principle, theNewsletter is also available on the web pages of the CPD (http://www.iucr.org/iucr-top/comm/cpd/Newsletters/) from whererecent issues can be downloaded. We intend to make available all the Newsletters since the first issue of 1989 and haverecently started a new project that should lead to the publication of a CD-ROM with the entire collection in a few months.
A recent achievement, which is also one of the themes of the present Newsletter, is the publication of the paper resulting fromthe CPD Round Robin on the Quantitative Phase Analysis (QPA), carried out by Ian Madsen and colleagues. We thank Ian andhis colleagues for all the effort that they put into organising the Round Robin and for producing an excellent summary article.We would also like to thank the IUCr Editorial Office for giving us permission to include the reprint from the Journal ofApplied Crystallography (JAC) as an annex to the present issue. Copies of the article can also be freely downloaded from theJAC web site and will also be made available through the CPD web site.
The recently concluded congress on Accuracy in Powder Diffraction III (APD3, Gaithersburg, MD, USA, 22-25.4.2001) wasthe main event of the season in the field of powder diffraction. The conference provided a comprehensive review of the mostrelevant and recent results in a dense and well-conducted programme. We can expect that APD3 proceedings, to be publishedin the next months, will provide a useful reference to the current status of powder diffraction worldwide in the same way thatthe previous two conferences charted the state-of-the art ten and twenty years ago.
Forthcoming dates for your diaries in powder diffraction this year include the annual Denver conference (August 2001) andthe third Size-Strain conference in Trento (December 2001). Important events next year include EPDIC 8 (Spring 2002) inSweden and the IUCr World Congress (now moved from Israel to Geneva, August 2002) where eight microsymposia will bededicated to powder diffraction and related topics.
Structure solution and refinement are two central themes of powder diffraction. These are the main topics of the present(structure solution) and next (structure refinement) issues (No.26). The next issue will be edited by Robert Dinnebier andshould be printed just before Christmas. Contributions on the subject of structure refinement should be sent to Robert. Newsconcerning powder diffraction, new software and information and reports on schools, workshops and conferences will beappreciated.
Paolo Scardi
From the Editor of Newsletter 25
This newsletter focuses on structure determination from powder diffraction data. Most of us are familiar with the morecommon process of structure refinement by the Rietveld method. Structure refinement, which requires an approximatestructural model, has been phenomenally successful in areas as diverse as high temperature superconductivity, zeolitechemistry, fullerenes and mineralogy. Structure determination is a rather more complicated process than structure refinement,because initially we have no idea where the atoms are in the crystal structure. However, this emerging field has developedrapidly over the recent years and a diverse set of crystallographic tools have been developed to enable us to solve structures ab-initio from powder diffraction data alone.
As with all emerging fields, structure determination from powder diffraction data is not without its controversial aspects. Thefirst article in this newsletter considers the situation in 1998 when novel global optimisation strategies were still viewed withscepticism by some and structure determination from powder data was far from routine for the majority. The challengedescribed in this article (which was to solve two crystal structures directly from supplied diffraction data alone) was risen to byfew and met by even fewer; there was a resounding silence from the majority of the powder diffraction community. However,things have moved on some way since then. Global optimisation has proven to be competitive with direct methods and theincreasing availability of software for structure solution means that many more people can now participate in successfulstructure determinations from both laboratory X-ray, synchrotron X-ray and neutron data. Whilst not yet routine in the senseof single crystal determinations, the application of structure determination from powder diffraction methods can be routine inmany circumstances. We are now in the fortunate position where modern SDPD methods can be applied to substantial andsignificant problems, some excellent examples of which are described in this newsletter.
It is reassuring for us to see that it is not simply increased computing power that has underpinned recent successes, thoughthere is no doubt that it has catalysed many developments, especially in the area of global optimisation. Rather, algorithmicdevelopments, experimental ingenuity, chemical intuition and a refusal to accept that certain things are "just not done usingpowder diffraction" have all had a role to play. The articles in this newsletter serve to illustrate these points and give someidea of the breadth of the field. I hope that you will enjoy reading them as much as I have enjoyed pulling them together.
Bill David
2

CPD projects
QUANTITATIVE PHASE ANALYSIS ROUND ROBIN
The International Union of Crystallography (IUCr) Commission on Powder Diffraction (CPD) has sponsored a Round Robinon the determination of quantitative phase abundance from diffraction data. Specifically, the aims of the Round Robin were(i) to document the methods and strategies commonly employed in quantitative phase analysis (QPA), especially those
involving powder diffraction,(ii) to assess levels of accuracy, precision and lower limits of detection,(iii) to identify specific problem areas and develop practical solutions,(iv) to formulate recommended procedures for QPAusing diffraction data,(v) to create a standard set of samples for future reference.
Some of the analytical issues which have been addressed include (a) the type of analysis (integrated intensities or full-profile,Rietveld or full-profile, database of observed patterns) and (b) the type of instrument used, including geometry and radiation(X-ray, neutron or synchrotron). While the samples used in the Round Robin covered a wide range of analytical complexity,this paper reports the results for only the sample 1 mixtures. Sample 1 is a simple three-phase system prepared with eightdifferent compositions covering a wide range of abundance for each phase. The component phases were chosen to minimizesample-related problems, such as the degree of crystallinity, preferred orientation and microabsorption. However, these werestill issues that needed to be addressed by the analysts. The results returned indicate a great deal of variation in the ability ofthe participating laboratories to perform QPA of this simple three- component system. These differences result from suchproblems as (i) use of unsuitable reference intensity ratios, (ii) errors in whole-pattern refinement software operation and ininterpretation of results, (iii) operator errors in the use of the Rietveld method, often arising from a lack of crystallographicunderstanding, and (iv) application of excessive microabsorption correction. Another major area for concern is the calculationof errors in phase abundance determination, with wide variations in reported values between participants. Few details ofmethodology used to derive these errors were supplied and many participants provided no measure of error at all.
SIZE-STRAIN ROUND ROBIN
The first round-robin phase on methods of line-broadening analysis was concluded in March after the last results were receivedfrom round-robin participants.
The preliminary report and analysis of results are available at http://www.boulder.nist.gov/div853/balzar , CPD and CCP14Web sites. More details about specimen preparation and new developments will follow in future Newsletter issues.
WWW sites related to powder diffraction
The Commission on Powder Diffraction (CPD): http://www.iucr.org/iucr-top/comm/cpd/The International Union of Crystallography (IUCr): http://www.iucr.orgThe International Centre for Diffraction Data (ICDD): http://www.icdd.comThe International X-ray Analysis Society (IXAS): http://www.ixas.orgCCP 14: http://www.ccp14.ac.uk/index.html
Submitting a proposal for neutron diffraction or Synchrotron Radiation X-ray Diffraction is possible at many Large ScaleFacilities (LSF) in the world. It represents an important and frequently unique opportunity for powder diffraction experiments.A useful guide and information can be accessed through the following web-sites, maintained by R.Dinnebier:http://www.pulverdiffraktometrie.de
This list is far from being complete and needs input from users and readers of the Newsletter. Please, send comments directlyto R. Dinnebier ([email protected])
3

Corrigendum in CPD Newsletter (No 25)In the previous issue of the CPD Newsletter, there was a small typographical error in the ordering of the figures in the articleby Paul Fewster entitled “Insight into polycrystalline materials with ultrahigh resolution and reciprocal space mapping”. Tomake full sense of this excellent article, Figures 2 and 3 should be switched round. (Ed.)
THE IUCR COMMISSION ON POWDER DIFFRACTION - TRIENNIUM 1999-2002
Chairman: Prof. P. Scardi (Paolo)Dipartimento di Ingegneria dei Materiali, Università diTrento, 38050 Mesiano (TN), Italy;Tel: +39 0461 882417/67 | Fax: +39 (461) 881977e-mail: [email protected]
Secretary: Dr A. N. Fitch (Andy)ESRF, Grenoble FranceTel: +33 476 88 25 32 | Fax: +33 476 88 25 42e-mail: [email protected]
Dr R. Delhez (Rob)Laboratory of Materials Science, Delft University ofTechnology, Rotterdamseweg 137 2628 AL Delft, TheNetherlandsTel: +31 15 2782261 | Fax: +31 (15) 278 6730e-mail: [email protected]
Prof. S. P. Sen Gupta (Siba)Department of Materials Science, IACS, Jadavpur, Calcutta700032, India; Fax. +91 (33) 4732805e-mail: [email protected]
Dr R. B. Von Dreele (Bob)LANSCE, Los Alamos National Laboratory, Los Alamos,NM 87545, USA; Fax: +1 (505) 6652676e-mail: [email protected]
Dr D. Balzar (Davor)National Institute of Standards and TechnologyMaterials Science and Engineering LaboratoryDiv. 853, 325 Broadway, Boulder, CO 80303, USATel: 303-497-3006 | Fax: 303-497-5030e-mail: [email protected]
Prof. G. J. Kruger (Gert)Department of Chemistry & Biochemistry, Rand AfrikaansUniversity, P O Box 524, Aucklandpark, South AfricaTel: +27 11 489 2368 | Fax: +27 11 489 2360e-mail: [email protected]
Prof. H. Fjellvåg (Helmer)Department of Chemistry, University of OsloP O Box 1033, Blindern N0315 OSLO, Norwaye-mail: [email protected]
Prof. W. I. F. David (Bill)Rutherford Appleton Laboratory (CCLRC), Chilton, Oxon.OX11 OQX, United KingdomTel: +44 1235 445179 | Fax: +44 1235 445383e-mail: [email protected]
Dr R. E. Dinnebier (Robert)Max-Planck-Institut für Festkörperforschung,Heisenbergstrasse 1, D-70569 Stuttgart, GermanyTel: +49-711-689-1503 | Fax: +49-711-689-1502e-mail: [email protected]
------------------------------------------------------------------
ICDD RepresentativeProf. R. L. Snyder (Bob)Department of Materials Science & Engineering, 2041College Avenue, Ohio State University, Columbus, OH43210-1179, USA; Fax: +1 (614) 2924668e-mail: [email protected]
ConsultantsProf. R. J. Cernik (Bob)Daresbury Laboratory, daresbury, Warrington, WA4 4AD,UK; Fax: +44 (1925) 603 124e-mail: [email protected]
Dr F. Izumi (Fujio)National Institute for Research in Inorganic Materials1-1 Namiki, Tsukuba, Ibaraki 305-0044, JapanTEL: +81-298-51-3354 (ext. 511); FAX: +81-298-52-7449E-mail: [email protected]
4


Revisiting the 1998 SDPD Round Robin
Armel Le Bail (1) and Lachlan M.D. Cranswick (2)
1. Université du Maine, Laboratoire des Fluorures,CNRS ESA 6010, Avenue O. Messiaen, 72085 LeMans cedex 9, France - E-mail: [email protected]
2. Lamont-Doherty Earth Observatory of ColumbiaUniversity PO Box 1000, 61 Route 9W Palisades, NewYork, 10964-1000, USA E-mail: [email protected]
INTRODUCTION
In the middle of 1998, the number of structuredeterminations by powder diffractometry (SDPD) wasclose to 300 of which 250 were published in the period1992-1997 [1]. At that time, a huge number of methodsand computer programs had already proven, at least once,their efficiency in succeeding in the various steps of theprocess of solving structures from powder diffraction data.The word "routine" was pronounced more and morefrequently, so that it was considered timely to organize aRound Robin, in order to try to clarify the various claimsabout the ease or otherwise in performing SDPDs. Dataand questionnaires were made available from a Web sitestarting from May 18, 1998 and the deadline was the lastday of June. The competition was spammingly announcedat many Newsgroups and Mailing lists related tocrystallography and material science. Mails were sent alsoto some chemistry lists (Chemweb and CCL), trying tointerest structure predictors to undertake first principles orsemi-empirical calculations. Moreover, personal e-mailswere sent to a number of well-known experts. As aconsequence of this campaign, more than 800 visitors hada link to the homepage, which is still available [2]. 70 ofthe 800 visitors downloaded the data.SELECTION OF SAMPLES FOR ANALYSIS
There is a clear distinction between compounds for whichprior knowledge is available (molecular formula) or not.This difference may lead to one choosing quite differentmethods for solving the crystal structures. It was thusdecided to propose two samples that fulfilled theseconditions. We restricted the scope of this Round Robin tothe structure solution part by providing the cell and spacegroup information. The first sample was inorganic, acarbonatocobalt(III)pentamine nitrate hydrate; the secondsample was organic, the pharmaceutical compoundtetracycline hydrochloride. A medium resolutionsynchrotron pattern was provided for the latter, as well as aconventional X-ray powder pattern with similar resolution.The organic sample was especially selected for modellocation methods; the molecular shape, however, was notgiven. We considered that the shape could have been veryeasily obtained from various sources. During the RoundRobin course, one of the participants gave a very accuratestructure for tetracycline hydrochloride that even includedhydrogen positions. Thus for validation purposes, it wasfound necessary to record a data set from a very smallsingle crystal (40x30x20µ) selected in the powder, usingthe Daresbury 9.8 station equipped with the SMARTSiemens system [3]. The subsequent structure wasdetermined easily (SHELXS) and refined without anyconstraint, including the hydrogen atoms [4]. This raisesthe question of what constitutes a powder and what asingle crystal sample. The inorganic structure is also
published now proving that a solution was obtainable frompowder data [5].PARTICIPANTS
The 70 people who downloaded data may be consideredto be subscribers to this Round Robin. The possibility wasgiven for either anonymous download or filling a Webform asking for details about which methods and softwarewill be used for 3 main steps : structure factors extraction,structure solution and structure completion and refinement.31 subscribers filled in the Web form, more or lesscompletely, indicating that they intended to use some ofthe best known programs such as GSAS, FULLPROF,SHELX and SIRPOW. 11 participants gave explicitanswers to all the 3 main steps, simultaneously. One expertindicated after the deadline that he would have participatedif the molecular shape had been given for sample 2.RESULTS AND DISCUSSION
In the end, we received 5 full questionnaires from 4 finalparticipants; one questionnaire for sample 1 and four forsample 2. Participant 1 made a very rapid reply but wasunable to provide coordinates. By a search in theCambridge Structural Database, he easily found thereference for the pharmaceutical compound as being thetetracycline (alias achromycin) hydrochloride. He thensuggested that the coordinates should be found in thisreference. Unfortunately, however, the coordinates werenot available in this paper or in the Cambridge StructuralDatabase. Only the molecular formula was available.Participant 2 was the only regular subscriber to have sent asuccessful questionnaire. He focused his attentionexclusively on sample 2 and solved its structure, includingthe hydrogen atom positions by the global optimizationmethod. A model for the molecule was taken from thetetracycline hydrate in the Cambridge Structural Database(TETCYH10 entry) and the water was removed. Thetetracycline fragment and the Cl atom were positioned atrandom in the unit cell and an optimum position wassearched (Fig. 1) by simulated annealing using the DRUIDprogram against the 100 first structure factors extracted bythe Pawley method from the synchrotron data. The finalRietveld refinement plot is shown on the Figure 2. There issomething curious between the starting and final model.The main move is that O2 and N1 in the TETCYH10model have rotated by 180° along the C2-C3 axis. The H
Fig. 1 Comparison of the molecular structures of tetracyclinehydrochloride obtained from global optimization andfrom the final Rietveld refinement (Participant 2)
7

atoms did not moved much between the initial and finalmodel. An additional hydrogen atom should have beenfound for building the complete sample 2 structure, O2 inthe hydrate becoming an OH. This hydrogen was notincluded by participant 2. Interviewed on this question,participant 2 commented that the exclusion of thehydrogen atom was an oversight caused by no sleep on theprevious night. The diffraction pattern had beendownloaded and the structure solved the day after a trans-Atlantic flight. The total time for solution was two hours.
Participant 3 did not have easy Web access and obtainedthe data by e-mail. He thought that sample 2 would beunsolvable without the molecule connectivity and askedfor it. We had anticipated that we would reply positively tosuch a request, as the connectivity could normally beindependently determined by a chemist using othermethods such as magnetic resonance. Participant 3 sentfilled questionnaires for samples 1 and 2, estimating finallythat both of them were unsolvable. We are forced toconclude that the remaining participants found thestructures either non-routine, non-solvable or toouninteresting.
Participant 4 downloaded the data anonymously andsolved the sample 2 structure from the conventional X-raydata by using the CSD package. 158 structure factors wereextracted by using the CSD-PROFAN program. Using theCSD-MAIN program, the chlorine atom was located byPatterson methods. The first Fourier map produced thecoordinates of ten of the other atoms. Several cycles ofRietveld and Fourier syntheses were required to completethe structure (Figs. 3 and 4). According to participant 4, thefull time needed for solution and refinement was only 3hours, 2 cups of coffee and 5 cigarettes by using a low-endIntel PC. Participant 4 wrote also that "the structure of theinorganic complex is very simple and that is why it is notinteresting."
It should be stated that participant 2 had provided themost accurate results with mean displacements relative tothe single crystal data lower by a factor 2 than those fromparticipant 4 and from the organisers [2]. Even thehydrogen atom positions were well located with a meanerror of 0.2 angstroms.COMMENTS
If the structure was in fact quite simple to solve usingPatterson - doesn't it say something t hat there was not a
flood of results? The solving of sample 2 structure fromPatterson is not really the way that most crystallographerswould have expected. Preconceived ideas would haveprevailed that the unique Cl atom would not have been soheavy that a Patterson would have easily disclosed it.
Participant 4 obtained RF=0.57 with the Cl atom.Remember that putting anything at any place gives youalready RF=0.5 or 0.6. In fact, the structure solution asdescribed by participant 4 appears disarmingly simple, butit is not that straightforward. Here is why. Let us examinethe Fourier difference as Participant 4 provided it. The 2main first peaks are not atoms, neither is the fourth, theseventh nor the ninth. Many standard crystallographerswould have given up at this stage, but not Participant 4. Hewas able to recognize a connected chain of 6 atoms. Hereis the importance of skill, and experience. Most peoplewould have stopped, rejecting this Fourier synthesisbecause of the two first intense peaks do not correspond toanything, or perhaps would have attempted a refinement ofthe coordinates, which would have failed. Many would noteven have believed that a Fourier synthesis with only theCl atom would have a chance to be successful. Theorganizers did not try the Patterson method because theyhad the preconceived idea that it was impossible (in factwe continue to think that way). Because the SDPDRR ismainly a YES/NO Round Robin (i.e. you win or not), weshould take all those lacking questionnaires for 68x2 as afailure to solve. Perhaps, we should not count the 70 datadownloaded but only the 31 regular subscribers.Anonymous downloaders never formally declared theirintention to solve the problems. However, it should benoted that if single crystal data had have been provided,structure solving would have been “routine” using allfreely and commonly available single crystal structure
8
Fig. 2 Final synchrotron X-ray diffraction Rietveld plotfor tetracycline hydrochloride.
Fig. 3 Final conventional X-ray diffraction Rietveld plot fortetracycline hydrochloride.
Fig. 4 Tetracycline hydrochloride model built from Patterson and Fourier recycling (Participant 4).

solution packages; e.g.; SHELXS, SIR, DIRDIF, CRUNCH.
CONCLUDING REMARKS AND RECOMMENDATIONS
The conclusion from this 1998 Round Robin is thatsolving structures “on demand” from powder diffraction isnon-routine and non-trivial, requiring much skill andtenacity on the part of practitioners (though this should betempered by the fact that no molecule location programwas easily available for free from any website in 1998).Publications stating that structure solution using powderdiffraction data is now “routine” (especially from theperspective of single crystal practitioners attemptingpowder diffraction based structure solution) could beconsidered misleading. Providing inaccurate, rosy reviewscan be counter productive with respect to bringing the fieldinto disrepute as being one populated by thecrystallographic equivalent of snake-oil salesmen. Thecrystallographic definition of “routine” structure solution ispresently based on the single crystal experience, of onewhere structures literally solve to near completion at theclick of a button. At present much work can be done toenhance powder diffraction based software to give themsingle crystal quality automation and robustness to helpmake structure solution from powder diffraction more anattractive method than it is at present.TODAYA report on the SDPD Round Robin delivered at the ECM-18 congress is still available [6], as well as one written by ascientific journalist, David Bradley [7]. The number ofdetermined structures using powder diffraction data is now
approaching 500, and the proportion of organic compoundsslightly increases, but remains lower than 20%. Newprograms for molecule location have been made available[8]: POWDERSOLVE (having proposed a post-deadlinecontribution [9]), PSSP, ENDEAVOUR, TOPAS, ESPOIR,etc, or new options of old programs (the upcoming versionof EXPO2000 and the renamed DASH, which was formallyDRUID. Alas a good number of these programs arecommercial. Moreover, the use of the Internet has grownsince 1998 so that if the Round Robin had been proposedin 2001, more participants would have had a chance tosucceed with both samples. Nevertheless, confirming thishypothesis needs a new Round Robin to be organized.Perhaps now is a good time.REFERENCES
1. http://www.cristal.org/iniref.html2. http://www.cristal.org/SDPDRR3. CLRC Daresbury Synchrotron, Station 9.8.
http://srs.dl.ac.uk/xrd/9.8/4. Clegg, W. & Teat, S.J. (2000). Acta Cryst. C56, 1343-
1345.5. Zhu, J.H., Wu, H.X. & Le Bail, A. (1999). Solid State
Science 1, 56-62.6. http://www.cristal.org/iniref/ecm18/ecm18sdpdrr.html7. http://www.chemweb.com/alchem/alchem98/catalyst/cto
ld/ct_980911_xray_full.html8. http://www.cristal.org/iniref/progmeth.html#n79. http://www.msi.com/materials/cases/an_roundrobin.html
A 117-Atom Structure from PowderDiffraction Data
Lynne B. McCusker, Christian Baerlocherand Thomas Wessels,
Laboratory of Crystallography, ETH, Zurich, SwitzerlandINTRODUCTION
This is the story of how the structure of the very complexzeolite UTD-1F, with 117 atoms in the asymmetric unit,could be solved from powder diffraction data[1]. Thestructure solution was the culmination of a long period ofmethod development that required not only new dataanalysis software, but also a new way of collecting data [2].But let us begin at the beginning.
Our research group has a long-standing interest in zeolitestructure analysis, and, because zeolites are rarely availablein the form of single crystals, this has always includeddevelopment of powder diffraction methodology. In oursearch for more powerful approaches to zeolite structuresolution, model calculations reported by Hedel et al.[3]
prompted us to consider the possibility of exploitingtexture (preferred orientation of the crystallites). Usually,powder diffractionists go to great lengths to avoid anypreferred orientation in their samples, because it canseverely distort the intensities in the measured diffractionpattern. However, if the data are collected appropriately,this distortion, which is a function function of theorientation of the crystallites in the sample and of thesample in the X-ray beam, can provide additional
information about the relative intensities of reflections thatoverlap in 2θ.CONCEPT
Consider the three types of samples (single crystal,"ideal" powder and textured powder) sketched in twodimensions in Fig. 1a-c. The textured sample is intuitivelyintermediate between a perfectly oriented single crystal,and a powder with crystallites oriented in all directions,and the corresponding two-dimensional diffraction patternssupport this view. The three reflections highlighted in (a),
Fig 1 Two-dimensional schematic drawings of a specimenand its diffraction pattern for (a) a single crystal, (b) apowder with randomly oriented crystallites, and (c) atextured powder. The arrows highlight three reflectionswith similar diffraction angles that are separated in thesingle-crystal pattern, but overlap in the normal powderpattern. The diffraction angle 2θ increases radiallyfrom the center of each diffraction pattern.
9

overlap in the powder pattern in (b), but can bedistinguished in (c).
By collecting data along several different radial directions(i.e. by orienting the sample appropriately in the X-raybeam), information about the relative intensities ofreflections that overlap in a standard powder diffractionpattern can be obtained. This was the basic idea behind thesubsequent method development.EXPERIMENTAL SETUP
To collect the necessary data on a flat-plate sample inwhich a preferred orientation of the crystallites has beeninduced, a controlled way of orienting (tilting and rotating)the sample in an X-ray beam is required. This is easilydone by adding two more circles (χ for tilting and φ forrotating) to a Bragg-Brentano diffractometer, so that theinstrument resembles a standard 4-circle single-crystaldiffractometer. However, problems arise as soon as thesample is tilted, because parts of the sample are moved offthe focusing circle and the parafocusing condition isviolated. The result is that the peaks in the diffractionpattern become very broad as the tilt angle increases. Tocircumvent this problem, a parallel beam geometry with apre-detector analyzer crystal was used. This setup (Figure2) was installed on the powder diffractometer on theSwiss-Norwegian Beamline (SNBL) at the EuropeanSynchrotron Radiation Facility (ESRF) in Grenoble, andearly experiments showed that high-resolution patternscould indeed be obtained at any tilt angle.
DATA COLLECTION
Before any data collection can be done sensibly, theintensity fall off as a function of 2 θ and tilt (the X-raybeam overshoots the sample at higher tilt angles) must becalibrated with an untextured sample that has an absorptionsimilar to that of the sample of interest. We used a sampleof the cubic Zeolite A with very small crystallites for thispurpose. The next step is to determine how the crystallitesare oriented in the sample, and that is done by measuringpole-figure data on several (number depends upon thesymmetry) non-overlapping reflections. That is, thevariation of the intensity of a single reflection is measuredas a function of sample orientation (5° steps in bothrotation and tilt, for a total of 1081 measurements(72×15+1) for a maximum tilt of 80°). Finally, thosesample orientations that are likely to give the largestintensity contrasts are selected for the collection of fulldiffraction patterns.
DATA ANALYSIS
Data analysis is based on the equation
y(2θ,χ,φ) = IhklPhkl (χ,φ)G(2θ − 2θhkl )hkl∑
where y is the intensity of the powder diffraction patternmeasured at step 2θ for the sample orientation (χ,φ), thesummation is over all reflections contributing to theintensity at that step, Ihkl is the true integrated intensity ofreflection hkl (single-crystal value), Phkl(χ,φ) is its pole-figure value for the sample orientation (χ,φ), and G(2θ-2θhkl) is the peak profile function.
First the texture of the sample is determined from thepole-figure data. Once this has been done, the orientationof the crystallites is known, and the values of Phkl(χ,φ)(measure of how much of the total intensity of reflectionhkl will be measured at a specific sample orientation) canbe calculated for any sample orientation. A single set ofsingle-crystal-like intensities can then be extractedsimultaneously from the full diffraction patterns measuredat different sample orientations. Although the uncertaintiesin these reflection intensities will be larger than thoseobtained from a single crystal, they will be much morerealistic than those obtained from a standard powderdiffraction pattern.THE HIGH-SILICA ZEOLITE UTD-1F
As the method development was approaching completion,we received a highly crystalline sample (i.e. the peaks inits powder diffraction pattern were very sharp) of thezeolite UTD-1F from Dr E.J.Creyghton, Shell, Amsterdam.Preliminary indexing of the pattern gave a monoclinic unitcell (a = 14.963 Å, b = 8.470 Å, c = 30.010 Å, β = 102.7°,V = 17,616 Å3), and the systematic absences wereconsistent with the space group P21/c. Because of the size
Fig. 2 Experimental setup
10 11 12 13 14 15 16 17 18 19 Þ2θ
a
bc
de
Fig. 3b Small sections of the five diffraction patternscollected at the sample orientations indicated in thepole figure.
Fig. 3a The pole figure for the 10 2 reflection of the texturedUTD-1F sample.
10

and symmetry of the unit cell, the reflection overlap isconsiderable, and attempts to solve the structure usingstandard techniques did not succeed. The unit cell appearedto be substantially different from that reported for a similarmaterial UTD-1 (orthorhombic, a = 18.98, b = 8.41, c =23.04 Å), which had been shown to be disordered [4].
Fortunately, the crystallites in the sample were very longfine needles (ca. 0.5 × 0.5 × 40 µm3) and appeared to beparticularly well-suited for the application of the newmethod. To orient the crystallites, the polycrystallinepowder was mixed with a small amount of a viscouspolystyrene / tetrahydrofuran solution and then smeared ona glass slide using a single motion. The slurry was allowedto dry and then a second coat was applied by smearing inthe same direction. This process was repeated until thespecimen was suitably thick.
Pole-figure data were collected for 7 non-overlappingreflections, and then full diffraction patterns were collectedfor five different sample orientations (Fig. 3). A fulltexture analysis of the pole-figure data was performedusing the program package BEARTEX[5] to determine thePhkl(χ,φ) values, and then using these values, a single set ofreflection intensities was extracted from the five diffractionpatterns. These data were used as input to the directmethods programs in the single-crystal program packageXtal3.2 [6] running in default mode.
In the top 40 peaks of the initial E-map, 16 Si, whichdescribed a complete 3-dimensional, 4-connectedframework with 14-ring pores (Fig. 4), and even 17 of thebridging oxygens were found. Subsequent differenceelectron density maps generated using the pseudo single-crystal data allowed the remaining 15 oxygens and the(non-framework) Co to be located. The electron densitymap generated using this structural model and the powderdiffraction data collected with synchrotron radiation on anon-textured sample, immediately revealed the location ofthe C atoms of the pentamethylcyclopentadienyl (Cp*)rings coordinated to the Co, to yield a structure with 69atoms (16Si + 32O + 1Co + 20C) in the asymmetric unit.However, the short distances between symmetry-relatedCo(Cp*)2
+ complexes required that a disordered model beassumed.
Refinement of this structure, particularly the atoms of theCo complex, was not stable, and small but significantintensity differences between the observed and calculateddiffraction patterns remained (RF = 0.118 and Rwp = 0.309).Consequently, a reduction of the symmetry to Pc wasattempted, even though the concommitant increase in thenumber of positional parameters (from 207 to 349) wasunderstood to be problematical. Much to our surprise anddelight, the refinement then proceeded smoothly andeventually converged with RF = 0.041 and Rwp = 0.134(Rexp = 0.101). The weight of the geometric restraints onthe atoms of the framework and the Co complex could bereduced to 1.0 (i.e. each restraint has the same weight as asingle point in the diffraction pattern) and the atomicpositions remained stable and chemically sensible. In thefinal structure, with 117 atoms (32Si, 64O, 1Co and 20C)in the asymmetric unit, the Co complex is found to becompletely ordered in the 14-ring channels (Figure 4).CONCLUSION
And so a 117-atom structure was solved from powderdiffraction data alone. The power of the texture approachlies in the fact that reflection intensities much closer to thetrue single-crystal values are obtained, so subsequentstructure analysis is more likely to be successful.Although a zeolite structure solution has been describedhere, the method is by no means restricted to zeolites. Itcan be applied to any kind of polycrystalline material aslong as a sample with a homogeneous texture can beprepared (not as difficult as it sounds). The data collectionfor UTD-1F took 3 days of synchrotron beamtime, but arecent adaptation of the method to transmission modeusing an area detector has allowed the beamtime requiredto be reduced to as little as 3 hours. This makes it a muchmore attractive option when standard approaches tostructure solution do not work. Data analysis is admittedlyless straightforward than a normal intensity extraction, butthe software (expol) has been written[7], and will be madeavailable once the testing phase is complete. While this isnot the method of choice for straightforward problems, it isclearly a very powerful one for more complex ones.REFERENCES1. T. Wessels, Ch. Baerlocher, L.B. McCusker and E.J.
Creyghton, J. Am. Chem. Soc., 121, 6242-6247(1999).
2. T. Wessels, Ch. Baerlocher and L.B. McCusker,Science, 284, 477-479 (1999).
3. R. Hedel, H.J. Bunge and G. Reck, TexturesMicrostruct., 29, 103-126 (1997).
4. R.F. Lobo, M. Tsapatsis, C.C. Freyhardt, S.Khodabandeh, P. Wagner, C.Y. Chen, K.J. Balkus,S.I. Zones and M.E. Davis, J. Am. Chem. Soc., 119,8474-8484 (1997).
5. H.R. Wenk, S. Matthies, J. Donovan and D.Chateigner, J. Appl. Crystallogr., 31, 262-269 (1998).
6. S.R. Hall, H.D. Flack and J.M. Stewart, Eds., Xtal 3.2Reference Manual, Universities of Western Australia,Geneva and Maryland, 1992.
7. T. Wessels, Ph.D. Thesis, ETH, Zürich, Switzerland,1999.
Fig.4 The structure of the high-silica zeolite UTD-1Fshowing the framework structure and the ordering ofthe Co(Cp*)2
+ complexes in the 14-ring channels.
11

Drug polymorphism and powder diffraction
Peter Sieger1, Robert Dinnebier2,Kenneth Shankland3 and Bill David3
1 Analytical Sciences Department, Boehringer IngelheimPharma KG, Birkendorferstrasse 65,88397 Biberach a.d. Riss, Germany
2 Max-Planck-Institute for Solid State Research,Heisenbergstrasse 1, D-70569 Stuttgart, Germany
3ISIS Facility, Rutherford Appleton Laboratory, Chilton,OX11 0QX, UK
INTRODUCTION
Polymorphism, the occurrence of different structuralforms of the same compound, is a very commonphenomenon in pharmaceutical compounds. This is nothard to understand since the internal torsional flexibility ofmost drug compounds results in energetically similarmolecular conformations and consequently differentcrystal structures. Clearly of scientific interest, this is alsoimportant commercially, since the occurrence ofpolymorphism poses problems in the processing andmanufacture of drug products.
Anecdotal evidence amongst pharmaceutical scientistswould suggest that polymorphism in drug compounds isthe rule rather than the exception. Indeed, McCrone hasstated that “the number of polymorphs found for achemical substance is proportional to the time and effortspent researching it.” In contrast to this assertion, the Cambridge StructuralDatabase, which contains a quarter of a million organicand organometallic crystal structures, is not a reliableindicator of the prevalence of polymorphism in thesesystems. One reason is that many polymorphs are onlyeasily obtained as polycrystalline powders rather thansingle crystals. Moreover, it is often difficult to isolatephase-pure samples of individual polymorphs. It takessubstantially more effort to extract these structures frompowders and particularly from multiphase samples.Fortunately, the global optimisation methods that areideally suited to these problems are now more generallyavailable and the number of polymorphic samples solvedfrom powder data alone is growing.
The potential rewards for solving multiple polymorphs aresubstantial and not merely from the financial viewpoint ofpatent protection. The structural description of a completerange of polymorphs can lead to a much deeperunderstanding of the structure and properties of the drug inquestion.STRUCTURE SOLUTION OF TELMISARTAN
In this article, we discuss a new orally active non-peptideangiotensin II receptor antagonist that is used in theindication of hypertension and congestive heart failure.Telmisartan is now known to exist in different crystallinemodifications, but this polymorphism was onlyencountered very late in the compound’s developmentcycle; i.e a small change in the last purification stepinduced the appearance of new polymorphs. At least threedifferent forms, the two anhydrous forms A and B, whichare described in this paper, and a solvated form C, are thusfar known. The structure of the solvated form C wasdetermined from single crystal X-ray diffraction data. Allattempts to grow single crystals of the two solvent freepolymorphs A and B suitable for single crystal diffractionfailed. Form A crystallizes in extremely long needles (seeFig 1a), while form B (Fig. 1b) is obtained by subsequentdrying from the solvated form C. Polymorph B could notbe obtained as a single phase, which made successfulstructure determination of this form even morechallenging. Furthermore, during the drying process of thesolvated form C traces of another so far unknowncrystalline form of Telmisartan were formed as acontaminant alongside form B. Although the morphologyof the single crystals of the solvated form C is preservedupon drying, the single crystals themselves disintegrate.The crystal structures of both anhydrous forms A and Bcould, therefore, only be solved by ab initio structuredetermination from high resolution X-ray powderdiffraction patterns. The structures were finally solvedusing the global optimisation program DASH largelybecause this approach makes good use of the alreadyknown molecular topology. All the compounds werecharacterized by microscopy, infra-red spectroscopy, solidstate 13C-MAS NMR spectroscopy and thermal analysis(DSC and TG).
Fig. 1a Photograph of form A of Telmisartan: (long needle-like crystals)
Fig 1b Photograph of form B of Telmisartan: (platelet-likecrystals with prismatic shape).
12

EXPERIMENTAL
The samples were sealed in quartz glass capillaries for thehigh-resolution X-ray powder diffraction experiments.Data were collected at room temperature at beamlineX3B1 at the National Synchrotron Light Source,Brookhaven National Laboratory. For polymorph A(λ = 1.14981(2) Å), X-ray scattering intensities wererecorded for 2.8 seconds at each 2 θ in steps of 0.004°from 2.0° to approx. 40°. For form B (λ = 1.14911(2) Å),each point was measured for 2.2 seconds at a 2 θ intervalof 0.01° from 2.0° to approx. 30°. Samples were spunaround θ during measurement to reduce preferredorientation effects. Both powder patterns are characterizedby a rapid fall off of intensity beyond sinθ/λ≈ 0.17 Å-1. Ingeneral, the crystallinity of polymorph A was superior tothat of polymorph B.
Data reduction was performed using the program GUFI5.0. Indexing of the powder patterns of polymorphs A andB using the program ITO led to primitive monoclinic unitcells of volumes of ~2700 Å3. Due to the contamination ofthe sample representing polymorph B, the correct indexingof the powder pattern was very challenging. The spacegroups could, however, be determined unambiguously asP21/c for polymorph A and a metrically distinct spacegroup P21/a for polymorph B from the observed extinctionrules. The number of formula units per unit cell could bedetermined to Z= 4 from packing considerations.
Structure solution of polymorphs A and B was attemptedusing direct methods but all efforts failed. This can beunderstood in view of massive accidental overlap of peaks,typical for a unit cell of that size with low space groupsymmetry. Since the connectivity of the atoms was knownfrom the single crystal study of the solvated form C,structure determination for polymorphs A and B wascarried out by means of a simulated annealing technique,using the program DASH. For the definition of theconnectivity between the atoms within the molecule, the Z-matrix notation was used, which the program packageDASH calculated automatically from the structure PDB-file obtained from the single crystal study of the solvatedform C. This notation allows a description of the entiremolecule and its intramolecular degrees of freedom byusing interatomic distances, angles and dihedral angles. Allintramolecular angles and distances were kept fixed at thevalues of the single crystal data of the solvated form C,allowing only the 7 torsion angles to vary. The diffractionintensities were extracted from a Pawley type refinement,also part of the DASH program. A total of 14 parameterswas varied during the simulated annealing runs (7 torsion
angles, 3 fractional parameters for the position of themolecule and 4 quaternions describing the orientation ofthe molecule within the unit cell). The crystal structures offorms A and B were solved fully without any use ofintervention by the simulated annealing procedure on apersonal computer (Pentium III 733 MHz) inapproximately one hour, needing approx. 4 million movesin the simulated annealing. Final Rietveld refinementswere carried out using the program GSAS, in which onlythe scale and overall temperature factors were refined. Theexcellent agreement between the measured and thecalculated profile for polymorph A indicates that furtherrefinement probably not reveal any more significantstructural details. Misfits between the measured and thecalculated profile for polymorph B mainly arise from thecontamination with an impurity phase as discussedpreviously.CONCLUSIONS
It was indisputably possible to determine the molecularconformations with high precision of both polymorphsshowing that moderately complex molecular crystalstructures can nowadays be solved quickly and routinelyfrom X-ray powder diffraction data. It was not possible todetermine individual bond lengths and angles within themolecules. However, this was not the goal of this study,because the interatomic distances and angles of themolecule were already known from the single crystal studyof the solvated form C. Of much more interest was to getsome idea of why different polymorphs of Telmisartan canbe formed. This question could be clearly answered bysolving the structures of the polymorphs A and B from X-ray powder diffraction data. It is quite obvious from thisstudy that the molecular conformations of the threecrystalline modifications (including also the solvated formC) differ significantly. It was very interesting to learn thatthe small changes in the molecular conformation have astrong impact on the packing of the molecules, resulting incompletely different structures with completely differentintermolecular binding forces thus resulting in completelydifferent physicochemical characteristics (e.g. melting orsolubility behaviour) within one and the same compound.REFERENCE
1. R.E. Dinnebier, P. Sieger, H. Nar, K. Shankland andW I F David, J Pharm. Sci. 89, 1465-1479 (2000)
Fig 2a The molecular conformation of Form A
Fig 2b The molecular conformation of Form B
13

Malaria, Synchrotron Radiation and MonteCarlo
P W Stephens§, S Pagola§, D S Bohle¶ & A D Kosar¶
§Dept. of Physics & Astronomy, SUNY, Stony Brook¶Dept. of Chemistry, University of Wyoming.
INTRODUCTIONMalaria presents a terrible health problem. As many as
half a billion people are sick with the disease and severalmillion die of it each year. Most of these are youngchildren in Africa. The problem is exacerbated by the factthat the Plasmodium parasite, which causes malaria, isdeveloping resistance to the drugs in wide use today.
The plasmodium parasite has a complicated life cyclewith several developmental stages in mosquitoes and alsoin its human victims. The most damaging phase ofPlasmodium is the late trophozoite, where it infests the redblood cells, digesting the oxygen-carrying enzymehemoglobin. In a massive infection, 80% of the victim’shemoglobin may be consumed. To any parasite, this is adangerously spicy dish. Its active site for oxygenabsorption, the iron porphyrin ring, is a potent oxidizingagent in solution and would prove fatal to the trophozoitesif present in significant concentration in the digestivevacuole of the microorganism. Just as a diner in aSzechwan restaurant piles the hot peppers on the side ofthe plate, Plasmodia immobilize the heme groups liberatedby proteolysis into an insoluble crystalline material calledhemozoin. The process by which hemozoin is formed isnot known and until our recent work at NSLS neither wasits structure.
Approaches to controlling the disease may be made atmany stages of its life cycle from controlling the mosquitovectors to current efforts to develop a vaccine against theearly infestation. In the 17th century, Jesuit missionariesobserved indigenous peoples of Peru using the bark of thecinchona tree to treat fevers and noted that it had the abilityto cure malaria and brought the material to Europe. Theactive ingredient, quinine, is arguably the first drug knownto treat any disease. However, it has limited effectivenessand is somewhat toxic in therapeutic does. Synthetic drugshave been developed since the mid-20th century and havelargely replaced quinine.
Chloroquine has been the most successful antimalarialdrug. There is a long history of models for the action ofchloroquine and related drugs, many of them subsequentlydisproved. Various experiments, such as autoradiographyof trophozoites growing in the presence if labelledchloroquine, show that it is associated with thecrystallization of hemozoin. This suggests that the drugacts by interfering with the growth of the solid phase andsuggest avenues for the possible development of newdrugs, especially ones that might sidestep the resistance ofsome Plasmodium strains to chloroquine. Progress towardthese goals depends on understanding the precise nature ofhemozoin. For a long time, it has been widely assumed thathemozoin is a polymer, consisting of covalently bondedchains of heme groups. Evidence for this has been theobservation that iron-carboxyl bonds via infraredabsorption in hemozoin and the low solubility ofhemozoin. However, neither of these observations provesthe polymer model. Nevertheless, the idea has beenreinforced in the literature so that most biochemical papers
refer to it as heme polymer. Unfortunately, crystals ofnatural hemozoin, as well as synthetically producedmaterials are too small for single crystal analysis, eventhough microscopy shows that they are needles with well-defined facets (Fig. 1).
INITIAL RESULTSIn our first powder diffraction measurements, in
collaboration with David Cox and Robert Dinnebier, weused the powder diffraction peak positions alone toidentify the dimensions of the unit cell. We readily foundthat the hemozoin unit cell is triclinic, with a volume of1416 Å3.
From the density, we inferred that there must be twomolecules in the unit cell, and since the material is aracemate, we knew that they would be related by inversion,so that only one molecule must be placed in the unit celland the resulting space group is P 1 . In that initial work,we also showed that synthetic hemozoin (known as β-hematin) had a powder diffraction pattern identical to thecrystalline component found in whole dried blood cellswhich had been infected with malaria.
THE PSSP COMPUTER PROGRAMThe nature of the crystal structure solution problem,
especially from powders, is that it is easy to see if given acandidate solution is compatible with experimental data,and to refine the details of a given model if it is essentiallycorrect. When no model exists, the problem is far morecomplicated. However, for organic molecular solids, alarge amount of structural information, such as bondlengths and angles, is known with good accuracy. Thus,the crystal structure of a molecular solid can be describedby specifying the location and orientation of the moleculein the unit cell and any remaining internal degrees offreedom. As long as this prior information is sufficientlyaccurate, all chemically allowed structures can besummarised in a few parameters. Fig. 2 shows themolecular structure of the iron porphyrin molecule, whichcomprises hemozoin, known from biochemical studies,including the aforementioned synthesis.
Fig. 1 Scanning electron micrograph of synthetic hemozoincrystallites. The width of the image is about 50 microns.
14
Since the molecule does not have any of the symmetryelements of the lattice (in this case, only inversion), it mustoccupy a general position and orientation in the cell.Accordingly, six parameters give its position andorientation, and the eight bond torsion angles shown in Fig.2 specify the internal degrees of freedom. The correctstructure can be determined by searching that fourteendimensional parameter space and finding the values thatgive the best agreement between experimental data andcalculated diffraction pattern. While much simpler thanfinding each atom individually, this is still too large a taskto solve by an exhaustive search.
The simulated annealing method is a general techniquefor obtaining approximate solutions to optimisationproblems, based on the analogy with finding a low-energystate of a physical system by annealing it: heating it to ahigh temperature and cooling it slowly. Several groupshave independently applied this idea to the solution ofcrystal structures from powder data. Generally, one regardsthe parameter which is to be minimised, such as thefamiliar crystallographic weighted profile R-factor, as anenergy, and performs Monte Carlo searches to sample theconfiguration space, initially at some high “temperature.”This process is repeated as the temperature parameter islowered, and eventually, the system should condense into alow energy state, i.e., a satisfactory solution. There aredifferent approaches in practice, based on the choice ofenergy parameter, form of the Monte Carlo moves, tricksfor accelerating the algorithm, etc. Our own program,PSSP (for Powder Structure Solution Program) has beenused for several other problems, and is distributed, withseveral examples and tutorials, on the web athttp://powder.physics.sunysb.edu/programPSSP/pssp.html.
A run of PSSP on one of our β-hematin data setsproceeds as follows. Initially, the temperature parameter isso high that essentially every Monte-Carlo step is accepted.The value of the goodness-of-fit S parameter is largeenough to indicate that the candidate structures probed areno better than randomly placed atoms. In this simulation,the algorithm computes 100,000 structures before loweringthe temperature by 20%. The fit between experimental dataand model structures gradually improves until it condensesinto reasonable agreement. We typically repeat thisprocedure many times, and take seriously a structure only
if it recurs frequently, and if it makes chemical sense. Inthe present case, the only solution that emerges is the oneillustrated in Fig. 3, in which the hematin molecules aredimerized. Besides the excellent agreement in therefinements of the diffraction data, the supporting evidencefor this structure is that the solution has produced the iron-carboxyl bond observed in the infrared, which was notbuilt into the individual molecule from the start.
CONCLUSIONSWhat is surprising about this structure is that the iron-
carboxyl bonds do not form the anticipated polymerchains, but instead dimerize the hemes, so that the crystalis held together only by hydrogen bonds and the van derWaals attraction between dimers. What are theconsequences of this structure for understanding, andperhaps interfering with the sequestration of heme? Ourwork supports the hypothesis, originally voiced by Ridleyand Goldberg, that the quinoline antimalarial drug action isdue to its binding to high affinity sites on the surface of thehemozoin crystallites. It further suggests that appropriatestudies of the morphology of the hemozoin crystallites willlead to improved understanding of the biological control oftheir formation, analogous to the current status ofunderstanding of biomineralization. More broadly, itshould call attention to the growing power of powder X-ray diffraction to research communities who might findother interesting applications for these techniques.
ACKNOWLEDGEMENT
PW Stephens and DS Bohle are recipients of BurroughsWellcome New Initiatives in Malaria Research Award.REFERENCE1. S. Pagola, P.W. Stephens, D.S. Bohle, A.D. Kosar and
S.K. Madsen, “The Structure of Malaria Pigmentβ-Hematin,” Nature 404, 307 (2000).
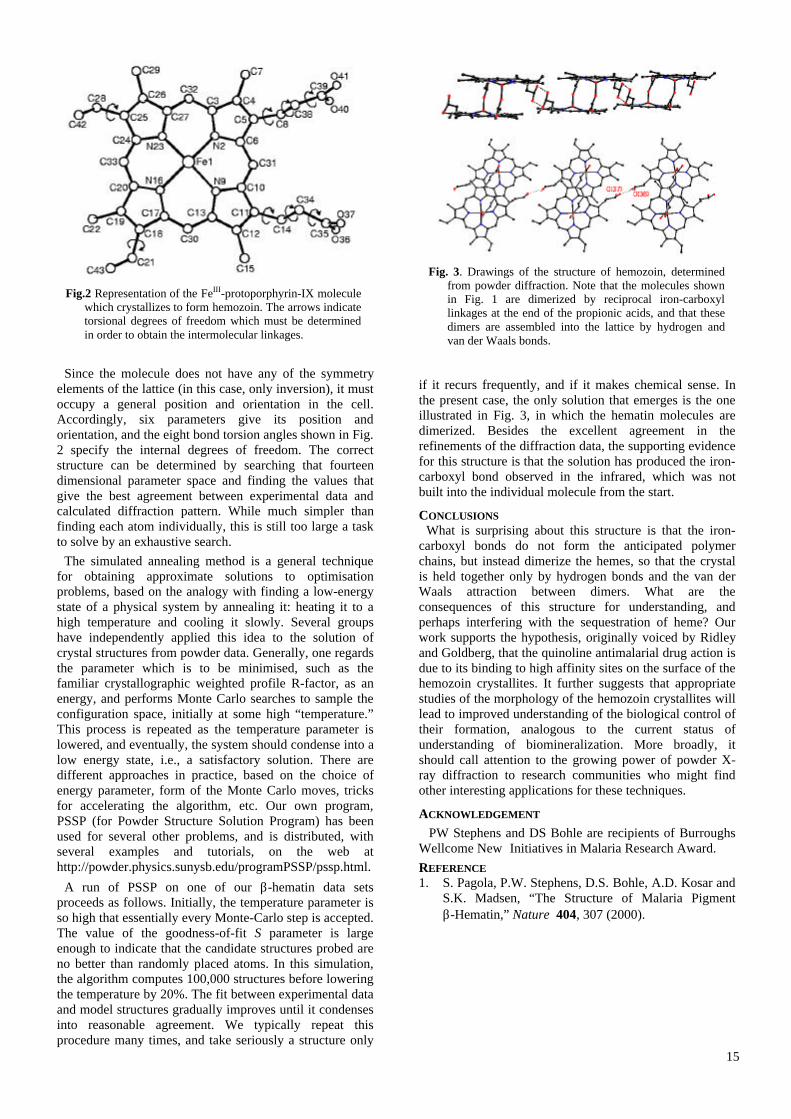
Fig.2 Representation of the FeIII-protoporphyrin-IX moleculewhich crystallizes to form hemozoin. The arrows indicatetorsional degrees of freedom which must be determinedin order to obtain the intermolecular linkages.
Fig. 3. Drawings of the structure of hemozoin, determinedfrom powder diffraction. Note that the molecules shownin Fig. 1 are dimerized by reciprocal iron-carboxyllinkages at the end of the propionic acids, and that thesedimers are assembled into the lattice by hydrogen andvan der Waals bonds.
15

A Case of Mistaken Identity:Metastable “dimethyl sulfide dibromide”
A N Fitch a,b G B M Vaughan a A J Mora b,c
a ESRF, BP220, F-38043 Grenoble Cedex, France.b Department of Chemistry, Keele University,
Staffordshire, ST5 5BG, UK.c Departamento de Química, Facultad de Ciencias,
Universidad de Los Andes, Mérida, Venezuela
INTRODUCTION
Synthetic chemistry is not always straightforward and weare often confronted with surprises. This is particularly truewhen the synthesis route does not lead to thethermodynamically stable phase. In this article, we willdiscuss a particularly unusual case that we have studiedrecently - the example of dimethyl sulfide bromide. Whenbromine is added to dimethyl sulfide, Me2S, in equimolarquantities, a yellow solid forms[1]. IR and Ramanspectroscopy indicate that this is a charge-transfercomplex, Me2S→Br2 with a nearly linear S-Br-Brarrangement. So far, so good.
However, as all crystallographers know, the only way tobe sure about the structure of a material is to go ahead andsolve it from diffraction data. Unfortunately, no singlecrystals were readily available and so we had to resort tostructure solution from powder diffraction data alone. Thisturned out to be straightforward and the structure wassolved, via standard powder procedures and direct methodsusing SIRPOW, from high-resolution powder synchrotronX-ray diffraction data, collected at the Swiss-Norwegianbeam line at ESRF.ANALYSING METASTABLE PHASES
Now comes the twist to the story. If the synthesis ismodified and the reagents are added in the reverse order,i.e. Me2S is added to bromine in dichloromethane at -30°C,then an orange solid forms. This material is metastable;over a number of weeks, it transforms back to the yellowform. The spectroscopic and chemical analyses suggestedthat the material was ionic, i.e. (Me2SBr)+Br?. The powderdiffraction pattern contained a large number of clearlyresolved peaks, indicating an excellent degree ofcrystallinity for the metastable material (see Fig. 1).However, attempts to index the pattern were unsuccessful,even though several different indexing programs wereused. No remotely acceptable figure of merit was obtained.This was a disappointment and a puzzle as a pattern ofsuch high quality is usually indexed as a matter of routine.
In such conditions, the most likely cause for failing toindex the pattern is the presence of more than onecrystalline phase. Now came the next problem. How manyphases were there? Matters would have been relativelystraightforward if the pattern contained the original stablephase and one new unknown metastable phase. However,there were no peaks discernable in the pattern from thestable phase and, to make matters worse, no apparentdifferences in the shapes or widths of any of the peaks thatmight betray the presence of a second phase.INDEXING THE DIFFRACTION PATTERN
The only way to proceed was to make the next simplest
assumption – that there were two unknown phases. Wethus attempted to index the pattern from the positions ofaround 50 diffraction peaks. With two phases and 50peaks, at least 25 peaks must come from one of the phases.We used the indexing program TREOR, running itcyclically via a Unix shell script and gradually increasedthe maximum cell volume and edge and the number ofunindexed peaks allowed (up to NIX = 30). Crucially, wealso enforced a very high degree of agreement betweenobserved and predicted peak positions. This constraintlimits the number of trial solutions and excludesmisindexed peaks from corrupting the trial cells. It does,however, require the peak positions to be determined tovery high angular accuracy for this approach to beeffective. Fortunately, this is generally the case thesynchrotron data. A monoclinic solution with an M20 of122 was eventually found which could account for abouthalf of the peaks. The unindexed peaks were thenprocessed separately, and a second monoclinic cell with anM20 of 198 was found, corresponding to a C-centredorthorhombic lattice. Systematic absences indicated thespace groups P21/n and Cmca. Multi-pattern LeBaildecomposition was used to obtain the peak intensities. Forthe monoclinic phase, the extracted intensities were useddirectly and the structure was successfully solved usingSIRPOW. For the orthorhombic phase, the partially refinedmodel of the monoclinic structure was used to describe theintensities of the peaks belonging to this phase whilst thoseof the orthorhombic phase were extracted. Again, thestructure of the orthorhombic phase was successfullysolved using SIRPOW.DETERMINING THE CORRECT STRUCTURE ANDSTOICHIOMETRY
In both structure solutions, extra peaks were found in theE-maps; these were due to extra bromine in the structures.After refinement, it was apparent that the stoichiometriesof the monoclinic and orthorhombic phases were Me2SBr4
and Me2SBr2.5, respectively - these values were differentfrom the reported chemical analysis. The composition ofthe two-phase mixture was refined to be 60.6(2)%monoclinic and 39.4(2)% orthorhombic form, implying amass fraction for Br in the sample of 80.7%, in contrast to72.0% from the assignment as a form of Me2SBr2.
In agreement with the spectroscopic analysis, theorthorhombic phase, Me2SBr2.5, is clearly ionic and has aBr? ion coordinated by two (Me2SBr)+ species in a layer-like arrangement. Between the layers, additional Br isincorporated into near-linear Br4
2? ions.
Fig. 1 The powder diffraction pattern of the metastablecompound, collected with λ = 0.94718(1)Å
16

In terms of the complex ions present, the compositionper unit cell is (Me2SBr+)16(Br?)8(Br4
2?)2. The monoclinicstructure, Me2SBr4, is more complicated and looks lessionic than Me2SBr2.5, and indeed has structural featuresthat resemble those found in the simple charge-transfercomplex Me2SBr2 and in Me2SBr2.5. In terms of an ionicformulation, the contents of the unit cell are(Me2SBr+)4(Br?)4(Br2)4.
How might changing the order of adding the reactantscause different products to form? It is clear from the resultsof this study that a single Me2S molecule can interact withmore than one molecule of bromine. When bromine isadded to Me2S, there is only a limited amount of bromineavailable at any instant. It is evenly taken up by the waitingMe2S molecules. When Me2S is added to bromine, there isinitially a large excess of bromine. The first Me2Smolecules added saturate themselves forming Me2SBr4.Later molecules form Me2SBr2.5. Presumably the last Me2Smolecules find nothing left for them, (c.f. the perennialsituation at a conference buffet), and are lost during
removal of the solvent. The most stable product of reactionis Me2SBr2 and the metastable compounds convert to thisby loss of bromine over a period of weeks.SUMMARY
The story therefore has a happy ending. High-resolutionpowder diffraction data has been used to solve thestructures of two previously unknown compounds, withoutprior knowledge of either their individual stoichiometry orthe fact that there were two compounds present in thesample. Interestingly, there was a clear problem with theancillary chemical analysis, which probably occurredbecause of the metastable nature of the two phases.Crystallography gave the definitive answer.
Perhaps the crucial step in solving the structures was theindexing of the two individual diffraction patterns. Thiswas only possible because of the very high angularaccuracy of the data. The peaks were essentially in exactlythe correct positions, allowing the stringent requirementfor agreement between observed and predicted peakpositions to be imposed in the indexing program. Anotherimportant factor in the structure solution was the reliableextraction of a large number of non-overlappingreflections. The high angular resolution available on theSwiss-Norwegian beam-line at the ESRF facilitates this butalso allows the identification of the small monoclinicdistortion since β is very close to 90° (β = 90.1338(5)°).Figure 2 shows the positions of the peaks from the twophases at low angle showing that the two patterns arecomprehensively entwined. In the end, despite misleadingevidence from the chemical analysis, the nature of themetastable compound was solved and the case of mistakenidentity was tracked down to two materials not one.REFERENCE1. H. F. Askew, P. N. Gates and A. S. Muir, J. Raman
Spectrosc., 1990, 22, 265.2. G. B. M. Vaughan, A. J. Mora, A. N. Fitch, P. N.
Gates and A. S. Muir, J. Chem. Soc., Dalton Trans.,(1999), 79.
Combined Rietveld- and Stereochemical-RestraintRefinement with High Resolution Powder
Diffraction Data Offers a New Approach forObtaining Protein-Drug Structures
R. B. Von Dreele, LANSCE-12 MS H805, Los AlamosNational Laboratory, Los Alamos, NM 87545 USA,
e-mail [email protected])INTRODUCTION
With the decoding of the human genome, the paradigm ofdrug discovery will change to one that is focused on thecreation and characterization of compounds that interactwith specific proteins under a wide variety of conditions.Current techniques require either the formation of protein-ligand single crystals of sufficient quality for x-raydiffraction work or the interpretation of nuclear magneticresonance (NMR) spectra. Growing single crystals ofproteins is an arduous process, requiring careful selectionof conditions to achieve success. A protein-structure studywould be completely halted by the inability to produce asingle crystal. Furthermore, single-crystal growth of aprotein-ligand complex often presents completely newchallenges compared with growing crystals of the protein
alone. NMR, meanwhile, is limited by spectrometerresolution to studies of proteins with a molecular weight ofno more than 25 kDa. The difficulties of studying protein-ligand complexes are best seen through a cursoryexamination of the Protein DataBase, which shows thatonly about 10% of the entries involve these complexes -see http://www.rcsb.org/pdb/PROTEIN POWDER DIFFRACTION
A new method for obtaining the structure of protein-drugcomplexes is suggested by the fact that the most easilyprepared form of these materials is a polycrystallinepowder consisting of many small crystals. This powder canbe formed over a wide range of conditions and time scalesquite unlike the restricted circumstances required forproducing large, single crystals. In many cases,polycrystalline powders can be readily made, but large,single crystals prove impossible to grow. High-resolutiondiffraction patterns from this polycrystalline material candisplay considerable sensitivity to subtle structural changestypified by shifts in the diffraction peak positions and bychanges in intensity. This sensitivity has been longrecognized by materials scientists, and over the past 30
Fig. 2 The low-angle part of powder diffraction pattern of themetastable compound (λ = 0.94718(1)Å). Peak positionsfor the 2 phases are shown: top Me2SBr4, a = 9.03811(7)Å,b = 11.65889(9)Å, c = 8.88592(7)Å, β = 90.1338(5)°; andbottom: Me2SBr2.5, a = 21.9676(2)Å, b = 11.1972(1)Å,c = 11.05307(8)Å.
17

years considerable progress has been made in extractingstructural information from powders. For example,virtually all our structural knowledge for high-temperaturesuperconductors comes from x-ray and neutron-powder-diffraction experiments. Superconducting materials readilyform powders but are not amenable to growth as large,single crystals. Many of them are also subject to phasechanges that would render single crystals useless fordiffraction experiments. Powder-diffraction experimentsand Rietveld refinement1, 2 have elucidated the nature ofthese phase changes and the very subtle structural changesthat accompany changes in their superconductingproperties with, for example, composition.
Until recently, protein crystal structures were consideredfar too complex for powder-diffraction experiments to giveany useful information. However, our recent work at theBrookhaven National Laboratory’s National SynchrotronLight Source has shown that proteins give extremely sharpx-ray powder-diffraction patterns that can be analyzed by acombined Rietveld and stereochemical restraint refinementto give structures of moderate resolution and, in one case,has led to the first solution of a protein structure frompowder-diffraction data.3,4 Protein lattice parametersdetermined from this powder data are perhaps two ordersof magnitude more precise than those obtained fromtypical single-crystal experiments.
For the study of protein-ligand complexes, powderdiffraction offers a distinct advantage over single-crystalwork in its complete immunity to crystal fracture and toany phase change that may accompany complex formation.The extreme sensitivity of diffraction patterns to changesin lattice parameters makes powder diffraction sensitive tocomplex formation. Furthermore, rapid formation of apolycrystalline precipitate allows possible exploration ofinitial complex formation under a wide variety ofconditions not accessible in slow-soaking or single-crystalgrowth experiments.
We recently explored this possibility in a study of thebinding of N-acetylglucosamine (NAG) to chicken egglysozyme.5 In this experiment a high-resolution powderdiffraction pattern of the protein alone was compared tothat of the complex, both obtained from identical solventmixtures (0.5M NaCl in pH 6.0/0.05M phosphate buffer).
The patterns showed a clear indication (Fig.1) of astructural change upon formation of the complex.Subsequent combined Rietveld and stereochemicalrestraint refinement revealed the position and orientation ofthe NAG ligand in the C-ligand binding site of lysozyme(Fig. 2). Interestingly, a similar comparison of materialsprepared from a pH 5.0 buffer showed no indication ofcomplex formation. This finding clearly demonstrates theusefulness of preparing polycrystalline protein/ligandmixtures under a wide range of conditions.FUTURE DEVELOPMENTS
High-resolution powder diffraction of proteins is still inits infancy, and the current molecular weight limit ofperhaps 50 kDa is largely due to the density of reflectionoverlaps in the diffraction pattern. These limits are stricterthan those of single-crystal diffraction, and there is nopresent way of solving protein structures ab initio frompowder data; but model building and molecularreplacement work quite well. Nonetheless, we can easilysee future developments of the method that will allowexamination of protein structures that exceed 100 kDa.
In particular, current data-collection technology scans thepowder-diffraction pattern a few points at a time over anarrow field of view. Consequently, data-collection timesat a synchrotron source are on the order of half a day. Theuse of high-resolution imaging technology and x-rayfocusing optics should improve this by a thousand-fold ormore, making it possible to use powder diffraction on alaboratory x-ray source to screen for the formation ofprotein-drug complexes and to determine their structures.REFERENCES
1. H.M. Rietveld, J. Appl. Cryst. 2, 65-71 (1969).2. “The Rietveld Method,” (Young, R. A., Ed.), (Oxford
University Press: New York, 1993).3. R.B. Von Dreele, .J Appl. Cryst. 32, 1084-1089 (1999).4. R.B. Von Dreele, et al. Acta Crystallographica D 56, 1549-
1553 (2000).5. R.B. Von Dreele, “Binding of N-acetylglucosamine to
Chicken Egg Lysozyme: A Powder Diffraction Study,” ActaCrystallographica D (submitted)
Fig. 1 A small segment of high-resolution, x-ray powder-diffraction patterns of lysozyme (bottom) and N-acetylglucosamine–lysozyme complex (top) bothprepared from 0.5M NaCl 0.05M pH 6.0 buffer. Thetwo patterns have been offset for clarity.
Fig. 2 View of the molecular surface of lysozyme with aspace-filling model of the bound N-acetylglucosamine.
18

On the reliability of Rwp in structure predictionLubomír Smrcok, Marián Durík
Institute of Inorganic Chemistry, Slovak Academy ofSciences, SK-842 36 Bratislava, Slovak Republic
E-mail:[email protected]
INTRODUCTION
The determination of medium-sized molecular (~40atoms) crystal structures from powder data still remainsa challenge [1,2]. The reduced amount of information thatmay be extracted from a powder pattern in the form oftraditional structure factors often makes the process ofcrystal structure solution rather difficult and ambiguous. Ananother method that can be used for crystal structuredetermination is structure prediction by potential energyminimisation. Various techniques have been suggested [3],but in general, structure prediction can be divided into foursteps:
(i) building of the molecular model(ii) generation of possible crystal structures by energy
minimisation(iii) ranking the structures using a suitable criterion and
optionally(iv) structure refinement via the Rietveld method.
Recently we have succeeded in predicting the crystalstructures of three monosaccharides (all around ~38 atomsper molecule) [4,5]. Two of the compounds were teststudies (the structures were already known from singlecrystal data) in which the behaviour of different force fieldsand atomic charges were tested. However, the structure ofthe third was not known in advance. In all our studies, wehave applied criteria of fit based on both potential energyevaluation and on Rwp from subsequent Rietveldrefinements (Rwp).
RESULTS AND DISCUSSION
In all test studies it was found that the correct structuresalways gave the lowest potential energy, E. Though theRwp values have in general reflected the trends in energies,
some low values corresponding to unrealistic energies havealso been observed. However, due to empirical nature ofthe force fields and a certain arbitrariness in the calculationof atomic charges, the E values could not be taken to bedefinitively accurate. Some predicted structures were,herefore, cross-checked by refinements of the predictedmodels against the observed single crystal data. Fig.1shows a typical variation of Rwp value against calculatedenergy.
The bullet positioned near the intersecting dashed lines inFig. 1 represents the correct structure. The arrowed point,on the other hand, highlights a controversial result. The Rwp
value is quite acceptable but the energy is too high (thoughit must be noted that neither the cell nor the atomicparameters were refined). To rationalise this situation, alltrial structures were input into SHELXL97 [6] and refinedagainst the corresponding single crystal data set. Theatomic coordinates were, of course, fixed. The results ofsuch a cross-check are shown in Fig. 2.
It is seen that the lowest Rwp values always correspond tothe lowest R1 factors (as defined in SHELX97), while thesecond best Rwp has a misleadingly low value. In otherwords, despite the approximate nature of the energyevaluation, it has clearly revealed an inaccurate structure[7].
Another set of predicted structures [5] were used asstarting models for rigid-body Rietveld refinements to seeif powder data alone could be used to enable the predictedmodel to jump out of a supposed local minimum. Simulatedstructures were divided into six sets, which covered thecrystal structures with identical or very similar Rwp values.A representative structure of each set was then refinedusing rigid body Rietveld technique [8]. The generalstrategy was such that in the first step, only the profilewidth parameter, W, the scale factor and zero-point wererefined. When a refinement of profile parametersconverged, two translation parameters (tx and ty) were alsoallowed to vary. In the last step also three rotationalparameters were included in the refinement.
Fig. 1 Rwp vs. E for charge type/force field pair W/E for amonoclinic monosaccharide RKSA1 [4]. The dashedlines indicate the expected values of E and Rwpcalculated using the atomic coordinates from singlecrystal data. Bullets represents individual structures (ortheir groups in the case of having similar E/ Rwp values)are connected by a line for sake of clarity.
Fig. 2 A comparison of the values of Rwp (filled circles) andR1 (small diamonds) calculated by SHELXL97 for trialstructures of RKSA1. N – structure’s sequential numberwithin the set. Crystal structure giving the second bestRwp is arrowed.
19

The results can be summarized as follows. The weightedprofile R-factor values of crystal structures belonging to setone (those with the lowest values of Rwp and E) remainedalmost constant during refinement at ~15 %. On the otherhand, the values of Rwp of crystal structures of the other setschanged much more. After relaxation of the translationparameters Rwp decreased remarkably, but never below15%. However, when rotation of molecule described byEuler angles was refined, value of Rwp increaseddramatically and the final Rwp had in one case (set five)extremely high values of greater than 100%. Interestingresults were obtained during refinement of crystal structurebelonging to the set six.
Rwp value first dropped after refinement of translationparameters from 61 % to ~16% and after relaxation of therotation parameters increased to a very encouraging ~17%.
Unfortunately, the decrease of Rwp was accompanied by anincrease in energy from an initial value of –37 kJ/mol-1 to+284 kJ/mol-1. Inspection of the molecular packingrevealed very short intermolecular distances.REMARK
We have documented that Rwp and most probably all Rwp
based criteria may in some situations lead to erroneousconclusions. A possible remedy for this problem is thesimultaneous calculation of molecular and/or crystalenergies. Unfortunately, such a calculation even using asimple procedure is much more time consuming thanstructure simulations based on diffraction data alone.However, these simulations need not be very sensitive tosubtle details such as a wrong dihedral angle, which leads,or example, to a collision of hydrogen atoms. On the otherhand, such a “misunderstanding” can be easily detected byany coulombic term included in the energy calculation.REFERENCES1. K.D.M. Harris, M. Tremayne Chem. Mater. 8, 2554-
2570 (1996).
2. W.I.F. David, K. Shankland, N. Shankland Chem.Commun. 931-932 (1998).
3. J.P.M. Lommerse, W.D.M. Motherwell, H.L. Ammon,J.D. Dunitz, A. Gavezzotti, D.W.M. Hofmann, F.J.J.Leusen, T.M. Mooij, S.L. Price, B. Schweizer, M.U.Schmidt, B.P. van Eijck, P. Verwer, D.E. Williams,Acta Cryst. B56, 697-714 (2000).
4. L. Smrcok, M. Durík, D. Tunega Z. Kristallogr. 215,254-259 (2000).
5. M. Durík, L. Smrcok Z. Kristallogr. (In press.) (2001).
6. G.M. Sheldrick SHELXL97. University of Göttingen,Germany (1997).
7. L. Smrcok, M. Durík Z. Kristallogr. 215, 384-385(2000).
8. J. Rodriguez-Carvajal Fullprof 3.5, LLB (Privatecommunication) (1998).
Ab initio structure determination ofoligopeptides from powder diffraction dataK D M Harris, R L Johnston, E Tedesco & G W Turner
School of Chemistry, University of Birmingham,Edgbaston, Birmingham B15 2TT, United Kingdom
INTRODUCTION
An intrinsic limitation of single crystal X-ray diffractionis the requirement to prepare a crystal of sufficient size,quality and stability. When appropriate single crystalscannot be obtained, it is necessary to tackle structuredetermination using powder diffraction data[1]. For thesereasons, we are focusing on the development,implementation and optimization of new techniques forstructure solution from powder diffraction data, withemphasis on tackling the specific challenges encounteredfor molecular solids. Our methods are based on a direct-space strategy[2,3] in which a hypersurface defined by theprofile R-factor (Rwp) is searched using Monte Carlo[3] orGenetic Algorithm (GA)[4–7] techniques. In this paper, wedescribe recent progress in the application of our GAtechnique in the structure determination of oligopeptides.
Clearly, knowledge of the structural properties andinteractions in model oligopeptide systems can yieldfundamental insights concerning structural properties ofpolypeptide sequences in proteins.
In the direct-space strategy, a large number of trialstructures are generated in direct space, and the "quality" ofeach structure is assessed by comparing the powderdiffraction pattern calculated for the structure and theexperimental powder diffraction pattern (in our work, thiscomparison is made using the weighted profile R-factorRwp). In effect, the direct-space strategy involves searchingthe Rwp(Γ) hypersurface to find the structure of lowest Rwp,where Γ represents the set of variables that define thestructure. In the GA method[4–9], a population of trialstructures is allowed to evolve subject to the rules andoperations that govern evolution in biological systems.Initially, the population comprises a set of randomlygenerated structures. For the case with one molecule in theasymmetric unit, each structure is specified by the position{x, y, z} and orientation {θ, φ, ψ} of the molecule in theunit cell, and the molecular geometry is specified by a setof variable torsion angles {τ
1, τ
2, ..., τn}. These variables
Fig. 3 Rwp on E dependence for charge type/force field pairW/M for six sets of trial structures of monosaccharideRKS2 [5].
20

represent the "genetic code" (Γ) that uniquelycharacterizes each member of the population. The quality("fitness") of each structure depends on its value of Rwp Thepopulation is allowed to evolve through several generationsby means of mating, mutation and natural selection. Inmating, a number of pairs of structures ("parents") areselected, and new structures ("offspring") are generated byswapping genetic information between the two parents. Inmutation, some structures are selected from the populationand random changes are made to parts of their genetic codeto create mutant structures. In natural selection, only thebest structures are allowed to pass from one generation tothe next generation. After a sufficient number ofgenerations, the structure in the population with lowest Rwp
should be close to the correct crystal structure. In our mostrecent implementation[8], each new structure generated inthe GA calculation is subjected to local minimization of Rwp
with respect to the variables in Γ, and only these minimizedstructures are used subsequently.EXAMPLES
Here we give two examples of structure solution ofoligopeptides, Phe–Gly–Gly–Phe and Piv–Pro–Gly–NHMe. Powder X-ray diffraction data were recorded atambient temperature on a laboratory diffractometer(Siemens D5000; CuKα1; transmission). The unit cells andspace groups were determined directly from the powderdiffraction data. The GA structure solution calculationswere carried out using our program EAGER[10], andRietveld refinement was carried out using GSAS[11]. TheGA structure solutions for Phe–Gly–Gly–Phe[12] (Fig. 1)and Piv–Pro–Gly–NHMe[13] involved 11 and 6 variabletorsion angles respectively, with all peptide groups fixed asplanar units with O–C–N–H torsion angle of 180°. Themolecules were constructed using standard bond lengthsand angles.
The structure of Phe–Gly–Gly–Phe (space group P41)comprises ribbons that run along the c-axis. Adjacentmolecules in these ribbons interact through three N–H...Ohydrogen bonds (Fig. 2), forming a direct analogue of ananti-parallel β-sheet. Intermolecular N–H...O hydrogenbonds involving the end-groups of the oligopeptide chainsgive rise to two inter-twined helical chains running alongthe 41 screw axis. In the structure of Piv–Pro–Gly–NHMe(space group P1), the molecule is found to adopt a Type IIβ-turn conformation stabilized by an intramolecularhydrogen bond between the C=O group of Piv and the N–Hgroup of NHMe (Fig. 3). Adjacent molecules along the c-axis form chains through intermolecular N–H...O bonds.
Our successful determination of the crystal structures ofthe oligopeptides Phe–Gly–Gly–Phe and Piv–Pro–Gly–NHMe illustrates the current scope and potential oftechniques for the determination of molecular crystalstructures from powder diffraction data, and provides
promise for the future application of these techniques tosolve structures of increasing complexity in this field.ACKNOWLEDGEMENTS
We are grateful to EPSRC, the University of Birmingham,Wyeth-Ayerst plc and Ciba Specialty Chemicals forfinancial support, and to Professor P Balaram for valuablediscussions and for supplying the sample of Piv–Pro–Gly–NHMe.REFERENCES
1. K.D.M. Harris, M. Tremayne, B.M. Kariuki, Angew. Chemie,Int. Ed., 2001, 40, 1626
2. J.M. Newsam, M.W. Deem, C.M. Freeman, Accuracy inPowder Diffraction II: NIST Spec. Pub. 846, pp. 80-91, 1992
3. K.D.M. Harris et al, J. Am. Chem. Soc., 1994, 116, 35434. B.M. Kariuki, et al, Chem. Phys. Lett., 1997, 280, 1895. K.D.M. Harris et al, J. Chem. Res. (S), 1998, 3906. K.D.M. Harris et al, Acta Cryst., 1998, A54, 6327. B.M. Kariuki et al, Angew. Chemie, Int. Ed., 1999, 38, 8318. G.W. Turner et al, Chem. Phys. Lett., 2000, 321, 1839. K. Shankland, W.I.F. David, T. Csoka, Z. Krist., 1997, 212,
55010. S. Habershon et al., EAGER, University of Birmingham, 200111. A.C. Larson, R.B. Von Dreele, Los Alamos Lab. Report No.
LA-UR-86-748, 1987 .12. E. Tedesco, et al, Angew. Chemie, Int. Ed., 2000, 39, 448813. E. Tedesco, K.D.M. Harris, R.L. Johnston, G.W. Turner,
K.M.P. Raja, P. Balaram, Chem. Commun., in press
N C
C
C
O
N C C
O
N C
O
N C
C
C
O
OC H
H2
2H HHH
H
H2
H2 H2Hχ
11
χ1
2
χ41
χ4
2
ψ1
2φ
ψ2
φ3
ψ3
φ4
ψ4
Fig. 1 Molecular structure of Phe–Gly–Gly–Phe, showing thevariable torsion angles in the GA structure solution calculation.
Fig. 2 Interactions between adjacent molecules in the crystalstructure of Phe–Gly–Gly–Phe (viewed ⊥ to the c-axis)illustrating the formation of an anti-parallel β-sheetarrangement. H atoms are omitted for clarity.
Fig. 3 Molecular geometry of Piv–Pro–Gly–NHMe in thecrystal structure, with the intramolecular hydrogenbond shown as the dashed line.
21

Correlating crystal structure with the physicalproperties of pharmaceutical compounds
N Shanklanda, W I F Davidb, K Shanklandb,A Kennedyc, C S Framptond and A Florencea
a Department of Pharmaceutical Sciences,University of Strathclyde, Glasgow, G4 0NR, UK
E-mail: [email protected] ISIS Facility, Rutherford Appleton Laboratory,
Chilton, Didcot, Oxon., OX11 0QX, UKc Department of Pure and Applied Chemistry,
University of Strathclyde, Glasgow, G1 1XL, UKd Roche Discovery Welwyn, Welwyn Garden City, Herts.,
AL7 3AY, UKINTRODUCTION
The active ingredients that are used in the formulation ofmedicinal products are widely manufactured in the form ofpolycrystalline powders. The existence of differentcrystalline (both polymorphs and solvates) and amorphousforms of these materials can have significant effects uponthe processing, manufacture and stability of medicinalproducts. Moreover, new forms can often appearunpredictably in batches of raw materials. Clearly, thephysical and chemical properties of a pharmaceuticalcompound are correlated with its crystal structure and so adetailed crystallographic understanding of these materials isimportant. One topic of particular interest is the reversibletransformation between hydrated and anhydrous forms,especially where the transformation is associated withunwanted changes in chemical and physical properties.
The starting point for this study is a dihydrate ofzopiclone (Fig. 1), a non-benzodiazepine hypnotic drugused in the treatment of insomnia. The stimulus for ourinvestigation was this: knowing that the compound exists inmore than one crystalline modification, one of which is adihydrate, could we determine the crystal structure of theanhydrous material produced on heating the dihydrate? Ifso, might we be able to observe a relationship between thetwo structures and thus gain some insight into the structuralmechanism of the transformation?
Fig. 1 Zopiclone
TRANSFORMATIONS OF ZOPICLONE
The design of this particular experiment was based onearlier ‘pathfinding’ explorations of the zopiclone systemthat suggested a reversible solid-state dihydrate ↔anhydrous transformation. This transformation wasobserved using a laboratory X-ray diffractometer with aflat-plate powder sample being subjected to: (i)temperatures in the range 25-175°C; (ii) high and lowhumidity environments.
While we knew the structure of the “ubiquitous dihydrate”from single crystal data, we were unable to obtain single
crystals of the anhydrous form. The key experimentalissue, therefore, centred on maximising our chances ofsolving the crystal structure of the anhydrous form from asharply diffracting polycrystalline sample produced simplyby heating the dihydrate. With a combination of high beamintensity at short wavelength, multicrystal detector and easeof variable-temperature work, BM16 at the ESRF is anideal choice for such an experiment.EXPERIMENTAL
A 1 mm capillary was filled with a sample of zopiclonedihydrate, mounted on the BM16 diffractometer and adiffraction pattern recorded (λ = 0.8Å) for the purpose ofstructure identification. The pattern indexed to amonoclinic unit cell with dimensions a = 16.482 Å, b =7.146 Å, c = 17.401 Å, β = 109.805°, V =1928 Å3 at 298 K,confirming the identity of the sample to be essentially‘pure’ zopiclone dihydrate.
Although the structure of the dihydrate had beendetermined previously from single-crystal data, we decidedto collect around one hour of diffraction data and thenceattempt to solve the structure using DASH, as part of ouron-going testing of the program. Using an internal
coordinate description of the zopiclone molecule (non H-atoms only) derived from the published structure of theorthorhombic form, and approximating the water moleculesby inputting two independent O-atoms, it provedstraightforward to solve the crystal structure. An overlay ofthe structures obtained from the powder and the single-
N
NN
O NCl
O
N
NCH3
O
2.2 2.4 2.6 2.8 3 3.2 3.4 3.6
DIHYDRATE
ANHYDROUS
Fig 3. The transformation of zopiclone dihydrate tomonoclinic anhydrous zopiclone on heating
Fig. 2. Heating a capillary packed with zopiclonedihydrate transforms the structure to monoclinicanhydrous zopiclone
22

crystal data confirmed the accuracy of DASH solution.Next, the end of the capillary containing the dihydrate
sample was carefully broken off to expose the powder tothe stream of warm nitrogen from a Cryostream mountedalong the axis of the capillary (Fig. 2.). The temperature ofthe gas stream was slowly raised from ambient to 370 Kwhilst the diagnostic region of the diffraction pattern (2 -4.5° 2θ) was scanned repeatedly.
The conversion of the dihydrate to an anhydrous form waseasily monitored by observing the gradual decrease inintensity of the dihydrate reflection at ~2.95°, and thesteady increase in intensity of a reflection at ~3.25°,attributable to the anhydrous form (Fig. 3).
At the point where there was practically no observabledihydrate, the temperature was decreased to 325 K, anddata collected for around three hours. The choice oftemperatures in this particular experiment was based on the‘pathfinding’ exploration of the zopiclone systemmentioned earlier in the Introduction.
The pattern indexed to a monoclinic unit cell withdimensions a = 15.199 Å, b = 7.150 Å, c = 17.651 Å, β =111.21°, V = 1788 Å3 at 325 K. The crystal structure of thismonoclinic anhydrous structure was then solved usingDASH, inputting the same internal coordinate descriptionthat had been used to solve the dihydrate structure. Thesolved crystal structure gave a good fit to the diffractiondata, and confidence in the result was increased by the factthat no unfavourable contacts were visible within thestructure after addition of hydrogens.
Armed with both the dihydrate and anhydrous crystalstructures, it is possible to develop a clear insight into thenature of hydration and dehydration in this material. Thefirst thing that we noticed was that the molecularconformations for both materials were essentially identical.This was surprising since the dihydrate structure showed asubstantial amount of hydrogen bonding between the waterand zopiclone molecules. In the anhydrous form, thehydrogen bonding is absent and the lattice is held togetherby van der Waals forces. Accordingly, one might expectrelaxation of the molecular shape to accommodate thesefundamental changes in bonding. A closer look at the twocrystal structures revealed further, more profound structuralsimilarities. The zopiclone molecules arrange themselves inbilayer sheets in both materials (with the water molecules
in the dihydrate sandwiched between) and these sheets ofzopiclone molecules are effectively unchanged in thedehydration process. This close structural relationship isshown in Fig. 4, where we have overlaid the bilayers ofboth structures – the register is almost exact, not only inprojection. This gives a clear insight into the dehydrationprocess. Whole sheets of the zopiclone structure remainunchanged as the water molecules are co-operativelyremoved from the crystal structure. The process is facileand thus energetically straightforward; the principalstructural change in the dehydration process (apart from theloss on water) is the slipping of each bilayer by
approximately half a unit cell perpendicular to the bilayer.We have thus established directly from these experiments
that the reversible transformation between the twostructures involves relatively minor shifts between therespective crystal packing arrangements. This is certainlyconsistent with the ease of water loss from the dihydrate,and the highly hygroscopic nature of the resultantanhydrous structure. Hygroscopicity can lead to problemsof tablet weight gain and softening, and the work presentedhere demonstrates the power of structure elucidation in‘troubleshooting’ such processing problems.
EXPO: New developments
Angela Altomare a, Carmelo Giacovazzo a,b, AnnaGrazia Giuseppina Moliterni a, Rosanna Rizzia
aIRMEC c/o Dipartimento Geomineralogico,Università di Bari, Campus Universitario, ViaOrabona 4, 70125 Bari , Italy, and bDipartimentoGeomineralogico, Università di Bari, CampusUniversitario, Via Orabona 4, 70125 Bari , ItalyCorrespondence e - mail: [email protected]
INTRODUCTION
Ab-initio crystal structure solution from powderdiffraction data is not a straightforward process. Peakoverlap, background noise and preferred orientation can allcontribute to the low accuracy of integrated intensity
estimates extracted from the powder diffraction pattern. Asa result, the straightforward application of Direct Methodsfor carrying out the phasing process may fail. EXPO [1] isa program that aims to overcome these problems and isbased upon the Le Bail[2] extraction of integratedintensities (first stage) followed by Direct Methodsstructure solution (second stage). It is based on a revisedtwo-stage approach: information becoming available duringthe structure solution stage can be exploited in theextraction step for improving the structure factor moduliestimates and, consequently, the solution process itself. Thefollowing information can be exploited:
• the presence of pseudo translational symmetry [3];
• the positivity condition of the electron density map inthe direct space [4];
Fig. 4 Overlaid structures of the anhydrous zopiclone (left) andzopiclone dihydrate (right). The zopiclone bilayer in bothstructures is essentially identical.
23

• the positivity condition of the electron density map inthe reciprocal space [5];
• a located partial fragment [6].NEW STRATEGIES
New strategies for overcoming the difficulties in thestructure solution process and for providing a completemodel have been developed and introduced in EXPO. Theywill be available for the crystallographic community infuture versions of the program. In this article, we give abrief description of our developments.A critical preliminary step for the crystal structure solutionis the indexing of the powder pattern. The programTREOR90 [7] has been combined with an efficient peaksearch algorithm and optimised [8] in such a way that: a)the coded crystallographic decisions are more suitable tothe practical cases; b) the graphical interface makes theprogram very user friendly; c) the refinement of theselected unit cell is automatically executed. The modifiedversion, called N-TREOR, has been integrated into EXPO,which is therefore able to carry out the structure solution byusing as minimal information only the observed diffractionpattern.Frequently the structure model provided by Direct Methodsis incomplete. This is particularly true in case of a heavyatom structure for which the location of the heavy atoms isimmediate but the light atom positions are hardlyrecognised. If the information about the located cations andthe relative polyhedra is available, the new POLPOprocedure exploits it for building the missing anions [9].POLPO needs the information about the type ofcoordination (tetrahedral or octahedral) and the expectedbond distances (a tolerance parameter is required also). Theautomatic analysis of the connectivity of the located cationsis carried out. The procedure, based on the Monte Carlotechnique, generates different feasible models, all obeyingthe prior information. The model corresponding to the bestfit between the observed and calculated profiles is selected.POLPO is able to provide the complete solution also incase of complicated structures like zeolites.The tendency of the Le Bail formula at equipartioning theintensity of a group of reflections strongly overlappedproduces a bias in the integrated intensity estimate. Theintensities of overlapping reflections are affected by errorsso compromising the phasing process by Direct Methods. Avery recent procedure aimed at breaking the equipartitiontendency of the Le Bail technique and at modifying theintensity of both the strictly and the loosely overlappingreflections has been developed [10]. Several attempts ofrandom partition of the intensity of each cluster ofoverlapping reflections are generated. The trialcorresponding to the best profile fit in the range of thecluster is selected and subjected to the Le Bail algorithmfor obtaining a feasible set of intensity estimates. The useof the intensities extracted by the random procedure in theDirect Methods lowers the phase error and increases theprobability of solving the crystal structure.The quality of the electron density map obtained at the endof the Direct Methods procedure depends on severalfactors: the uncertainty about the structure factor moduli,the phase error and the amplitude truncation effect.
Consequently, the values of the peak intensities are oftendistorted and peaks themselves misplaced with respect tothe correct positions. The technique of peak labellinginterms of atomic species according to the peak intensitymay fail. On the other hand, the peak labelling is anecessary requirement both in the structure refinement andin those procedures (e.g. POLPO) exploiting the location ofsome atoms. A new algorithm has been developed [11] inorder to improve the labelling by using the following priorinformation: 1) the heavy atomic species present in the unitcell; 2) for each heavy atomic species, the number of atomsin the asymmetric unit; 3) the expected heavy-heavy atomdistance and the expected number of heavy atomssurrounding a given heavy atom; 4) the expected heavy-light atom distance.In spite of the progress in experimental techniques and inthe strategies for optimising the estimates of the powderintegrated intensities, the phasing process by DirectMethods may be characterised by large errors. A procedurehas been recently introduced in EXPO devoted toimproving the structure factor phase estimate and providinga more reliable solution [12]. It is based on the cycliccombination of an Electron Density Modification procedureand Fourier map calculations in such a way that the phaseinformation is improved and extended to a sufficientlylarge number of reflections, so facilitating the structurerecovery.
The new EXPO developments described in the articlehave been successfully tested on a large number ofstructures. They represent efficient tools when thetraditional two-stage approach fails and an important set ofmethodologies for improving crystal structure solutionfrom powder data.REFERENCES
[1] Altomare, A., Burla, M. C., Camalli, M., Carrozzini, B.,Cascarano, G., Giacovazzo, C., Guagliardi, A., Moliterni, A.G. G., Polidori, G. & Rizzi, R. (1999). J. Appl. Cryst. 32, 339-340.
[2] Le Bail, A., Duroy, H., Fourquet, J. L. (1988). Mater. Res.Bull. 23, 447-452.
[3] Altomare, A., Foadi, J., Giacovazzo, C., Guagliardi, A. &Moliterni, A.G.G. (1996). J. Appl. Cryst. 29, 674-681.
[4] Altomare, A., Foadi, J., Giacovazzo, C., Moliterni, A.G.G.,Burla, M. C. & Polidori, G. (1998). J. Appl. Cryst. 31, 74-77.
[5] Carrozzini, B., Giacovazzo, C., Guagliardi, A., Rizzi, R.,Burla, M. C. & Polidori, G. (1997). J. Appl. Cryst. 30, 92-97.
[6] Altomare, A., Giacovazzo, C., Guagliardi, A., Moliterni,A.G.G. & Rizzi, R. (1999). J. Appl. Cryst. 32, 963-967.
[7] Werner. P.-E., Eriksson, L. & Westdahl, M. (1985). J. Appl.Cryst. 18, 367-370.
[8] Altomare, A., Giacovazzo, C., Guagliardi, A., Moliterni,A.G.G., Rizzi, R. & Werner, P.-E. (2000). J. Appl. Cryst. 33,1180-1186.
[9] Altomare, A., Giacovazzo, C., Guagliardi, A., Moliterni, A. G.G. & Rizzi, R. (2000). J. Appl. Cryst. 33, 1305-1310.
[10] Altomare, A., Giacovazzo, C., M., Moliterni, A. G. G. &Rizzi, R. (2001). J. Appl. Cryst. Submitted.
[11] Altomare, A., Giacovazzo, C., Ianigro, M., Moliterni, A. G.G. & Rizzi, R. (2001). J. Appl. Cryst. Submitted.
[12] Altomare, A., Giacovazzo, C., M., Moliterni, A. G. G. &Rizzi, R. (2001). In preparation.
24


NNNN eeee wwww ssss ffff rrrr oooo mmmm tttt hhhh eeeeIIII nnnn tttt eeee rrrr nnnn aaaa tttt iiii oooo nnnn aaaa llll CCCCeeee nnnn tttt rrrr eeee ffff oooo rrrr DDDD iiii ffff ffff rrrraaaa cccc tttt iiii oooo nnnn DDDD aaaa tttt aaaa
(((( IIII CCCC DDDD DDDD ))))12 Campus Boulevard Phone: +610.325.9814Newtown Square, PA 19073-3273 Fax: +610.325.9823U.S.A. E-mail: [email protected]
http://www.icdd.com
Dr. Ron Jenkins Announces His RetirementDr. Ron Jenkins, Executive Director of the ICDD,announced his retirement after sixteen years of servicewith the International Centre for Diffraction Data (ICDD).Dr. Jenkins held the position of Executive Director for thepast five years.
Dr. Jenkins has served the ICDDin many capacities. He was amember of the Board ofDirectors in 1984, served asPrincipal Scientist from 1985 to1996, and from 1996 to 2001acted as the Secretary and
Executive Director of the ICDD. As Principal Scientist, hedirected the effort to convert the Powder Diffraction File tostate of the art CD-ROM technology. He is recognized forthe establishment of the ICDD educational programs,which over a period of ten years have provided basicinstruction on powder diffraction and X-ray fluorescenceto over 2000 students throughout the world.
Along with Deane K. Smith and Ron Anderson, Dr.Jenkins created the journal, Powder Diffraction, and servedas the first editor. In 1992, he organized the initial meetingof the Pacific International Conference on X-ray AnalyticalMethods that brought together scientists from all parts ofthe world. Under his direction, the membership of theICDD has increased significantly, making the ICDD a trulyinternational organization. The ICDD’s Grant-in-AidProgram has also been a benefactor of Dr. Jenkins’ leader-ship. Today, the ICDD awards over 50 grants-in-aid to colleges and universities worldwide. Dr. Jenkins is alsowell known for his long and dedicated association with theDenver X-ray Conference, a program that the ICDD hasadministered since 1998.
Julian Messick, Secretary and General Manager of theICDD from 1983 to 1994, is serving as interim ExecutiveDirector.
ICDD Annual Meetings HeldThe ICDD Annual Meetings were held during the week of12–16 March 2001.
The following Committees and Subcommittees met:
Committees:❖Awards ❖Finance
❖Grant-in-Aid ❖Technical
❖Long Range Planning
Subcommittees:❖Ceramics ❖Database
❖Education ❖Electron Diffraction
❖High Pressure/Temperature Diffraction
❖Marketing ❖Metals & Alloys
❖Minerals ❖Organic & Pharmaceutical
❖PDF Editorial Staff ❖Polymers
❖X-ray Diffraction Methods ❖X-ray Fluorescence
Minutes of the various committee and subcommittee meet-ings are posted on the ICDD web site as they becomeavailable.
Regional Co-chairs were recognized for their service to theICDD during their recent terms, expiring in March.Regional Co-chairs, serving the term 2001–2003, are asfollows:
Region Co-chair
China Shao-Fan LinEastern Pacific Rim Nubuo IshizawaEngland David TaylorEuropean Community David RafajaNorth America James A. KadukRussia Evgueni AntipovSouth America José Miguel Delgado
Southeast Asia Brian H. O’Connor

Ludo Frevel Crystallography ScholarshipRecipients AnnouncedIn the fall of 2000, applications arrived at the ICDD fromall over the world for the 2001 Ludo Frevel Crystallogr-aphy Scholarships. Six outstanding applicants were select-ed by the Scholarship Committee to receive this awarddesigned to honor graduate students with major interest incrystallography. The ICDD congratulates the followingaward recipients:
Christina DeWitt, Oklahoma Medical ResearchFoundation, Oklahoma City, Oklahoma, U.S.A.
Research title – “Determining the Structures of anFc Derived from a Human IgG1 (�) Antibody”
James Lettieri, The Pennsylvania State University,University Park, Pennsylvania, U.S.A.
Research title – “Ferroelectric Anisotropy andIntegration of SrBi2Ta2O9”
Maxim V. Lobanov, Moscow State University, Moscow,RussiaResearch title – “Structural Studies of Low-
Dimensional Magnetic Mn Oxides as PossibleCMR Materials”
Christine McCracken, University of Manitoba,Winnipeg, Manitoba, CanadaResearch title – “The Crystallography and Chemistry
of Tourmaline”
Jennifer Stone, Oregon State University, Corvallis,Oregon, U.S.A.Research title – “Structural Studies of High-Power
Optical Materials”
Meitian Wang, University of Alberta, Edmonton,Alberta, CanadaResearch title – “Developing Structural Principles
for New Ternary Metal-Rich Pnictides”
2001 XRF & XRD Clinics are a Success!The ICDD hosted another successful season of clinics.
The XRF clinics wereheld in April/May whilethe XRD clinics wereheld in June. The clinicsoffer both novices andprofessionals in the fieldof X-ray analysis anopportunity to learn
techniques from the experts as well as the opportunity to
discuss field experiences with peers.
The XRF faculty included: John Anzelmo and Larry Ariasof Bruker AXS, Inc.; Richard Bostwick of Spex CertiPrep;John Croke (Emeritus), Philips Analytical; Mary AnnZaitz of IBM Microelectronics; and Ron Jenkins(Emeritus), ICDD. In 2001, we welcomed Larry Creasy ofTitanium Metals Corp. and Stephen Williams of PhilipsAnalytical to the XRF team of instructors.
The instructors for the XRD clinics were: Tom Blanton ofEastman Kodak Co.; Harlan Clark, John Faber, RonJenkins (Emeritus), Suri Kabekkodu, W. Frank McClune,Fangling Needham, and Charles Weth of the ICDD; andGerald G. Johnson, Jr. (Emeritus), Earle Ryba and SusanQuick of The Pennsylvania State University. New to thefaculty in 2001 were Mark Rodriguez of Sandia NationalLaboratories and Bernie Squires of Rigaku/USA, Inc.
50th Anniversary of the Denver X-ray Conference
Steamboat Springs, Colorado will be the siteof the 50th Anniversary celebration of theDenver X-ray Conference, 30 July through 3
August 2001. The program will highlight the historicalaspects of X-ray analysis and the Conference over the lastfive decades.
IXAS NewsThe ICDD, the International X-ray Analysis Society(IXAS), and the Denver X-ray Conference OrganizingCommittee recently signed a Memorandum of Under-standing. This memorandum sets forth the guidelines forthe cooperation among the three groups to serve the X-rayanalysis community by successfully conducting theDenver X-ray Conference on an annual basis.
The ICDD will also provide web site services to the IXAS,namely developing, managing, and maintaining the IXASweb site.
ISO 9001 Certification The ICDD is proud to announce its recent ISO 9001Certification. This certification assures satisfaction to ourcustomers through quality planning, internal consistency,process control, and self-assessment. The scope of theICDD’s registration is centralized assembling, recordingand publication of X-ray diffraction data for the use by sci-entific institutions worldwide and to provide technicalforums for promoting X-ray diffraction techniques.

Computer CornerUpdates on Freely Available Crystallographic and PowderDiffraction Software(Suggestions, corrections, comments appreciated;especially if you know of new program features, programupdates and announcements that should be mentionedhere).
Lachlan M. D. CranswickResearch Associate, GeochemistryLamont-Doherty Earth Observatory of ColumbiaUniversityPO Box 1000, 61 Route 9WPalisades, New York 10964-1000 USAE-mail: [email protected]: http://www.ldeo.columbia.edu/~lachlan/ andhttp://www.ccp14.ac.uk
PULWIN PXRD ANALYSIS FOR WINDOWS BY SERGIOBRUCKNER
A new program for the analysis of powder patterns isPULWIN for Windows which can perform DFT (discreteFourier filtering), background determination using a Robustsmoothing procedure, unit cell refinement, Calibration ofINEL PSD data, etc. Pulwin can be downloaded fromftp://ftp.cc.uniud.it/DEBVIN/ and CCP14 mirrors.
Fig 1: PULWIN performing background determination using aRobust smoothing procedure.
NIST TEXTURE PLUS FOR WINDOWS BY MARK VAUDIN
NIST Texture Plus for Windows has a variety offunctionality relevant to texture analysis. It calculates thetexture profile of a specimen using two x-ray scansobtained from the specimen using a powder x-raydiffractometer by obtaining a scan of a Bragg peak fromthe textured planes and a second rocking curve scan, withthe diffractometer set at the angle of the Bragg peak. It canbe downloaded fromhttp://www.ceramics.nist.gov/webbook/TexturePlus/texture.htm and the CCP14 UK web mirror.
Fig 2: NIST Texture Plus Interface.
WEB BASED TUTORIALS ON MAUD FOR JAVAMATERIALS ANALYSIS RIETVELD BY LUCA LUTTEROTTI(MAC, WINDOWS AND UNIX)
Web based tutorials are viewable for using the MAUD forJava materials analysis Rietveld software. Tutorialsincluding such topics as "Performing an X-ray quantitativeanalysis in seven easy steps!" and “Using Maud to IntegrateDebye-Scherrer (or Guinier) film and Image Plate Data”.These can be accessed via CCP14 mirrors andhttp://www.ing.unitn.it/~luttero/maud/tutorial/index.html.
Fig 3: A screen dump from one of the on-line MAUD tutorials. In this case using MAUD to integrate film data.
UPDATED CRYSFIRE FOR DOS/WINDOWS POWDERINDEXING SUITE BY ROBIN SHIRLEY
As has been mentioned in previous articles, Crysfire is anindexing suite that links into 8 different indexing programs:ito, treor, dicvol, taup, kohl, lzon, fjzn and losh. A newfeature in Crysfire is the rescale/unscale feature that allowsthe user to easily rescale the peak data into an expected cellvolume range most likely to solve from indexing programsthat work best solving cells around 500 - 1500 A**3(rescaling is achieved by changing the wavelength). Afterindexing, the “unscale” program can be applied to theCrysfire summary file to convert found trial cells back totheir correct unscaled values.
Rescaling was the method used by Bob von Dreele andco-workers to recently index a protein structure frompowder diffraction data; which was then also solved andrefined. (R. B. Von Dreele, P. W. Stephens, G. D. Smith and28

R. H. Blessing, "The first protein crystal structuredetermined from high-resolution X-ray powder diffractiondata: a variant of T3R3 human insulin-zinc complexproduced by grinding", Acta Cryst. (2000). D56, 1549-1553. Synopsis: High-resolution synchrotron X-ray powderdiffraction data have been used to solve the crystalstructure of a new variant T3R3 human insulin-zinccomplex produced by mechanical grinding of apolycrystalline sample.)
Crysfire download information as well as tutorials oninstalling and running Crysfire are available athttp://www.ccp14.ac.uk/tutorial/crys/ with Internetdownload areas existing in the UK, Canada and Australia.
Fig 4: Summary output from a Crysfire run usingrescaling/unscaling. This shows the successfully indexing of alarge celled inorganic cubic phase from standard laboratorypowder X-ray diffraction data. TAUP was the indexing programto find the correct cell (confirmed from single crystal data).
CHEKCELL FOR WINDOWS NOW COMES WITH LEPAGEFOR WINDOWS, SOLUTION SORTING AND GUI CELLTRANSFORMATION.
Chekcel, as has been mentioned in previous newsletters, isa graphical powder indexing helper tool by Jean Laugierand Bernard Bouchu that links into Robin Shirley’sCrysfire (http://www.ccp14.ac.uk/tutorial/crys/) to aid inidentification of good cell/spacegroup combinations fromCrysfire format summary lists. This can be performedmanually or automatically using a Best Solution modebased on “parsimony of extra reflections” for selectinginteresting cells.
The latest Chekcell (presently a beta version) nowincludes: LePage; GUI Cell transformation; sorting andfiltering of Crysfire summary files and auto-optimisation ofangular tolerance for matching reflections to HKLs. Toelaborate on one of the above. LePage for Windows(ported from fortran code written by Ton Spek and A.Meetsma) not only gives the “reduced cell”, but can alsocan look for sub-cells and super-cells. LePage results linkinto a “best solution” routine such that cells can be checkedif they are superior to the starting cell (using the criteria of“parsimony of extra reflections”). Thus LePage addsanother feature into Chekcell for effective getting aroundthe many and varied nuances of the available indexingprograms; especially as many of these indexing programsfavour low volume low symmetry cells when high volume,high symmetry cells can be the true solution.
Available indexing programs can have many nuances andfoibles. A recent example of Chekcell’s effectiveness tocounter these nuances was of a summary list generated viathe Crysfire suite. A cell obtained from poor resolution
organic pharmaceutical data was reported by one particularindexing program that reported 18 out of 20 matchedreflections. On being displayed in Chekcell, this cellactually matched all peaks to give the best visual solution.This solution was confirmed later by single crystal resultsto be the most likely cell.
Information and tutorials on using Chekcell are availableat http://www.ccp14.ac.uk/tutorial/lmgp/#chekcell withinternet download areas existing in the UK, Canada andAustralia. Any new beta test versions of LMGP suitesoftware are now placed in the subdirectory“bleeding_edge_beta_versions” of the main downloaddirectory.
Fig 5a: Chekcell powder indexing helper tool with LePage forWindows for both finding the “reduced cell” and looking forsubcells and supercells.
Fig 5b: Graphical Cell Transformation within the latest Chekcellfor Window making it easy to perform required changes to trialcells when looking manually for subcell/supercells effects andgoing from different cell settings.
NEW ENHANCEMENTS IN BOB VON DREELE AND ALANLARSEN’S GSAS RIETVELD SUITE
The latest features introduced into GSAS(ftp://ftp.lanl.gov/public/gsas/) include the ability to changethe weighting of individual histograms (powder patterns);viewing of larger Fourier maps in Forplot, larger numbersof constraints; and an increase in the number of allowedtotal chemistry restraints (which can also be applied torestraint charge balance within the structure). Theseenhancements make possible the restrained refinement ofmore complex inorganic structures from medium resolutionlaboratory powder X-ray diffraction data and constant
29

wavelength neutron data (> 300 atoms, > 1500 bondrestraints, 100’s of constraints). The GSAS for Windowsgraphics are now drawn in MS-Windows boxes allowingMS-Windows Edit Copy, zooming and other standardWindows options to be performed.
Fig 6: Forplot display in the latest GSAS for Windows.
BUGFIX VERSION OF EXPGUI FOR WINDOWS AND LINUXGRAPHICAL USER INTERFACE TO GSAS BY BRIAN TOBY
The latest version of EXPGUI fixes various issues usersmay have encountered when running Liveplot whilerunning GENLES and other GSAS utilities. The latestversion of EXPGUI fixes these problems and can bedownloaded viahttp://www.ncnr.nist.gov/programs/crystallography/software/expgui/expgui_intro.html and CCP14 mirrors.
Fig 7: Liveplot: included with EXPGUI for viewing GSASRietveld plots.
CELREF FOR WINDOWS UNITCELL REFINEMENTSOFTWARE NOW INCORPORATES U.D.ALTERMATT ANDI.D.BROWN’S GETSPEC SPACEGROUP SOFTWARE.
The latest Celref for Windows by Jean Laugier andBernard Bochu (graphical unitcell refinement program;http://www.ccp14.ac.uk/tutorial/lmgp/) now incorporatesU.D.Altermatt and I.D.Brown’s Getspec space group code(http://www.ccp14.ac.uk/ccp/web-mirrors/valence/getspec/) .This means that Celref can handle almost any space groupand setting that a user may want use.
Fig 8: Screen image of the new Celref interface into theGETSPEC spacegroup program.
NEW FEATURES IN GRETEP (GRENOBLE THERMALELLIPSOIDS PLOT PROGRAM) FOR WINDOWS BY JEANLAUGIER AND BERNARD BOCHU
The latest version of Gretep has a variety of new featuresincluding the improved importing of CIF and Shelx filesand atom. Structures with atom labels and fonts can besaved in GRE Gretep format and can display each separatemolecule as a separate colour. A Windows port ofU.D.Altermatt and I.D.Brown’s Getspec spacegroupsoftware is included and Gretep can now render Povrayfiles for photo-realistic rendering of structures. An SEMstyle Angstrom Bar is now displayed at the bottom lefthand corner of the plot screen to give users an appreciationof the scale of the structure being investigated.
Fig 9: Gretep: using the “fragment search mode” where eachdistinct molecule is coloured differently for ease of recognition.This can also be useful for graphically working withinterpenetrating molecules of an elaborate complexity notnecessarily evident when just looking at the asymmetric unit.
PLATON BY TON SPEK (> NOV 2000 VERSION): YOUCAN’T HAVE TOO MANY ADDSYM DEMONSTRATIONS TOFIND MISSING SYMMETRY IN CRYSTAL STRUCTURES.
The Addsym subroutine within Platon uses a highlyenhanced version of Yvon LePage’s original algorithm forfinding missing symmetry in crystal structures. This hasbeen further enhanced in the November 2000 to February
30

2001 versions of Platon and can render valuable assistanceto anyone involved in solving and refining structures fromdiffraction data (both single crystal and powder), modelbuilt structures guided by crystal chemical arguments aswell as ab-initio crystal structure calculations. The effectsof recent enhancements in Platon’s Addsym with respect tosubcells is shown by the following example of a triclinicstructure with 96 independent carbon atoms. Running thelatest > November 2000 version of Platon shows it to bemonoclinic 1/8th sub-cell having only 3 independent carbonatoms. This is also an example of why it is important tomake sure you keep up to date with new versions of freelyavailable crystallographic software.
Fig 10a: Original Triclinic P1 structure (96 Carbons in theasymmetric unit).
Fig 10b: Triclinic P-1 half subcell using obtained pre-November2000 version of Platon’s Addsym subroutine (24 Carbon in the
asymmetric unit).
Fig 10c: Monoclinic P 21/C 1/8th subcell obtained using post-November 2000 version of Platon’s Addsym subroutine (3 Carbonatoms in the asymmetric unit).
It is trivial to do run Addsym within Platon by opening aCIF, Shelx or Platon file. There is also the option to output
a new Shelx coordinate file in the updated spacegroupfound by AddsymPlaton can be obtained viahttp://www.cryst.chem.uu.nl/platon/ or CCP14 mirrors andtutorials area at http://www.ccp14.ac.uk/tutorial/platon/PLATON’S ADDSYM AND MINERALS, ZEOLITES ANDOTHER INORGANIC STRUCTUES
Though optimised for organics and organometallics;Platon’s Addsym can be effective on polymeric inorganiccompounds (minerals, zeolites, ceramics, etc). Asuggestion for those involved with inorganics, includingthose performing model building as part of the structuresolution process are recommended to pass their startingmodels and refined models into Platon’s Addsym to see ifthere could be higher symmetry present that not be visuallyobvious. It can also be useful to run Addsym only on themetals and/or framework atoms. Please note that therehave been some late February 2001 enhancements toPlaton’s Addsym to assist with inorganics. This is mainlyto do with optimising some of the default tolerances(presently based on organics) to recognise inorganicstructures and set to more optimal tolerances. OtherAddsym tricks for inorganic structures include runningaddsym on different atom types (e.g., Metals, Oxygens) tocheck whether these may have higher symmetry that couldbe a guide for understanding the structure.PLATON FOR MS-WINDOWS: ERRATIC CRASHING BUGNOW FIXED!
Older versions of Platon for Windows had the habit crashon some PC computers in an erratic manner. This has beentraced to a very subtle bug in the Fortan compiler used toport the original UNIX code; and has now been rectified inthe most current versions of Platon for Windows ported byLouis Farrugia of Glasgow University.
(http://www.chem.gla.ac.uk/~louis/software/platon/).
CONVERTING SINGLE CRYSTAL HKL DATA INTO POWDERPATTERNS WITH EITHER PATRICK MCARDLES POWUTLFOR WINDOWS TON SPEK’S PLATON FORUNIX/WINDOWS
There are two new enhanced options for academics andstudents requiring freely available software to convertsingle crystal HKL data into pseudo-powder patterns. Post15th June 2001 versions of Patrick McArdle’s Powutl/Ortex(http://www.ucg.ie/cryst/software.htm) and Ton Spek’sPlaton using the new HKL2Powder subroutine(http://www.cryst.chem.uu.nl/platon/) will now convertsingle crystal Shelx format HKL data into common powderdiffraction file formats. Powutl produces ING, CPI, XY andRiet7 DAT files; Platon’s HKL2Powder can produce CPIfiles as well as reporting the number of missing reflectionswith sin(theta)/lambda < 0.3.
31

Fig 11a: Powdis displaying a pseudo-powder pattern generatedfrom single crystal HKL data of Calcium Titanium Silicate usingPowutl
Fig 11b: Powutl generated pseudo-powder diffraction ING filewith HKLs listed to the right of the powder diffraction counts
Fig 11c: Platon displaying a pseudo-powder pattern generatedfrom single microcrystal HKL data of tetracycline hydrochloride.
RIETVELD SOFTWARE UPDATES (AS OF LATE JUNE 2001):Hugo Rietveld website:
http://home.wxs.nl/~rietv025/BGMN (11th June 2001)
http://www.bgmn.de/DBWS (22nd February 2000)
http://www.physics.gatech.edu/downloads/young/download_dbws.html
Debvin (25th May 2001)
ftp://ftp.cc.uniud.it/DEBVIN/GSAS (11th June 2000)
ftp://ftp.lanl.gov/public/gsas/Jana (31st May 2001)
http://www-xray.fzu.cz/jana/jana.htmlLHPM-Rietica (7th December 2000)
ftp://ftp.ansto.gov.au/pub/physics/neutron/rietveld/Rietica_LHPM95/
MAUD for Java (GPL’d) (26th December 2000)http://www.ing.unitn.it/~luttero/maud/
Prodd (3rd April 2001)http://www.ccp14.ac.uk/ccp/web-mirrors/prodd/~jpw22/
Rietan 2000 (GPL’d) (19th June 2001)http://www.ccp14.ac.uk/ccp/web-mirrors/prodd/~jpw22/
Winplotr/Fullprof (5th June 2001)http://www-llb.cea.fr/winplotr/winplotr.htmftp://bali.saclay.cea.fr/pub/divers/fullprof.2k/
Winmprof (21st June 2001)http://lpec.univ-lemans.fr/WinMProf/
XND (31st May 2001)http://www-cristallo.polycnrs-gre.fr/xnd/xnd.htmlftp://old-labs.polycnrs-gre.fr/pub/xnd/
All the above Rietveld programs are also available via the CCP14based mirrors in UK, Australia and Canada(http://www.ccp14.ac.uk/mirror/).
Summary lists of some software available via the EPSRCfunded CCP14 website:
Anharmonic Thermal Refinement Softwarehttp://www.ccp14.ac.uk/solution/anharmonic/
Data Conversion for Powder Diffractionhttp://www.ccp14.ac.uk/solution/powderdataconv/
Image Plate Softwarehttp://www.ccp14.ac.uk/solution/image-plate/
Incommensurate Structure Softwarehttp://www.ccp14.ac.uk/solution/incomm.htm
Indexing Software for Powdershttp://www.ccp14.ac.uk/solution/indexing/
LeBail Method for Intensity Extractionhttp://www.ccp14.ac.uk/solution/lebail/
Pawley Method for Intensity Extractionhttp://www.ccp14.ac.uk/solution/pawley/
PDF, High Q Powder diffraction Analysis Softwarehttp://www.ccp14.ac.uk/solution/high_q_pdf/
Peak Find/Profiling Software for Powder Diffractionhttp://www.ccp14.ac.uk/solution/peakprofiling/
Pole Figure and Texture Analysis Softwarehttp://www.ccp14.ac.uk/solution/pole_figure/
Powder Diffraction Data Visualisationhttp://www.ccp14.ac.uk/solution/powder_data_visual/
Search-Match Phase Identification Softwarehttp://www.ccp14.ac.uk/solution/search-match.htm
Single Crystal Structure Solution Software relevant to ChemicalCrystallography
http://www.ccp14.ac.uk/solution/xtalsolution/Single Crystal Structure Refinement Software relevant toChemical Crystallography
http://www.ccp14.ac.uk/solution/xtalrefine/Single Crystal Suites linking to multiple programs relevant toChemical Crystallography
http://www.ccp14.ac.uk/solution/xtalsuites/Spacegroup and Structure Transformation Software
http://www.ccp14.ac.uk/solution/transform/Structure Conversion and Transformation
http://www.ccp14.ac.uk/solution/structconv/Structure Drawing and Visualisation
http://www.ccp14.ac.uk/solution/structuredrawing/Unit Cell Refinement of Powder Diffraction Data
http://www.ccp14.ac.uk/solution/unitcellrefine/
32

Distant Learning In Crystallography
Université du Maine - France
QTA Internet Course
From diffraction to quantitative texture-
microstructure analysis to properties
http://lpec.univ-lemans.fr/qta [email protected]
SDPD Internet Course
Learn how to
determine a crystal structure by
powder diffractometry
http://sdpd.univ-lemans.fr/course [email protected]

8th EUROPEAN POWDER DIFFRACTIONCONFERENCE
Uppsala, Sweden 23 – 26 May 2002Scientific Programme
The programme for the three-day conference will include invited plenary lectures, contributed talks and
poster sessions. A commercial exhibition will also be organised.
The Scientific Programme will cover the topics:
1. Methods and techniques 6. Dynamic studies2. Instrumental development 7. Studies under non-ambient conditions3. New or improved software 8. Industrial processes and applications4. Databases 9. New research fields5. Materials research
Other contributions relevant or complementary to powder diffraction are welcome.
INFORMATION & CORRESPONDENCESurface mail:
Internet: http://www.mkem.uu.se/epdic8 EPDIC-8Attn. Gunilla Lindh
e-mail: [email protected] Dept. of Materials ChemistryThe Ångström Laboratory
Tel/Fax: 46-18-471 3733 / 46-18-513548 Box 538SE-751 21 UppsalaSweden
34

30 July to 3 August 2001THE 50TH ANNUAL DENVER X-RAY CONFERENCEFifty Years of the Denver X-ray ConferenceSteamboat Springs, Colorado, U.S.A.
The Denver X-ray Conference is celebrating its 50th
anniversary as one of the leading scientific events in the X-ray Analysis community. The celebration will include ahistory of the conference, and an overview of themonumental events in the field of X-ray analysis, as well ascontinuing the tradition of providing an international forumfor discussions of state-of-the-art techniques andindications for future developments in X-ray analysis. Theformat consists of two days of tutorial workshops andposter sessions, followed by two and a half days oftechnical sessions. In addition to providing sponsorship,the ICDD publishes the conference proceedings in CD-ROM format through the series Advances in X-rayAnalysis.
17 September 2001PRACTICAL ASPECTS OF CRYSTAL STRUCTUREINVESTIGATIONS USING SYNCHROTRON- AND NEUTRONSOURCESStuttgart, Germany
A workshop sponsored by BMBF and MPG at the Max-Planck-Institute for Solid State Research (Stuttgart,Germany). For more information:
http://www.mpi-stuttgart.mpg.de/xray/seminar/
12 – 14 November 2001SECOND ISPD--2001 AND ASCA 2001Calcutta and Bangalore, India
Second International School on Powder Diffraction(ISPD--2001)will be held in Calcutta,India from 12-14November, 2001. Lecture sessions include contemporarytopics in powder diffraction by X-ray, electron, neutron andsynchrotron radiation, given by experts with hands-oncomputer sessions for young and active researchers ininstitutes, universities, and companies. This will be asatellite meeting of AsCA (Asian CrystallographyAssociation) to be held for the first time in India inBangalore from18-21 November 2001. Participants mayattend both meetings. Details will be announced shortly.The meetings are sponsored by IUCr, ICDD and otherorganizations.
For further information contact:For ISPD 2001: Prof S P Sen Gupta,E-mail:[email protected],Fax: 91-033-473 2805For AsCA 2001: Prof M Vijayan , IISc, Bangalore,E-mail: [email protected]: 91-080-3600683,3600535.
2 – 6 December 2001SIZE-STRAIN III - ANALYSIS OF MICROSTRUCTURE ANDRESIDUAL STRESS BY DIFFRACTION METHODSTrento, Italy
After the successful editions of Liptovski Mikulas (SlovakRep.) in 1995 and Freiberg (Germany) in 1998, thisconference will gather most of the specialists in LineProfile Analysis for the study of lattice defects andmicrostructure, as well as residual stresses by diffractiontechniques.
For further information contact:P. Scardi and M. Leoni,Dipartimento di Ingegneria dei Materiali,Università di Trento38050 Mesiano (TN), Italy
Tel: +39 0461 882417 / 67Fax: +39 0461 881977E-mail: [email protected]
[email protected]: bragg.ing.unitn.it/sizestrain
29 April - 3 May 2002PRACTICAL X-RAY FLUORESCENCE SPECTROMETRYICDD, Newtown Square, Pennsylvania, U.S.A.
Covering basics of X-ray spectra, instrumentation design,methods of qualitative and quantitative analysis, specimenpreparation, review of mathematical matrix correctionprocedures, applications for both wavelength and energydispersive spectrometry and new developments in XRF.
23 – 26 May 2002EPDIC 8Uppsala, Sweden
The scientific programme for the three-day conferencewill include invited plenary lectures, contributed talks andposter sessions. A commercial exhibition will also beorganised.
The Programme will cover the topics:1. Methods and techniques2. .Instrumental development3. New or improved software4. Databases5. Dynamic studies6. Studies under non-ambient conditions7. Industrial processes and applications8. New research fields
Other contributions relevant or complementary to powderdiffraction are welcome.
Internet: http://www.mkem.uu.se/epdic8e-mail: [email protected]/Fax: 46-18-471 3733 / 46-18-513548Surface mail: Attn. Gunilla Lindh
EPDIC-8, Dept. of Materials Chemistry,The Ångström LaboratoryBox 538, SE-751 21 Uppsala, Sweden
WHAT’S ON
The following web-site contains an up-to-date andsemi-exhaustive list of conferences and workshops incrystallography and related areashttp://www.iucr.org/cww-top/mtg.date.html
35

3-7 June 2002FUNDAMENTALS OF X-RAY POWDER DIFFRACTIONICDD, Newtown Square, Pennsylvania, U.S.A.
Covering instrumentation, specimen preparation, dataacquisition, and qualitative phase analysis.
10 – 14 June 2002ADVANCED METHODS IN X-RAY POWDER DIFFRACTIONICDD, Newtown Square, Pennsylvania, U.S.A.
Emphasizing computer-based methods of data collectionand interpretation, both for qualitative and quantitativephase analysis.
For further information on all ICDD meetings contact:Education CoordinatorInternational Centre for Diffraction Data12 Campus BoulevardNewtown Square, PA 19073-3273Tel: +(610) 325-9814Fax: +(610) 325-9823E-mail: [email protected]: www.icdd.com/education/clinics/
29 July to 2 August 2002THE 51ST ANNUAL DENVER X-RAY CONFERENCEColorado Springs, Colorado, U.S.A.
The 51st Denver X-ray Conference will be held at theAdams Mark Hotel (formerly Antlers Doubletree Hotel) inColorado Springs, Colorado. A tentative program will beavailable on the Denver X-ray Conference web site bySeptember 2001, and the Call for Papers will be availablein December 2001.
For further information contact:Conference CoordinatorInternational Centre for Diffraction Data12 Campus BoulevardNewtown Square, PA 19073-3273Tel: +(610) 325-9814Fax: +(610) 325-9823E-mail: [email protected]
Web-site: www.dxcicdd.com
Call for contributions to the next CPD Newsletter (No 26)The next issue of the CPD Newsletter will be edited by Robert Dinnebier, to appear in autumn of 2001. Robert willgreatly appreciate contributions from readers on matters of interest to the powder diffraction community, e.g. meetingreports, future meetings, developments in instruments, techniques, and news of general interest. Please contact him forsending articles and suggestions. Software developments can be directly addressed to Lachlan Cranswick or to theEditor of Newsletter No 26 (addresses are given below)
Dr R. E. Dinnebier (Robert)Max-Planck-Institut für Festkörperforschung, Heisenbergstrasse 1, D-70569 Stuttgart, GermanyTel: +49-711-689-1503; Fax: +49-711-689-1502e-mail: [email protected]: http://www.mpi-stuttgart.mpg.de/start.html
http://www.pulverdiffraktometrie.de
Dr Lachlan M. D. CranswickCCP14, Department of Crystallography, Birkbeck College University of London,Malet Street, Bloomsbury, WC1E 7HX, London, UKe-mail: [email protected]: http://www.ccp14.ac.uk
CompaniesIf you would like to advertise in this twice-yearly newsletter, please contact
Paolo Scardi on e-mail: [email protected]: +39 0461 882417/67Fax: +39 0461 881977
36
How to receive the IUCr CPD NewsletterIf you wish to be added to the mailing list for the Newsletter of the IUCr Commission on Powder Diffraction or havechanged address, please contact the Chairman or simply send an e-mail to [email protected]