structure of genetic diversity of bemisia tabaci (genn ... · structure of genetic diversity of...
TRANSCRIPT
Fontes et al. Genetic structure of Bemisia tabaci in Brazil
47
Sci. Agric. v.69, n.1, p.47-53, January/February 2012
Scientia Agricola
Structure of genetic diversity of Bemisia tabaci (Genn.) (Hemiptera: Aleyrodidae)
Fernanda von Hertwig Mascarenhas Fontes1, Carlos Augusto Colombo2*, André Luiz Lourenção1
ABSTRACT: Bemisia tabaci (Genn.) represents a complex of cryptic species that causes losses of many valuable crops. Even though there are differences in their ability to colonize hosts, trans-mit phytovirus and develop resistance to insecticides, the genetic differentiation of the insect populations is important for the adoption of control measures. Therefore, the genetic diversity of B. tabaci populations in economically important crops in Brazilian locations was characterized through a microsatellite analysis. Eight microsatellite markers were used for the analysis of eight populations, three in Solanum tuberosum (States of São Paulo, Minas Gerais and Bahia), two in Glycine max (States of São Paulo and Mato Grosso), one in Phaseolus vulgaris and Brassica oleracea var. acephala (States of São Paulo and Distrito Federal, respectively) and a cabbage population from Florida (USA). The number of alleles varied between two and 13 and the average value of FST was 0.13. The population occurring in beans was genetically different, suggesting that the excessive use of insecticide or the host itself may have caused the modification of its allele frequency. The American population presented a large diversity and small differentiation compared to the Brazilian populations, especially from the Southeast, supporting the hypothesis that the B biotype was probably introduced into Brazil by the trade of plant material between the USA and the State of São Paulo. The genetic diversity found within and among the populations is geographically structured, and the insects from the central region of Brazil had superior genetic divergence when compared to the others Brazilian locations.Keywords: SSR, biotype B, population genetics, silverleaf whitefly
populations in Brazilian crops and locations
Received November 25, 2010Accepted September 06, 2011
1IAC/Centro de Fitossanidade, C.P. 28 – 13020-970 – Campinas, SP – Brasil. 2IAC/Centro de Genética, C.P. 28 – 13020-970 – Campinas, SP – Brasil.*Corresponding author <[email protected]>
Edited by: Richard V. Glatz
Introduction
Bemisia tabaci (Genn.) (Hemiptera: Aleyrodidae) belongs to a group of insects named whiteflies known throughout the world for their great capacity to cause se-rious damage to various crops (Brown et al., 1995). It is a polyphagous insect, and at least 600 species of plants are considered its hosts (Oliveira, 2001). Both nymphs and adults feed on plant sap, and can cause yellowing, mot-tling and leaf fall. The excretion of a substance known as honeydew facilitates fungus (sooty mold) to colonize the leaf surface, which may affect the development of the plant (Byrne and Bellows, 1991). Besides, B. tabaci is vector for more than 110 phytoviruses (Jones, 2003).
Since it became a pest in agriculture, this insect has been the target of genetic, morphological and be-havioral studies. B. tabaci probably comprises a species complex whose morphological resemblance makes it dif-ficult to differentiate them through conventional taxono-my (Brown et al., 1995). Recently, Dinsdale et al. (2010) analyzed data from 454 individuals by sequencing the mitochondrial cytocrome oxidase I gene (mtCOI) (De-Barro et al., 2005) and proposed that B. tabaci is a cryptic species complex comprising 11 groups that contain 24 species. De Barro et al. (2011) conducted crossing experi-ments that demonstrated reproductive incompatibility among some putative species (or biotypes). Despite this, as there is still no consensus for a new nomenclature to use, we will continue to adopt the term biotype when-ever necessary.
In Brazil, infestation outbreaks of this pest in the beginning of the 1990’s turned out to be related to the B biotype, that displaced the existing biotype A in the country (Lourenção and Nagai, 1994). Since then, through genetic studies with RAPD molecular markers (Lima et al., 2000; Lima et al., 2002; Fontes et al., 2010) and mitochondrial gene sequences (Rocha et al., 2011), no evidence was obtained concerning the presence of other biotypes in the country. Therefore, the level and structure of the genetic diversity for this insect in many crops of economic importance in Brazil-ian locations was characterized, aiming to understand the genetic relationship among them, through the use of microsatellite markers (SSR). This was the first study to use a population-based approach for B. tabaci in Brazil.
Materials and Methods
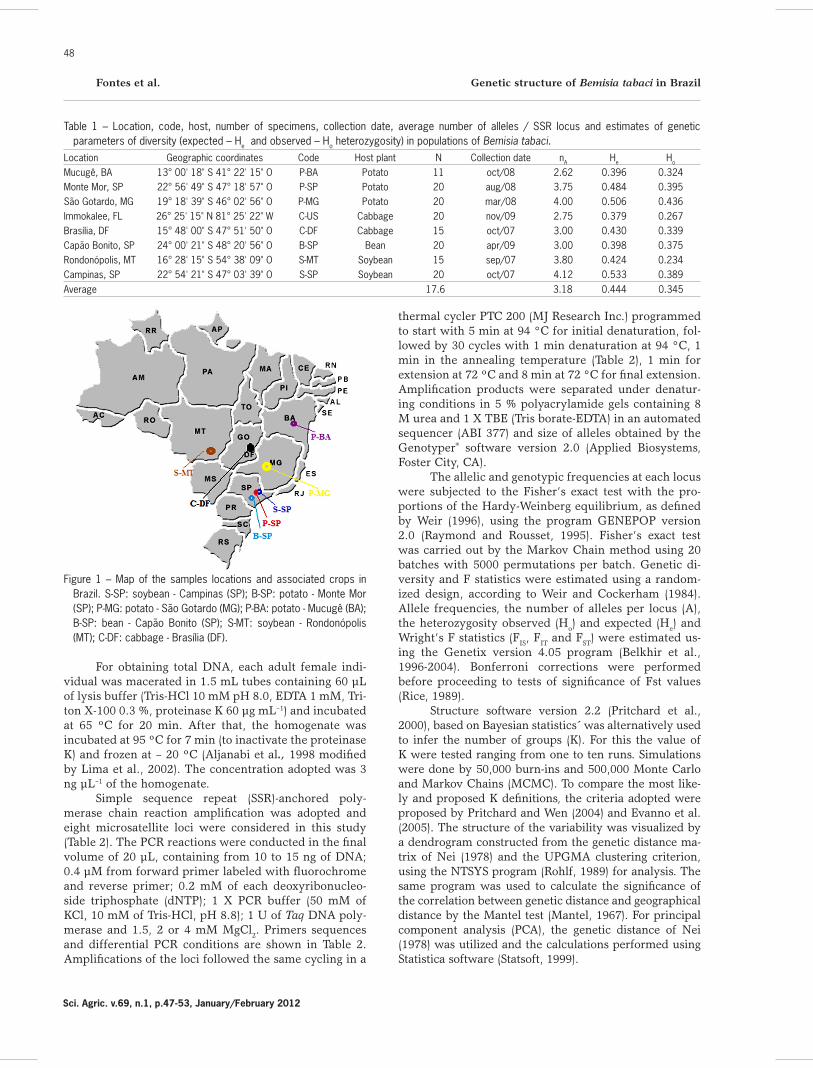
B. tabaci populations from seven locations in Bra-zil and one in the United States were collected, total-ing 141 individuals (Table 1 and Figure 1). Immokalee, FL, US (26°25’15” N; 81°25’22” W) and Campinas, SP (22°54’21” S; 47°03’39” O) populations were previous-ly characterized as biotype B. The insects used for this study were collected alive in the field, and were immedi-ately stored in 92 % ethanol and kept refrigerated until used. The species is a haploi-diploid and based on this only females were used because they are diploid and can reveal more genetic information at a locus.
48
Fontes et al. Genetic structure of Bemisia tabaci in Brazil
Sci. Agric. v.69, n.1, p.47-53, January/February 2012
For obtaining total DNA, each adult female indi-vidual was macerated in 1.5 mL tubes containing 60 µL of lysis buffer (Tris-HCl 10 mM pH 8.0, EDTA 1 mM, Tri-ton X-100 0.3 %, proteinase K 60 µg mL–1) and incubated at 65 ºC for 20 min. After that, the homogenate was incubated at 95 ºC for 7 min (to inactivate the proteinase K) and frozen at – 20 ºC (Aljanabi et al., 1998 modified by Lima et al., 2002). The concentration adopted was 3 ng µL–1 of the homogenate.
Simple sequence repeat (SSR)-anchored poly-merase chain reaction amplification was adopted and eight microsatellite loci were considered in this study (Table 2). The PCR reactions were conducted in the final volume of 20 µL, containing from 10 to 15 ng of DNA; 0.4 µM from forward primer labeled with fluorochrome and reverse primer; 0.2 mM of each deoxyribonucleo-side triphosphate (dNTP); 1 X PCR buffer (50 mM of KCl, 10 mM of Tris-HCl, pH 8.8); 1 U of Taq DNA poly-merase and 1.5, 2 or 4 mM MgCl2. Primers sequences and differential PCR conditions are shown in Table 2. Amplifications of the loci followed the same cycling in a
thermal cycler PTC 200 (MJ Research Inc.) programmed to start with 5 min at 94 °C for initial denaturation, fol-lowed by 30 cycles with 1 min denaturation at 94 °C, 1 min in the annealing temperature (Table 2), 1 min for extension at 72 ºC and 8 min at 72 °C for final extension. Amplification products were separated under denatur-ing conditions in 5 % polyacrylamide gels containing 8 M urea and 1 X TBE (Tris borate-EDTA) in an automated sequencer (ABI 377) and size of alleles obtained by the Genotyper® software version 2.0 (Applied Biosystems, Foster City, CA).
The allelic and genotypic frequencies at each locus were subjected to the Fisher’s exact test with the pro-portions of the Hardy-Weinberg equilibrium, as defined by Weir (1996), using the program GENEPOP version 2.0 (Raymond and Rousset, 1995). Fisher’s exact test was carried out by the Markov Chain method using 20 batches with 5000 permutations per batch. Genetic di-versity and F statistics were estimated using a random-ized design, according to Weir and Cockerham (1984). Allele frequencies, the number of alleles per locus (A), the heterozygosity observed (Ho) and expected (He) and Wright’s F statistics (FIS, FIT and FST) were estimated us-ing the Genetix version 4.05 program (Belkhir et al., 1996-2004). Bonferroni corrections were performed before proceeding to tests of significance of Fst values (Rice, 1989).
Structure software version 2.2 (Pritchard et al., 2000), based on Bayesian statistics´ was alternatively used to infer the number of groups (K). For this the value of K were tested ranging from one to ten runs. Simulations were done by 50,000 burn-ins and 500,000 Monte Carlo and Markov Chains (MCMC). To compare the most like-ly and proposed K definitions, the criteria adopted were proposed by Pritchard and Wen (2004) and Evanno et al. (2005). The structure of the variability was visualized by a dendrogram constructed from the genetic distance ma-trix of Nei (1978) and the UPGMA clustering criterion, using the NTSYS program (Rohlf, 1989) for analysis. The same program was used to calculate the significance of the correlation between genetic distance and geographical distance by the Mantel test (Mantel, 1967). For principal component analysis (PCA), the genetic distance of Nei (1978) was utilized and the calculations performed using Statistica software (Statsoft, 1999).
Figure 1 – Map of the samples locations and associated crops in Brazil. S-SP: soybean - Campinas (SP); B-SP: potato - Monte Mor (SP); P-MG: potato - São Gotardo (MG); P-BA: potato - Mucugê (BA); B-SP: bean - Capão Bonito (SP); S-MT: soybean - Rondonópolis (MT); C-DF: cabbage - Brasília (DF).
Table 1 – Location, code, host, number of specimens, collection date, average number of alleles / SSR locus and estimates of genetic parameters of diversity (expected – He and observed – Ho heterozygosity) in populations of Bemisia tabaci.
Location Geographic coordinates Code Host plant N Collection date nA He Ho
Mucugê, BA 13° 00' 18" S 41° 22' 15" O P-BA Potato 11 oct/08 2.62 0.396 0.324Monte Mor, SP 22° 56' 49" S 47° 18' 57" O P-SP Potato 20 aug/08 3.75 0.484 0.395São Gotardo, MG 19° 18' 39" S 46° 02' 56" O P-MG Potato 20 mar/08 4.00 0.506 0.436Immokalee, FL 26° 25' 15" N 81° 25' 22" W C-US Cabbage 20 nov/09 2.75 0.379 0.267Brasília, DF 15° 48' 00" S 47° 51' 50" O C-DF Cabbage 15 oct/07 3.00 0.430 0.339Capão Bonito, SP 24° 00' 21" S 48° 20' 56" O B-SP Bean 20 apr/09 3.00 0.398 0.375Rondonópolis, MT 16° 28' 15" S 54° 38' 09" O S-MT Soybean 15 sep/07 3.80 0.424 0.234Campinas, SP 22° 54' 21" S 47° 03' 39" O S-SP Soybean 20 oct/07 4.12 0.533 0.389Average 17.6 3.18 0.444 0.345
Fontes et al. Genetic structure of Bemisia tabaci in Brazil
49
Sci. Agric. v.69, n.1, p.47-53, January/February 2012
Results and Discussion
A total of 47 alleles were detected at all eight loci, analyzed ranging from two to 13 alleles (Table 1), similar to that obtained by Tsagkarakou and Roditakis (2003), who examined six populations of B. tabaci represented by 18 individuals each, with the same molecular marker and two loci in common with our work (BT4 and BTb-103).
The average He was superior to Ho for all popula-tions (Table 1), which shows a deficit of heterozygotes for this species. Simón et al. (2007) explain heterozygote deficiency by the presence of null alleles, i.e., an allele that is present in a sample, but is not amplified because of some site mutation that inhibit amplification for the non binding of the primer in the DNA, and the result can be a false homozygote (Kwok et al., 1990). Another explanation is based on biological aspects of the insect, since it is a preferential colonizer of annual cycle plants, whose colonization is made primarily by few genotypes increasing the chances of inbreeding, thus promoting the heterozygote deficiency observed (De Barro, 2005).
The populations are in Hardy-Weinberg equilib-rium for most loci, except for MB02, BT-4 and BEM37
(p < 0.05) (Table 3). By the calculation of F statistics, the FIT value of 0.34 was significant, revealing that there is a factor acting on the populations in order to structure them. The estimate of FIS, which measures the deficiency of heterozygotes whithin populations did not differ from zero (p < 0.05), therefore not showing great influence on the distribution of variability of populations (Table 4).
The FST, which evaluates the degree of genetic structure among populations, had a moderate and signifi-cant value of 0.13 after sequential Bonferroni correction, showing that these populations are differentiating. The value of pairwise FST obtained between the populations (Table 5) indicated C-DF as the most divergent popula-tion, followed by B-SP and S-MT, with average B-SP val-ues of 0.2, 0.17 and 0.16, respectively. In contrast, S-SP and P-SP had the lowest FST values (average of 0.11 and 0.12, respectively), indicating they are the less divergent than the others.
In the three populations of the insect from the State of São Paulo ocurring in common bean in Capão Bonito (B-SP, 24°00’21” S; 48°20’56” O), potatoes in Monte Mor (P-SP, 22°56’49” S; 47°18’57” O) and soy-bean in Campinas (S-SP), high FST values were obtained between the populations of Capão Bonito and Monte
Table 2 – Microsatellites with their respective repetitive motif, annealing temperature (Ta), MgCl2 concentration, expected fragment lenght, number of expected alleles (N) and accession number in Genbank.
Loci Motif Reference Ta MgCl2 Length N GenBankoC mM bp
BT-e49 (TTG)12(TTC)11 Tsagkarakou et al. (2007) 64 4.0 304–368 10 DQ365855BTb-103 (AC)8(TC)3 Tsagkarakou and Roditakis (2003) 50 4.0 140-142 2 AY183679BT-4 (GT)3(CA)8 Tsagkarakou and Roditakis (2003) 60 1.5 279-305 9 AY183673BEM37 (GCT)4(GTT)2 DeBarro et al. (2003) 55 4.0 72-87 6 AY145464BEM15 (CAA)6(CAG)4(CAA)4 DeBarro et al. (2003) 50 1.5 142-262 21 AY145456MB02 (CT)16 Not published 55 1.5 195-227 - GF109947MB04 (TG)5 Not published 60 2.0 120-155 - GF109949MB05 (AC)8 Not published 60 2.0 210-251 - GF109950
Table 3 – Hardy-Weinberg equilibrium for eight populations and eight SSR loci in Bemisia tabaci. S-SP: soybean - Campinas (SP) B-SP: potato - Monte Mor (SP); P-MG: potato - São Gotardo (MG); C-US: cabbage - Immokalee (FL - USA), P-BA: potato - Mucugê (BA), B-SP: bean - Capão Bonito (SP), S-MT: soybean - Rondonópolis (MT), C-DF: cabbage - Brasília (DF).
Loco SSP BSP BMG RUS BBA FSP SMT RDFMB-02 0.00 0.00 0.00 0.00 0.01 0.00 0.00 0.00MB-04 1.00 1.00 0.01 0.02 - 1.00 - 0.53MB-05 1.00 0.01 0.93 0.59 0.21 0.00 1.00 1.00BTb-69 0.06 0.28 0.56 - 1.00 0.26 - -BTb-103 0.35 0.18 1.00 - 1.00 0.55 - -BT-4 0.00 0.00 0.00 0.00 0.00 0.00 0.00 0.00BEM-37 0.00 0.00 0.00 0.00 0.59 1.00 - -BEM-15 0.38 0.09 0.26 1.00 1.00 0.61 0.51 1.00
Table 4 – Values of FIS calculated for each population from SSR loci in Bemisia tabaci. S-SP: soybean - Campinas (SP) B-SP: potato - Monte Mor (SP); P-MG: potato - São Gotardo (MG); C-US: cabbage - Immokalee (FL - USA). P-BA: potato - Mucugê (BA). B-SP: bean - Capão Bonito (SP). S-MT: soybean - Rondonopolis (MT). C-DF: cabbage - Brasília (DF).
Populations SSP BSP BMG RUS BBA FSP SMT RDFEstimatives 0.30 0.21 0.17 0.32 0.23 0.08 0.48 0.25Upper limit (IC 95 %) 0.38 0.30 0.26 0.45 0.28 0.19 0.64 0.48Lower limit (IC 95 %) 0.16 0.05 0.01 0.11 0.03 -0.08 0.29 -0.05
50
Fontes et al. Genetic structure of Bemisia tabaci in Brazil
Sci. Agric. v.69, n.1, p.47-53, January/February 2012
Mor, and Capão Bonito and Campinas, 0.13 and 0.12, re-spectively. On the other hand, the population of Campi-nas and Monte Mor had a reduction in the allele fixation index (0.05), suggesting that these two populations are not isolated from each other. The narrowing between these two populations is facilitated by geographical loca-tion, considering that Monte Mor and Campinas cities are geographically more close (30 km), than Capão Bo-nito, with is located approximately 200 km away from the two. But when geographic distance is regarded as a significant causative factor for population divergence, it does not always explain the structure presented. The whitefly population coming from São Gotardo (State of Minas Gerais, 19°18’39” S; 46°02’56” O) is 600 km away from the population of Monte Mor (SP) and the FST index between them is only 0.07. Another plausible explanation for the discrepancy observed between the whiteflies from Capão Bonito compared to those materi-als from Monte Mor and Campinas, is large-scale use of insecticides in bean plants in Capão Bonito, where selection pressure could be causing a local adaptive ef-fect, hence changing gene frequencies of the population, as suggested by De Barro (2005). It should also be taken into account the presence of host-plant factors which, by exerting a selection pressure on the colonizing popu-lation, causes allele frequencies to modify according to the need for adaptation in the culture. In fact, field ob-servations show that the bean plant is not considered a good host for B. tabaci when compared with other plants such as soybean, cabbage, tobacco and eggplant for their potential to rear whitefly.
The whitefly populations in potato crops had lower FST values when compared to other populations in other cultures (0.12, for P-SP and 0.13 for P-BA and P-MG). In general, even though the populations in po-tato have revealed low genetic structure, the FIS values that measure inbreeding whithin subpopulations, were not the highest compared to all other populations (Table 4), with the values of 0.23, 0.21 and 0.16 for P-BA, P-SP and P-MG, respectively. This result was not expected because being a relatively recent host of the pest it was more appropriated to have a high level of homozygotes
in this populations due to inbreeding, if were assumed that the appearance of this pest in potato started from few individuals.
The population of whiteflies captured in cabbage crops in the U.S. (C-US), which should be very different from the Brazilian populations due to greater geographi-cal distance, presented mostly intermediate FST values [average value of 0.13, minimum of 0.08 (BSP) and a maximum of 0.20 (RDF)], corroborating with the idea that the B biotype could probably be introduced from the U.S. into the region of Campinas (Lourenção and Nagai, 1994).
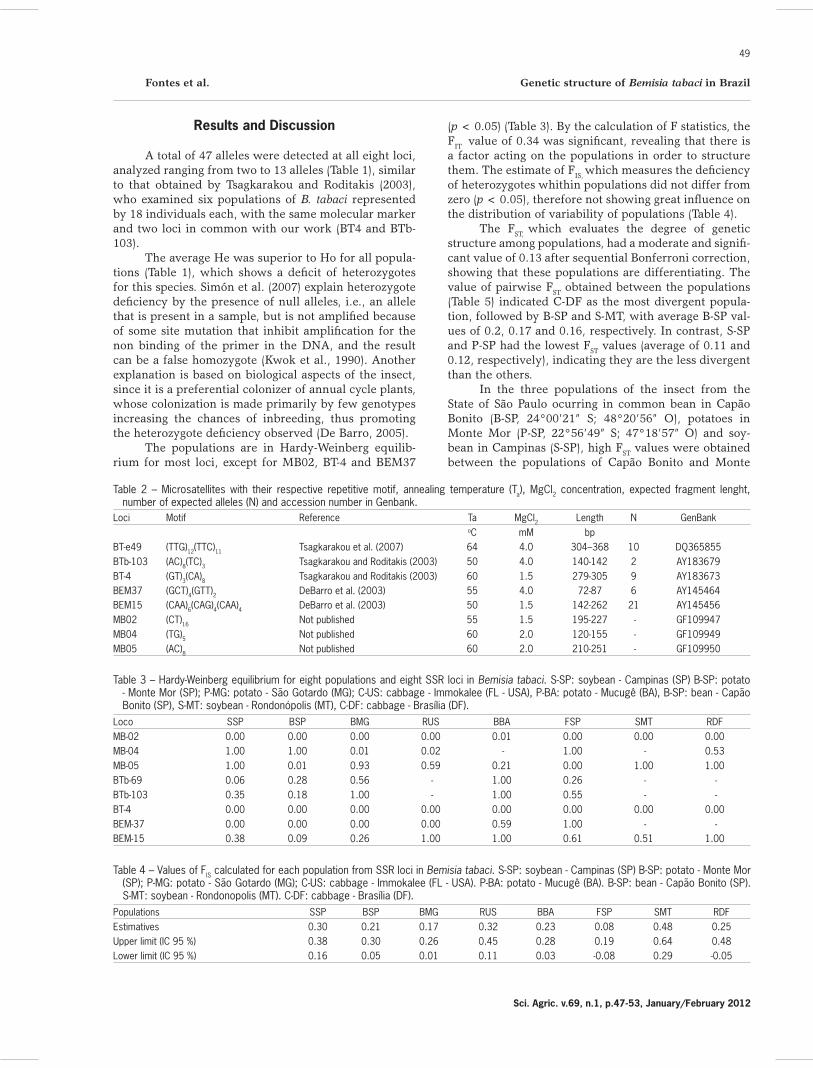
Genetic distances obtained among populations, which ranged from 0.06 (S-SP X P-SP) to 0.43 (B-SP X C-DF) were employed to generate the dendrogram (UP-GMA) (Figure 2). Two main groups were identified, and populations in the midwest of the country (G2) presented themselves as genetically distinct from the populations of other regions (G1). Genetic distances between popula-tions (excluding the U.S. population) were not correlated with their geographical distances by the Mantel test. Al-though not significant (r = 0.36 and p = 0.13), we deter-mined that the greatest genetic distances were obtained between geographically distant populations, i.e., P-SP / S-SP and S-MT / C-DF.
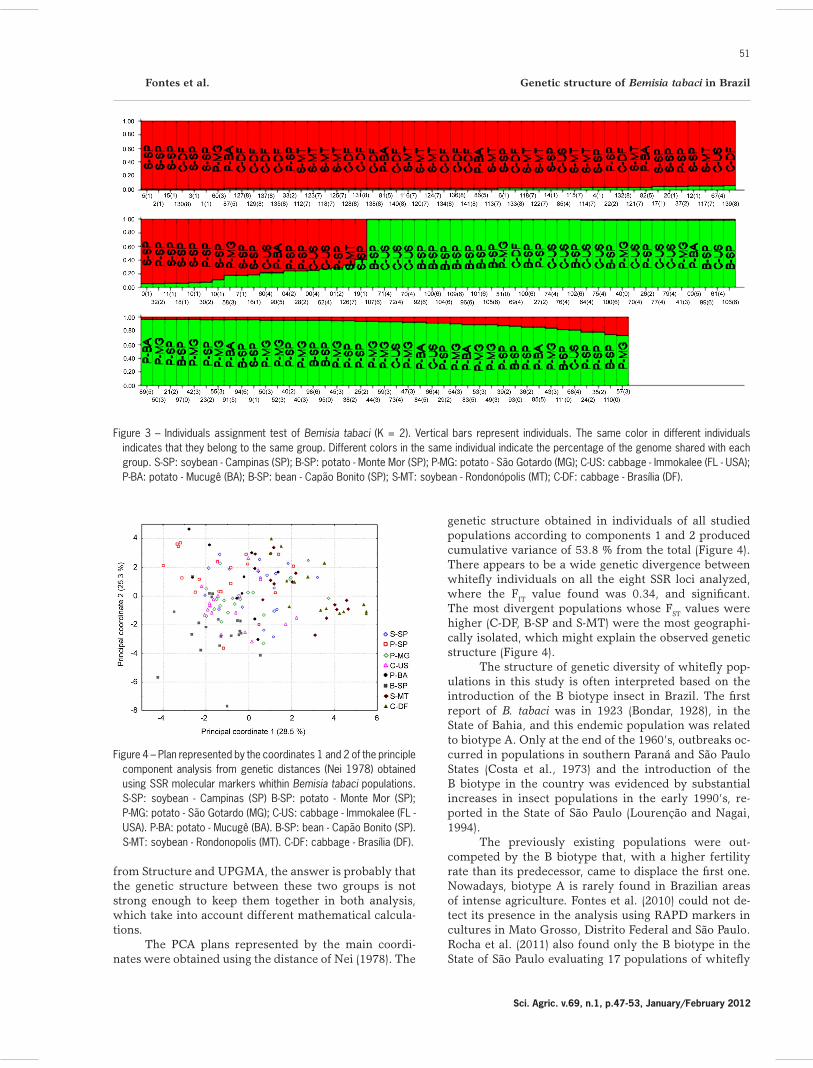
Using the Bayesian approach performed by the program STRUCTURE, we tested values from 2 to 10 for K populations, according to Evanno et al. (2005), and the optimal value of K was 2, with almost all individu-als presenting Q > 0.8 (Figure 3). The genetic structure revealed by the Structure Program is related to the re-sult obtained using the distance of Nei (1978). For the Bayesian approach, the two populations in the midwest (red) remained grouped with S-SP and were separated from B-SP, P-MG and C-US (green). Populations P-SP and P-BA share individuals in both groups, again showing the diversity found in insects colonizing potato fields. About not congruent grouping of individuals belonging to populations P-SP and P-BA in the analysis obtained
Table 5 – Values of FST calculated among the Bemisia tabaci populations from SSR loci. S-SP: soybean - Campinas (SP) B-SP: potato - Monte Mor (SP); P-MG: potato - São Gotardo (MG); C-US: cabbage - Immokalee (FL - USA). P-BA: potato - Mucugê (BA). B-SP: bean - Capão Bonito (SP). S-MT: soybean - Rondonópolis (MT). C-DF: cabbage - Brasília (DF).
P-SP P-MG C-US P-BA B-SP S-MT C-DFS-SP 0.05 0.07 0.10 0.08 0.12 0.15 0.22P-SP 0.07 0.08 0.07 0.13 0.21 0.25P-MG 0.09 0.16 0.11 0.18 0.21C-US 0.11 0.12 0.18 0.20P-BA 0.21 0.11 0.18B-SP 0.25 0.29S-MT 0.05
Figure 2 – Structuring genetic divergence among populations of Bemisia tabaci. using the clustering UPGMA method. based on genetic distances of Nei (1978). S-SP: soybean - Campinas (SP); B-SP: potato - Monte Mor (SP); P-MG: potato - São Gotardo (MG); C-US: cabbage - Immokalee (FL - USA); P-BA: potato - Mucugê (BA); B-SP: bean - Capão Bonito (SP); S-MT: soybean - Rondonópolis (MT); C-DF: cabbage - Brasília (DF).
Fontes et al. Genetic structure of Bemisia tabaci in Brazil
51
Sci. Agric. v.69, n.1, p.47-53, January/February 2012
from Structure and UPGMA, the answer is probably that the genetic structure between these two groups is not strong enough to keep them together in both analysis, which take into account different mathematical calcula-tions.
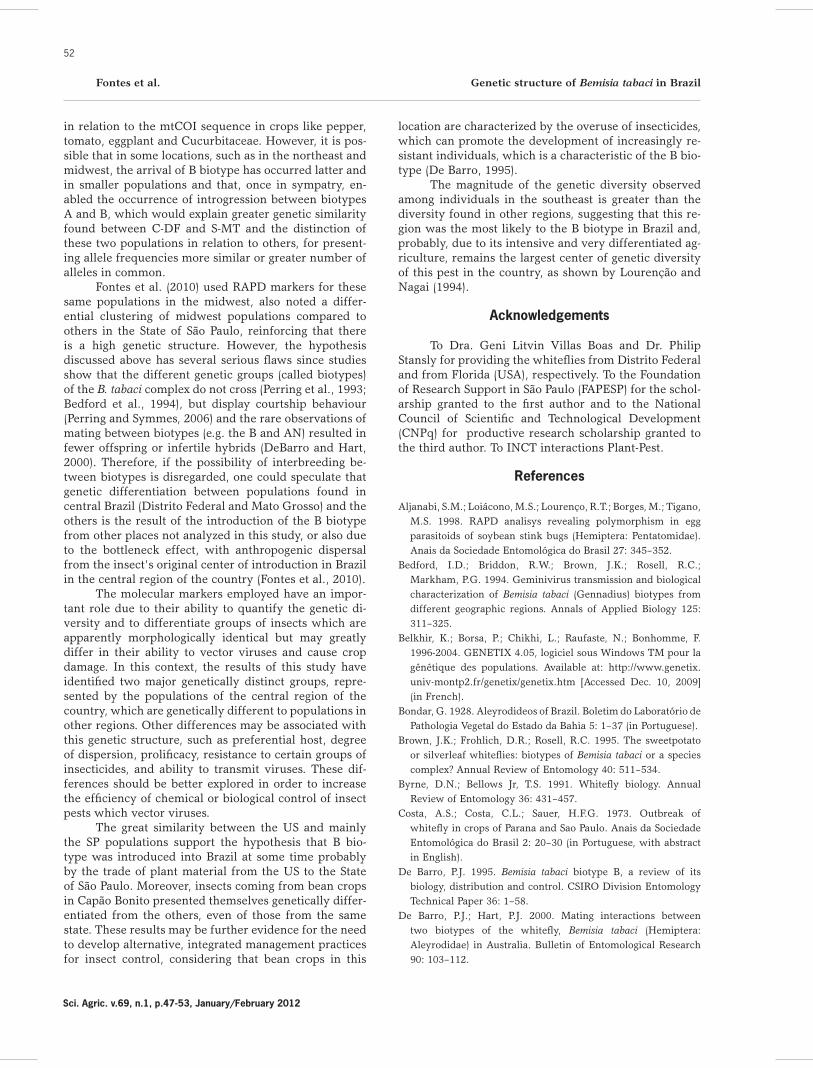
The PCA plans represented by the main coordi-nates were obtained using the distance of Nei (1978). The
genetic structure obtained in individuals of all studied populations according to components 1 and 2 produced cumulative variance of 53.8 % from the total (Figure 4). There appears to be a wide genetic divergence between whitefly individuals on all the eight SSR loci analyzed, where the FIT value found was 0.34, and significant. The most divergent populations whose FST values were higher (C-DF, B-SP and S-MT) were the most geographi-cally isolated, which might explain the observed genetic structure (Figure 4).
The structure of genetic diversity of whitefly pop-ulations in this study is often interpreted based on the introduction of the B biotype insect in Brazil. The first report of B. tabaci was in 1923 (Bondar, 1928), in the State of Bahia, and this endemic population was related to biotype A. Only at the end of the 1960’s, outbreaks oc-curred in populations in southern Paraná and São Paulo States (Costa et al., 1973) and the introduction of the B biotype in the country was evidenced by substantial increases in insect populations in the early 1990’s, re-ported in the State of São Paulo (Lourenção and Nagai, 1994).
The previously existing populations were out-competed by the B biotype that, with a higher fertility rate than its predecessor, came to displace the first one. Nowadays, biotype A is rarely found in Brazilian areas of intense agriculture. Fontes et al. (2010) could not de-tect its presence in the analysis using RAPD markers in cultures in Mato Grosso, Distrito Federal and São Paulo. Rocha et al. (2011) also found only the B biotype in the State of São Paulo evaluating 17 populations of whitefly
Figure 4 – Plan represented by the coordinates 1 and 2 of the principle component analysis from genetic distances (Nei 1978) obtained using SSR molecular markers whithin Bemisia tabaci populations. S-SP: soybean - Campinas (SP) B-SP: potato - Monte Mor (SP); P-MG: potato - São Gotardo (MG); C-US: cabbage - Immokalee (FL - USA). P-BA: potato - Mucugê (BA). B-SP: bean - Capão Bonito (SP). S-MT: soybean - Rondonopolis (MT). C-DF: cabbage - Brasília (DF).
Figure 3 – Individuals assignment test of Bemisia tabaci (K = 2). Vertical bars represent individuals. The same color in different individuals indicates that they belong to the same group. Different colors in the same individual indicate the percentage of the genome shared with each group. S-SP: soybean - Campinas (SP); B-SP: potato - Monte Mor (SP); P-MG: potato - São Gotardo (MG); C-US: cabbage - Immokalee (FL - USA); P-BA: potato - Mucugê (BA); B-SP: bean - Capão Bonito (SP); S-MT: soybean - Rondonópolis (MT); C-DF: cabbage - Brasília (DF).
52
Fontes et al. Genetic structure of Bemisia tabaci in Brazil
Sci. Agric. v.69, n.1, p.47-53, January/February 2012
in relation to the mtCOI sequence in crops like pepper, tomato, eggplant and Cucurbitaceae. However, it is pos-sible that in some locations, such as in the northeast and midwest, the arrival of B biotype has occurred latter and in smaller populations and that, once in sympatry, en-abled the occurrence of introgression between biotypes A and B, which would explain greater genetic similarity found between C-DF and S-MT and the distinction of these two populations in relation to others, for present-ing allele frequencies more similar or greater number of alleles in common.
Fontes et al. (2010) used RAPD markers for these same populations in the midwest, also noted a differ-ential clustering of midwest populations compared to others in the State of São Paulo, reinforcing that there is a high genetic structure. However, the hypothesis discussed above has several serious flaws since studies show that the different genetic groups (called biotypes) of the B. tabaci complex do not cross (Perring et al., 1993; Bedford et al., 1994), but display courtship behaviour (Perring and Symmes, 2006) and the rare observations of mating between biotypes (e.g. the B and AN) resulted in fewer offspring or infertile hybrids (DeBarro and Hart, 2000). Therefore, if the possibility of interbreeding be-tween biotypes is disregarded, one could speculate that genetic differentiation between populations found in central Brazil (Distrito Federal and Mato Grosso) and the others is the result of the introduction of the B biotype from other places not analyzed in this study, or also due to the bottleneck effect, with anthropogenic dispersal from the insect’s original center of introduction in Brazil in the central region of the country (Fontes et al., 2010).
The molecular markers employed have an impor-tant role due to their ability to quantify the genetic di-versity and to differentiate groups of insects which are apparently morphologically identical but may greatly differ in their ability to vector viruses and cause crop damage. In this context, the results of this study have identified two major genetically distinct groups, repre-sented by the populations of the central region of the country, which are genetically different to populations in other regions. Other differences may be associated with this genetic structure, such as preferential host, degree of dispersion, prolificacy, resistance to certain groups of insecticides, and ability to transmit viruses. These dif-ferences should be better explored in order to increase the efficiency of chemical or biological control of insect pests which vector viruses.
The great similarity between the US and mainly the SP populations support the hypothesis that B bio-type was introduced into Brazil at some time probably by the trade of plant material from the US to the State of São Paulo. Moreover, insects coming from bean crops in Capão Bonito presented themselves genetically differ-entiated from the others, even of those from the same state. These results may be further evidence for the need to develop alternative, integrated management practices for insect control, considering that bean crops in this
location are characterized by the overuse of insecticides, which can promote the development of increasingly re-sistant individuals, which is a characteristic of the B bio-type (De Barro, 1995).
The magnitude of the genetic diversity observed among individuals in the southeast is greater than the diversity found in other regions, suggesting that this re-gion was the most likely to the B biotype in Brazil and, probably, due to its intensive and very differentiated ag-riculture, remains the largest center of genetic diversity of this pest in the country, as shown by Lourenção and Nagai (1994).
Acknowledgements
To Dra. Geni Litvin Villas Boas and Dr. Philip Stansly for providing the whiteflies from Distrito Federal and from Florida (USA), respectively. To the Foundation of Research Support in São Paulo (FAPESP) for the schol-arship granted to the first author and to the National Council of Scientific and Technological Development (CNPq) for productive research scholarship granted to the third author. To INCT interactions Plant-Pest.
References
Aljanabi, S.M.; Loiácono, M.S.; Lourenço, R.T.; Borges, M.; Tigano, M.S. 1998. RAPD analisys revealing polymorphism in egg parasitoids of soybean stink bugs (Hemiptera: Pentatomidae). Anais da Sociedade Entomológica do Brasil 27: 345–352.
Bedford, I.D.; Briddon, R.W.; Brown, J.K.; Rosell, R.C.; Markham, P.G. 1994. Geminivirus transmission and biological characterization of Bemisia tabaci (Gennadius) biotypes from different geographic regions. Annals of Applied Biology 125: 311–325.
Belkhir, K.; Borsa, P.; Chikhi, L.; Raufaste, N.; Bonhomme, F. 1996-2004. GENETIX 4.05, logiciel sous Windows TM pour la génétique des populations. Available at: http://www.genetix.univ-montp2.fr/genetix/genetix.htm [Accessed Dec. 10, 2009] (in French).
Bondar, G. 1928. Aleyrodideos of Brazil. Boletim do Laboratório de Pathologia Vegetal do Estado da Bahia 5: 1–37 (in Portuguese).
Brown, J.K.; Frohlich, D.R.; Rosell, R.C. 1995. The sweetpotato or silverleaf whiteflies: biotypes of Bemisia tabaci or a species complex? Annual Review of Entomology 40: 511–534.
Byrne, D.N.; Bellows Jr, T.S. 1991. Whitefly biology. Annual Review of Entomology 36: 431–457.
Costa, A.S.; Costa, C.L.; Sauer, H.F.G. 1973. Outbreak of whitefly in crops of Parana and Sao Paulo. Anais da Sociedade Entomológica do Brasil 2: 20–30 (in Portuguese, with abstract in English).
De Barro, P.J. 1995. Bemisia tabaci biotype B, a review of its biology, distribution and control. CSIRO Division Entomology Technical Paper 36: 1–58.
De Barro, P.J.; Hart, P.J. 2000. Mating interactions between two biotypes of the whitefly, Bemisia tabaci (Hemiptera: Aleyrodidae) in Australia. Bulletin of Entomological Research 90: 103–112.
Fontes et al. Genetic structure of Bemisia tabaci in Brazil
53
Sci. Agric. v.69, n.1, p.47-53, January/February 2012
De Barro, P.J.; Scott, K.D.; Graham, G.C.; Lange, C.L.; Schutze, M.K. 2003. Isolation and characterization of microsatellite loci in Bemisia tabaci. Molecular Ecology Notes 3: 40–43.
De Barro, P.J. 2005. Genetic structure of the whitefly Bemisia tabaci in the Ásia-Pacific region revealed using microsatellite markers. Molecular Ecology 14: 3695–3718.
De Barro, P.J.; Trueman, J.W.H.; Frohlich, D.R. 2005. Bemisia argentifolii (Hemiptera: Aleyrodidae) is a race of B. tabaci: the molecular genetic differentiation of B. tabaci populations around the world. Bulletin of Entomological Research 95: 193–203.
De Barro, P.J.; Liu, S.; Boykin, L.M.; Dinsdale A.B. 2011. Bemisia tabaci: A Statement of Species Status. Annual Review of Entomology 56: 1-19.
Dinsdale, A.; Cook, L.; Riginos, C.; Buckley, Y.M.; De Barro, P. 2010. Refined global analysis of Bemisia tabaci (Hemiptera: Sternorrhyncha: Aleyrodoidae: Aleyrodidae) mitochondrial cytochrome oxidase I to identify level genetic boundaries. Annals of the Entomological Society of America 103: 196–208.
Evanno, G.; Regnaut, S.; Goudet, J. 2005. Detecting the number of clusters of individuals using the software structure: a simulation study. Molecular Ecology 14: 2611–2620.
Fontes, F.V.H.M.; Colombo, C.A.; Lourenção, A.L. 2010. Molecular characterization and genetic divergence of Bemisia tabaci (Genn.) (Hemiptera: Aleyrodidae) on different crops and growing areas. Neotropical Entomology 39: 221–226 (in Portuguese, with abstract in English).
Jones, D.R. 2003. Plant viruses transmitted by whiteflies. European Journal of Plant Pathology 109: 195–219.
Kwok, S.; Kellog, D.E.; McKinney, N.; Spasic, D.; Goda, L.; Levenson, C.; Sninsky J.J. 1990. Effects of primer-template mismatches on the polymerase chain reaction: human immunodeficiency virus 1 model studies. Nucleic Acids Research 18: 999–1005.
Lima, L.H.C.; Návia, D.; Inglis, P.W.; Oliveira, M.R.V. 2000. Survey of Bemisia tabaci (Gennadius) (Hemiptera: Aleyrodidade) biotypes in Brazil using RAPD markers. Genetics and Molecular Biology 23: 1–5.
Lima, L.H.C.; Campos, L.; Moretzsohn, M.C.; Návia, D.; Oliveira, M.R.V. 2002. Genetic diversity of Bemisia tabaci (Genn.) populations in Brazil revealed by RAPD markers. Genetic and Molecular Biology 25: 217–223.
Lourenção, A.L.; Nagai, H. 1994. Outbreaks of Bemisia tabaci in the São Paulo State, Brazil. Bragantia 53: 53–59 (in Portuguese, with abstract in English).
Mantel, N.A. 1967. The detection of disease clustering and a generalised regression approach. Cancer Research 27: 209–220.
Nei, M. 1978. Estimation of average heterozygosity and genetic distance from a small number of individuals. Genetics 89: 583–590.
Oliveira, M.R.V.; Henneberry, T.J.; Andreson, P. 2001. History, current status and collaborative research projects for Bemisia tabaci. Crop Protection, 20: 709–723.
Perring, T.M.; Cooper, A.D.; Rodriguez, R.J.; Farrar, C.A.; Bellows, T.S.J. 1993. Identification of a whitefly species by genomic and behavioral studies. Science 259: 74–77.
Perring, T.M.; Symmes, E.J. 2006. Courtship behavior of Bemisia argentifolii (Hemiptera: Aleyrodidae) and whitefly mate recognition. Annals of the Entomological Society of America 99: 598–606.
Pritchard, J.K.; Stephens, M.; Donnelly, P. 2000. Inference of population structure using multilocus genotype data. Genetics 155: 945–959.
Pritchard, J.K.; Wen, W. 2004. Documentation for STRUCTURE software. The University of Chicago Press, Chicago.
Raymond, M.; Rousset, F. 1995. Genepop version 2.0: population genetics software for exact tests and ecumenicism. Journal of Heredity 86: 248–249.
Rice, W.R. 1989. Analysing tables of statistical tests. Evolution 43: 223–225.
Rocha, K.C.G.; Marubayashi, J.M.; Navas-castillo, J.; Yuki, V.A.; Wilcken, C.F.; Pavan, M.A.; Krause-Sakate, R. 2011. Only the B biotype of Bemisia tabaci is present on vegetables in São Paulo State, Brazil. Scientia Agricola 68: 120–123.
Rohlf, F.J. 1989. NTSYS-Pc: Numerical Taxonomy and Multivariate Analysis System. Exeter Publisher, New York, NY, USA.
Simón, B.; Cenis, J.L.; De La Rúa, P. 2007. Distribution patterns of the Q and B biotypes of Bemisia tabaci in the Mediterranean Basin based on microsatellite variation. Entomologia Experimentalis et Applicata 124: 327–336.
STATSOFT. Statistics for Windows.1999: Computer Program Manual]. StatSoft, Tulsa. OK, USA.
Tsagkarakou, A.; Roditakis, N. 2003. Isolation and characterization of microsatellite loci in Bemisia tabaci (Hemiptera: Aleyrodidae). Molecular Ecology Notes 3: 196–198.
Tsagkarakou, A.; Tsigenopoulos, C.S.; Gorman, K.; Lagnel, J.; Bedford, I.D. 2007. Biotype status and genetic polymorphism of the withefly Bemisia tabaci (Hemiptera: Aleyrodidae) in Greece: mitochondrial DNA and microsatellites. Bulletin of Entomological Research 97: 29–40.
Weir, B.S. 1996. Genetic Data Analysis II: Methods for Discrete Population Genetic Data. Sinauer, Sunderland, UK.
Weir, B.S.; Cockerham, C.C. 1984. Estimating F-Statistics for the analysis of population structure. Evolution 38: 1358–1370.