structure to function : case studies of hotdog-fold
TRANSCRIPT

University of New MexicoUNM Digital Repository
Chemistry ETDs Electronic Theses and Dissertations
8-28-2012
Structure to function : case studies of hotdog-foldsuperfamily thioesterases from Escherichia coli.John A. Latham
Follow this and additional works at: https://digitalrepository.unm.edu/chem_etds
This Dissertation is brought to you for free and open access by the Electronic Theses and Dissertations at UNM Digital Repository. It has beenaccepted for inclusion in Chemistry ETDs by an authorized administrator of UNM Digital Repository. For more information, please [email protected].
Recommended CitationLatham, John A.. "Structure to function : case studies of hotdog-fold superfamily thioesterases from Escherichia coli.." (2012).https://digitalrepository.unm.edu/chem_etds/26

John A. Latham Candidate
Chemistry and Chemical Biology
Department
This dissertation is approved, and it is acceptable in quality and form for publication:
Approved by the Dissertation Committee:
Dr. Debra Dunaway-Mariano, Chairperson
Dr. Patrick Mariano
Dr. David Bear
Dr. Charles Melançon

STRUCTURE TO FUNCTION: CASE STUDIES OF
HOTDOG-FOLD SUPERFAMILY THIOESTERASES
FROM ESCHERICHIA COLI
BY
JOHN A LATHAM
B.S., Eastern New Mexico University
M.S., Eastern New Mexico University
DISSERTATION
Submitted in Partial Fulfillment of the
Requirements for the Degree of
Doctor of Philosophy
Chemistry
The University of New Mexico
Albuquerque, New Mexico
July, 2012

iii
ACKNOWLEDGMENTS
This dissertation is the fruit of not only hard work but also the support of
colleagues, friends and family who need to be acknowledged.
I would first like to express my appreciation and gratitude to Dr. Debra Dunaway-
Mariano. DDM's advice and guidance through research problems and career decisions
has proven to be invaluable. More so was her willingness to allow me to work freely on
many projects simultaneously and the encouragement to think independently. DDM's
style of mentorship was exactly what I needed and I am forever in her debt.
I would also like to thank Dr. Patrick Mariano for the synthesis advice, the
opportunity to work on the lignin peroxidase project and for his candidness. It has also
been a pleasure working for Dr. Mariano as his teaching assistant and I appreciate him
allowing me to try on my teaching shoes.
I gratefully acknowledge my remaining committee members Dr. David Bear and
Dr. Charles Melançon for their input and their patience.
Running experiments can sometimes be monotonous and painful but I was
fortunate to have worked with a wonderful bunch of people who have become like a
second family to me. Thanks to all my labmates but especially Ty, Luke, Li, Min, Hua,
Sarah, and Andrea for keeping things fun, for those many great conversations out of
nowhere, providing me with advice, and their friendship. In addition, a good portion of
the synthesis of CoA compounds and proton NMR was carried out by an outstanding
undergraduate student - thank you Gabe Maestas for that hard work.
I am also grateful for the support of my parents and brothers. And finally to my
wife, Kimberly, if it wasn't for her I would have never come back to school. More
importantly, she sacrificed our time together so that I could work long hours to finish in a
timely manner. If it wasn't for her love, support, and understanding none of this would be
possible. For that I am eternally grateful.

iv
STRUCTURE TO FUNCTION: CASE STUDIES OF
HOTDOG-FOLD SUPERFAMILY THIOESTERASES
FROM ESCHERICHIA COLI
BY
JOHN A LATHAM
B.S., Eastern New Mexico University
M.S., Eastern New Mexico University
DISSERTATION
Submitted in Partial Fulfillment of the
Requirements for the Degree of
Doctor of Philosophy
Chemistry
The University of New Mexico
Albuquerque, New Mexico
July, 2012

v
STRUCTURE TO FUNCTION: CASE STUDIES OF HOTDOG-FOLD
SUPERFAMILY THIOESTERASES FROM ESCHERICHIA COLI
JOHN A. LATHAM
B.S., Chemistry, Eastern New Mexico University, 2007
M.S., Chemistry, Eastern New Mexico University, 2008
Ph.D., Chemistry, University of New Mexico, 2012
ABSTRACT
My doctoral research primarily focuses on the Escherichia coli hotdog-fold
thioesterases ydiI and ybgC.
The ydiI gene is colocalized in the operon ydiHIJ. A substrate screen provided
evidence that YdiI prefers aryl-CoA substrates and discriminated against the analogous
aryl-ACP, unlike the paralog YbdB which works on 2,4-DHB-EntB in the enterobactin
synthesis pathway. A bioinformatic approach showed that in some bacteria, ydiI is
colocalized with genes from the menaquinone pathway. YdiI was shown to catalyze the
hydrolysis of DHNA-CoA with physiological relevance (kcat/KM ~ 105). Furthermore, the
E. coli YdiI- strain was shown to have perturbed growth, in good agreement with other
menaquinone enzyme knockout experiments. Taking into account the evidence provided,
YdiI is likely the DHNA-CoA thioesterase in the menaquinone pathway.
Within the substrate binding pocket, changes to the YdiI Val68 to the YbdB
equivalent of Met resulted in perturbed catalytic efficiency towards lauroyl-CoA,
however not towards its physiological substrate DHNA-CoA. The YbdB M68V mutant
vi
resulted in increase efficiency towards lauroyl-CoA and DHNA-CoA, seemingly making
it a gatekeeper. Secondly, YdiI catalyzes the hydrolysis of acyl-CoA's using a Glu63,
His54, and Gln48 triad determined by mutagenesis experiments. The utilization of 18
O
incorporation and rapid-quench techniques provided insight into YdiI's catalytic
mechanism. A single phase multiple turnover reaction and the incorporation of 18
O in
single turnover reactions suggests that ydiI uses a general base catalytic mechanism
where Glu63 is the activating residue.
The second E. coli hotdog-fold thioesterase protein discussed within is YbgC.
YbgC is encoded by the first ORF of the tol-pal gene cluster. Previous work on the H.
influenzae homologue demonstrated affinity for short chain acyl-CoA's and tandem
affintity purificiation experiments showed E. coli YbgC co-purifies with ACP. No
previous attempts to screen for acyl-ACP has been made. To screen YbgC for ACP
activity, a method was developed to stoichiometrically construct acyl-ACP's, using
apoACP, BF1558 acyl-transferase and acyl-CoA. The E. coli YbgC demonstrated
preference for long chain acyl-CoA's and their analogous acyl-ACPs. To understand the
nature of ACP binding to YbgC, SAXS analysis was carried out on the complex
demonstrating that 2 ACP molecules bind to 1 dimer of YbgC.

vii
ABBREVIATIONS
A Adenosine/Alanine
AA Amino Acid
ADP Adenosine 5’-diphosphate
ACP Acyl-carrier protein
AMP Adenosine 5’-monophosphate
ATP Adenosine 5’-triphosphate
ArCP Aryl-carrier protein
Arg/R Arginine
Asn/N Asparigine
Asp/D Aspartic acid
ATCC American Type Culture Collection
Bp Base-Pair
Blast Basic Local Alignment Search Tool
BSA Bovine Serum Albumin
C Cysteine
CoA/CoASH Co-enzyme A
cDNA Complementary Deoxynucleic acid
CV Column volume
Da Dalton
DHB Dihydroxybenoate
DHNA Dihydroxynapthoic acid
viii
DNA Deoxyribonucleic acid
DI H2O Distilled and deionized water
3-D Three dimensional
DMSO Dimethyl sulfoxide
DTNB 5,5’-dithio-bis-(2-nitrobenzoic acid)
DTT Dithiothreitol
E Enzyme
EC Enzyme Commission
E.coli Escherichia Coli
EDTA Disodium ethylenediamine tetraacetate
ESI-MS Electrospray ionization Mass spectrometry
EXPASY Expert protein analysis system
FAS Fatty Acid synthase
FPLC Fast Protein Liquid Chromatography
g Gram
GC/MS Gas chromatography/Mass spectrometry
GEO Gene expression ominbus
Gln/Q Glutamine
Glu/E Glutamte
Gly/G Glycine
h Hour
HBA Hydroxybenozoic acid
H-bond Hydrogen bond
ix
HEPES 4-(2-Hydroxyethyl)-1-piperazineethanesulfonic acid
His/H Histidine
HPLC High Performance Liquid Chromatography
Ile/I Isoleucine
IPTG Isopropylthio-β-galactoside
K Rate constant
Kb Kilo-base pair
kcat Enzyme turnover rate
Kd Dissociation constant
Km Michaelis-Menten constant
Ki Inhibition Constant
kob Observed rate constant
kDa Kilo-Dalton
L Liter or Leucine
LB Luria-Bertani
Lys/K Lysine
mg Milligram
min Minute
ml Milliliter
mmole Milimole
MS Mass spectrum
MW Molecular Weight
mRNA Message Ribonucleic acid

x
Met/M Methionine
ng Nanogram
NADH β-Nicotinamide adenine dinucleotide, reduced form
NCBI National Center for Biotechnology Information
OD Optical density
ORF Open reading frame
OSB o-Succinylbenzoate
pfu Plaque forming units
PDB Protein Data Bank
PCR Polymerase Chain Reaction
PAGE Polyacrylamide gel electrophoresis
Phe/F Phenylalanine
Pi inorganic phosphate
PPi Pyrophosphate
pI Isoelectric point
Pro/P Proline
PS Polysaccharide
RNA Ribonucleic acid
RT Room Temperature
rpm Rotation per minute
s Second
S Substrate/Serine
SAH S-adenosyl-L-homocysteine

xi
SAM S-adenosyl-methionine
SAXS Small angle x-ray scattering
SDS Sodium dodecyl sulfate
SEPHCHC 2-succinyl-5-enolpyruvyl-6-hydroxy-3-cyclohexene-1-carboylic
acid
SHCHC (1R,6R)-2-succinyl-6-hydroxy-2,4-cyclohexadiene-1-carboxylic
acid
SIE Solvent isotope effect
SN Nucleophilic substitution
TAP Tandem affinity purification
TEII Thioesterase II
Thr/T Threonine
Tris Tris[hydroxymethyl]aminomethane
Trp/W Tryptophan
Tyr/Y Tyrosine
U Uridine
µM Micromolar
UV Ultraviolet
Val/V Valine
Vmax Maximum Velocity
V Volume
WT Wild type
4HBA 4-hydroxybenzoyl-CoA
4HBAL 4-hydroxybenzoyl-CoA ligase

xii
4HBT 4-hydroxybenzoyl-CoA thioesterase
4CBAL 4-chlorobenozyl-CoA ligase

xiii
TABLE OF CONTENTS
CHAPTER 1: AN INTRODUCTION TO THE HOTDOG-FOLD
THIOESTERASE ENZYME SUPERFAMILY .............................................................1
1.1 Biological Significance of Thioesters and Thioesterases ..........................................1
1.2 Thioesterases of the Hotdog-fold Enzyme Superfamily ...........................................3
1.3 Structural divergence of the 4HBT and 4HBT-like hotdog fold
thioesterases clades ............................................................................................................6
1.4 Divergence in the Hotdog-fold Thioesterase Cellular Functions in E. coli ...........11
1.4.1 Hotdog-fold thioesterase YbdB is housekeeper of the enterobactin
synthesis pathway in E. coli.............................................................................................11
1.4.2 – The phenylacetic acid degradation pathway in E. coli .....................................12
1.4.3 - E. coli YbaW and TEII (Thioesterase II) ...........................................................14
1.4.4 - E. coli YbgC...........................................................................................................16
1.4.5 E. coli i ......................................................................................................................17
1.5 Summary .....................................................................................................................19
References .........................................................................................................................21
CHAPTER TWO: DETERMINING THE PHYSIOLOGICAL ROLE OF
THE ESCHERICHIA COLI HOTDOG-FOLD THIOESTERASE YDII ..................29
2.1 Introduction ................................................................................................................29
2.2 Methods and Materials ..............................................................................................33
2.2.1 Materials ..................................................................................................................33
2.2.2 Preparation of wild-type E. coli YdiI and EntH ..................................................33
2.2.3 Determination of the steady state kinetic constants.............................................34

xiv
2.2.4 Growth curve measurements for wild-type and YdiI-knockout
Escherichia coli strains ....................................................................................................35
2.3 RESULTS AND DISCUSSION ................................................................................36
2.3.1 YdiI substrate screen for determination of biochemical function ......................36
2.3.2 Wild-type and ydiI gene knockout aerobic and anaerobic growth curves ........41
2.4 Conclusions .................................................................................................................43
References .........................................................................................................................45
CHAPTER THREE: FROM FORM TO FUNCTION: A STRUCTURAL
APPROACH TO EXAMINE THE DIVERGENCE OF YDII AND YBDB
THIOESTERASES FROM ESCHERICHIA COLI ......................................................50
3.1 Introduction ................................................................................................................50
3.2 Materials and Method ...............................................................................................54
3.2.1 Materials ..................................................................................................................54
3.2.2 Site-directed mutagenesis .......................................................................................55
3.2.3 Steady-state kinetic analysis...................................................................................55
3.2.4 Inhibition of the WT enzyme-catalyzed hydrolysis of 4-hydroxybenzoyl-
CoA ....................................................................................................................................55
3.2.5 18
O-Solvent labeling experiments. ........................................................................56
3.2.6 Synthesis of 14
C radiolabled benzyol-CoA ............................................................57
3.2.7 Rapid-quench studies of the wild-type YdiI catalyzed hydrolysis of
benzoyl-CoA under single and multiple turnover conditions ......................................58
3.2.8 Stopped-flow kinetic experiments of wild-type YdiI ...........................................59
3.2.9 Solvent kinetic isotope effects on WT YdiI and YbdB ........................................60

xv
3.3 Results and Discussion ...............................................................................................60
3.3.1 Steady-state kinetics of the active site mutants E63A, Q48A, H54A,
H89A, and S67A ...............................................................................................................60
3.3.2 Comparing the pH profiles of YbdB and YdiI .....................................................64
3.3.3 18
O incorporation into benzoic acid by WT YdiI and the mutants S67A
and E63D...........................................................................................................................65
3.3.4 Solvent kinetic isotope effects on YdiI and YbdB ................................................70
3.3.5 Pre-steady-state kinetics analyzed by stopped-flow absorbance ........................71
3.3.6 Reaction time course analysis ................................................................................73
3.3.7 Kinetic analysis of substrate binding residues .....................................................77
3.3.8 Inhibition of WT YdiI and YbdB ..........................................................................80
3.4 Conclusions .................................................................................................................83
References .........................................................................................................................86
CHAPTER FOUR: BIOLOGICAL RANGE AND DIVERGENCE OF
FUNCTION IN THE HOTDOG-FOLD THIOESTERASE YDII ..............................88
4.1 Introduction ................................................................................................................88
4.2 Methods and Materials ..............................................................................................89
4.2.1 Materials ..................................................................................................................89
4.2.2 Preparation of wild-type PA1618 ..........................................................................89
4.2.3 Preparation of PA1617 ...........................................................................................90
4.2.4 PA1618 activity assays ............................................................................................91
4.2.5 PA1617 activity assays ............................................................................................91
4.2.6 Bioinformatic analysis of YdiI and orthologues ...................................................92

xvi
4.3 Results and Discussion ...............................................................................................93
4.3.1 Bioinformatic analysis of YdiI ...............................................................................93
4.3.2 Substrate specificity profiles of the thioesterase PA1618 and ligase
PA1617 ..............................................................................................................................98
4.4 Conclusions ...............................................................................................................101
References .......................................................................................................................103
CHAPTER FIVE: ANALYSIS OF THE PROTEIN-PROTEIN
INTERACTIONS BETWEEN ESCHERICHIA COLI YBGC
THIOESTERASE AND ACYL CARRIER PROTEIN .............................................104
5.1 Introduction ..............................................................................................................104
5.2 Materials and Method .............................................................................................108
5.2.1 Materials ................................................................................................................108
5.2.2 E. coli ybgC gene cloning and expression and protein purification ..................108
5.2.3 Steady-state kinetic constant determination ......................................................109
5.2.4 Synthesis of acyl-holoACP ...................................................................................110
5.2.5 Inhibition of YbgC-catalyzed hydrolysis of isobutyryl-CoA ............................111
5.2.6 Small angle X-ray scattering analysis of the YbgC-β-ketopropanone-
holoACP complex ...........................................................................................................112
5.3 Results and Discussion .............................................................................................113
5.3.1 Preparation of acyl-holoACP ...............................................................................113
5.3.2 Substrate specificity of E. coli YbgC ...................................................................118
5.3.3 Inhibition of E. coli YbgC-catalyzed hydrolysis of isobutyryl-CoA by β-
ketopropionyl-CoA, apoACP, and β-ketopropionyl-holoACP ..................................120

xvii
5.3.4 Small angle x-ray scattering of the YbgC-β-ketopropanone-holoACP
complex ...........................................................................................................................122
5.4 Summary ...................................................................................................................125
References .......................................................................................................................127
CHAPTER SIX: BACILLUS HALODURANS GENTISYL-COA
THIOESTERASE MECHANISM: PRE-STEADY STATE KINETICS,
STEADY STATE KINETICS AND ACTIVE SITE PROPERTIES ........................130
6.1 Introduction ..............................................................................................................130
6.2 Materials and Methods ............................................................................................134
6.2.1 Materials ................................................................................................................134
6.2.2 Subcloning, expression, and purification ............................................................134
6.2.3 Steady-state kinetic analysis of the WT BH1999 and the D16E mutant ..........135
6.2.4 Synthesis of 14
C radiolabled 3-hydroxybenzyol-CoA ........................................136
6.2.5 Rapid-quench studies of the WT BH1999 and D16E mutant catalyzed
hydrolysis of 3-hydroxybenzoyl-CoA under single and multiple turnover
conditions ........................................................................................................................137
6.2.6 Trapping the catalytic aspartate with hydroxylamine ......................................138
6.3 Results and Discussion .............................................................................................138
6.3.1 Steady-state kinetic analysis of wild-type BH1999 and the mutant D16E .......138
6.3.2 Kinetic analysis of wild-type BH1999 .................................................................140
6.3.3 Trapping the covalent enzyme intermediate by reaction with
hydroxylamine ................................................................................................................144
6.4 Conclusion: Catalytic Mechanism ..........................................................................146

xviii
References .......................................................................................................................150
APPENDIX .....................................................................................................................151
A.1 Published Collaborative Work ..............................................................................151
A1.1 Regioselectivity of Enzymatic and Photochemical Single Electron
Transfer Promoted Carbon-Carbon Bond Fragmentation Reactions of
Tetrameric Lignin Model Compounds ........................................................................151
A.1.2 Investigation of the Catalytic Mechanism of the Hotdog-fold Enzyme
Superfamily Pseudomonas sp. strain CBS3 4-Hydroxybenzoyl-CoA
Thioesterase+ ..................................................................................................................153
A.2 Manuscript of Collaborative Work Submitted for Publication..........................155
A2.1 Regioselectivity of Enzymatic and Photochemical Single Electron
Transfer Promoted Carbon-Carbon Bond Fragmentation Reactions of
Tetrameric Lignin Model Compounds ........................................................................155
A2.2 Investigation of the Catalytic Mechanism of the Hotdog-fold Enzyme
Superfamily Pseudomonas sp. strain CBS3 4-Hydroxybenzoyl-CoA
Thioesterase+ ..................................................................................................................198

1
CHAPTER ONE
AN INTRODUCTION TO THE HOTDOG-FOLD THIOESTERASE
ENZYME SUPERFAMILY
1.1 Biological significance of thioesters and thioesterases
Biological thioesters include acylated glutathione, acylated protein cysteine,
acylated or aroylated coenzyme A (CoA) and acylated or aroylated holo acyl carrier
protein (ACP) (Figure 1.1). Thioesters play important cellular roles in energy production,
cell cycling, signal transduction, and gene regulation (1). Thioester bond hydrolysis
results in the formation of the free thiol and free acid. The free acid may vary in polarity
and shape, whereas the free thiol is typically either the pantothene arm of coenzyme A
(CoA) or a holo acyl carrier protein (ACP) or the cysteine residue of a protein.
Carboxylic acids are converted to thioesters for the purpose of biosynthesis (polyketide
synthesis) (2), biodegradation (halogenated aromatic degradation) (3), and protein
modification (S-palmitoylation of cysteine residues) (4).

2
Figure 1.1: Commonly formed natural thioesters. From top to bottom: acyl-CoA, acyl-
holo-ACP, acyl-cysteine, and acyl-glutathione.
The two enzyme families that have evolved to catalyze the hydrolysis of
thioesters are the α/β-fold hydrolase enzyme superfamily and the hotdog-fold enzyme
superfamily (5, 6). Thioesterases from both enzyme superfamilies families have been
found to play roles in primary and secondary metabolism. In eukaryotes, thioesterases are
present in the cytosol, endoplasmic reticulum, mitochondria, or perioxisomes (1).
Although the focus of this chapter is the hotdog-fold family, it is worthwhile to mention
key aspects of the α/β-fold hydorylase fold family.
The α/β hydrolase fold was first identified by comparing five amino acid
sequence and functionally divergent hydrolases (7). The canonical α/β hydrolase fold
consists of a parallel, eight-stranded β-sheet surrounded by α-helices on both sides

3
(Figure 1.2.A) (5). Some α/β-fold hydrolases, e.g. the human acyl-CoA thioesterase 4
(Figure 1.2.B), also contain a small cap domain. The X-ray crystal structures of numerous
α/β-fold thioesterases have been deposited in the Protein Data Bank (PDB). Each
structure shows strict conservation of a Ser-His-Asp catalytic triad.
A B
Figure 1.2: A) Representation of the topology of the canonical α/β hydrolase fold. The β-
strands are represented by grey arrows and the α-helices are represented by white
cylinders. The black dots represent the location of the catalytic triad. B) The crystal
structure of the human acyl-CoA thioesterase 4 (PDB ID: 3K2I). The β-strands are
represented in blue and the α-helices are represented in red.
1.2 Thioesterases of the hotdog-fold enzyme superfamily
The well-conserved hotdog-fold consists of an elongated α-helix (“sausage”)
encompassed by 5 anti-parallel β-strands (“bun”). This fold was first observed for the
dehydratase/isomerase enzyme FabA (Figure 1.3.A) (8). Typically, the topology of the
core hotdog-fold from the N-terminus to the C-terminus is β1-α-β2-β3-β4-β5 (Figure
1.3.B). In addition to the core domain, some hotdog-fold family members contain

4
sequence inserts between two elements of the core fold. The minimal functional unit of
the hotdog-fold family member is a homodimer. The active site is located at the interface
of two subunits. The catalytic residues are located on the loop that connects with the N-
terminus of the -helix of one subunit and the middle section of the α-helix on the second
subunit. The hotdog-fold enzyme superfamily includes dehydratases/isomerases, enol-
CoA hydratases, and acyl-CoA and acyl-ACP thioesterases. Recently, the hotdog-fold
domain of the non-reducing polyketide synthase (NR-PKS) PksA was shown to function
as a cyclase/aromatase (9). Characteristic of hot-dog fold members is the degeneracy in
sequence. Family members typically share as low as 10-15% sequence identity, while
maintaining similar tertiary structures (10).
A B
Figure 1.3: A) The apo- monomer and (B) apo-dimer structures of Escherichia coli FabA
(PDB ID: 1MKA).
The vast majority of the hotdog-fold family members are thioesterases. Hotdog-
fold thioesterases are diverse in cellular function and span all three branches of life (6).
The hotdog-fold superfamily has been divided into six subfamilies distinguished by their
overall architecture (6). The largest of the six subfamilies is the acyl-CoA thioesterase
subfamily, it is broadly represented throughout the prokaryotic and eukaryotic kingdoms.
Members of this subfamily catalyze the hydrolysis of acyl-CoA thioesters to the

5
corresponding free fatty acids and the CoASH (1). Included in the acyl-CoA thioesterase
subfamily are the human enzymes brown fat adipose tissue thioesterase (BFIT) and
cytoplasmic acetyl-CoA hydrolase (CACH) (11, 12). The second subfamily is the YbgC-
like subfamily. The prototype of this subfamily, E. coli YbgC is the topic of Chapter 5 of
this thesis. Although crystal structures have been solved for YbgC (E. coli YbgC – PDB
ID: 1S5U and H. pylori YbgC – PDB ID: 2PZH), the physiological role of this
thioesterase remained unclear. Two studies have been performed to characterize the
substrate preference of YbgC in Haemophilus influenzae and Heilicobacter pylori
however, with conflicting results. The H. influenzae YbgC was reported to prefer short
chain acyl-CoA's as substrates whereas H. pylori YbgC was reported to be most active
with that of long chain acyl-CoA's (13, 14).
The third hotdog-fold subfamily is the FAT subfamily which is comprised of long
chain acyl-ACP thioesterases found mainly in plants. Members of the FAT subfamily
hydrolyze palmitoyl- or oleoyl-holo-ACP to form holo-ACP and the corresponding fatty
acid (15). The fourth subfamily is the TesB-like subfamily. Members of this family
possess a double hotdog fold and are known to catalyze the hydrolysis of the fatty acyl-
CoA thioesters palmitoyl-CoA and myristoyl-CoA. The TesB-like subfamily is
represented in eukaryotes and bacteria (16).
The remaining two hotdog-fold thioesterases subfamilies are the 4HBT class I
(hereafter referred to as 4HBT) and the 4HBT class II (hereafter referred to as 4HBT-
like). The 4HBT-like subfamily is based upon the overall structure of the Arthrobacter
sp. strain SU 4-hydroxybenzoyl-CoA thioesterase whereas the 4HBT subfamily is based
on the overall structure of the Pseudomonas sp. CBS3 4-hydroxybenzoyl-CoA

6
thioesterase. Both thioesterases catalyze the hydrolysis of 4-hydroxybenzoyl-CoA
(4HBA-CoA) to the acid and CoASH within the 4-chlorobenzoate (4CBA) catabolic
pathway, yet they possess a structurally divergent catalytic site architecture (17–20).
1.3 Structural divergence of the 4HBT and 4HBT-like hotdog-fold thioesterases
clades
The 4HBT subfamily, as mentioned previously, is made up of structural homologs
of Pseudomonas sp. CBS3 4HBT. The topology of the core structure of the 4HBT
monomer, as depicted in Figure 1.4a, is β1-α1-α2-β2-β3-β4-β5-β6. Members of the 4HBT
subfamily have decorated structures including the insertion of a stretch of sequence
between two elements of secondary structure, which extends the length of the connecting
loop. Additionally, 4HBT members differ in sequence length and/or secondary structure
at the N or C-termini. However, all 4HBT members conserve the position of their
respective active sites at the interface of the two hotdog-fold monomers. The catalytic
scaffold consists of residues from one monomer at the N-terminus of the long α-helix, the
loop between β1 and the central α-helix and the center of the central α-helix from the
other monomer (Figure 1.4 B).

7
A B
Figure 1.4: A) Monomeric and (B) dimeric structure of Pseudomonas sp. CBS3 4HBT
(PDB ID: 1LO8).
The catalytic site of the 4HBT thioesterase clade members is comprised of two
residues that are positioned, on the same subunit, at the N-terminus of the -helix and at
the loop that connects with that N-terminus. The catalytic residues of the prototype,
Pseudomonas sp. CBS3 4-hydroxybenzoyl-CoA thioesterase, consist of Tyr24 and
Asp17. The Tyr24, located at the N-terminus of the α-helix, is responsible for the
polarization of the thioester carbonyl group via hydrogen bond donation from its
backbone amide NH (Figure 1.5A). The carboxylate side chain, from the nearby Asp17
(located on the loop bridging β1 and the α-helix), functions as a nucleophile in the
cleavage of the thioester C-S bond (21). Substrate binding is assisted by two residues:
Asp32 and Trp47. Asp32, located on the -helix of the opposing subunit, interacts with
the substrate ring hydroxyl group via hydrogen bonds formed with two bridging water
molecules (23). Trp47, which is also located on the opposing subunit, forms a hydrogen
bond with the substrate benzoyl ring hydroxyl group using its indole side chain NH (see
Figure 1.5B).

8
A B
Figure 1.5: A) Active site of Pseudomonas sp. CBS3 4HBT shown with the truncated 4-
hydroxyphenacyl-CoA substrate analog inhibitor (grey) (PDB ID: 1LO8). B) Substrate
binding contributions from W47 and D32 of the same structure.
The prototype of the 4HBT-like subfamily, Arthrobacter sp. strain SU 4-
hydroxybenzoyl-CoA thioesterase, maintains a α1- β1-β2-α2-β3-β4-β5-β6 topology and the
typical hotdog-fold structure shown in Figure 1.6A. Comparison of the active site
structures of the Pseudomonas sp CBS3 4-hydroxybenzoyl-CoA thioesterase and the
Arthrobacter sp. strain SU 4-hydroxybenzoyl-CoA thioesterase reveals two distinct
pathways of evolution (Figure 1.6B).
A B

9
Figure 1.6: A) The dimeric structure of Arthrobacter sp. strain SU 4-hydroxybenzoyl-
CoA thioesterase (PDB ID: 3R32). B) Superposition of the Pseudomonas sp. CBS3 (red)
and Arthrobacter sp. strain SU 4-hydroxybenzoyl-CoA thioesterase (blue) dimeric
structures.
The active site of 4HBT-like thioesterase catalyzes the hydrolysis of the thioester
by using the -helix N-terminus residue of one subunit to polarize the substrate thioester
C=O, and a carboxylate residue (Glu or Asp), located on the long -helix of the opposing
subunit, to function in base or nucleophilic catalysis. In addition, the active site usually
contains an amide residue (Asn or Gln), which is contributed by the -helix N-terminus
loop of the subunit that opposes that contributing the catalytic carboxylate residue. For
example, in the case of the clade prototype Arthrobacter sp. strain SU 4HBT, the Gln58
(counterpart to the Ps. 4HBT Asp32) and Gly56 (counterpart to Ps. 4HBT Tyr24)
activate the thioester C=O via hydrogen bonding as is shown in Figure 1.7. The Glu73,
located on the α-helix of the opposing subunit functions in nucleophilic catalysis. The
Thr77 located on the same subunit as the Glu73 nucleophile, orients a water molecule
that attacks the anhydride intermediate, leading to product (22).

10
Figure 1.7: Active site of Arthrobacter sp. strain SU 4-hydroxybenzoyl-CoA thioesterase
(blue) shown with truncated 4-hydroxyphenacyl-CoA ligand (grey) (PDB ID: 3R3F).
Remarkably, the Arthrobacter sp. strain SU and Pseudomonas sp. CBS3 4-
hydroxybenzoyl-CoA thioesterases evolved from different hotdog-fold ancestors to
perform catalysis in the same biochemical context, and with the same catalytic efficiency.
Soil-dwelling microbes such as Pseudomonas sp. CBS3 and Arthrobacter sp. SU, are
capable of surviving with 4-chlorobenzoate as their sole carbon source (17, 18). The
metabolic pathway of the dehalogenation of 4-chlorobenzoate is depicted in Figure 1.9.
The initiating step of 4-chlorobenzoate catabolism is the 4-chlorobenzoate ligation to
coenzyme A catalyzed by 4-chlorobenzoate ligase (CBAL). This step is followed by the
dehalogenation of the 4-chlorobenzoyl-CoA to 4-hydroxybenzoyl-CoA catalyzed by
chlorobenzoyl-CoA dehalogenase. The last step in the dehalogenation pathway is the
liberation of the free 4-hydroxybenzoate from the 4-hydroxybenzoyl-CoA catalyzed by

11
4HBT. As previously mentioned, the 4CB pathway 4HBT from Pseudomonas sp. CBS
and Arthrobacter sp. SU are the prototypes of two distinct clades of the hotdog-fold
enzyme superfamily.
Figure 1.9: The 4-chlorobenozate degradation pathway catalyzed by 4-chlorobenzoate-
CoA ligase, 4-chlorobenzoyl-CoA dehalogenase and 4-hydroxybenozoyl-CoA
thioesterase.
1.4 Divergence in the Hotdog-fold Thioesterase Cellular Functions in E. coli
The genome of Escherichia coli encodes nine hotdog-fold thioesterases: YciA, YbgC,
YbaW, PaaI, YdiI, YbdB, YigI, YiiD and TEII. All but YdiI, YigI and YiiD have been
subjected to some form of functional analysis.
1.4.1 Hotdog-fold thioesterase YbdB is housekeeper of the enterobactin synthesis
pathway in E. coli
During iron-depleted conditions, microorganisms, including bacteria and fungi,
release siderophores, or iron-chelating compounds, to harvest exogenous iron (23). In E.
coli, this siderophore is enterobactin. Enterobactin is synthesized by the enzymes
encoded by the gene cluster entCEBAH, which is under the control of the ferric uptake
regulator (fur). The gene that encodes the hotdog-fold thioesterase EntH (YbdB) is
located within this cluster (24). Biosynthesis of enterobactin proceeds via two pathways,
O SCoA
Cl
O O
Cl
O SCoA
OH
O O
OH
ATP, CoA
PPi, AMP
H2O
Cl
H2O
CoA
CBAL Dehalogenase Thioesterase

12
an upper pathway responsible for synthesizing 2,3-dihydroxybenzoate (2,3-DHB) from
chorismate catalyzed by EntC, EntB, and EntA and the lower pathway (Figure 1.8)
responsible for the construction of the cyclo-tri-2,3-DHB-peptide catalyzed by the
nonribosomal peptide synthetases EntB and EntF (25). Although it does not appear
necessary for a thioesterase to participate in the synthesis of the enterobactin, YbdB (also
to become known as EntH) was shown to play an integral role in rescuing the pathway
when the ArCP domain of EntB becomes misacylated (26–28). It was shown that holo-
EntB could become misaclyated as the result of promiscuous EntD and EntE catalysis.
The EntF stalls which in turn blocks the lower pathway. The thioesterase YbdB frees
misacylated-holo-EntB to holo-EntB thereby ensuring unimpeded enterobactin synthesis.
Figure 1.8: The lower chemical pathway for biosynthesis of enterobactin (26).
1.4.2 The phenylacetic acid degradation pathway in E. coli
E. coli and numerous other bacteria have been previously reported to utilize a
variety of aromatic compounds, including phenylacetic acid, as its sole carbon sources
(29). These bacteria contain the genes that encode enzymes which form the phenylacetic

13
acid catabolic pathway. In E. coli the genes are co-located in a cluster known as paa. This
gene cluster contains 14 genes organized in multiple transcription elements. The three
units transcribed are known as paaABCDEFGHIJK, paaXY and paaZ (Figure 1.10A)
(30). The gene products paaABCDE are analogous to aromatic catabolic oxygenases,
paaK is a phenylacetic acid: CoA ligase and the protein products of the paaFGHIJ genes
have high sequence similarities to fatty acid -oxidation pathway enzymes.
The gene product PaaI is a hotdog-fold enzyme that has demonstrated in vitro
thioesterase activity. From the reported steady state kinetics, PaaI efficiently catalyzes
the hydrolysis of phenylacetyl-CoA and various ring-hydroxylated deriviatives, however
PaaI is ineffective at catalyzing benzoyl-CoA and its hydroxlated derivatives (31). The
dead-end products of the catabolic phenylacetic acid pathway, 2- and 3-
hydroxyphenylacetic acid are s formed by competing spontaneous dehydration of the
putative 1,2-dihydrodiol and 2,3-dihydrodiol pathway intermediates (Figure 1.10B).
PaaI is believed to rescue the CoA from phenylacetyl-CoA in the event of a stalled
downstream enzyme as well as to rescue CoA from the dead-end products.
A

14
B
Figure 1.10: A) Gene cluster orientation of the paa cluster of the phenylacetic acid
catabolism pathway in E. coli. B) The putative role of PaaI thioesterase in the
phenylacetic acid catabolism pathway.
1.4.3 - E. coli YbaW and TEII (Thioesterase II)
When grown on oleic acid as its sole carbon source, E. coli has been shown to
derive its energy from fatty acid β-oxidation. Recently it has been proposed that ninety
percent of the oleic acid is degraded to acetyl-CoA using the classical or isomerase-
dependent β-oxidation pathway, requiring enoyl-CoA isomerase (32). The remaining
ten percent of the oleic acid is degraded partially by an alternative pathway, branching
from the classical pathway, and converting the 2-trans,5-cis-tetradecadienoyl-CoA to 3,5-
cis-tetradecadienoyl-CoA, a dead end product (see Figure 1.11) (32). The minor product
3,5-cis-tetradecadienoyl-CoA cannot be further oxidized because the required enzyme,
dienoyl-CoA isomerase, is not present.

15
The double hotdog-fold thioesterase TesB (TEII) was initially purified from E.
coli several decades ago and has just recently been shown to catalyze the hydrolysis of
long chain acyl-CoA's having 3,5-cis-tetradecadienoyl-CoA as its best substrate (33–35).
In addition, TEII has also been shown to hydrolyze acyl-holoACP's, but 1000 times
slower than the corresponding acyl-CoA (34). Physiologically, TEII has also been shown
to increase the synthesis of 3-hydroxydecanoic acid when in the presence of (R)-3-
hydroxydecanoyl-acyl carrier protein (3HD-ACP)–CoA transacylase (PhaG), suggesting
that TEII plays a role in a de novo fatty acid biosynthesis (36). Even though its most
active substrate suggests that it might play a role in the minor β-oxidation pathway,
recent gene knock-out studies of TEII have shown that another thioesterase, YbaW, is
responsible for the hydrolysis of dead-end product 3,5-cis-tetradecadienoyl-CoA (37, 38).
Figure 1.11: Beta-oxidation of oleoyl-CoA in E. coli. The value of 90% refers to the
percentage of oleoyl-CoA that is completely degraded to acetyl-CoA via the main

16
pathway, while 10% indicates the flux through the minor pathway that facilitates the
partial degradation of oleoyl-CoA to 3,5-tetradecadienoic acid.
YbaW is an E. coli hotdog-fold thioesterase that has been shown to hydrolyze the
minor dead end β-oxidation product 3,5-cis-tetradecadienoyl-CoA to the corresponding
acid, which is secreted into the medium. Kinetic analysis demonstrated that YbaW
efficiently catalyzes the hydrolysis of long chain acyl-CoA thioesters with 3,5-cis-
tetradecadienoyl-CoA being its best substrate (37). The YbaW- mutant was shown to
display perturbed growth on oleic acid as well as on conjugated linoleic acid when
compared to the growth of the YbaW+ E. coli under the same conditions (37, 38). Taken
together, these results indicate that YbaW is the thioesterase necessary for the alternative
β-oxidation pathway. The last piece of evidence corroborating YbaW's physiological
role is gene context. Specifically, a fadR gene is located upstream from the ybaW gene
(39). The FadR protein has a dual role in E. coli, acting as a repressor of the β-oxidation
pathway and as an activator of the unsaturated fatty acid biosynthetic genes (40). Using
elecrophoretic mobility assays, Feng et. al was able to demonstrate that FadR does bind
to the ybaW promoter region, making YbaW the newest member of the fad regulon (39).
1.4.4 - E. coli YbgC
The E. coli hotdog-fold thioesterase YbgC a 15.6 kDa protein that has a modest
level of sequence homology (21% identity) to the Ps. 4HBT thioesterase. The YbgC
protein is encoded by the first ORF of the tol-pal operon found across most bacteria
belonging to the α, β, and γ subdivision of proteobacteria. The proteins encoded by tol-

17
pal operon are thought to participate in the formation of the septation ring during cell
division (41). How YbgC, a thioesterase, might assist this process is unclear.
An insight to the physiological function of YbgC has recently been established via
two-hybrid tandem affinity purification (TAP), revealing a possible role in phosholipid
synthesis (42). The TAP experiments demonstrated that YbgC co-purifies with the small
acidic acyl-carrier protein, suggesting that YbgC might target an acyl-holoACP (42).
Moreover, the same study found that YbgC also co-purifies with the phospholipid
synthesis proteins PlsB and PssA. Notably, PlsB is a sn-glycerol-3-phosphate
acyltransferase that utilizes acyl-ACP as a substrate (42).
Substrate screens of the putative YbgC orthologs from Heamophilus influenzae
and Heliobacter pylori have produced conflicting results. The H. influenzae YbgC (53%
identity to E. coli YbgC) protein was shown to catalyze the hydrolysis of short chain
acyl-CoA's but was inactive towards aromatic and long chain acyl-CoA's (43).
Conversely, the H. pylori YbgC (37% identity to E. coli YbgC) was shown to favor long
chain acyl-CoA's (13). These two conflicting results add to the mystic of YbgC's cellular
role.
1.4.5 E. coli YciA
The last E. coli hotdog-fold thioesterase to be discussed, YciA, has been
characterized thoroughly “in vitro” yet, like many other hotdog-fold thioesterases, a
single distinct physiological function has yet to be assigned. A substrate screen of YciA
demonstrated, like TEII, a catalytically efficient and promiscuous thioesterase activity
with towards long chain acyl-CoA thioesters. On the other hand, YciA also proved to be
very active towards aroyl-CoA's and short chain acyl-CoA thioesters (10). The H.
18
influenzae homologue of YciA was also subjected to comprehensive substrate screen to
show that it too couples high catalytic efficiency with high substrate promiscuity (10).
Crystallographic analysis of YciA shows that the acyl binding pocket is large and solvent
exposed, possibly leading to its promiscuity (44). However, a more reasonable source
might be the tight binding of the CoA unit.
The tight binding of CoA was first evident in the purification of H. influenzae
YciA where LC-MS analysis demonstrated the presence of YciA and a small molecule
with a molecular weight equivalent to coenzyme A (10). In addition, reactivity of the
YciA protein with CoA bound demonstrated an initial lag phase corresponding to the
removal of CoA from the active site (10). Moreover, the inhibition constant for desulfo-
CoA of 0.33 µM also suggests extremely tight binding.
The tight binding of CoA and the promiscuity observed for YciA provide clues
towards understanding its physiological function. An inspection of the gene context in E.
coli shows yciA clustered in an operon with yciB, yciC and yciI and is located nearby
genes encoding for the synthesis of cardiolipin (10). Increased expression of cardiolipin
increases membrane fluidity which affects integral membrane protein functions (45).
Cardiolipin has also been shown to organize membrane protein partners and recruit
proteins to the poles and septa of inner membranes (46, 47). Considering gene context,
and the high activity towards long chain acyl-CoA thioesters, YciA is might involved in
the biogenesis of the inner membrane for cell division or the insertion of integral
membrane proteins.
19
1.5 Summary
The hotdog-fold protein family is ancient and has evolved to perform diverse
types of chemistries. Although the tertiary fold is conserved among hotdog-fold family
members, the amino acid sequence is highly divergent. Because of this divergence, the
hotdog-fold protein family has been divided into subfamilies or classes based upon
chemistry, catalytic core motifs, and sequence homology (6). Amongst the various
chemistries is a niche of hotdog-fold proteins that catalyze the hydrolysis of acyl-
thioester linkages. The substrates for these hotdog-fold thioesterases are typically aryl-
/acyl-CoA and acyl-ACP thioesterase.
This dissertation will focus on the hotdog-fold thioesterases that catalyze acyl-
CoA and acyl-ACP thioesters. The core of the thioesterase domain consists of 5 -
strands encompassing a long -helix. The active sites of hotdog-fold thioesterase are
formed at the interface of two monomers. Each thioesterase employs carboxylate residue,
which functions either as a base, activating a water molecule for nucleophilic attack, or as
a nucleophile, which directly attacks the thioester unit forming a mixed anhydride
intermediate. Hotdog-fold thioesterases have been subdivided into clades based upon
their tertiary structure and catalytic motifs.
The precise biological functions of the E. coli hotdog-fold thioesterase of YbdB,
YbaW, TEII, and YaaI have been assigned. The biological functions of YbgC, YciA,
YdiI, YigB and YiiD remained to be determined. This will require identification of the
physiological substrate. Owing to substrate promiscuity in-vitro activity screening often
falls short of identifying the physiological substrate. This coupled with the lack of
meaningful gene context and an understanding of the structural elements of substrate and

20
protein partner recognition renders the identification of biological function challenging.
The goal of the work described in this thesis is to ascertain information about the
structure-function relationship of hotdog-fold thioesterases so that function might be
assigned to uncharacterized thioesterases based upon known structures and/or sequence
homology.
21
References
1. Hunt, M. C., and Alexson, S. E. H. (2002) The role Acyl-CoA thioesterases play in
mediating intracellular lipid metabolism, Progress in Lipid Research 41, 99-130.
2. Katz, L., and Donadio, S. (1993) Polyketide synthesis: prospects for hybrid
antibiotics., Annual Review of Microbiology 47, 875-912.
3. Scholten, Jeffrey D., Chang, Kai-Hsuan, Babbit, Patricia C., Charest, Hugues,
Sylvestre, Michel, Dunaway-Mariano, D. (1991) Novel Enzymic Hydrolytic
Dehalogenation of a Chlorinated Aromatic, Science 253, 182-185.
4. Smotrys, J. E., and Linder, M. E. (2004) Palmitoylation of intracellular signaling
proteins: regulation and function, Annual Review of Biochemistry 73, 559-87.
5. Chemistry, B., and Groningen, A. G. (1999) α / β Hydrolase fold enzymes : the
family keeps growing Marco Nardini and Bauke W Dijkstra, Current Opinion in
Structural Biology 732-737.
6. Dillon, S. C., and Bateman, A. (2004) The Hotdog fold: wrapping up a
superfamily of thioesterases and dehydratases, BMC Boinformatics 5, 109.
7. Ollis, D. L., Cheah, E., Cyglerl, M., Dijkstra, B., Frolow, F., Franken, S. M.,
Harel, M., Remington, S. J., Silman, I., Schragl, J., Sussman, J. L., and Goldmans,
A. (1992) The α / β hydrolase fold, Protein Engineering 5, 197-211.
8. Leesong, M., Henderson, B. S., Gillig, J. R., Schwab, J. M., and Smith, J. L.
(1996) Structure of a dehydratase-isomerase from the bacterial pathway for

22
biosynthesis of unsaturated fatty acids: two catalytic activities in one active site,
Structure 4, 253-64.
9. Crawford, J. M., Korman, T. P., Labonte, J. W., Vagstad, A. L., Hill, E. a, Kamari-
Bidkorpeh, O., Tsai, S.-C., and Townsend, C. a. (2009) Structural basis for
biosynthetic programming of fungal aromatic polyketide cyclization, Nature 461,
1139-43.
10. Zhuang, Z., Song, F., Zhao, H., Li, L., Cao, J., Eisenstein, E., Herzberg, O., and
Dunaway-Mariano, D. (2008) Divergence of function in the hot dog fold enzyme
superfamily: the bacterial thioesterase YciA, Biochemistry 47, 2789-2796.
11. Adams, S. H., Chui, C., Schilbach, S. L., Yu, X. X., Goddard, A. D., Grimaldi, J.
C., Lee, J., Dowd, P., Colman, S., and Lewin, D. A. (2001) BFIT, a unique acyl-
CoA thioesterase induced in thermogenic brown adipose tissue: cloning,
organization of the human gene and assessment of a potential link to obesity,
Biochemical Journal 360, 135-142.
12. Suematsu, N., and Isohashi, F. (2006) Molecular cloning and functional expression
of human cytosolic acetyl-CoA hydrolase, Acta Biochimica Polonica 53, 553-61.
13. Angelini, A., Cendron, L., Goncalves, S., Zanotti, G., and Terradot, L. (2008)
Structural and enzymatic characterization of HP0496, a YbgC thioesterase from
Helicobacter pylori, Proteins 72, 1212-1221.

23
14. Zhuang, Z., Song, F., Martin, B. M., and Dunaway-Mariano, D. (2002) The YbgC
protein encoded by the ybgC gene of the tol-pal gene cluster of Haemophilus
influenzae catalyzes acyl-coenzyme A thioester hydrolysis, FEBS Letters 516,
161-3.
15. Ohlrogge, J. B., and Jaworski, J. G. (1997) Regulation of Fatty Acid Synthesis,
Annual Review of Plant Physiology and Plant Molecular Biology 48, 109-136.
16. Li, J., Derewenda, U., and Dauter, Z. (2000) letters Crystal structure of the
Escherichia coli thioesterase II , a homolog of the human Nef binding, Nature
Structural Biology 7, 177-180.
17. Klages, U., Markus, a, and Lingens, F. (1981) Degradation of 4-
chlorophenylacetic acid by a Pseudomonas species, Journal of Bacteriology 146,
64-8.
18. Schmitz, a, Gartemann, K. H., Fiedler, J., Grund, E., and Eichenlaub, R. (1992)
Cloning and sequence analysis of genes for dehalogenation of 4-chlorobenzoate
from Arthrobacter sp. strain SU, Applied and Environmental Microbiology 58,
4068-71.
19. Song, F., Zhuang, Z., and Dunaway-Mariano, D. (2007) Structure-activity analysis
of base and enzyme-catalyzed 4-hydroxybenzoyl coenzyme A hydrolysis,
Bioorganic Chemistry 35, 1-10.

24
20. Benning, M. M., Wesenberg, G., Liu, R., Taylor, K. L., Dunaway-Mariano, D.,
and Holden, H. M. (1998) The three-dimensional structure of 4-hydroxybenzoyl-
CoA thioesterase from Pseudomonas sp. Strain CBS-3, The Journal of Biological
Chemistry 273, 33572-9.
21. Zhuang, Z., Latham, J., Song, F., Zhang, W., Trujillo, M., and Dunaway-Mariano,
D. (2012) Investigation of the catalytic mechanism of the hotdog-fold enzyme
superfamily Pseudomonas sp. strain CBS3 4-hydroxybenzoyl-CoA thioesterase,
Biochemistry 51, 786-94.
22. Song, F., Thoden, J. B., Zhuang, Z., Trujillo, M., Holden, H. M., and Dunaway-
Mariano, Debra. The catalytic mechanism of the hotdog-fold enzyme superfamily
4-hydroxybenzoyl-CoA thioesterase from Arthrobacter sp. strain SU,
Unpublished.
23. Barry, S. M., and Challis, G. L. (2009) Recent advances in siderophore
biosynthesis, Current Opinion in Chemical Biology 13, 205-15.
24. Gehring, A. M., Mori, I., and Walsh, C. T. (1998) Reconstitution and
Characterization of the Escherichia coli Enterobactin Synthetase, Biochemistry 37,
2648-2659.
25. Lai, J. R., Fischbach, M. a, Liu, D. R., and Walsh, C. T. (2006) Localized protein
interaction surfaces on the EntB carrier protein revealed by combinatorial
mutagenesis and selection, Journal of the American Chemical Society 128, 11002-
3.

25
26. Chen, D., Wu, R., Bryan, T. L., and Dunaway-Mariano, D. (2009) In vitro kinetic
analysis of substrate specificity in enterobactin biosynthetic lower pathway
enzymes provides insight into the biochemical function of the hot dog-fold
thioesterase EntH, Biochemistry 48, 511-3.
27. Leduc, D., Battesti, A., and Bouveret, E. (2007) The hotdog thioesterase EntH
(YbdB) plays a role in vivo in optimal enterobactin biosynthesis by interacting
with the ArCP domain of EntB, Journal of Bacteriology 189, 7112-26.
28. Guo, Z.-F., Sun, Y., Zheng, S., and Guo, Z. (2009) Preferential hydrolysis of
aberrant intermediates by the type II thioesterase in Escherichia coli nonribosomal
enterobactin synthesis: substrate specificities and mutagenic studies on the active-
site residues, Biochemistry 48, 1712-22.
29. Burlingame, R. P., Wyman, L., and Chapman, P. J. (1986) Isolation and
characterization of Escherichia coli mutants defective for phenylpropionate
degradation, Journal of Bacteriology 168, 55-64.
30. Ferrrandez, A., inambres, B., Garcia, B., livera, ., uengo, ., Garc a, ., and
D az, E. (1998) Catabolism of phenylacetic acid in Escherichia coli, The Journal
of Biological Chemistry 273, 25974-25986.
31. Song, F., Zhuang, Z., Finci, L., Dunaway-Mariano, D., Kniewel, R., Buglino, J. a,
Solorzano, V., Wu, J., and Lima, C. D. (2006) Structure, function, and mechanism
of the phenylacetate pathway hot dog-fold thioesterase PaaI, The Journal of
Biological Chemistry 281, 11028-38.

26
32. Ren, Y., Aguirre, J., Ntamack, A. G., Chu, C., and Schulz, H. (2004) An
alternative pathway of oleate beta-oxidation in Escherichia coli involving the
hydrolysis of a dead end intermediate by a thioesterase, The Journal of Biological
Chemistry 279, 11042-50.
33. Barnes, E. M. J., and Wakil, S. J. (1957) Studies on the mechanism of fatty acid
synthesis, The Journal of Biological Chemistry 25, 303-310.
34. Spencer, K., Greenspan, D., Cronan, E., and Ai, S. G. (1978) Thioesterases I and II
of Escherchia coli Hydrolysis of Native Acyl-Acyl Carrier Protein Thioesters, The
Journal of Biological Chemistry 253, 5922-5926.
35. Naggert, J., Narasimhang, M. L., Deveauxg, L., Chog, H., Randhawab, Z. I.,
Cronan, J. E., and Greenll, B. N. (1991) Cloning , Sequencing , and
Characterization of Escherichia coli, The Journal of Biological Chemistry 266,
11044-11050.
36. Zheng, Z., Gong, Q., Liu, T., Deng, Y., Chen, G.-qiang, and Chen, J.-chun. (2004)
Thioesterase II of Escherichia coli Plays an Important Role in 3-Hydroxydecanoic
Acid Production Thioesterase II of Escherichia coli Plays an Important Role in 3-
Hydroxydecanoic Acid Production, Applied and Environmental Microbiology 27,
3807-3813.
37. Nie, L., Ren, Y., and Schulz, H. (2008) Identification and characterization of
Escherichia coli thioesterase III that functions in fatty acid beta-oxidation,
Biochemistry 47, 7744-51.

27
38. Nie, L., Ren, Y., Janakiraman, A., Smith, S., and Schulz, H. (2008) A novel
paradigm of fatty acid beta-oxidation exemplified by the thioesterase-dependent
partial degradation of conjugated linoleic acid that fully supports growth of
Escherichia coli, Biochemistry 47, 9618-26.
39. Feng, Y., and Cronan, J. E. (2009) A new member of the Escherichia coli fad
regulon: transcriptional regulation of fadM (ybaW), Journal of Bacteriology 191,
6320-8.
40. Henry, M. F., and Cronan, J. E. (1991) Escherichia coli transcription factor that
both activates fatty acid synthesis and represses fatty acid degradation, Journal of
Molecular Biology 222, 843-849.
41. Gerding, M. a, Ogata, Y., Pecora, N. D., Niki, H., and de Boer, P. a J. (2007) The
trans-envelope Tol-Pal complex is part of the cell division machinery and required
for proper outer-membrane invagination during cell constriction in E. coli,
Molecular Microbiology 63, 1008-25.
42. Gully, D., and Bouveret, E. (2006) A protein network for phospholipid synthesis
uncovered by a variant of the tandem affinity purification method in Escherichia
coli, Proteomics 6, 282-93.
43. Zhuang, Z., Song, F., Zhang, W., Taylor, K. L., Archambault, A., and Dunaway-
Mariano, D. (2002) Kinetic , Raman , NMR , and Site-Directed Mutagenesis
Studies of the Pseudomonas Sp. Strain CBS3 4-Hydroxybenzoyl-CoA
Thioesterase Active Site, Biochemistry 41, 11152-11160.

28
44. Willis, M. A., Zhuang, Z., Song, F., Howard, A., and Dunaway-mariano, D. (2008)
Structure of YciA from Haemophilus influenzae ( HI0827 ), a Hexameric Broad
Specificity Acyl-Coenzyme A Thioesterase, Biochemistry 47, 2797-2805.
45. Bernal, P., Segura, A., and Ramos, J.-L. (2007) Compensatory role of the cis-
trans-isomerase and cardiolipin synthase in the membrane fluidity of Pseudomonas
putida DOT-T1E, Environmental Microbiology 9, 1658-64.
46. Romantsov, T., Helbig, S., Culham, D. E., Gill, C., Stalker, L., and Wood, J. M.
(2007) Cardiolipin promotes polar localization of osmosensory transporter ProP in
Escherichia coli, Molecular Microbiology 64, 1455-65.
47. Mileykovskaya, E. (2007) Subcellular localization of Escherichia coli
osmosensory transporter ProP: focus on cardiolipin membrane domains, Molecular
Microbiology 64, 1419-22.
29
CHAPTER TWO
DETERMINING THE PHYSIOLOGICAL ROLE OF THE
ESCHERICHIA COLI HOTDOG-FOLD THIOESTERASE YDII
2.1 Introduction
In the absence of oxygen, many facultative anaerobic bacteria obtain their energy
through anaerobic respiration utilizing fumarate as an alternative terminal electron
acceptor (1). The reduction of fumarate to succinate is catalyzed by the membrane protein
fumarate reductase, which transfers electrons from the cofactor menaquinone (2).
Menaquinone is lipid soluble and is composed of a napthoquinone ring to which a
partially saturated polyisoprenyl side chain of varying in length is attached. Menaquinone
is an essential cofactor for facultative anaerobic organisms such as Escherichia coli.
Gene knockout mutants that are not able to produce menaquinone display inhibited
growth under anaerobic conditions (3–6). Vertebrates acquire menaquinone, also known
as vitamin K2, from the intestinal flora and from ingested leafy vegetables. Vitamin K2
functions in vertebrates as a cofactor for various carboxylases involved in blood clotting
and cell cycle regulation (7). Because humans do not synthesize vitamin K2, the
enzymes of the biosynthetic pathway operative in pathogenic microbes are potential drug
targets.
The E. coli menaquinone biosynthetic pathway has been extensively characterized
(Figure 2.1) and is assembled by nine protein products, six of which are encoded by the
menFDHBCE operon. Synthesis of the dihydroxnapthoic acid (DHNA) backbone begins
with the conversion of chorismate to isochorismate catalyzed by MenF (8, 9) The three
subsequent steps in which isochorismate is converted to the o-succinylbenzoate (OSB)

30
are catalyzed by the enzymes MenD, MenH, and MenC (10–12).
The ATP-dependent
enzyme MenE, activates the carbonyl group of OSB with coenzyme A (CoA) to form
OSB-CoA. This intermediate undergoes a cyclization reaction cyclized by MenB to from
1,4-dihydroxynapthoyl-CoA (DHNA-CoA) (13, 14). MenB was once thought to
hydrolyze the DHNA-CoA to DHNA, however this was later shown to be incorrect. Until
recently, it was also thought that the α/β-fold protein MenH catalyzes the hydrolysis of
DHNA-CoA to DHNA, however this too was shown to be incorrect. The confusion
regarding the identity of the thioesterase that catalyzes DHNA-CoA to DHNA has been
nicely summarized by Widhalm et. al. (26). These investigators discovered that the
Synechocystis sp. PCC 6803 hotdog-fold thioesterase SLR0204 is responsible for the
hydrolysis of DHNA-CoA to DHNA. However, the E. coli menaquinone pathway
thioesterase remained to be identified.
The remaining steps of the menaquinone pathway include the addition of the varying
length polyisoprenyl side chain to the DHNA to form demethylmenaquinone, catalyzed
by MenA and ring methylation by the S-adenosyl-methionine (SAM) catalyzed by MenG
(15, 16).

31
Figure 2.1. The menaquinone biosynthetic pathway in E. coli. The pathway enzymes
are: isochorisimate synthase, MenF; SEPHCHC synthase, MenD; SHCHC synthase,
MenH; OSB synthase, MenC; OSB-CoA ligase, MenE; DHNA synthase, MenB; DHNA
prenyltransferase, MenA; demethylmenaquinone methyltransferase, MenG. The
following acronyms are; 2-succinyl-5-enolpyruvyl-6-hydroxy-3-cyclohexene-1-carboylic
acid, SEPHCHC; (1R,6R)-2-succinyl-6-hydroxy-2,4-cyclohexadiene-1-carboxylic acid,
SHCHC; o-succinyl-benzoic acid, OSB; 1,4-dihydroxynapthoic acid, DHNA; S-
adenosyl-methionine, SAM; and S-adenosyl-L-homocysteine, SAH.

32
The work that I describe in this chapter provides evidence that the missing
thioesterase of the E. coli menaquinone pathway is the previously the uncharacterized E.
coli hotdog-fold superfamily thioesterase YdiI. In E. coli two closely related paralogs
(59% identity) of the hotdog-fold enzyme superfamily, EntH (also known as YbdB) and
YdiI, have evolved to perform different cellular functions. EntH has been shown to play
a housekeeping role in the enterobactin synthesis pathway by freeing misacylated-EntB
(17, 18). Replacement of EntH by YdiI does not restore EntH activity and thus, despite
their high sequence identity, YdiI and EntH perform different functions (19). Whereas the
gene that encodes EntH in E. coli is located within a gene cluster that encodes the
enzymes of the enterobactin pathway, the gene that encodes YdiI in E. coli as well as in
other species of Enterobacteriales, is co-localized with a putative
oxidoreductase/dehydrogenase (YdiJ). This gene context is however, not conserved
outside Enterobacteriales. For example, in Pseudomonas aeruginosa the YdiI (PA1618)
encoding gene is adjacent to a putative ligase (Figure 2.2). Using a combination of in
vitro substrate specificity profile determination and in-vivo growth curve analysis with
the E. coli YdiI-
mutant, I provide evidence that the in E. coli YdiI functions as the
menquinone pathway thioesterase. In Chapter 3, I will identify the structural basis for the
divergence in EntH and YdiI function and in Chapter 4, I will show that YdiI of P.
aeruginosa has assumed a function unique from that of the E. coli YdiI.

33
Figure 2.2: Gene context of Escherichia coli and Pseudomonas aeruginosa ydiI gene
products (red).
2.2 Methods and Materials
2.2.1 Materials
All restriction enzymes and T4 DNA ligase were purchased from Invitrogen
(Grand Island, NY). Pfu Turbo and Deep Vent DNA polymerases were purchased from
Strategene (Santa Clara, CA). Oligonucleotide primers were custom-synthesized by
Invitrogen. DNA sequencing was performed by the DNA Sequencing Facility of the
University of New Mexico. Acetyl-CoA, benzoyl-CoA, propanoyl-CoA, hexanoyl-CoA,
lauroyl-CoA, myristoyl-CoA, palmitoyl-CoA, oleoyl-CoA were purchased from Sigma.
The thioester substrates 4-hydroxybenzyol-CoA, DHNA-CoA and coumaroyl-CoA were
synthesized as previously reported (18, 20). E. coli strains W1676 (ΔydiI::Kan
r) and
BW2513 (YdiI+) of the Kleio collection were obtained from Yale University (21).
2.2.2 Preparation of wild-type E. coli ydiI and EntH
The wild-type EntH (YbdB) was purified as previously described (17). The wild-
type (WT) ydiI gene was amplified by PCR using genomic DNA prepared from E. coli
strain K-12 (ATCC) as template, commercial oligonucleotides as primers, and Deep Vent
as the polymerase. The PCR-products were digested by the restriction enzymes NdeI and
XhoI and then purified by polyacrylamide gel electrophoresis. The genes were ligated to a
NdeI and XhoI- digested pET-23a vector (Novagen) using T4 DNA ligase. The cloned
genes were verified by DNA sequencing. The cloned plasmids were used to transform

34
competent E. coli BL21(DE3) cells (Invitrogen) for gene expression. The ydiI/pET-23a
transformed E. coli BL21(DE3) cells were grown aerobically at 37 oC in LB media
containing 50 µg/ml ampicillin. Production of C-terminal His6-tagged YdiI was induced
with 0.4 mM isopropyl-β-D-galactopyranoside (IPTG) once the cell density had reached
A600 ~ 0.6. Following a 12 h induction period at 19 oC, the cells were harvested by
centrifugation at 6,500 rpm for 10 min and then resuspended in 100 mL of 50 mM Tris
buffer (pH 8.4), 50 mM imidazole, and 500 mM NaCl (Lysis Buffer). The cells were
lysed using a French press at 1,200 psi and the lysate was centrifuged at 20,000 rpm for
15 min. The supernatant was loaded onto a 5 mL HisTrap FF e column (GE Life
Sciences) and the column was eluted at 4 oC with Lysis Buffer to remove non-tagged
protein and then with 50 mM Tris (pH 8.4), 500 mM imidazole, and 500 mM NaCl
(Elution Buffer) to elute the tagged protein. Column fractions were monitored by
measuring solution absorbance at 280 nm and by carrying out SDS-PAGE analysis. The
YdiI-containing fractions were combined and dialyzed at 4 oC against three changes of 1
L of 50 mM Tris (pH 8.4)/50 mM NaCl. Yield: YdiI ~10 mg protein/g of wet cells.
2.2.3 Determination of the steady state kinetic constants
Thioesterase activity was measured using the 5,5’-dithio-bis-(2-nitrobenzoic acid)
(DTNB) coupled assay. Reactions were monitored at 412 nm (Δε = 13.6 m -1•cm
-1)
using a Beckman 640U Spectrometer. Reactions were carried out 25 oC with 0.5 mL
solutions containing 50 mM K+HEPES (pH 7.5), 1 mM DNTB, a catalytic amount of
thioesterase and varying concentrations of thioester (0.5 – 5 x Km). The catalyzed

35
hydrolysis of 4-hydroxybenzoyl-CoA (4-HB-CoA) in 50 mM K+ HEPES (pH 7.5) was
directly monitored at 300 nm (Δε = 11.8 m -1•cm
-1).
The initial velocity data, measured as a function of substrate concentration, were
analyzed using Enzyme Kinetics v 1.4 and equation 1:
V = V max [S]/([S]+Km) (1)
where V is initial velocity, V max is maximum velocity, [S] is substrate concentration, and
Km is the Michaelis constant. The kcat was calculated from Vmax/[E] where [E] is the total
enzyme concentration as determined by the Bradford method.
2.2.4 Growth curve measurements for wild-type and YdiI knockout Escherichia coli
strains
Aerobic growth curves were carried out in sterile vented flasks (Nalgene) each
containing 50 mL of M9 Minimal Media supplemented with 4% glucose, sodium
succinate, or sodium fumarate as the sole carbon source and with or without added
kanamycin. An aliquot of saturated overnight culture of JW1676 (YdiI-) or BW2513
(YdiI+) E. coli cells in LB broth was added to the media to make an initial A600 ~ 0.01.
Cultures were incubated at 37 oC with orbital shaking at 180 rpm. The culture A600 was
determined at 1 h intervals for 14 h. Anaerobic growth curves were carried out in a
similar fashion using 50 mL of M9 Minimal media supplemented with double the amount
of phosphate and with 4% glucose plus 4% fumarate. The sterile flasks were capped with
sterilized butyl stoppers and purged for 2 min with N2 gas passed through a sterile 0.2µm
in-line filter. Aliquots were removed by syringe, hourly over a 12 h period, for A600
determination.

36
2.3 RESULTS AND DISCUSSION
2.3.1 YdiI substrate screen for determination of biochemical function
Figure 2.3: The molecular structure of selected acyl/aryl-coenzyme compounds for the
YdiI substrate screening.
The YdiI substrate specificity profile was determined by measuring the steady-
state kcat and Km values for a panel of acyl-CoA, benzoyl-CoA and napthoyl-CoA
thioesters. The results are reported in Table 2.1 along with the steady-state kinetic
constants measured for EntH (22). Both thioesterases are promiscuous however, each has
its own unique specificity profile that differ in ways which suggest specialization for
targeting the physiological substrate. EntH displays low activity with the C6-C18
aliphatic (fat-like) acyl-CoA thioesters: kcat ~0.1-0.03 s-1
and kcat/Km ~ 1 x 10³ M
-1 s
-1.
S
O
CoA
O
SCoA
O
SCoA
O
SCoA
S
O
CoA
HO
O
SCoA
HO
hexanoyl-CoA
benzoyl-CoA
lauroyl-CoA
myristoyl-CoA
coumaroyl-CoA
4-hydroxybenzoyl-CoA
O
SCoA
OH
OH
1,4-dihydroxynapthoyl-CoA

37
EntH is significantly more active with substrates that possess a phenyl ring. The
coumaroyl-CoA kcat = 0.8 s-1
and the kcat/Km ~ 1 x 10⁵ M
-1 s
-1. Benzoyl-CoA and 4-
hydroxybenzoyl-CoA are very good substrates (kcat ~2 s-1
and kcat/Km ~1 x 10⁵ M
-1 s
-1)
whereas the 1,4-dihydroxynapthoyl-CoA is not (kcat = 0.01 s-1
and kcat/Km ~ 6 x 10² M
-1 s
-
1). In-vivo, EntH catalyzes the hydrolysis of dead-end, misacylated holoEntB adducts,
which in turn, are not processed by EntF (for details see Chapter 1). Consistent with this
function, 2,4-dihydroxybenzoyl-holoEntB is a very active substrate (kcat = 4 s-1
and
kcat/Km = 1 x 10⁵ M
-1 s
-1), in fact, as active as the 4-hydroxybenzoyl-CoA thioester (2,4-
dihydroxybenzoyl-CoA was not synthetically accessible. In contrast, the benzoyl-
holoACP (the ACP that functions in E. coli fatty acid synthesis; see Chapter 5 for details)
is considerably less active than is benzoyl-CoA or 2,4-dihydroxybenzoyl-holoEntB
(~200-fold reduction in kcat and 1000-fold reduction in kcat/Km).

38
EntH YdiI
Substrate kcat (s1) KM (µM)
kcat/KM
(M-1
s-1
) kcat (s
1)
KM
(µM)
kcat/KM
(M-1
s-1
)
Acetyl-CoA (4.4 ± 0.2)
x 10-3
800 ± 90 5.5
ND
Hexanoyl-
CoA
(1.36 ± 0.03)
x 10-1 260 ± 20 5.2 x 10
2 0.30 ± 0.01 21 ± 1 1.4 x 10
4
Lauroyl-CoA (2.81 ± 0.03)
x 10-2
44 ± 2 6.210
2
0.74 ± 0.01 2.2 ± 0.2 3.4 x 10⁵
Myristoyl-
CoA
(7.8 ± 0.3)
x 10-2
11 ± 1 7.1 x 10
2 0.63 ± 0.01 1.5 ± 0.2 4.1 x 10
5
Oleoyl-CoA (3.0 ± 0.1)
x 10-2 13 ± 2 2.3 x 10
3 (1.16 ±
0.01)
x 10-1
1.3 ± 0.1 8.7 x 10⁴
Benzoyl-CoA 2.2 ± 0.1 12 ± 1 1.8 x 10⁵ 18 ± 1 25 ± 3 7.2 x 10
5
4-HB-CoA 1.6 ± 0.1 21 ± 2 7.3104
5.2 ± 0.2 9 ± 1 5.9 x 10⁵
1,4-DHN-
CoA
(9.3 ± 0.2)
x 10-3 17 ± 1 5.8 x 10
2 1.58 ± 0.03 8 ± 1 2.0 x 10
5
Coumaroyl-
CoA
(8.2 ± 0.2
x 10-1
10 ± 1 8.4 x 10
4 8.4 ± 0.2
30 ± 2 2.8 x 10
5
2,4-DHB-
EntB 3.7 ± 0.1 25 ± 1 1.410
5
3.6 x 10
3
200 ± 20 3.6 x 10³
Benzoyl-ACP (1.3 ± 0.1)
x 10-2 57 ± 10 2.41 x 10
2 (8.3 ± 0.7)
x 10-2 54 ± 5 1.5 x 10
3
a Data was taken from reference (22).
Table 2.1: Steady state kinetic parameters of EntH and YdiI-catalyzed hydrolysis of
various acyl-CoA, acyl-holo-ACP, or acyl-holo-EntB substrates monitored by direct
absorbance change or DTNB coupled reactions in 50 mM K+HEPES at pH 7.5.
YdiI displays a modest yet physiologically significant level of activity with the
C6-C18 aliphatic fatty acyl-CoA thioesters: kcat = 0.7-0.1 s-1
and kcat/Km ~ 1 x 10⁴
to 1 x
104
M-1
s-1
. Like EntH, YdiI prefers substrates having a phenyl ring: kcat = 5-18 s-1
and the
kcat/Km ~ 1 x 10⁵
to 1 x 10⁶
M-1
s-1
. In contrast to the EntH, YdiI is very active in
catalysis of 1,4-dihydroxynapthoyl-CoA (kcat = 1.6 s-1
and kcat/Km = 2 x 10⁵ M
-1 s
-1), 300-

39
fold more active than is EntH. Another notable difference between the two thioesterases
is that ydiI is significantly more active with the CoA thioesters. Comparison of the
kinetic constants for 2,4-dihydroxybenzoyl-holoEntH to those measured for 4-
hydroxybenzoyl-CoA reveals a ~100-fold drop in activity. Likewise, benzoyl-CoA is
~100-fold more active as a substrate than is benzoyl-holoACP. Whereas EntH prefers the
holoEntB thiol unit over the holoACP unit, YdiI makes no distinction.
The inability of YdiI to complement the EntH gene knockout mutant suggests that
the differences in their respective substrate activity profiles is sufficient to alter in vivo
function. The source of the divergence in substrate specificity in these two paralogs must
derive from divergence in their structures, and in particular the topological features of
their respective active sites. From the deposited crystal structure of apo YdiI (1VH5) and
apo EntH (1VH9) it appears that YdiI has a larger substrate pocket, which might account
for its ability to better accommodate the napthoyl ring of the 2,4-dihydroxynapthoyl-CoA
(Figure 2.4).

40
A
B
Figure 2.4: Surface representation of YdiI (A - PDB ID: 1VH5) and EntH (B - PDB ID:
1VH9) generated with Chimera showing the shape of the substrate binding pocket
colored in yellow.

41
2.3.2 Wild-type and ydiI gene knockout aerobic and anaerobic growth curves
A potential lead that prompted the investigation of the E. coli growth curves came
from the NCBI GEO Profiles for ydiI, which showed a large increase in expression of the
ydiI gene when E. coli cells were grown anaerobically with glucose and fumarate as
carbon sources (23). When grown aerobically with glucose, the E. coli YdiI- (JW1676)
and the E. coli YdiI+ (BW2513) strains demonstrate similar growth curves (Figure 2.6A).
However, when grown aerobically on gluconeogenic substrates such as succinate and
fumarate, inhibition of E. coli YdiI- growth can be observed. The lack of complete
shutdown of growth can be accounted for by the fact that the quinone dependent
succinate dehydrogenase might perform the same reaction however, in a limited manner
(24, 25).
Anaerobic growth of the YdiI+ and of the YdiI
- strains on glucose and fumarate
demonstrated much more dramatic results. It should be noted that the use of unmodified
M9 minimal media led to a reduction in pH over time under the anaerobic conditions
utilizing glucose and fumarate as sole carbon sources. The growth of the YdiI+
strain
peaked at an OD600 ~ 1.2. The doubling the concentration of the buffer in the culture did
alter the growth curve obtained. Therefore the results shown are of the latter of the two
conditions. As shown in Figure 4B, the YdiI+ strain grew sigmoidally to a maximum
OD600 ~ 1.2 whereas the YdiI- strain grew linearly to a maximum OD600 ~ 0.4 in the same
timeframe. As mentioned earlier, fumarate can be utilized as the terminal electron
acceptor when grown under anoxic conditions. The utilization of fumarate reductase, as
well as the electron donating cofactor menaquinone, to transfer electrons to fumarate is

42
necessary for growth. In good agreement with other menaquinone synthesizing gene
knockout experiments, the YdiI- genotype severely inhibits growth of E. coli under
anaerobic conditions (3-6).
A
B

43
Figure 2.6: A) Aerobic growth curve of BW2513 (wild type Escherichia coli) and
W1676 (ΔydiI::Kanr) grown in M9 Minimal Media utilizing 4% of either glucose,
succinate, or fumarate as the sole carbon source at 37 oC. Growth curves were performed
in triplicate and the OD600 where plotted versus time and error bars represent standard
deviations. B) Anaerobic growth curve of BW2513 and JW1676 in buffer adapted M9
Minimal Media utilizing 4% glucose and fumarate as sole carbon sources under a N2
atmosphere at 37 oC. Growth curves were performed in triplicate and the OD600 where
plotted versus time and error bars represent standard deviations.
2.4 Conclusions
A steady-state kinetic analysis of YdiI substrate specificity demonstrated a large
range of substrates with physiologically relevant kcat/KM values. Even though YdiI is
promiscuous towards acyl-/aroyl-CoA substrates, it readily discriminates aroyl-holo-ACP
or aroyl-holo-EntB whereas the YdiI paralog EntH does not. Systemic structural changes
such as the length of the substrate binding pocket may help to explain the differences in
substrate preferences of the closely related paralog however, a detailed examination will
be necessary to identify key changes in structural features.
Although not exclusively located in one gene context, the co-localization of ydiI
to the menaquinone pathway in several bacterial species in addition to the NCBI GEO
Profiles of ydiI led to the investigation of its involvement in the menaquinone synthesis
pathway. Among the substrates YdiI was capable of catalyzing, the hydrolysis of
DHNA-CoA to DHNA occurred with high efficiency. Taking into account that ydiI is up-
regulated under anaerobic conditions with glucose and fumarate as carbon sources, it was

44
apparent that gene knockout studies were warranted. The aerobic growth of E. coli YdiI-
on fumarate or succinate demonstrated perturbed growth rates as compared to the E. coli
YdiI+. This can be explained by the need to undergo gluconeogenesis for biomolecule
synthesis, utilizing the menaquinone dependent enzyme fumarate reductase.
Additionally, the anaerobic growth of E. coli YdiI- on glucose plus fumarate
demonstrated almost complete inhibition of growth as compared to E. coli YdiI+. In
anaerobic conditions, fumarate can be used as the terminal electron acceptor and is the
substrate for fumarate reductase. Both growth curves provide evidence that the YdiI-
strain disrupts menaquinone synthesis. In combination with bioinformatics, an inclusive
substrate screen, and gene knockout growth curves, I have provided strong evidence that
YdiI is the DHNA-CoA thioesterase in the E. coli menaquinone synthesis pathway.

45
References
1. Kröger, A., Geisler, V., Lemma, E., Theis, F., and Lenger, R. Bacterial fumarate
respiration, Archives of Microbiology 158, 311-314.
2. Hirsch, C. A., Rasminsky, M., Davis, B. D., and Lin, E. C. C. (1963) A Fumarate
Reductase in Escherichia coli Distinct from Succinate Dehydrogenase, The
Journal of Biological Chemistry 238, 3770-3774.
3. Guest, J. R. (1977) Menaquinone biosynthesis: mutants of Escherichia coli K-12
requiring 2-succinylbenzoate., Journal of Bacteriology 130, 1038-46.
4. Guest, J. R. (1979) Anaerobic Growth of Escherichia coli K12 with Fumarate as
Terminal Electron Acceptor. Genetic Studies with Menaquinone and
Fluoroacetate-resistant Mutants, Journal of General Microbiology 115, 259-271.
5. Lamden, P. R., and Guest, J. R. (1976) Mutants of Escherichia coli K12 Unable to
use Fumarate as an Anaerobic Electron Acceptor, Journal of General
Microbiology 97, 145-160.
6. Wallace, B. J., and Young, I. G. (1977) Role of quinones in electron transport to
oxygen and nitrate in Escherichia coli. Studies with a ubiA− menA− double
quinone mutant, Biochimica et Biophysica Acta (BBA) - Bioenergetics 461, 84-
100.
7. Ichikawa, T., Horie-Inoue, K., Ikeda, K., Blumberg, B., and Inoue, S. (2006)
Steroid and xenobiotic receptor SXR mediates vitamin K2-activated transcription

46
of extracellular matrix-related genes and collagen accumulation in osteoblastic
cells., The Journal of Biological Chemistry 281, 16927-34.
8. Daruwala, R., Kwon, O., Meganathan, R., and Hudspeth, M. E. S. (1996) A new
isochorismate synthase specifically involved in menaquinone (vitamin K2)
biosynthesis encoded by the menF gene, FEMS Microbiology Letters 140, 159-
163.
9. Daruwala, R., Bhattacharyya, D. K., Kwon, O., and Meganathan, R. (1997)
Menaquinone ( Vitamin K 2 ) biosynthesis :overexpression , purification , and
characterization of a new isochorismate synthase from Escherichia coli., Journal of
Bacteriology 179, 3133.
10. Jiang, M., Cao, Y., Guo, Z.-F., Chen, M., Chen, X., and Guo, Z. (2007)
Menaquinone biosynthesis in Escherichia coli: identification of 2-succinyl-5-
enolpyruvyl-6-hydroxy-3-cyclohexene-1-carboxylate as a novel intermediate and
re-evaluation of MenD activity., Biochemistry 46, 10979-89.
11. Jiang, M., Chen, X., Guo, Z.-feng, Cao, Y., Chen, M., and Guo, Z. (2008)
Identification and Characterization of Menaquinone Biosynthesis of Escherichia
coli, Biochemical Journal 47, 3426-3434.
12. Popp, J. L., Berliner, C., and Bentley, R. (1989) Vitamin K (menaquinone)
biosynthesis in bacteria: High-performance liquid chromatographic assay of the
overall synthesis of o-succinylbenzoic acid and of 2-succinyl-6-hydroxy-2,4-
cyclohexadiene-1-carboxylic acid synthase, Analytical Biochemistry 178, 306-310.

47
13. Kwon, O., Bhattacharyya, D. K., and Meganathan, R. (1996) Menaquinone
(vitamin K2) biosynthesis: overexpression, purification, and properties of o-
succinylbenzoyl-coenzyme A synthetase from Escherichia coli., Journal of
Bacteriology 178, 6778-81.
14. Sharma, V., Suvarna, K., Meganathan, R., and Hudspeth, M. E. (1992)
Menaquinone (vitamin K2) biosynthesis: nucleotide sequence and expression of
the menB gene from Escherichia coli., Journal of Bacteriology 174, 5057-62.
15. Suvarna, K., Stevenson, D., Meganathan, R., and Hudspeth, M. E. S. (1998)
enaquinone ( Vitamin K 2 ) Biosynthesis : ocalization and Characterization of
the menA Gene from scherichia coli enaquinone ( Vitamin K 2 ) Biosynthesis :
Localization and Characterization of the menA Gene from Escherichia coli,
Journal of Bacteriology 180, 2782.
16. Lee, P. T., Hsu, A. Y., Ha, H. T., Clarke, C. F., Lee, P. T., Hsu, A. Y., Ha, H. T.,
and Clarke, C. F. (1997) A C-methyltransferase involved in both ubiquinone and
menaquinone biosynthesis : isolation and identification of the Escherichia coli
ubiE gene . A C-Methyltransferase Involved in Both Ubiquinone and
enaquinone Biosynthesis : Isolation and Identification, Journal of Bacteriology
179, 1748.
17. Chen, D., Wu, R., Bryan, T. L., and Dunaway-Mariano, D. (2009) In vitro kinetic
analysis of substrate specificity in enterobactin biosynthetic lower pathway

48
enzymes provides insight into the biochemical function of the hot dog-fold
thioesterase EntH., Biochemistry 48, 511-3.
18. Guo, Z.-F., Sun, Y., Zheng, S., and Guo, Z. (2009) Preferential hydrolysis of
aberrant intermediates by the type II thioesterase in Escherichia coli nonribosomal
enterobactin synthesis: substrate specificities and mutagenic studies on the active-
site residues., Biochemistry 48, 1712-22.
19. Leduc, D., Battesti, A., and Bouveret, E. (2007) The hotdog thioesterase EntH
(YbdB) plays a role in vivo in optimal enterobactin biosynthesis by interacting
with the ArCP domain of EntB., Journal of Bacteriology 189, 7112-26.
20. Merkel, S. M., Eberhard, a E., Gibson, J., and Harwood, C. S. (1989) Involvement
of coenzyme A thioesters in anaerobic metabolism of 4-hydroxybenzoate by
Rhodopseudomonas palustris., Journal of Bacteriology 171, 1-7.
21. Baba, T., Ara, T., Hasegawa, M., Takai, Y., Okumura, Y., Baba, M., Datsenko, K.
a, Tomita, M., Wanner, B. L., and Mori, H. (2006) Construction of Escherichia
coli K-12 in-frame, single-gene knockout mutants: the Keio collection., Molecular
Systems Biology 2, 2006.0008.
22. Chen, D. (2010) Divergence of Thioesterase Function: Human BFIT2, Escherichia
Coli EntH and ydiI. The University of New Mexico.

49
23. Sangurdekar, D. P., Srienc, F., and Khodursky, A. B. (2006) A classification based
framework for quantitative description of large-scale microarray data., Genome
Biology 7, R32.
24. Hirst, J., Sucheta, A., Ackrell, B. A. C., and Armstrong, F. A. (1996)
lectrocatalytic Voltammetry of Succinate Dehydrogenase : Direct Quantification
of the Catalytic Properties of a Complex Electron-Transport Enzyme, Journal of
the American Chemical Society 7863, 5031-5038.
25. Maklashina, E., Berthold, D. a, and Cecchini, G. (1998) Anaerobic expression of
Escherichia coli succinate dehydrogenase: functional replacement of fumarate
reductase in the respiratory chain during anaerobic growth., Journal of
Bacteriology 180, 5989-96.
26. Widhlam, J., Van Oostende, C., Furt, F., and Basset, J. A dedicated thioesterase
of the Hotdog-fold family is required for the biosynthesis of the naphthoquinone ring of
vitamin K1.., Proceedings of the National Academy of Sciences, 106, 5599-603.

50
CHAPTER THREE
FROM FORM TO FUNCTION: A STRUCTURAL APPROACH TO
EXAMINE THE DIVERGENCE OF YDII AND YBDB
THIOESTERASES FROM ESCHERICHIA COLI
3.1 Introduction
The structure-function relationships is an important goal in the understanding of
enzymes. The ability to deduce the substrate, product and chemical mechanism of an
enzyme without the need of experimentation will aide in the annotation of the rapidly
increasing number of genomes (1). The elucidation of the structure-function relationship
in an in vitro or in silico environment may be provide a deeper understanding of the
metabolic processes within the cell. One strategy of defining the structure-function
relationship is to examine how evolution has chosen certain fold families to perform
biochemical processes (2). As previously mentioned in Chapter 1, the hotdog-fold family
has been associated with various types of chemistries and have largely divergent amino
acid sequences. Examining the divergence in the structure-function relationship of two
closely related paralogs such as the Escherichia coli paralogs YdiI and YbdB (EntH),
may aide in defining how the placement of keys amino acid residues within a fold family
alters substrate binding, protein-protein interaction, or overall chemistry. Furthermore,
understanding how the structure-function relationship of two closely related paralogs
translates to physiological function may aide in a more accurate annotation of the
accumulating sequenced genes.

51
The physiological functions of YbdB and YdiI have been described in detail in
the previous chapters however, a brief summary is presented here. The E. coli
thioesterase YbdB has previously been reported to rescue the enterobactin synthesis
pathway, essential for ferric uptake under iron starvation conditions, by cleaving mis-
acylated molecules on the ArCP domain of the nonribosomal peptide synthetase EntB (3,
4). In addition to rescuing the mis-acylated EntB, YbdB has also been reported to
catalyze the hydrolysis of various aryl-CoA's in vitro and to a lesser degree, fatty acid-
CoA's (5). The strikingly high sequence identity to YbdB prompted the investigation of
YdiI’s capability to replace YbdB in the enterobactin synthesis pathway (ΔybdB::ydiI).
The inability of YdiI protein to replace the function of the YbdB protein suggested that
YdiI and YbdB have distinctly different in-vivo roles (3). The YdiI thioesterase was
shown in the previous chapter through kinetic evaluation and gene knockout experiments
to be involved in the synthesis of menaquinone (vitamin K2), an essential cofactor for
anaerobic respiration. Within the pathway, YdiI hydrolyzes 1,4-dihydroxynapthoyl-CoA
(DHNA-CoA) to form 1,4-dihydroxynapthoic acid (DHNA) and CoA. DHNA is further
processed by the addition of a polyisoprenyl side chain to form the final product of
menaquinone (vitamin K2).
Although YdiI and YbdB perform very different cellular functions, their structural
homology would indicate otherwise. As shown in Figure 3.1, YdiI and YbdB share a
high sequence identity (59%) and high sequence similarity (75%), uncommon to hotdog-
fold thioesterases.

52
Figure 3.1: Amino acid sequence alignment of YdiI and YbdB with secondary structures
generated by ESPript. Sequence identities are shown in the red background, similarities
are shown with red font, α-helices are depicted by loops and β-strands are depicted by
arrows.
The close sequence identity also translates into similar tertiary structures. Both
YdiI and YbdB contain an indistinguishable PaaI-like hotdog fold as shown in Figure
3.2-A (6). The active site for both proteins lies at the interface of the monomers. The
catalytic site is comprised of a glutamate and serine residue from the α-helix of one
monomer and a histidine, glutamine and backbone glycine from the loop of the opposing
monomer (Figure 3.2-B). The nearly identical catalytic site suggests that both YdiI and
YbdB share a common catalytic mechanism.

53
A B
Figure 3.2: A) Crystal structure overlay of YdiI (blue (unpublished PDB: Solved by Rui
Wu at Boston University)) and YbdB (red (unpublished PDB: Solved by Rui Wu at
Boston University)) generated by Chimera. B) Active site overlay of YdiI (blue
(unpublished PDB: Solved by Rui Wu at Boston University)) and YbdB (orange
(unpublished PDB: Solved by Rui Wu at Boston University)) with co-crystallized
phenacyl-CoA ligand (grey) generated by Chimera.
In this chapter, I will explore how the closely related YdiI and YbdB evolved to
perform their individual cellular functions. To do this, I will report on the mechanism by
which both YdiI and YbdB catalyze the hydrolysis of their substrate thioesters. The
mechanism for thioesterases is limited to either base or nucleophilic catalysis as depicted
in Figure 3.3. For base catalysis the active site glutamate activates the water nucleophile
that hydrolyzes the thioester whereas for nucleophilic catalysis the glutamate attacks the
thioester to form a mixed anhydride which, in a subsequent step hydrolyzed by water.
The mechanism was probed through the use of active site mutants, solvent 18
O
incorporation experiments, solvent kinetic isotope effects and pre-steady-state kinetics.
Additionally, I will report on the structural properties that enable each protein to

54
distinguish their substrates through kinetic analysis of substrate binding pocket mutants
and by examining the liganded YbdB and YdiI X-ray crystal structures.
Figure 3.3: Possible catalytic mechanisms (nucleophilic catalysis [blue] or base catalysis
[black]) for YdiI and YbdB.
3.2 Materials and Method
3.2.1 Materials
All restriction enzymes and T4 DNA ligase were purchased from Invitrogen. Pfu
Turbo and Deep Vent DNA polymerases were purchased from Strategene.
Oligonucleotide primers were custom-synthesized by Invitrogen. DNA sequencing was
performed by the DNA Sequencing Facility of the University of New Mexico. Benzoyl-
CoA was purchased from Sigma. 4-hydroxybenzyol-CoA was synthesized as previously
reported (7). The wild-type (WT) YdiI and WT YbdB were prepared as described in
Chapter 2.

55
3.2.2 Site-directed mutagenesis
Site-directed mutagenesis was carried out using the Quick Change PCR strategy
(Stratagene) containing the WT ydiI/pET-23a or WT ybdB/pET-23a plasmid as template,
commercial primers, and Pfu Turbo as the polymerase. The sequence of the mutated
gene was confirmed by DNA sequencing. The recombinant mutant plasmids were used
to transform competent E. coli BL21 Star (DE3) cells (Invitrogen). The mutant proteins
were purified to homogeneity (as determined by SDS-PAGE analysis) using the same
method reported in Chapter 2 for the wild-type proteins. Yield: 25 – 40 mg/g wet cell
paste.
3.2.3 Steady-state kinetic analysis
The kcat and Km values for wild-type and mutant YdiI and YbdB-catalyzed
hydrolysis of thioester substrates were determined as described in Chapter 2.
3.2.4 Inhibition of the WT enzyme-catalyzed hydrolysis of 4-hydroxybenzoyl-CoA
For 2,4-dihydroxyphenacyl-CoA inhibition, the WT YdiI or WT YbdB catalyzed
hydrolysis of benzoyl-CoA was monitored using the DTNB assay as described in Chapter
2. The assay solution contained WT enzyme, varying concentrations of substrate
benzyol-CoA, and varying concentrations of inhibitor (0, 20, and 50 µM). For CoASH
inhibition, the WT YdiI enzyme-catalyzed hydrolysis of 4-hydroxybenzoyl-CoA (4-HB-
CoA) was directly monitored at 300 nm as described in Chapter 2. The assay solution
contained WT enzyme, varying concentrations of 4HB-CoA, and varying concentrations

56
of CoASH. The inhibition constant Ki was obtained by fitting the initial rates to equation
(1):
V = Vmax[S]/[Km (1+[I]/Ki) + [S]] (1)
Where [I] = concentration of inhibitor and Ki = inhibition constant.
3.2.5 18
O-Solvent labeling experiments.
A 4.0 m solution containing 88.9 μ WT ydiI in 50 mM Tris and 50 mM NaCl
(pH 8.4) was lyophilized. To the resulting powder, 370 μ of 99.2% H218
O were added.
After 15 min incubation on ice, the enzyme was assayed to confirm retention of catalytic
activity. To the 370 μ solution, 30 μ of lyophilized (30 μ of 10 mM stock
concentration in normal isotopic water) benzoyl-CoA resuspended in 99.2% H218
O water
was added so that the final enzyme concentration was 889 μ and the final substrate
concentration was 750 μ . The reaction was allowed to incubate at room temperature
for 15 min. The reaction mixture was filtered using a 10 kDa micro separation filter
( illpore). The filtrate was acidified with 10 μ of 6 M HCl and extracted with 1 mL of
ethylacetate four times. The extract was dried over anhydrous sodium sulfate and the
solvent was evaporated in vacuo. The solid was resuspended in 10 μ of anhydrous
methyl alcohol and then subjected to GC/MS analysis. The same procedure was carried-
out with YdiI S67A. In this case 2.0 m of 93.3 μ YdiI S67A lyophilized and
reconstituted in 182 μ of 99.2% H218
O. To the reconstituted protein was added 18 μ
benzoyl-CoA for a final enzyme concentration of 933 μ and substrate concentration of
900 μ .

57
For the (multi-turnover) control experiment, 20 μ of 88.9 μM YdiI solution was
lyophilized. The powder was resuspended in 370 μ of 99.2% H218
O and to it was added
30 μ of reconstituted 10 m benzoyl-CoA in 99.2% H218
O. The final concentration of
YdiI was 45 μ and the final concentration of substrate was 750 μ .
GC/MS analysis was conducted with the extract on an Agilent 5975C Series
GC/MS with a Triple-Axis Detector. The temperature program for the analysis was as
follows: 250 oC inlet, 80
oC intial temperature held for 1 min and ramped to 180
oC at a
rate of 7 oC/min, then ramped to 250
oC at a rate of 20
oC/min and held for 6 min. The
mass analyzer was set to detect in the range of 50-450 m/z. The product of benzoic acid
eluted in the timeframe of 7.5 – 8.0 min.
3.2.6 Synthesis of 14
C radiolabled benzyol-CoA
[14
C]-benzoyl-CoA was synthesized enzymatically by using 4-hydroxybenozoic
acid ligase (4HBAL) from Rhodopseudomonas palustris. 4HBAL was purified by a
modification of a previously described procedure (8). In short, the 4HBAL/pET3a was
used to transform competent E. coli BL21 (DE3) cells (Invitrogen). A single colony was
used to inoculate 10 mL LB media containing 50 µg/ml ampicillin. The culture was
scaled, the gene expression induced, the cells were harvested described about. The cells
were resupended in 50 mM K+HEPES (pH 7.5) lysis buffer then lysed as described
above. The cleared supernant was fractioned by ammonium-sulfate induced
precipitation. The protein precipitated with 0-35 % ammonium sulfate and was harvested
by centrifugation at 20,000 rpm for 15 min. The protein pellet was resuspended in 10X
its weight of 50 mM K+HEPES buffer pH 7.5 containing 1 M ammonium sulfate (Buffer
58
A) and loaded onto a FPLC attached 30 x 1 cm butyl sepharose column equilibrated with
5 CV of Buffer A. The column was washed until the A280 reached baseline and the
protein was eluted with a gradient of 0-50% 50 mM K+HEPES pH 7.5 (Buffer B). The
protein eluted at 35% Buffer B and the fractions were combined, concentrated and
dialyzed 3 times against Buffer B.
[14
C]-Benzoyl-CoA was synthesized in a 1 mL reaction solution containing 100
mM K+HEPES, 5 mM MgCl2, 13 mM CoA, 13 mM ATP, and 5 µM 4HBAL. [
14C]-
Benzoic acid with a specific activity of 56 mCi/mol (American Radiolabeled Chemicals
Inc.) was made into the sodium salt by the addition of 150 µL 0.1 M NaOH before adding
it to the reaction for a final concentration of 9 mM. The reaction was allowed to incubate
at room temperature overnight and then quenched by the addition of 1 M HCl. The
precipitated protein was harvested by centrifugation. [14
C]-Benzoyl-CoA was purified
from the crude reaction over a semi-prep Ultra Aqueous C-18 reverse phase HPLC
column (RESTEK) eluted with a 50% linear gradient of 20 mM KH2PO4 (pH 6.1)
(Buffer A) and 80% CH3CN (Buffer B) over 35 min. The desired compound eluted at ~
14 min. The fractions containing the final compound were combined and lyophilized to
powder.
3.2.7 Rapid-quench studies of the wild-type ydiI catalyzed hydrolysis of benzoyl-
CoA under single and multiple turnover conditions
Rapid-quench experiments were carried out at 25 oC using a rapid-quench
instrument from KinTek Instruments. For the multiple turnover reaction of WT YdiI
catalyzed hydrolysis of [14
C]- benzoyl-CoA, the final concentration of enzyme is 10 µM

59
and the substrate is 50 µM. For the single turnover reaction, the final concentration of
enzyme is 50 µM and the substrate is 5 µM. The reactions were initiated by mixing the
enzyme with the [14
C]-benzoyl-CoA in 10 mM K+HEPES buffer (pH 7.5) containing 0.1
M NaCl and then quenched after a specific time with 0.2 M HCl. Protein was separated
from the quenched reaction mixture using a 10,000 MWCO centrifuge column
(Millipore). The [14
C]-benzoyl-CoA and [14
C]-benzoic acid were separated on an
analytical C18 column (RESTEK) by HPLC using the same procedures as described
above and quantified using an in-line β-RAM4 (Lab Logic) scintillation counter. Peak
integrations were performed by Laura software (Lab Logic) and the relative ratios were
used to calculate the substrate and product concentrations. The plotted time course
concentrations were fitted by simulation using KinTek Corp. Global Kinetic Explorer.
3.2.8 Stopped-flow kinetic experiments of wild-type ydiI
A DX.17MV sequential stopped-flow spectrometer (Applied Photophysics,
Leatherhead, U.K.) with a dead time of 3 ms was used for measurement of transient rate
constants of WT YdiI thioesterase hydrolysis of 4-HB-CoA. All experiments were
carried out in 50 mM K+HEPES buffer (pH 7.5) at 25
oC and were run in triplicate.
Substrate consumption was monitored at 300 nm (Δε = 11.8 m -1
cm-1
). A single-
turnover reaction mixture consisted of 60 µL of 124 µM WT YdiI mixed with 60 µL of
100 µM 4-HBA-CoA to give a final concentration of 62 µM YdiI and 50 µM substrate.
The measured data was fitted to the single exponential decay equation 3. The multiple-
turnover reactions contained 60 µL of 200 µM 4-HB-CoA mixed with 60 µL of 20, 32,

60
and 40 µM WT YdiI. The final concentration of 4-HBA-CoA was 100 µM and the final
enzyme concentrations were 10, 16, or 20 µM.
f = a*exp(-b*x) (3)
3.2.9 Solvent kinetic isotope effects on WT ydiI and ybdB
The steady-state kinetic constants of WT YdiI and YbdB thioesterase catalyzed
hydrolysis of 4-HB-CoA at pL 7.0 and 7.5 were determined by direct monitoring at 300
nm as described above. Deuterated solvent was made by dissolving 50 mM K+HEPES in
D2O and adjusted to the according pD by 30% DCl or 30% NaOD in D2O. Kinetic
constants determined at different pLs were used to calculate kH/kD.
3.3 Results and Discussion
3.3.1 Steady-state kinetics of the active site mutants E63A, Q48A, H54A, H89A, and
S67A
The X-ray crystal structure of the wild-type E. coli YbdB and YdiI revealed
numerous interactions between the ligand and the enzyme. As shown in Figure 3.4 A, the
YdiI Glu63 is poised to hydrolyze the thioester carbonyl with the possible assistance
from His89. The distance of the Glu63 (3.8 Å) suggests that the residue is within striking
distance for nucleophilic catalysis. Additionally, as was reported for Arthrobacter sp. SU
4-hydroxybenzoyl-CoA thioesterase (4HBT), a glutamine (Gln48) might activate the
carbonyl through hydrogen bonding to the carbonyl oxygen provide the side chain rotates
into a closer position (distance from the amine to the oxygen of 4.7 Å provided that the
substrate analog is in the absolute postioin) (9). Also within hydrogen bonding distance
to the carbonyl oxygen is His54 (3.2 Å) which could also contribute to the activation of
the carbonyl (Figure 3.4 B).

61
A
B
C
Figure 3.4 A: Active site distances of Glu63 to the carbonyl and His89 to Glu63 in YdiI
(blue (unpublished PDB: Solved by Rui Wu at Boston University)) with the bound ligand
phenacyl-CoA (grey) in truncated form. B - Active site distances of Gln48 and His54 to
the carbonyl in YdiI (blue (unpublished PDB: Solved by Rui Wu at Boston University))

62
with the bound ligand phenacyl-CoA (grey) in truncated form. C - General orientation of
the YdiI active site with bound ligand phenacyl-CoA (grey)
Because the phenacyl-CoA substrate analog might, owing to the added “CH2”
between the carbonyl carbon and the sulfur atom, bind in a nonproductive conformation,
the enzyme-ligand interactions suggested by the X-ray structure must be tested.
Therefore, to probe these enzyme interactions and as well as the catalytic mechanism,
mutants were made by replacing the active site residue with alanine (the methyl side
chain is chemically inert) and the steady-state constants for the mutants were measured
using the benzoyl-CoA thioester as substrate. The results are reported in Table 3.1. The
YdiI E63A mutant was completely inactive, in line with reported results from a
previously reported mutagenesis study of YbdB (3). Because the crystal structure
containing the ligand was devoid of an ordered active site water molecule and because of
the close distance of Glu63 to the reaction site, it was thought that the glutamate residue
acted as a nucleophile. Switching the residue to an aspartate should increase the
spanning distance by one carbon length (total distance ~ 5 Å) but not completely abolish
the enzyme from activity. The YdiI E63D mutant does retain activity as compared to the
WT YdiI but at a penalty of ~ 2 x 10³ reduced efficiency. The YdiI E63Q mutant was
prepared and found to be devoid of activity. The YdiI H89A mutant was found to have a
100-fold reduction in catalytic activity. YdiI His89 may align Glu63 for either
nucleophilic attack or water activation via hydrogen bonding.

63
YbdB YdiI
Mutants kcat (s1)
KM
(µM)
kcat/KM
(M-1
s-1
)
Mutants kcat (s1) KM (µM)
kcat/KM
(M-1
s-1
)
WT 2.2 ± 0.1 12 ± 1 1.8 x 10⁵ WT 18 ± 1 25 ± 3 7.2 x 10
5
E63A < 10-4
E63A <10-4
E63D* E63D 0.040 ± .002 120 ± 10 3.39 x 10²
E63Q* E63Q <10-4
Q48A < 10-4
Q48A 0.051 ± .002 12 ± 1 4.40 x 10²
S67A* S67A 2.5 12.6 1.98 x 10⁵
H89A* H89A 0.82 ± 0.02 180 ± 10 2.5 x 10³
H54A < 10-4
H54A 0.14 ± .01 100 ± 10 1.41 x 10³
Table 3.1: Steady-state kinetic constants for YbdB or YdiI mutant catalyzed hydrolysis
of benzoyl-CoA; measured using DTNB spectrophotometric assay at pH 7.5 and 25
oC.
The * represents mutant data not obtained.
Other active site mutants were also prepared to probe enzyme interactions with
the substrate. As mentioned previously, the catalytic scaffold loop glutamine of the
Arthrobacter sp. strain SU 4HBT is known to activate the thioester carbonyl by hydrogen
bonding to the oxygen atom. Because YdiI also contained a similarly positioned
glutamine, the YdiI Q48A mutant was prepared for evaluation. The Ala replacement of
the glutamine residue diminished the efficiency of catalysis by ~1000-fold (kcat decreased
from 18 s-1
to 0.05 s-1
) reflecting its importance its putative activation of the thioester
carbonyl. This same mutation in YbdB resulted in total loss of catalytic activity. YdiI
His54 is another active site residue that was queried because of its potential role in
64
interacting with the thioester carbonyl. The YdiI H54A mutant displayed a 100-fold
decrease in catalytic activity. The last key residue located in the active site is YdiI Gly55
however, because it is the backbone amine that possibly contributes to the activation of
the carbonyl, its role could not be probed by site-directed mutagenesis
3.3.2 Comparing the pH profiles of YbdB and YdiI
All steady-state kinetic parameters were carried out at pH 7.5. To verify that this
pH was within the optimum range of catalysis for YdiI and YybdB a pH profile of
catalyzed 4-HB-CoA hydrolysis was measured. As illustrated in Figure 3.5, the YdiI the
kcat pH profile reflects increasing turnover rate as the pH is increased from 5 to 6, at
which point it begins to plateau at and remains flat to approximately pH 8.5 (apparent
pKa ~ 6.7). The kcat pH profile for ybdB similarly begins to level at approximately pH
6.7 however, unlike YdiI, the turnover rate begins to drop taper off at ~pH 7.8. The
profiles for both YdiI and YbdB suggest that the optimal range for catalysis is between
pH 7.0 ~ 8.0.

65
Figure 3.5 - Profile of pH dependence showing log kcat vs. pH for the WT YdiI (○) and
WT YbdB (●) catalyzed hydrolysis of 4-hydroxybenzoyl-CoA measured by direct assay
at 300 nm and at 25oC.
3.3.3 18
O incorporation into benzoic acid by WT YdiI and the mutants S67A and
E63D
To distinguish between the general base and nucleophilic catalysis mechanisms
the solvent 18
O-oxygen labeling experiment was conducted. The premise of this
experiment is highlighted in Figure 3.6. If the thioesterase Glu functions in base catalysis,
a single turnover reaction carried out in 99.2% H218
O will result in the incorporation of
the 18
O into the carboxylic acid product. Thus the level of 18
O incorporated will reflect
the solvent isotopic composition (99.2% 18
O and 0.8% 16
O). Only if the Glu carboxylate
functions in nucleophilic catalysis is the incorporation of the 16
O-derived from Glu
possible. Unfortunately, if the 18
O-labeled water nucleophile is positioned to attack the
anhydride intermediate at the substrate carbonyl carbon rather than the Glu carbonyl

66
carbon, then one would not observe 16
O transfer to the carboxylic acid product but
instead would observe 18
O-incorporation.
Figure 3.6 – Depiction of solvent 18
O (green and blue) incorporation pathways for
nucleophilic catalysis (left) or base catalysis (right).
Benzoyl-CoA was utilized in this experiment because it is a very active substrate
and because the product, benzoic acid (MW = 121.1) is easily isolated by organic solvent
extraction for GC-MS analysis (Figure 3.7). The benzoic acid generated in the control
experiment gave a single m/z peak at 121.1 with fragmentation peaks correlating to the
loss of hydroxide (m/z = 16) at 105.1 and the remaining fragmentation of the +C=O (m/z
= 28) at 77.1 (not shown). The single turnover experiment utilizing WT YdiI yielded a
mass spectrum containing two benzoic acid peaks at m/z = 122.1 and 124.1 suggesting
the incorporation of 18
O into the product. The 16
O: 18
O peak ratio was approximately 1:6.
The fragmentation peaks suggest the ratio of 16
O: 18
O was conserved through the loss of

67
hydroxide yielding two peaks at 105.1 and 107.1 at a ratio of 1.1:1, 16
O: 18
O respectively.
The further loss of the +C=O yielded only one peak at 77.1 which confirms the
incorporation of 18
O.
Figure 3.7 - GC-MS spectra of the product of WT YdiI thioesterase-catalyzed hydrolysis
of benzoyl-CoA in 99.2% 18
O water under single-turnover conditions.
The benzoic acid isolated from multiple turnover reaction showed two peaks,
again at m/z of 122.1 and 124.1 with a ratio of 16
O: 18
O at 1:17 (Figure 3.8) also
suggesting the incorporation of 18
O. This control was executed to determine if the
experimental 16
O: 18
O ratio was correct by showing the diminished ratio due to multiple
turnovers. However, the 16
O peak only diminished to 1:17 suggesting that the previous
experimental 16
O peak may be less significant.

68
Figure 3.8 - GC-MS spectra of the product of WT YdiI thioesterase-catalyzed hydrolysis
of benzoyl-CoA in 99.2% 18
O water under multiple-turnover conditions.
Using the mutant YdiI S67A for the18
O exchange could help clarify the
mechanism if the residue is in fact positioning a water molecule during catalysis. As
prior, if the Ser67 is prevented from directing the attack of the water nucleophile at the
benzoyl carbonyl carbon by mutation to Ala the 16
O: 18
O incorporation might increase,
reflecting increased attack at the Glu carbonyl carbon. The single turnover reaction was
repeated with YdiI S67A and the benzoic acid product isolated and analyzed to reveal the
peaks at m/z of 122.1 and 124.1 which defined the 16
O: 18
O ratio as 1:9 (Figure 3.9). The
lack of an increase in the 16
O peak indicates that Ser67 may not play a significant role in
water positioning. This is contrary to what was observed for the single turnover reaction
carried out with Arthrobacter sp. SU 4HBT mutant T77A. In this thioesterase the 4HBT
Thr77 occupies the same position on the catalytic scaffold as does the Ser67 in YdiI. The
single turnover experiment carried out with Arthrobacter sp. SU 4HBT mutant T77A
under similar conditions gave an increased amount of 16
O incorporation (near 50%)

69
suggesting that the Thr77 does serve to position water for attack on the acyl group rather
than the enzyme (10).
Figure 3.9 - GC-MS spectra of the product of YdiI S67A thioesterase catalyzed
hydrolysis of benzoyl-CoA in 99.2% 18
O water under single-turnover conditions.
In an attempt to manipulate the catalytic mechanism from the assumed
nucleophilic catalysis to base catalysis the YdiI E63D mutant was used in the 18
O
experiment. In contrast to what was seen in the WT YdiI single turnover experiment, the
level of 16
O incorporation was found to be insignificant (Figure 3.10), consistent with no
anhydride intermediate formation by the Glu63.

70
Figure 3.10 - GC-MS spectra of the product of YdiI E63D thioesterase-catalyzed
hydrolysis of benzoyl-CoA in 99.2% 18
O water under single-turnover conditions.
3.3.4 Solvent kinetic isotope effects on ydiI and ybdB
Because the kcat pH profile for both YdiI and YbdB indicated that the kcat value is
invariant within the pH range of 7.0 - 7.5, the deuterium solvent isotope effect (SIE) was
determined for pH 7.0 and 7.5. A secondary SIE (kH/kD >1) would suggest that the
chemistry is rate limiting whereas a primary SIE (kH/kD <1) would suggest that substrate
binding or product leaving would be rate limiting. The results are reported in Table 3.2.
The SIE for YbdB measured at pH 7.0 and 7.5 are kH/kD = 2.2 and kH/kD = 2.5,
respectively. The SIE measured for YbdB at pH 7.0 and 7.5 are kH/kD = 2.2 and kH/kD =
2.5, respectively. The SIE measured for YdiI at pH 7.0 and 7.5 are kH/kD = 1.7 and kH/kD
= 1.9, respectively. The SIE for YdiI and YbdB suggest that the chemical step is rate
limiting.

71
pH (D) 7.5 pH (D) 7.0
H2O D2O kH/kD H2O D2O kH/kD
YbdB 1.2 ± 0.1 0.55 ± 0.05 2.2 1.2 ± 0.1 0.46 ± 0.03 2.5
YdiI 5.2 ± 0.2 3.1 + 0.1 1.7 2.9 ± 0.1 1.60 ± 0.03 1.9
Table 3.2. D2O solvent kinetic isotope effects on the YbdB and YdiI-catalyzed
hydrolysis of 4-hydroxybenzyol-CoA at 25 oC pH (D) = 7.5 or 7.0 monitored at 310 nm.
3.3.5 Pre-steady-state kinetics analyzed by stopped-flow absorbance
A single turnover reaction was performed to verify the steady-state kcat. As
shown in Figure 3.11, fitting to a single exponential decay provided a kobs of 5.8 s-1
which
is in reasonable agreement to the steady-state kcat value of 5.2 s-1
. To detect if YdiI
displays pre-steady state "burst" kinetics, a multiple-turnover reaction was performed.
As shown in Figure 3.12, there is no apparent burst of substrate consumption associated
with the first catalytic turnover. If a "burst" phase was present, the first turnover,
equivalent to the concentration of enzyme, would be followed by a slow linear phase
associated with subsequent turnovers. The apparent lack of a "burst" phase is consistent
with a single rate-limiting chemical step, as expected for the base catalysis pathway. It is
also consistent with the two-step chemical pathway associated with nucleophilic catalysis
provided that the first step, viz. formation of the anhydride intermediate is rate-limiting.
That said, the absence of the burst phase might also be attributed to an experimental
artifact. Specifically, the ~5 ms delayed response to the decrease in absorbance at 300 nm

72
observed for the single-turnover reaction (Figure 3.12) is problematic in that it indicates a
“dead-time” associated with solution mixing or with absorbance detection. n the other
hand, the lag is not apparent in the multiple-turnover time courses measured for reaction
solutions containing significantly lower enzyme concentrations. High enzyme
concentration results in a high background absorbance at 300 nm.
Figure 3.11 - Single turnover reaction trace (black) containing a final concentration of 50
µM 4HB-CoA and 62 µM YdiI measured by stopped flow at 300 nm and fitted to single
exponential decay (red).

73
Figure 3.12: Multiple turnover reaction containing a final concentration of 100 µM
4HBA-CoA and 10, 16, and 20 µM YdiI measured by stopped flow at 300 nm.
3.3.6 Reaction time course analysis
For global kinetic fitting to be perfromed, ideally several sets of time course
measurements (e.g., for single-turnover, multiple-turnover, steady-state and substrate-
binding reactions) are required. The substrate binding reaction is typically monitored
using stopped-flow fluorescence techniques, wherein the fluorescence emanating from a
binding site Trp residue is quenched as the result of substrate binding. Unfortunately,
YdiI does not contain a Trp residue within its substrate binding pocket. Thus, only the
steady-state time course data could be used to supplement to the stopped-flow absorbance
curves. Accordingly, the YdiI (0.022 µM) catalyzed hydrolysis of 20 and 30 µM benzoyl-
CoA was monitored at 412 nm using the DTNB-coupled assay. The absorbance was
converted to concentration using the molar extinction coefficient (13.1 mM-1
cm-1
) and the
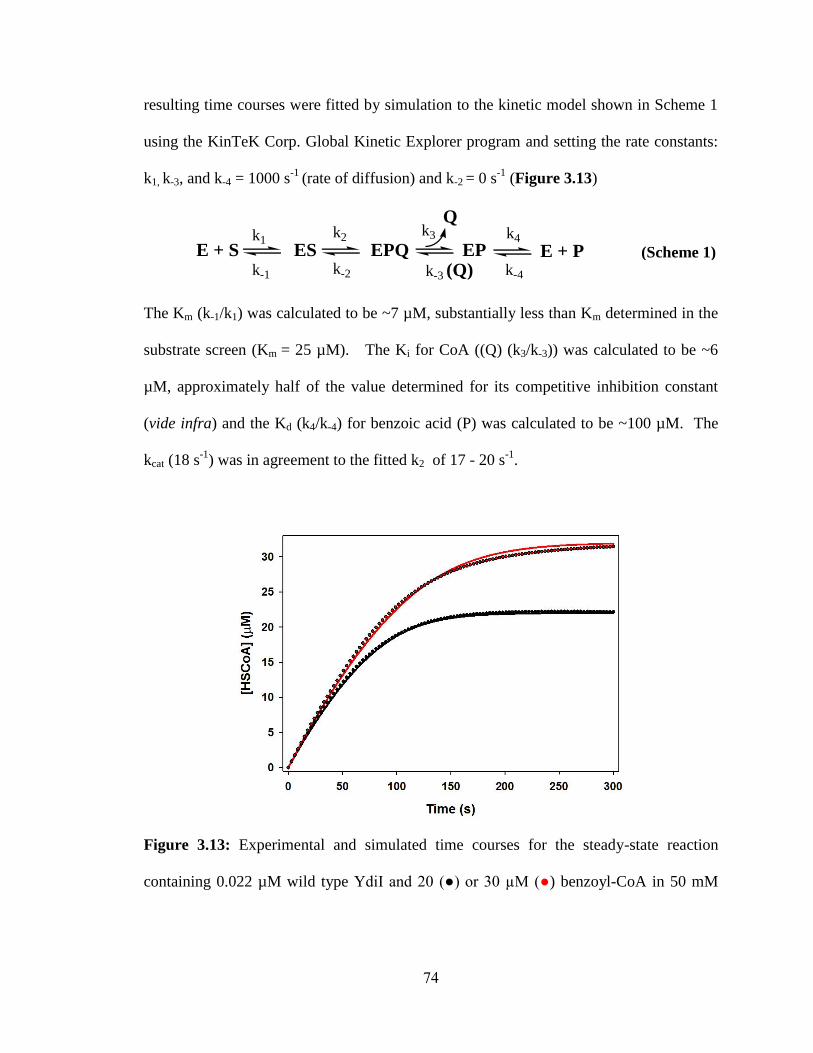
74
resulting time courses were fitted by simulation to the kinetic model shown in Scheme 1
using the KinTeK Corp. Global Kinetic Explorer program and setting the rate constants:
k1, k-3, and k-4 = 1000 s-1
(rate of diffusion) and k-2 = 0 s-1
(Figure 3.13)
The Km (k-1/k1) was calculated to be ~7 µM, substantially less than Km determined in the
substrate screen (Km = 25 µM). The Ki for CoA ((Q) (k3/k-3)) was calculated to be ~6
µM, approximately half of the value determined for its competitive inhibition constant
(vide infra) and the Kd (k4/k-4) for benzoic acid (P) was calculated to be ~100 µM. The
kcat (18 s-1
) was in agreement to the fitted k2 of 17 - 20 s-1
.
Figure 3.13: Experimental and simulated time courses for the steady-state reaction
containing 0.022 µM wild type YdiI and 20 (●) or 30 µ (●) benzoyl-CoA in 50 mM
E + S ES EPQ EP E + P
Qk1
k2k3 k4
k-1 k-2 k-3 k-4(Q)(Scheme 1)

75
K+HEPES (pH 7.5, 25
oC). The simulated curves were generated using the kinetic model
in Scheme 1.
Rapid quench techniques were used in conjunction with [14
C]-benzoyl-CoA as an
independent method to measure the time courses for single and multiple-turnover
reactions. The single turnover time course measured for a reaction solution initially
containing 50 µM WT YdiI and 20 µM [14
C]-benzoyl-CoA (Figure 3.14); was fitted by
simulation using to the kinetic model shown in Scheme 1. The value of k2 was restricted
to 0 s-1
. For the single turnover reaction, only the rates k1, k-1, k2, and k-2 had an effect on
the fitting. The following set of rate constants were obtained from fitting the single
turnover reaction k1 = 50-125 µM-1
s-1
, k-1 = 400-650 s-1
, k2 = 15 - 19.5 s-1
, and k-2 = 0 s
-1.
The value of the rate constant k2, was in good agreement to value of the steady-state kcat
(18 s-1
).
Figure 3.14: Experimental and simulated time courses for the single turnover reaction
containing 50 µM wild type YdiI and 20 µM [14
C] benzoyl-CoA in 50 mM K+HEPES

76
(pH 7.5, 25 oC). The time point data [
14C]-benzoyl-CoA (●) and [
14C]-benzoic acid (●)
were calculated from the fraction of [14
C]-benzoyl-CoA and [14
C]-benzoic acid present in
the acid quenched reaction. The simulated curves were generated using the kinetic model
shown in Scheme 1.
The time course for the reaction of 50 µM [14
C]-benzoyl-CoA with 4 and 20 µM
YdiI are shown in Figure 3.15. No burst phase was observed nor could the time course
data be fitted by simulation using the kinetic model (Scheme 2) that incorporates the
formation of a chemical intermediate prior to the rate-limiting step.
Subsequently, the kinetic model was employed in curve simulation in the same manner
used to simulate the single-turnover time course data. In good agreement with the rate
constants defined by the single-turnover data and the steady-state kinetic data, the k1 =
90-180 µM-1
s-1
, k-1 = 550-650 s-1
, k2 =15.5-19 s-1
, the k3 = 670-900 s-1
, k-3 = 90-130 µM-
1s
-1 (k3/k-3 ~ 7 µM), k4 = 160-400 s
-1 and k-4 = 3 µM
-1s
-1 (k4/k-4 ~ 100 µM).
E + S ES EPQ EP E + P
Qk1
k2 k4 k5
k-1 k-2 k-4 k-5
EIQk3
k-3
(Scheme 2)

77
A B
Figure 3.15: Experimental and simulated time courses for the multiple turnover reaction
containing 4 µM wild type YdiI and 50 µM [14
C]-benzoyl-CoA (A) or 20 µM wild type
ydiI and 50 µM [14
C]-benzoyl-CoA (B) in 50 mM K+HEPES (pH 7.5, 25
oC). The time
point data [14
C]-benzoyl-CoA (●) and [14
C] benzoic acid (●) were calculated from the
fraction of [14
C] benzoyl-CoA and [14
C] benzoic acid present in the acid quenched
reaction. The simulated curves were generated using the kinetic model in Scheme 1.
3.3.7 Kinetic analysis of substrate binding residues
When comparing the substrate binding pocket of YbdB to YdiI, only one
significant residue change is found: YbdB Met68 vs YdiI Val68. The Met68 residue
appears to protrude into the binding pocket whereas the Val68 does not. The conserved
aromatic residues Phe50 and Tyr/Phe71 provide a cap to the binding pocket and in
combination with the Met/Val68 residue, are posited to function in substrate
discrimination. To test this proposal, site-directed mutants YbdB M68V, YdiI V68M,
Y71A, and Y71A/F50A were prepared for kinetic analysis. In addition, the mutants
YbdB M68V and YdiI V68M were prepared for the purpose of determining if residue
swapping results in specificity exchange.
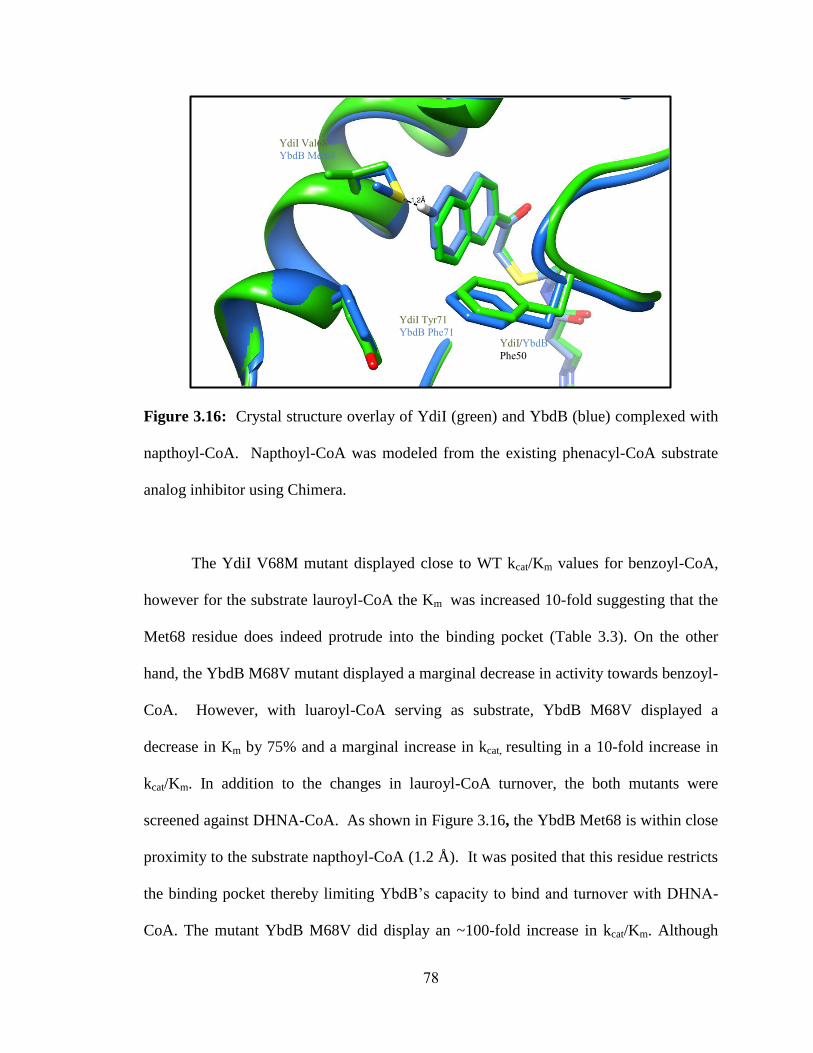
78
Figure 3.16: Crystal structure overlay of YdiI (green) and YbdB (blue) complexed with
napthoyl-CoA. Napthoyl-CoA was modeled from the existing phenacyl-CoA substrate
analog inhibitor using Chimera.
The YdiI V68M mutant displayed close to WT kcat/Km values for benzoyl-CoA,
however for the substrate lauroyl-CoA the Km was increased 10-fold suggesting that the
Met68 residue does indeed protrude into the binding pocket (Table 3.3). On the other
hand, the YbdB M68V mutant displayed a marginal decrease in activity towards benzoyl-
CoA. However, with luaroyl-CoA serving as substrate, YbdB M68V displayed a
decrease in Km by 75% and a marginal increase in kcat, resulting in a 10-fold increase in
kcat/Km. In addition to the changes in lauroyl-CoA turnover, the both mutants were
screened against DHNA-CoA. As shown in Figure 3.16, the YbdB Met68 is within close
proximity to the substrate napthoyl-CoA (1.2 Å). It was posited that this residue restricts
the binding pocket thereby limiting YbdB’s capacity to bind and turnover with DHNA-
CoA. The mutant YbdB M68V did display an ~100-fold increase in kcat/Km. Although
YdiI/YbdB
Phe50
YdiI Tyr71
YbdB Phe71
YdiI Val68
YbdB Met68

79
promising, the reverse mutant YdiI V68M saw an increase in efficiency by ~ 2 fold. The
essential lack of change in efficiency may be explained by the increased distance (1.8 Å)
between the YdiI M68V mutant to the napthoyl substrate as compared to wild type YbdB
(Figure 3.17), an unexpected possibility.
Figure 3.17: Crystal structure of the active site of the YdiI with napthoyl-CoA modeled
from the existing phenacyl-CoA and the mutant V68M modeled by Chimera.

80
Table 3.3 - Steady-state kinetic constants for YbdB or YdiI binding pocket mutant
catalyzed hydrolysis of benzoyl-CoA, lauroyl-CoA, or DHNA-CoA thioesters; measured
using DTNB spectrophotometric assay at pH 7.5 and 25 oC.
Looking further into the binding pocket, the mutant YdiI Y71A demonstrated a
increase in Km by 2-fold as well as an increase in kcat by approximately 1.5 fold towards
benzoyl-CoA. The increase in Km can be associated by the loss of favorable non-polar
interactions and possibly the loss of the ability to pi-stack between the Tyr residue and
the aromatic substrate. The increase in kcat cannot be readily explained.
3.3.8 Inhibition of WT YdiI and YbdB
To gain further insight into the structural determinants of substrate recognition,
the binding affinities of inert substrate analogs were measured. The binding affinities
were accessed from the inhibition constants measured using steady-state kinetic
techniques. The results are reported in Table 3.4. The Ki measured for the substrate
Benzoyl-CoA Lauroyl-CoA DHNA-CoA
Variant kcat (s1)
kcat/KM
(s-1
µM-1
)
kcat (s1)
kcat/KM
(s-1
µM-1
)
kcat (s1)
kcat/KM
(s-1
µM-1
)
WT YbdB 2.2 ± 0.1 1.8 x 10⁵
(2.81 ± 0.03)
x 10-2
6.210
2
(9.3 ± 0.2)
x 10-3 5.8 x 10
2
M68V 1.75 ±
0.04 7.3 x 10
4 (4.6 ± 0.4)
x 10-2 4.5 x10
3 (1.6 ± 0.2)
x 10-1
2.7 x 10⁴
WT YdiI 18 ± 1 7.2 x 10⁵ 0.74 ± 0.01 3.4 x 10
5 1.58 ± 0.03 2.0 x 10
5
V68M 28 ± 1 1.0 x 10⁶ 0.77 ± 0.03 2.8 x 10
4 0.8 ± 0.1 4.0 x 10
5
Y71A 28 ± 1 4.6 x 10⁵
0.95 ± 0.02 2.8 x 10⁵ - -

81
analog phenacyl-CoA is in good agreement with the Km value measured for the substrate
counterpart benzoyl-CoA. In addition there is no significant difference in the Ki values
measured for YbdB and YdiI. In contrast, the Ki value measured for 2,4
dihydroxyphenacyl-CoA inhibition of ydiI is 2.5 M vs 65 M measured for Ybdb. The
YdiI binding site is better at accommodating the ring hydroxyl groups than is that of the
YbdB.
The CoASH binding affinity was evaluated by measuring its Ki value as a product
inhibitor vs 4-HB-CoA. The Ki measured with YdiI (16 M) is significantly smaller than
that measured with YbdB (210 M). This is consistent with the YdiI specialization
towards a CoA thioester substrate and YbdB specialization towards a holoACP domain
(in EntB) thioester substrate.
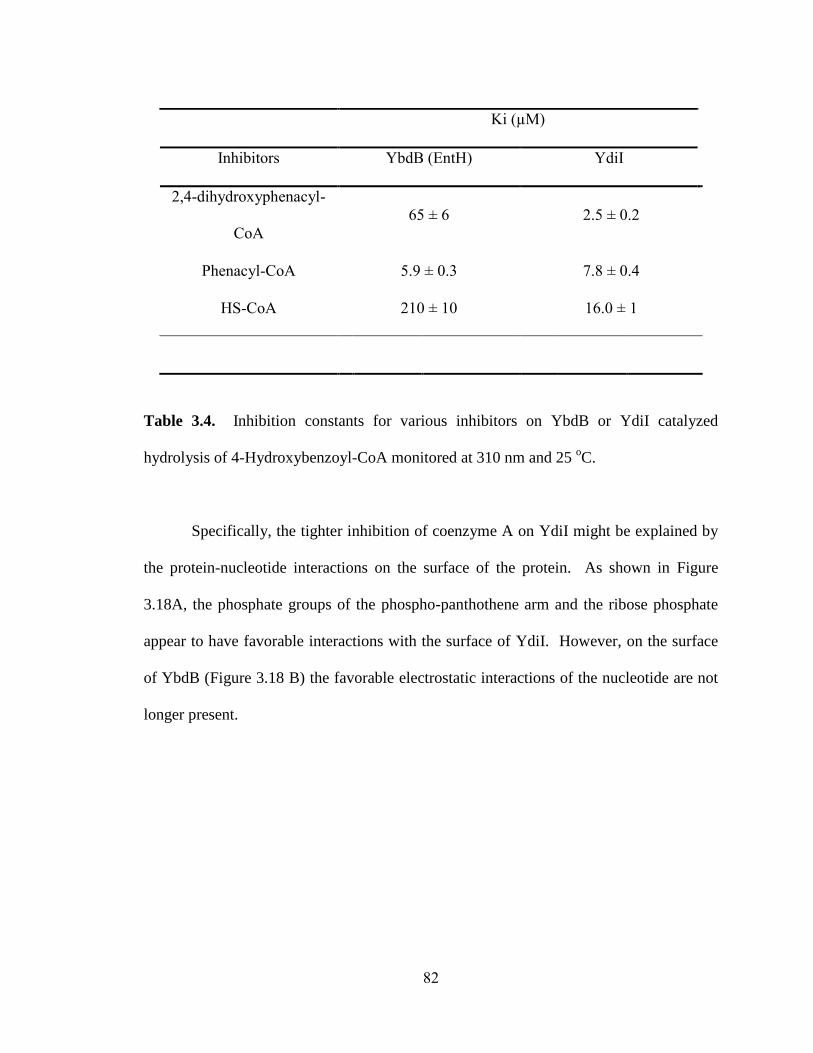
82
Table 3.4. Inhibition constants for various inhibitors on YbdB or YdiI catalyzed
hydrolysis of 4-Hydroxybenzoyl-CoA monitored at 310 nm and 25 oC.
Specifically, the tighter inhibition of coenzyme A on YdiI might be explained by
the protein-nucleotide interactions on the surface of the protein. As shown in Figure
3.18A, the phosphate groups of the phospho-panthothene arm and the ribose phosphate
appear to have favorable interactions with the surface of YdiI. However, on the surface
of YbdB (Figure 3.18 B) the favorable electrostatic interactions of the nucleotide are not
longer present.
Ki (µM)
Inhibitors YbdB (EntH) YdiI
2,4-dihydroxyphenacyl-
CoA
65 ± 6 2.5 ± 0.2
Phenacyl-CoA 5.9 ± 0.3 7.8 ± 0.4
HS-CoA 210 ± 10 16.0 ± 1

83
Figure 3.18 A - Surface electrostatic representation of YdiI (PDB unpublished) with the
nucleotide unit of phenacyl-CoA substrate analog where blue is electropositive and red is
electronegative. B - Surface electrostatic representation of YbdB (PDB unpublished)
with the nucleotide unit of phenacyl-CoA substrate analog maintaining the same color
distinguishments.
3.4 Conclusions
The E. coli hotdog-fold thioesterases YdiI and YbdB are an ideal system to
monitor divergence from an evolutionary standpoint. The paralogs are closely related,
especially amongst the fold family, having a 59% sequence identity, but have distinct
physiological functions. The conservation of residues is best modeled in the active site
where all catalytically active amino acids are conserved. Site direct mutagenesis on YdiI
active site residues have identified Glu63, Gln48, His54 and His89 as major contributors
to catalysis. The crystal structure with the phenacyl-CoA substrate analog has shown
Glu63 3.8 Å from the thioester carbonyl, at the cusp of both nucleophilic and base
catalysis. The remaining residues contribute to substrate activation (His54/Gln48) or to a
hydrogen bonding network (His89). To determine the mode of catalysis, 18
O

84
incorporation reaction were carried out. Like the crystal structure, the mode of catalysis
remains unclear due to the incorporation of both 16
O and 18
O with the latter being the
majority.
Even though the 18
O incorporation experiment did not provide conclusive
evidence towards the mode of catalysis, transient state kinetic rates were still sought
after. The first attempt of elucidating the microscopic rates used stopped flow
absorbance however the near A280 molar extinction coefficient did not allow for accurate
modeling. However, the stopped flow results did provide a multiple turnover experiment
that did not demonstrate "burst" kinetics. Rapid quench was used as a second more
accurate attempt of determining the microscopic rate constants. Global fitting to a
multiple turnover, single turnover and steady state reactions provided a reaction
mechanism that does not utilize a substrate-enzyme intermediate and the following rates
best describes the overall reaction; k1 ~105 µM-1
s-1
, k-1 ~ 650 s-1
, k2 ~ 18 s-1
, k-2 = 0 s-1
, k3
~ 700 s-1
, k-3 ~ 130 µM-1
s-1
, k4 ~ 300 s-1
, and k-4 ~ 2 µM-1
s-1
. As expected, no single rate
can best be fitted to the data, instead a range of rates fit the data within a reasonable error
range.
The binding pockets of YdiI and YbdB are fairly conserved with the exception of
YbdB Met68 and YdiI Val68. It was predicted that the Met68 residue restricts the
binding pocket of YbdB thereby "screening" the substrates since the modeled crystal
structure shows steric strain with the napthoyl-CoA substrate. This hypothesis was tested
by making the YbdB M68V mutant and it's YdiI reciprocal. From the steady state
analysis, the YbdB M68V mutant demonstrated an increase in efficiency with DHNA-
CoA by ~ 102 M
-1s
-1. Although the YdiI V68M mutant was expected to have a similar

85
decrease in efficiency with the DHNA-CoA, it demonstrated no significant change.
However, with lauroyl-CoA, the YdiI V68M mutant demonstrated a decrease in
efficiency was ~ 102 M
-1s
-1, suggesting that the residue does play some role in substrate
screening.
The fact that YdiI can distinguish between CoA substrates and protein partners
(Chapter 2), led the investigation to look at CoA interactions with the protein. Inhibition
experiments demonstrate the YdiI is affect much more by free CoA as compared to
YbdB, by a factor of 15. This, with the protein discrimination, suggested that CoA must
interact differently with YdiI and YbdB. The nucleotide of CoA does in fact interact with
the surface of YdiI more favorably than with YdbB solidifying YdiI's substrate
preference for acyl-CoA's.
Although very similiar, YdiI and YbdB have served as an excellent model to
examine their evolutionary divergence that has led to their distinct physiological
functions. Through site directed mutagensis, 18
O incorporation, and pre-steady state
kinetic experiments, YdiI's kinetic model was elucidated. Mutagenesis of the binding
pocket residues demonstrated substrate specificity with one amino acid. Lastly, YdiI
discrimination against protein partners for acyl-CoA's could be explained by surface
interactions.

86
References
1. Roberts, R. J. (2004) Identifying protein function--a call for community action.,
PLoS Biology 2, E42.
2. Pegg, S. C.-H., Brown, S. D., Ojha, S., Seffernick, J., Meng, E. C., Morris, J. H.,
Chang, P. J., Huang, C. C., Ferrin, T. E., and Babbitt, P. C. (2006) Leveraging
enzyme structure-function relationships for functional inference and experimental
design: the structure-function linkage database., Biochemistry 45, 2545-55.
3. Guo, Z.-F., Sun, Y., Zheng, S., and Guo, Z. (2009) Preferential hydrolysis of
aberrant intermediates by the type II thioesterase in Escherichia coli nonribosomal
enterobactin synthesis: substrate specificities and mutagenic studies on the active-
site residues., Biochemistry 48, 1712-22.
4. Leduc, D., Battesti, A., and Bouveret, E. (2007) The hotdog thioesterase EntH
(YbdB) plays a role in vivo in optimal enterobactin biosynthesis by interacting
with the ArCP domain of EntB., Journal of Bacteriology 189, 7112-26.
5. Chen, D., Wu, R., Bryan, T. L., and Dunaway-Mariano, D. (2009) In vitro kinetic
analysis of substrate specificity in enterobactin biosynthetic lower pathway
enzymes provides insight into the biochemical function of the hot dog-fold
thioesterase EntH., Biochemistry 48, 511-3.
6. Chen, D. (2010) Divergence of Thioesterase Function: Human BFIT2, Escherichia
Coli EntH and ydiI. The University of New Mexico.

87
7. Merkel, S. M., Eberhard, a E., Gibson, J., and Harwood, C. S. (1989) Involvement
of coenzyme A thioesters in anaerobic metabolism of 4-hydroxybenzoate by
Rhodopseudomonas palustris., Journal of Bacteriology 171, 1-7.
8. Wu, R., and of New Mexico, T. U. (2007) Domain Movement and Substrate
Recognition in 4-chlorobenzoate: Coenzyme A Ligase from Alcaligenes Sp. Strain
AL3007. The University of New Mexico.
9. Song, F., Thoden, J. B., Zhuang, Z., Trujillo, M., Holden, H. M., and Dunaway-
Mariano, Debra. The Catalytic Mechanism of the Hotdog-fold Enzyme
Superfamily 4-Hydroxybenzoyl-CoA Thioesterase from Arthrobacter sp. Strain
SU DB, Unpublished.
10. Song, F., Zhuang, Z., Finci, L., Dunaway-Mariano, D., Kniewel, R., Buglino, J. a,
Solorzano, V., Wu, J., and Lima, C. D. (2006) Structure, function, and mechanism
of the phenylacetate pathway hot dog-fold thioesterase PaaI., The Journal of
Biological Chemistry 281, 11028-38.

88
CHAPTER FOUR
BIOLOGICAL RANGE AND DIVERGENCE OF FUNCTION IN THE
HOTDOG-FOLD THIOESTERASE YDII
4.1 Introduction
In the previous chapters the structure and function of the E. coli hotdog-fold
paralogs YbdB and YdiI were described. YbdB functions in the biosynthesis of the
siderophore enterobactin (1–3). This biosynthetic pathway is specialized and thus found
in a narrow range of bacterial species. YdiI on the other hand, functions in the
menaquinone pathway, which is present in a wider range of bacteria. In this chapter I
employ sequence identity and the structure determinants of YbdB and ydiI function to
track orthologs.
Enzyme homologs present in different organisms and that share greater than 40%
sequence identity are assumed to perform the same function. Function can be defined at
the level of catalysis, i.e. substrate activities as assayed in vitro, as well as at the
biological level, which entails the identification of the in-vivo substrate. The presence of
two hotdog-fold thioesterases in E. coli, namely YbdB and YdiI, with 59% sequence
identity in the is curious, especially when viewed in the context of the low pairwise
sequence identities between other hotdog-fold thioesterases in this same organism.
Nevertheless, YbdB and YdiI are the products of gene duplication. The linage of bacteria
in which this event occurred can, in principle, be defined by the point of departure of the
respective in biological ranges of ybdB and ydiI. By tracking the YbdB and YdiI
orthologs I intended to define this point of departure.

89
Based on my analysis I show that ydiI has a wide biological range whereas ybdB
is restricted to species of Enterobacteriales wherein enterobactin is synthesized. YdiI is
present in organisms which synthesize menaquione, but remarkably, I found examples of
putative YdiI orthologs in bacteria that do not synthesize menaquione. I experimentally
characterized one such putative YdiI ortholog to show that it has diverged in substrate
specificity to support a possible role in lipid metabolism. As with the shift in specificity
documented in Chapter 2 with YbdB and ydiI, the shift in specificity between YdiI and
the Pseudomonas homolog will be analyzed.
4.2 Methods and Materials
4.2.1 Materials
All restriction enzymes and T4 DNA ligase were purchased from Invitrogen. Pfu
Turbo and Deep Vent DNA polymerases were purchased from Strategene.
Oligonucleotide primers were custom-synthesized by Invitrogen. DNA sequencing was
performed by the DNA Sequencing Facility of the University of New Mexico. Acetyl-
CoA, benzoyl-CoA, propanoyl-CoA, hexanoyl-CoA, lauroyl-CoA, myristoyl-CoA,
palmitoyl-CoA, oleoyl-CoA were purchased from Sigma. The thioester substrates 4-
hydroxybenzyol-CoA, DHNA-CoA and coumaroyl-CoA were synthesized as previously
reported (1, 3).
4.2.2 Preparation of wild-type PA1618
The PA1618 gene was amplified by PCR using genomic DNA prepared from P.
aeruginosa (ATCC) as template, commercial oligonucleotides as primers, and Deep Vent

90
as the polymerase. The PCR-products were digested by the restriction enzymes NdeI and
XhoI and then purified by polyacrylamide gel electrophoresis. The genes were ligated to a
NdeI and XhoI- digested pET-23a vector (Novagen) using T4 DNA ligase. The cloned
genes were verified by DNA sequencing. The cloned plasmids were used to transform
competent E. coli BL21(DE3) cells (Invitrogen) for gene expression. The PA1618/pET-
23a or transformed E. coli BL21(DE3) cells were grown aerobically at 37 oC in LB media
containing 50 µg/ml ampicillin. Production of C-terminal His6-tagged PA1618 was
induced with 0.4 mM isopropyl-β-D-galactopyranoside (IPTG) once the cell density had
reached A600 ~ 0.6. Following a 12 h induction period at 19 oC, the cells were harvested
by centrifugation at 6,500 rpm for 10 min and then resuspended in 100 mL of 50 mM
Tris buffer (pH 8.4), 50 mM imidazole, and 500 mM NaCl (Lysis Buffer). The cells
were lysed using a French press at 1,200 psi and the lysate was centrifuged at 20,000 rpm
for 15 min. The supernatant was loaded onto a 5 mL HisTrap FF column (GE Life
Sciences) and the column was eluted at 4 oC with Lysis Buffer to remove non-tagged
protein and then with 50 mM Tris (pH 8.4), 500 mM imidazole, and 500 mM NaCl
(Elution Buffer) to elute the tagged protein. Column fractions were monitored by
measuring solution absorbance at 280 nm and by carrying out SDS-PAGE analysis. The
PA1618-containing fractions were combined and dialyzed at 4 oC against three changes
of 1 L of 50 mM Tris (pH 8.4)/50 mM NaCl. Yield: 25 mg protein/g of wet cells.
4.2.3 Preparation of PA1617
The PA1617 gene was amplified by PCR using genomic DNA from P.
aeruginosa PAO1 (ATCC), custom oligonucleotides (Invitrogen) as primers, and Pfu

91
Turbo (Stratagene) as polymerase. The PCR product was digested with NdeI and BamHI
(New England Biolabs), and purified by polyacrylamide gel electrophoresis. The product
was ligated into NdeI and BamHI digested pET28a vector (Novagen) using T4 ligase
(New England Biolabs). The ligated product was transformed into chemically competent
E. coli BL21 (DE3) RIPL cells (Stratagene) for gene expression. Production of the N-
terminal His6-tagged PA1617 followed the procedures described above. Yield: ~8 mg/g
of wet cells.
4.2.4 PA1618 activity assays
Thioesterase activity was measured using the 5,5’-dithio-bis-(2-nitrobenzoic acid)
(DTNB) coupled assay. Reactions were monitored at 412 nm (Δε = 13.6 m -1•cm
-1)
using a Beckman 640U Spectrometer. Reactions were carried out at 25 oC with 0.5 mL
solutions containing 50 mM K+HEPES (pH 7.5), 1 mM DNTB thioesterase and varying
concentrations of thioester (0.5 – 5 x Km). The catalyzed hydrolysis of 4-
hydroxybenzoyl-CoA (4-HB-CoA) in 50 mM K+ HEPES (pH 7.5) was directly
monitored at 300 nm (Δε = 11.8 m -1
cm-1
).
The initial velocity data, measured as a function of substrate concentration, were
analyzed using Enzyme Kinetics v 1.4 and equation 1
V = V max [S]/([S]+Km) (1)
where V is initial velocity, V max is maximum velocity, [S] is substrate concentration, and
Km is the Michaelis constant. The kcat was calculated from Vmax/[E] where [E] is the total
enzyme concentration as determined by the Bradford method.
4.2.5 PA1617 activity assays

92
Ligase activity was monitored by using a coupled assay. The 500 µL reactions
contained varying concentrations of the carboxylic acid substrate (0.5 - 5 x Km), 1 mM
CoA, 3.5 mM ATP, 15 mM MgCl2, 200 µM NADH, 2 mM PEP, 4 mM KCl, 11 U of
adenylate kinase (EC 2.7.4.3), 9 U of pyruvate kinase (EC 2.7.1.40) and 9 U of lactate
dehydrogenase (EC 1.1.1.27) in 50 mM K+HEPES (25
oC, pH 7.5). The decrease in
absorbance resulting from the oxidation of NADH was monitored at 340 nm (Δε = 6.2
mM-1
cm-1
).
The initial velocity data, measured as a function of substrate concentration, were
analyzed using Enzyme Kinetics v 1.4 and equation 1
V = V max [S]/([S]+Km) (1)
where V is initial velocity, V max is maximum velocity, [S] is substrate concentration, and
Km is the Michaelis constant. The kcat was calculated from Vmax/[E] where [E] is the total
enzyme concentration as determined by the Bradford method.
4.2.6 Bioinformatic analysis of YdiI and orthologues
Putative orthologs of E. coli K-12 YdiI were identified by a protein BLAST
search utilizing the NCBI BLAST tool (http://blast.ncbi.nlm.nih.gov) with default
parameters and the allowance of 5000 hits. Sequences were selected based on the
requirement of a minimum of six of the YdiI ten specificity markers Met40, Val42,
Gln48, Pro49, Phe/Tyr50, His54, Glu63, Ser/Thr64, Ser/Thr67 and His89 identified by
analysis of the crystal structure (PDB ID: 1VH5) (Chapter 3). The sequences were
aligned using the NCBI COBALT tool (http://www.ncbi.nlm.nih.gov/tools/cobalt) and
displayed in ESPript (http://espript.ibcp.fr/ESPript/ESPript/). A phylogenetic tree was
constructed using iTOL(interactive tree of life (http://itol.embl.de/)).

93
To determine the biological range of the menaquinone biosynthetic pathway in
relationship to the biological range of YdiI, a protein BLAST search was carried out
using the sequences of the E. coli menquinone pathway enzymes MenB and MenE as
query. Species containing homologs of MenB and MenE that have sequence identities of
>60% were judged to contain the menaquinone pathway. Genomes of the species with
putative MenB and MenE orthologues that share 45-59% identity were further examined
to determine if they possess homologs to the other E. coli menaquinone pathway
enzymes.
4.3 Results and Discussion
4.3.1 Bioinformatic analysis of YdiI
Homologs to the E. coli YbdB (EntH) and YdiI were identified by BLAST
searches using the respective amino acid sequences as query. Bacterial species that were
found to possess two homologs where restricted to the order Enterobacteriales. The high
pairwise sequence identities (>50%) indicated that these homologs are orthologs to the E.
coli YbdB (EntH) and YdiI. The sequence makers for YbdB are: T64, M68, T15, F50 and
F71. The Ybdb orthologs were found in the species of Escherichia, Shigella, Citrobacter,
Dickeya, Klebsiella, Cronobacter, Enterobacter and Salmonella The enterobactin
pathway genes were also found in these bacteria. Thus, the biological range of YbdB is
restricted to those bacteria that produce the siderophore enterobactin, and is thus very
small.
By comparison, the biological range of YdiI orthologs is quite large. The
sequence identity among the YdiI orthologs in proteobacteria is reasonably high (>45%)
and only in outside of proteobacteria where it localizes in the phylum Bacteroidetes and

94
more specifically in species of Bacteroides does it drop to 35-40%. The YdiI markers
listed in the previous chapter were selected from structural analysis and sequence
alignments with other known and characterized PaaI clade-like hotdog fold members.
The potential catalytic residues Q48, H54, E63, and S/T64 were selected by previously
reported data (1) and the remaining residues M40, V41, P49, F/Y50, S/T67 and H89 were
selected by conservation amongst known homologues as shown in the crystal structure
heat map (Figure 4.1) based on the multi-sequence alignment (Figure 4.2).
The range within proteobacteria is concentrated in the gama-subdivision with some
respensentation in beta-subdivision (Acidovorax species, Verminephrobacter eiseniae,
Alicycliphilus denitrificans, Nitrosomonas eutropha, Variovoraz paradoxus,
Polaromonas sp, Rhodoferax ferrireducens, Dechloromonas aromatic, and Comamonas
testosterone), delta-subdivision (Pelobacter propionicus, Erythrobacter litoralis and
Novosphingobium aromaticivorans), and one case in Clamydiae (Waddlia chondrophila).
Within the gama-division of proteobacteria the representation of ydiI in the order
of Enterobacteriales is pervasive. The YdiI orthologs accompany the YbdB orthologs in
the species of Escherichia, Shigella, Citrobacter, Dickeya, Klebsiella, Cronobacter,
Enterobacter and Salmonella and are represented in the order Enterobacteriales in species
of Yershina, Pantoea, Erwinia, Proteus, Pectobacterium, Edwardsiella, Serratia,
Xenorahdbdus and Providencia. Closely related hosts include species of Shenwalla,
Aeromonas, Psychromonas, Legionella, Marionobacter, Reinekea and Vibronales.
YdiI occurrence can be tracked further within the gamma-subdivision of
proteobacteria to the family Pasteurellaceae, where it is represented in species of
Pasteurella, Haemophilus, Mannheimia and Acintobacillus and to the family

95
Pseudomonadaceae where it is represented in the genomes of the deposited species of
Pseudomonas (stutzeria, fluorescens, syringae, savastanol and aeruginosa). Within the
order of Vibrionaceae, only a small fraction of the deposited genomes contain the ydiI
gene: Vibrio vulnificus and Allivibrio salmonicida. Within the order Xanthomonadaceae,
ydiI appears to be pervasive. One notable species is Xanthomonas albilineans, which has
two copies, one of which has Ala64 in place of the conserved Thr64.
Based on the comparison of the biological ranges of ybdB and ydiI it is evident that
ybdB evolved via an ancestral ydiI gene duplicate within Enterobacteriales to function in
the production of the siderophore enterobactin that is specific to certain species of
Enterobacteriales proteobacteria. The larger biological range of ydiI suggests that it
functions in a biochemical process that has is required by a larger range bacteria and/or
that it might assume more than one type biochemical function.
Inspection of the genes that are neighbors to the ydiI gene in the various genomes
provides clues as to its function (Figure 4.3). In Bacteroides genus, YdiI exists as a fusion
protein or as a standalone protein encoded by a gene located with the menaquinone
pathway gene cluster. The high catalytic efficiency towards thioester hydrolysis in the
menaquinone pathway intermediate 1,4-dihydroxynapthoyl-CoA demonstrated for the E.
coli ydiI (Chapter 2) indicates that it too functions in this role. Indeed, many but not all of
the bacteria that possess ydiI contain genes that encode menaquinone pathway homologs
indicating that YdiI is present to serve in the menaquinone pathway. The bacteria which
do not produce menaquinone and hence do not contain menaquinone pathway genes, yet
possess ydiI are of particular interest. This is the case with species of Pseudomonas and

96
as detailed in the following section, the function the YdiI from one such species was
examined.
Figure 4.1: Conservation heat map of known YdiI homologues generated by Chimera.
Red represents > 90% conservation.

97
Figure 4.2: Cropped sequence (residues 1-120 of E. coli ydiI) alignment of 26 putative
YdiI orthologues. Red background with white letters indicates complete conservation
and white background red letters indicates mostly conserved residues.

98
Figure 4.3: Gene map of YdiI homologues in species that contain the gene product co-
localized with menaquinone pathway genes.
4.3.2 Substrate specificity profiles of the thioesterase PA1618 and ligase PA1617
This notion that YdiI could discriminate between ACP and CoA substrates was
tested with an ortholog from Pseudomonas aeruginosa, PA1618. The ortholog PA1618
was selected because it demonstrated moderate sequence identity (52%), maintained all
ten amino acid markers, and is located adjacent to a putative ligase, suggesting its partner
is an acyl-/aroyl-CoA. PA1618 was subjected to the same substrate screen as EntH and
YdiI, less the EntB substrate, and was in good agreement with the YdiI substrate
preferences (See Table 4.1). From the screening, it appears that PA1618 prefers aroyl-
CoA's with kcat/KM ranging from 106-10
5 M
-1s
-1. Additionally, like YdiI, PA1618
discriminates against the benzoyl-holo-ACP versus benzoyl-CoA by a factor of three
when comparing the catalytic efficiencies. The ability of PA1618 to discriminate ACP or

99
CoA substrates reinforces the conclusion that the physiological substrate of YdiI is a CoA
thioester.
PA1618 Thioesterase
Substrate kcat (s-1
) KM (µM) kcat/KM
(M-1
s-1
)
Acetyl-CoA (4.31 ± 0.1) x 10-1
116 ± 8 3.7 x 10³
Hexanoyl-CoA (1.04 ± 0.02) x 10-1
20 ± 2 5.2 x 10³
Lauroyl-CoA (2.8 ± 0.01) x 10-1
60 ± 2 4.7 x 10³
Myristoyl-CoA (9.1 ± 0.2) x 10-1
156 ± 34* 5.8 x 10
3
Oleoyl-CoA (3.9 ± 0.2) x 10-1
7 ± 6 1.1 x 10⁴
Benzoyl-CoA 56 ± 1 12 ± 1 4.6 x 10⁶
4-HB-CoA 9.3 ± 0.2 3.6 ± 0.3 3.1 x 10⁶
1,4-DHN-CoA (5.5 ± 0.5) x 10-1
2.1 ± 0.1 2.8 x 10⁵
Coumaroyl-
CoA 2.5 ± 0.1 2.7 ± 0.2 9.3 x 10
5
2,4-DHB-EntB ND
Benzoyl-ACP (2.7 ± 0.1) x 10-1
174 ± 12 1.5 x 10³
Table 4.1: Steady state kinetic parameters of PA1618 catalyzed hydrolysis of various
acyl-CoA or acyl-ACP substrates monitored by direct absorbance changes or DTNB
coupled reactions in 50 mM K+HEPES at pH 7.5.
The promiscuity of PA1618 with acyl-CoA substrates provided ambiguity in
proposing a physiological role. It was first hypothesized that the neighboring PA1617
ligase might synthesize a substrate for PA1618 in an analogous way that MenE
synthesizes a precursor for E. coli YdiI. Therefore PA1617 was cloned, purified and
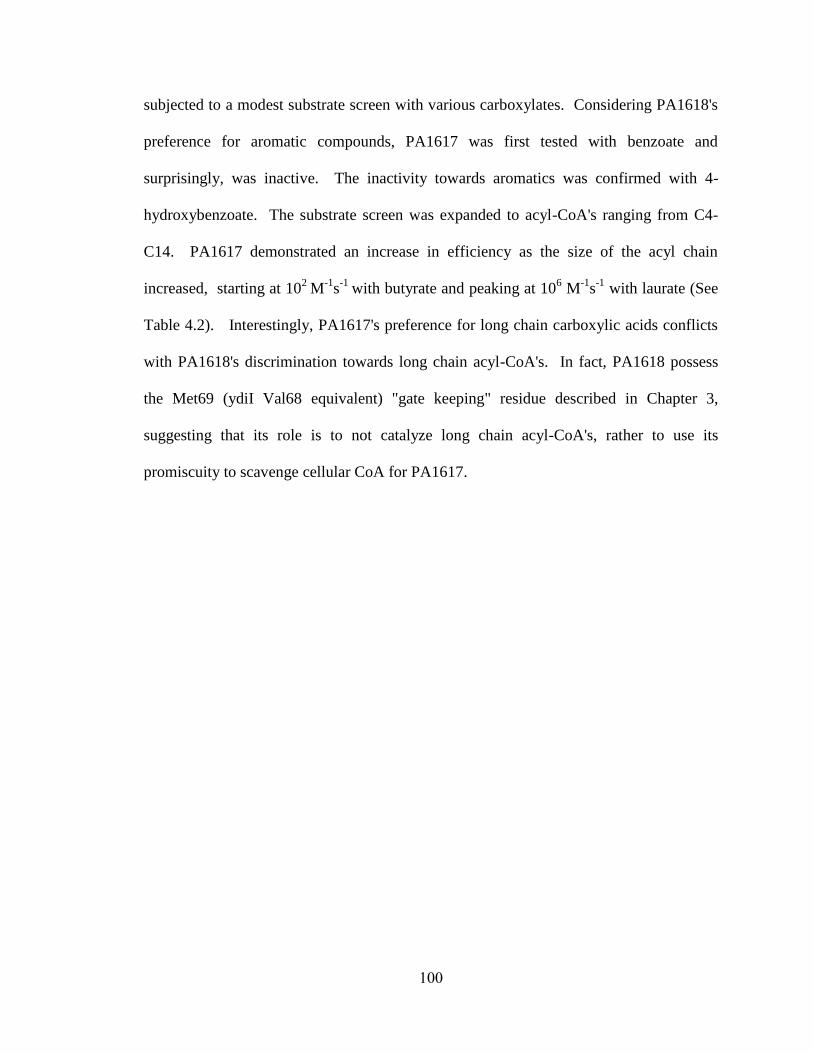
100
subjected to a modest substrate screen with various carboxylates. Considering PA1618's
preference for aromatic compounds, PA1617 was first tested with benzoate and
surprisingly, was inactive. The inactivity towards aromatics was confirmed with 4-
hydroxybenzoate. The substrate screen was expanded to acyl-CoA's ranging from C4-
C14. PA1617 demonstrated an increase in efficiency as the size of the acyl chain
increased, starting at 102
M-1
s-1
with butyrate and peaking at 106 M
-1s
-1 with laurate (See
Table 4.2). Interestingly, PA1617's preference for long chain carboxylic acids conflicts
with PA1618's discrimination towards long chain acyl-CoA's. In fact, PA1618 possess
the Met69 (ydiI Val68 equivalent) "gate keeping" residue described in Chapter 3,
suggesting that its role is to not catalyze long chain acyl-CoA's, rather to use its
promiscuity to scavenge cellular CoA for PA1617.

101
PA1617 Ligase
Substrate kcat (s-1
) KM (µM) kcat/KM
(M-1
s-1
)
Butyrate 1.0 ± 0.1 5800 ± 800 1.7 x 10²
Hexanoate 2.3 ± 0.1
1300 ± 100 1.8 x 10³
Octanoate 2.6 ± 0.1 50 ± 5 5.2 x 10⁴
Decanoate 5.5 ± 0.15
7.2 ± 0.6 7.6 x 10⁵
Laurate 6.1 ± 0.2
2.5 ± 0.2 2.4 x 10⁶
Myristate 2.1 ± 0.1 2.5 ± 0.2 8.4 x 10⁵
Benzoate <0.0001
4-HBA <0.0001
Table 4.2: Steady state kinetic constants for PA1617 ligase catalyzed reaction of
carboxylate substrates with 1 mM CoA, 3.5 mM ATP, and 15 mM MgCl2 in 50 mM
K+Hepes (25
oC, pH 7.5) using the coupling reactions described in Methods and
Materials.
4.4 Conclusions
Through bioinformatic analysis, YdiI was tracked through Proteobacteria using
known amino acid markers (Met40, Val42, Gln48, Pro49, Phe/Tyr50, His54, Glu63,
Ser/Thr64, Ser/Thr67 and His89). YdiI was prevalent in the Proteobacteria phylum,
concentrated in the gamma subdivision and having representation within the beta
subdivision. When restricted to Enterobacteriales, bacterial species were found to
possess two homologues. One homologue, YbdB is restricted to the Enterobacteriales
family whereas the other homologue, YdiI, is pervasive in Proteobacteria and
Bacteriodies phyla.

102
Inspection of gene neighbors in Bacteriodies showed YdiI within the context of
the menaquinone gene cluster. The localization of ydiI in the menaquinone cluster in
speicies of Bacteriodies coincides with the E. coli YdiI's high catalytic efficiency with
DHNA-CoA as well as the gene knockout growth curves. Although YdiI was found as
the DHNA-CoA thioesterase in E. coli and with strong evidence as the DHNA-CoA
thioesterase in other bacterial species, it can also be found in bacterial species without a
menaquinone pathway. This is the case in the Pseudomonadaceae family containing the
species Pseudomonas aeruginosa where the YdiI homologue PA1618 is localized with a
ligase.
The YdiI homologue PA1618 was cloned and subjected to the same substrate
YdiI screening that was defined in Chapter 2. PA1618 maintained a high affinity towards
aryl-CoA's, yet discriminated against long chain acyl-CoA's. PA1618 contains the
gatekeeping residue Met69 described in Chapter 3, which could lead to PA1618's
substrate specificity. To help determine the physiological role of PA1618, the
neighboring ligase PA1617 was cloned and subjected to a modest substrate screen.
Interestingly, PA1617 was found to favor long chain acyl-CoA's, in direct conflict of
PA1618's discrimination towards the same substrates. Considering the evidence found
here, PA1618 serves as CoA scavenger for PA1617.
103
References
1. Guo, Z.-F., Sun, Y., Zheng, S., and Guo, Z. (2009) Preferential hydrolysis of
aberrant intermediates by the type II thioesterase in Escherichia coli nonribosomal
enterobactin synthesis: substrate specificities and mutagenic studies on the active-
site residues., Biochemistry 48, 1712-22.
2. Chen, D., Wu, R., Bryan, T. L., and Dunaway-Mariano, D. (2009) In vitro kinetic
analysis of substrate specificity in enterobactin biosynthetic lower pathway
enzymes provides insight into the biochemical function of the hot dog-fold
thioesterase EntH., Biochemistry 48, 511-3.
3. Leduc, D., Battesti, A., and Bouveret, E. (2007) The hotdog thioesterase EntH
(YbdB) plays a role in vivo in optimal enterobactin biosynthesis by interacting
with the ArCP domain of EntB., Journal of Bacteriology 189, 7112-26.

104
CHAPTER FIVE
ANALYSIS OF THE PROTEIN-PROTEIN INTERACTIONS
BETWEEN ESCHERICHIA COLI YBGC THIOESTERASE AND
ACYL CARRIER PROTEIN
5.1 Introduction
The Escherichia coli hotdog-fold thioesterase YbgC is a 15.6 kDa homolog (21%
sequence identity) of the 4-hydroxybenzoyl-CoA thioesterase from Pseudomonas sp
strain CBS3 (Ps. 4HBT). The YbgC thioesterase is encoded by the first ORF of the tol-
pal gene cluster found in most bacteria belonging to the α, β, and γ subdivision of
Proteobacteria. Although the proteins encoded by the tol-pal operon have been
extensively studied, how they function as a system remains unclear. Recently, it has been
suggested that these proteins form a subcomplex of the cell division apparatus. This
complex makes a transient trans-envelope connection at or near the septal ring and draws
the outer membrane onto the enclosing inner membrane and peptidoglycan layers during
constriction (1). YbgC is co-transcribed with the tol-pal genes however, whereas
knockouts of each of the tol-pal operon genes result in a distinct phenotype the E. coli
YbgC- does not (2). The role, if any that YbgC might play in relationship to the Tol-pal
protein complex is not known.
The E. coli YbgC has been shown through tandem affinity purification, to interact
with the E. coli acyl carrier protein (ACP) involved in fatty acid synthesis (2). Moreover,
the same study showed that YbgC also co-purifies with the phospholipid synthesis
proteins PlsB and PssA. Notably, PlsB is a sn-glycerol-3-phosphate acyltransferase that
utilizes acyl-ACP as a substrate. ACP, encoded by the E. coli gene acpP, is a small (8.5

105
kDa) acidic protein that that serves as a fatty acid carrier for fatty acid synthesis and
delivery (3). The residue Ser36 is modified post translationally to accommodate
phosphopantatheine which serves as the thiol in thioester linkages of acyl-thioesters. The
acyl-holoACP serves as the thioester substrate for the fatty acid synthase. If YbgC
functions in membrane synthesis/remodeling via a role that it might play in lipid
metabolism, a possible connection between it and the tol-pal proteins might exist.
Recombinant Haemophilus influenzae YbgC has been reported to have
thioesterase activity (4). However, although fatty acyl-CoA thioesters (C12 and C20)
were tested activity was observed only with the short chain acyl-CoA thioesters
propionyl-CoA and isobutyryl-CoA. In addition, the catalytic efficiency observed was
atypically low (kcat = 0.2-0.5 s-1
, Km = 10-20 mM, kcat/Km ~ 1 x 10³ M
-1 s
-1) suggesting
that the physiological substrate had not been found (4). More recently, the thioesterase
activity of recombinant Helicobacter pylori YbgC was reported (5). In this case, the short
chain acyl-CoA thioesters (C2-C4) were not substrate active and the long chain acyl-CoA
thioesters (C8-C18) were. However, once again the catalytic efficiency was too low to be
considered physiologically significant (kcat = 0.001-0.05 s-1
, Km = 40-600 µM, kcat/Km ~ 1
x 102 M
-1 s
-1).
The H. influenza, H. pylori and E. coli YbgC genes conserve the tol-pal gene
context and the protein products share significant sequence identity (53% and 37%
pairwise identity with the E. coli YbgC, respectively), which includes the DTD motif that
is found in the homolog 4-hydroxbenzoyl-CoA from Pseudomomas sp strain CBS3 (Ps
4HBT) (Figure 4.1). The Ps 4HBT catalytic Asp17 is contained in this motif.

106
Figure 5.1: The sequence alignment of YbgC from E. coli, H. influenzae, and
Helicobacter pylori and the Pseudomonas sp. strain CBS3 4-hydroxybenzoyl-CoA
thioesterase generated by Cobalt and displayed in ESPript 2.2
(www.http://espript.ibcp.fr/ESPript/ESPript/index.php). Conserved residues are shown
with white font against a red background and similar residues are shown in red font
against a white background.
The crystal structure of E. coli apo-YbgC has been solved (PDB ID: 1S5U). It
shows a conserved Ps 4HBT fold and conservation of the active site residue Asp17.
However, unlike the Ps 4HBT, the YbgC has a solvent exposed substrate binding pocket
(Figure 5.2 A). The active site should be able easily accommodate the long tails of fatty
acyl-CoA thioesters. The X-ray crystal structure of Helicobacter pylori apo-YbgC (37%

107
identity to E. coli YbgC) has also been reported (PDB ID: 1VH5) (5) and it too shows a
large solvent exposed active site. (Figure 5.2 B).
A
B
Figure 5.2: (A) - The E. coli YbgC binding pocket and (B) the H. pylori YbgC binding
pocket cutaways generated by Chimera with 4-hydroxyphenacyl-CoA modeled from the
superimposed structure of the Pseudomonas sp. strain CBS3(4-hydroxyphenacyl-CoA)
complex.

108
The TAP experiment showing YbgC-ACP interactions has served as a starting
point for my approach to a functional assignment to the E. coli YbgC. In this chapter I
report and interpret the results from kinetic and structure-based probes of YbgC-ACP
binding as well as from steady-state kinetic based substrate specificity analysis.
5.2 Materials and Method
5.2.1 Materials
All restriction enzymes and T4 DNA ligase were purchased from New England
Biolabs. Pfu Turbo DNA polymerase was purchased from Strategene. Oligonucleotide
primers were custom-synthesized by Invitrogen. DNA sequencing was performed by the
DNA Sequencing Facility of the University of New Mexico. All chemicals were
purchased from Sigma. The synthesis of β-ketopropanone-CoA from 1-chloro-2-
propanone and coenzyme A was carried out according to published procedures. (6) H.
influenzea YbgC was purified as previously described (4).
5.2.2 E. coli ybgC gene cloning and expression and protein purification
The wild-type ybgC gene was amplified via a PCR-based strategy using genomic
DNA prepared from E. coli strain K-12 (ATCC) as template, commercial
oligonucleotides as primers and Pfu Turbo as DNA polymerase. The PCR-products were
digested by the restriction enzymes NdeI and XhoI and then purified by gel
chromatography followed by T4 DNA ligase-catalyzed ligation to the pET-28a vector
(Novagen) digested with NdeI and XhoI. The sequence of the cloned gene was verified
by DNA sequencing. The clone was transformed into competent E. coli BL21(DE3) cells

109
(Invitrogen) for protein expression. The ybgC/pET-28a transformed E. coli BL21(DE3)
cells were grown aerobically at 37 oC in LB media containing 100 µg/mL kanamycin.
Production of the YbgC protein was induced at 19 oC with 0.4 mM isopropyl-β-D-
galactopyranoside (IPTG) once the cell density reached A600 ~0.6. Following a 12 h
induction period, the cells were harvested by centrifugation at 6,500 rpm for 10 min and
then resuspended in 100 mL of 50 mM K+HEPES buffer (pH 7.5), 50 mM imidazole, and
500 mM NaCl (Lysis Buffer). The cells were lysed using a French press at 1,200 psi and
the lysate was centrifuged at 20,000 rpm for 15 min. The supernatant was purified by
FPLC (AKTA) using a 5 mL HisTrap FF column (GE Life Sciences). The column was
loaded with the clarified supernatant and was washed with Lysis Buffer at 4 oC to remove
unbound protein and then with 50 mM K+HEPES (pH 7.5), 500 mM imidazole, and 500
mM NaCl (Elution Buffer) to elute the tagged protein. Column fractions were monitored
by their measuring absorbance at 280 nm and by carrying out SDS-PAGE analysis. The
YbgC-containing fractions were combined and dialyzed three times against 1 L 50 mM
K+HEPES (pH 7.5) and 50 mM NaCl. Yield: ~ 15 mg/g of wet cells.
5.2.3 Steady-state kinetic constant determination
Thioesterase activity was measured using the 5,5’-dithio-bis-(2-nitrobenzoic acid)
(DTNB) coupled assay. Reactions were monitored at 412 nm (Δε = 13.6 m -1•cm
-1)
using a Beckman 640U Spectrometer. Reactions were carried out in 50 mM K+HEPES
and 1 mM DTNB (pH 7.5, 25 oC) containing YbgC and varying concentrations of
thioester (0.5 – 3 x Km) in a total volume of 500 µL. For all measurements, the initial
110
velocity data, measured as a function of substrate concentration, were analyzed using
Enzyme Kinetics v 1.4 and equation (1):
V = V max [S]/([S]+Km) (1)
where V is initial velocity, V max is maximum velocity, [S] is substrate concentration, and
Km is the Michaelis constant. The kcat was calculated from Vmax/[E] where [E] is the total
enzyme concentration as determined by the Bradford method.
5.2.4 Synthesis of acyl-holoACP
Acetyl-, isobutyryl-, hexanoyl-, octanoyl-, myristoyl-, and β-ketopropanone-holo-
ACP were synthesized using the E. coli strain DK574 apoACP as the ACP unit. The E.
coli strain DK574, genetically engineered to produce apoACP (UniProt accession
P0A6A8) (7) was a kind gift from Dr. John Cronan. ApoACP was purified according to
the published procedure (7) with slight modification. In brief, a 2 L mixture of LB broth
containing 10 mL of starter culture, 15 µg/mL kanamycin, 50 µg/mL streptomycin and
10 µg/mL chloramphenicol was incubated with shaking at 23 oC to a cell density of A600
~ 0.6, and then induced with 0.4 mM IPTG for ~15 h. The cells were harvested by
centrifugation at 6500 rpm for 10 min. The cell pellet was suspended in 50 mM Tris-HCl
pH 8.8, 25 mM MgCl2, 1 mM DTT, 0.2 mM MnCl2 and passed through a French press at
1200 PSIG. The lysate was centrifuged at 20,000 rpm for 20 min and the supernatant
was decanted and then incubated at 37 oC for 2 h. The solution was dialyzed 3 times at 4
oC, for 1 h each in 1 L of K
+MES (pH 6.1). An equal volume of ice-cold isopropanol was
added to the dialyzed solution with stirring for 1 h at 4 oC. The mixture was centrifuged
at 20,000 rpm for 20 min. The apoACP was purified from the supernatant by FPLC
(AKTA) using a DEAE column (10 mL) equilibrated with 50 mM K+MES (pH 6.1). The

111
column was washed with 5 void volumes of the equilibration buffer, followed by elution
with a linear gradient of 0-0.5 M NaCl in the same buffer. The apoACP eluted at ~ 0.4
M NaCl. The protein was dialyzed as previously described and then concentrated to ~10
mg/mL using 3500 MWCO centrifuge columns (Millipore). The concentration of the
apoACP was determined using the bicinchoninic acid (BCA) protein assay kit method
(Sigma).
The acyl-holoACP was prepared by incubating a reaction mixture (3-5 mL)
initially containing 350 M apoACP, 400 M acyl-CoA and 30 µL (18 mg/mL) BF1558
(8), 50 mM K+HEPES (pH 7.5) and 5 mM MgCl2 at 23
oC for 30 min. The resulting
solution containing the acylated ACP was subjected to buffer exchange by FPLC
(AKTA) using a HiPrep 16/60 Sephacryl S-200 HR (GE Life Sciences) size exclusion
column and the previously described dialysis buffer. The acyl-holoACP eluted at 75 mL
and was concentrated to 1 mM using a 3,500 MWCO spin column (Millipore). The
complete conversion of apo-ACP to acyl-holoACP was confirmed by electrospray mass
spectrometry (UNM Mass Spectrometry Facility). The molecular mass determinations by
TOF-ESI-MS are as follows (calculated; observed): apoACP (8507 Da; 8507.9 Da);
acetyl-holoACP (8890 Da, 8890 Da); β-ketopropanone-holoACP (8904 Da, 8903.6 Da);
isobutyryl-holoACP (8918 Da, 8918.1 Da); hexanoyl-holoACP (8946 Da, 9846.1 Da);
octanoyl-holoACP (8974 Da, 8974.1 Da); lauroyl-holoACP (9030 Da, 9030.4 Da);
myristoyl-holoACP (9058 Da, 9058.1 Da) and palmitoyl-holoACP: (9086 Da, 9086.6Da).
The product of thioester hydrolysis is holoACP (8847 Da).
5.2.5 Inhibition of YbgC-catalyzed hydrolysis of isobutyryl-CoA

112
Reactions were monitored using a continuous spectrophotometric assay. For β-
ketopropanone-holoACP, β-ketopropanoyl-CoA, and apo-ACP inhibition, YbgC
catalyzed hydrolysis of isobutyryl-CoA was monitored using the DTNB assay as
described above. The assay solution contained enzyme, varying concentrations of the
substrate isobutyryl-CoA, and varying concentrations of inhibitor (0, 10, and 20 µM for
β-ketopropanone-holoACP; 0, 250 and 500 µM for apo-ACP; 0, 100, and 200 µ for β-
ketopropanoyl-CoA). The inhibition constant Ki was obtained by fitting the initial rates
to equation (2):
V = Vmax[S]/[Km (1+[I]/Ki) + [S]] (2)
Where [I] = concentration of inhibitor and Ki = inhibition constant.
5.2.6 Small angle X-ray scattering analysis of the ybgC-β-ketopropanone-holoACP
complex
The YbgC and β-ketopropanone-holoACP samples used for all SAXS
experiments were frozen and shipped individually to the work site. The YbgC-β-
ketopropanone-holoACP complex was concentrated to 5 mg/mL at 4 oC. Synchrotron
radiation X-ray scattering data were collected using the standard procedures on the X9
beamline at Brookhaven National Labs National Synchrotron Light Source. SAXS data
were collected on a MarcCCD 165 located 3.4 m distance from the sample while
simultaneously WAXS data were collected using a Photonic Science CCD located at 0.47
m from the sample. A 20 µL volume of sample was continuously pushed through a 1 mm
diameter capillary for 30 s of measurement time and exposed to a 400 x 200 µm X-ray
beam. Data collections were performed in triplicate. Beam intensity normalization,
buffer subtraction and merging of data were carried out using PRIMUS (9). PRIMUS
was also used to calculate a Guinier approximation, were a plot of ln[I(q)] and q2 is

113
linear, as well as to calculate a radius of gyration (Rg) and distribution of distances.
GN was used to generate a pair distribution function │P(r)│, maximum particle
distribution (Dmax), and an OUT file (9). DAMMIN and PDB2VOL were used to
generate the low resolution solution structure employing the parameters defined in the
OUT file (10, 11). FOXS was used to generate the theoretical SAXS data of the YbgC- β-
ketopropanone-holoACP complex (12).
5.3 Results and Discussion
5.3.1 Preparation of acyl-holoACP
In order to determine the specificity of YbgC towards acyl-holoACP substrates, a
robust method for synthesis was needed. The method previously used for the preparation
of benzoyl-holoACP (reported in Chapter 2) involved chemical reaction of holoACP with
an N-acyl-imidazole precursor. Because of the trichloroacetic acid induced ACP
precipitation steps required and the limited solubility of the long chain N-acyl-imidazole
precursors this method was deemed unsuitable. The synthetic method arrived at
employed apoACP in reaction with acyl-CoA catalyzed by the promiscuous pantetheinyl-
phosphate transferase BF1558 previously characterized in our laboratory (11). The
apoACP was prepared in concentrations of >10 mg/mL by modification of the original
procedure reported by Cronan et al. (7). The apoACP was characterized by SDS-PAGE
analysis (Figure 5.3) and by time of flight-electrospray ionization-mass spectrometry
(TOF-ESI-MS) (Figure 5.4 A). The odd chromatographic behavior apoACP on the SDS-
PAGE gel has been noted by others (3, 13).

114
Figure 5.3: SDS-PAGE gel analysis of the apoACP containing fractions pictured in the
gel stained with Coomassie blue dye. Lane 1 shows the Invitrogen Benchmark protein
ladder. Lanes 6-8 show DEAE fractions containing apoACP.
The BF1558-catalyzed reaction between the apoACP and the acyl-CoAs was
carried out at temperature. Within 1 h the reaction with the short-to-medium chain acyl-
CoAs reached completion as demonstrated by TOF-ESI-MS (Figures 5.4 B-F). The
myristoyl-holoACP and lauroyl-holoACP were also easily formed but in the case of
palmitoyl-holoACP limited solubility required greater dilution as precipitation occurred.
(Figures 5.4 G and I).
A

115
B
C
D

116
E
F
G

117
H
I
Figure 5.4: Exact molecular weight determination by TOF-ESI-MS of A- apoACP
(predicted MW = 8507 Da), B- acetyl-holoACP (predicted MW = 8890 Da), C- β-
ketopropanone-holoACP (predicted MW = 8902 Da), D - isobutyryl-holoACP (predicted
MW = 8917 Da), E - hexanoyl-holoACP (predicted MW = 8945 Da), F - octanoyl-
holoACP (predicted MW = 8974 Da), G - lauroyl-holoACP (predicted MW = 9031 Da)
H - myristoyl-holoACP (predicted MW = 9059 Da) and I - palmitoyl-holoACP
(predicted MW = 9085 Da). The product of thioester hydrolysis is holoACP (predicted
MW = 8847 Da).

118
5.3.2 Substrate specificity of E. coli YbgC
The steady-state kinetic constants kcat and Km for E. coli YbgC-catalyzed
hydrolysis of acyl-CoA and acyl-holoACP thioesters were measured as a function of the
length of the acyl group (C4-C14). The results are reported in (Table 5.1). The largest kcat
values (~1 s-1
) were observed for the short chain (C3-C4) acyl-CoA thioesters. In the case
of the acyl-holoACP thioesters, the largest kcat (0.4 s-1
) was observed for catalyzed
hydrolysis of the isobutyryl-holoACP. Overall, the range of the kcat values measured for
the panel of thioesters is only ~10-fold. In contrast, the Km value showed great variation.
In case of the acyl-CoA thioester series, the Km ranged from 10 mM (acetyl-CoA) to 5
M (myristoyl-CoA). The general trend observed is the longer the acyl chain the smaller
the Km. The kcat/Km values measured for lauroyl-CoA and myristoyl-CoA (~1 x10⁴ M
-1 s
-
1) are large enough to indicate that long chain fatty-acyl-CoA thioesters might be in vivo
substrates. The Km values for the short chain acyl-holoACP thioesters are significantly
smaller than those measured for the corresponding acyl-CoA thioesters. For example, the
Km value observed for acetyl-CoA is 10 mM and that for acetyl-holoACP is 33 M,
whereas the kcat values are essentially the same (0.14 s-1
vs 0.11 s-1
). On the other hand,
the Km values for the long chain acyl-CoA and long chain acyl-holoACP are both very
small. However, Km values less than 5 µM are not accurately determined by the steady-
state initial velocity method and thus Km value (3-5 M) for lauroyl-holoACP and
myristoyl-holoACP might be significantly larger than the actual value. Such a small Km
value is consistent with the in vivo YbgC targeting long chain fatty-acyl-holoACP
formed during the course of fatty acid synthesis.

119
The activity of the H. influenzea YbgC with isobutyryl-holoACP was measured and
shown to be much greater (kcat/Km ~1 x10⁴ M
-1s
-1) than the activity measured with the
isobutyryl-CoA. Presumably, the Km value (220 M) measured with the native long chain
fatty acyl-holoACP (rather than the E. coli counterpart used here) would be significantly
smaller.
E.coli YbgC H. influenzea YbgC
Substrate kcat (s1) KM (mM)
kcat/KM
(s-1
µM-1
)
kcat (s1) KM (mM)
kcat/KM
(s-1
µM-1
)
Acetyl-CoA 0.14 ± 0.01 10 ± 1 14 ND
Propanoyl-
CoA 1.38 ± 0.04 0.49 ± 0.04 2.8 x 10
3
0.44 ± 0.4* 11 ± 1* 40*
Butyryl-CoA 1.20 ± 0.02 0.70 ± 0.04 1.7 x 10³
0.17 ±
0.03* 24 ± 7* 7*
Isobutyryl-
CoA 1.3 ± 0.1 1.2 ± 0.1 1.1 x 10
3
0.54 ±
0.05* 16 ± 2* 34*
Hexanoyl-
CoA 0.13 ± 0.01 2.8 ± 0.3 46 ND
Octanoyl-
CoA 0.037 ± 0.001 0.46 ± 0.05 80 ND
Lauroyl-CoA 0.17 ± 0.01 0.014 ±
0.001 1.2 x 10
4 NA
Myristoyl-
CoA 0.24 ± 0.01
(5.3 ± 0.5) x
10-3
4.8 x 10
4 ND
Acetyl-
holoACP 0.11 ± 0.01
0.033 ±
0.002 3.3 x 10
3 ND
Isobutyryl-
holoACP 0.43 ± 0.02
0.045 ±
0.005 9.6 x 10³
2.1 ± 0.1 0.22 ±
0.02 9.5 x 10³
Hexanoyl-
holoACP
(6.6 ± 0.1) x
10-2
0.140 ± 10 4.7 x 10
2 ND
Octanoyl-
holoACP 0.28 ± 0.01
0.043 ±
0.005 6.5 x 10
3 ND
Lauroyl-
holoACP 0.18 ± 0.01
(3.5 ± 0.2) x
10-3 5.1 x 10
4 ND
Myristoyl-
holoACP 0.23 ± 0.01
(4.7 ± 5) x
10-3
4.6 x 10
4 ND

120
Table 5.1: Steady-state kinetic constants for E. coli or H. influenzea YbgC catalyzed
hydrolysis of acyl-CoA and acyl-holoACP thioesters
measured using DTNB
spectrophotometric assay at pH 7.5 and 25 oC. * Indicates as previously published. ND -
Not determined. NA –No activity.
5.3.3 Inhibition of E. coli YbgC-catalyzed hydrolysis of isobutyryl-CoA by β-
ketopropionyl-CoA, apoACP, and β-ketopropionyl-holoACP
The inert substrate analogs β-ketopropionyl-CoA and β-ketopropionyl-holoACP
were characterized as potential inhibitors and co-crystallization ligands. The presence of
the methylene (-CH2) in between the carbonyl and the S ether atom prevents YbgC-
catalyzed hydrolytic cleavage. The binding affinities of the substrate analogs were
determined by measuring their inhibition constants using the steady-state kinetics. As
shown in Figure 5.5 A and B, the substrate analogs displayed competitive inhibition.
Data fitting to equation 2 defines the β-ketopropionyl-CoA Ki = 85 ± 5 µM and the β-
ketopropionyl-holoACP Ki = 8 ± 0.4 µM (Table 5.2). The 10-fold tighter binding of the
ACP analog is evidence the holoACP unit of the acyl-holoACP binds to YbgC more
strongly than does the CoA unit of the acyl-CoA.
To access if apoACP binds to YbgC it was tested as an inhibitor vs isobutyryl-
CoA. Competitive inhibition was observed which is consistent with the ACP is binding
at the entrance to the active site thus blocking the substrate binding. The fitted inhibition
constant for apoACP was Ki = 190 ± 20 µM, approximately 25x less potent of an
inhibitor as compared to β-ketopropanone-holoACP. This result is in good agreement to
the TAP assay conducted with the ACP S36C and S36T mutants which showed that the

121
YbgC-ACP interaction is not solely electrostatic and that the phosphopantatheine unit on
ACP is necessary to interact with ybgC (2). The holoACP inhibition could not be tested
due to the nature of the DTNB assay and its interactions with the free thiol on the
holoACP.
A B
C
Figure 5.4: A - Competitive inhibition plots for β-ketopropanone-holoACP monitored by
DTNB assay using 0.16 µM E. coli YbgC, 0.5-6 mM isobutyryl-CoA, and 0 (●), 10 (o),
or 20 (▼) µ inhibitior. B - Competitive inhibition plots for β-ketopropanone-CoA
monitored by DTNB assay using 0.22 µM E. coli YbgC, 1-6 mM isobutyryl-CoA, and 0
(●), 250 (o), or 500 (▼) µ inhibitior. C - Competitive inhibition plots for apo-ACP
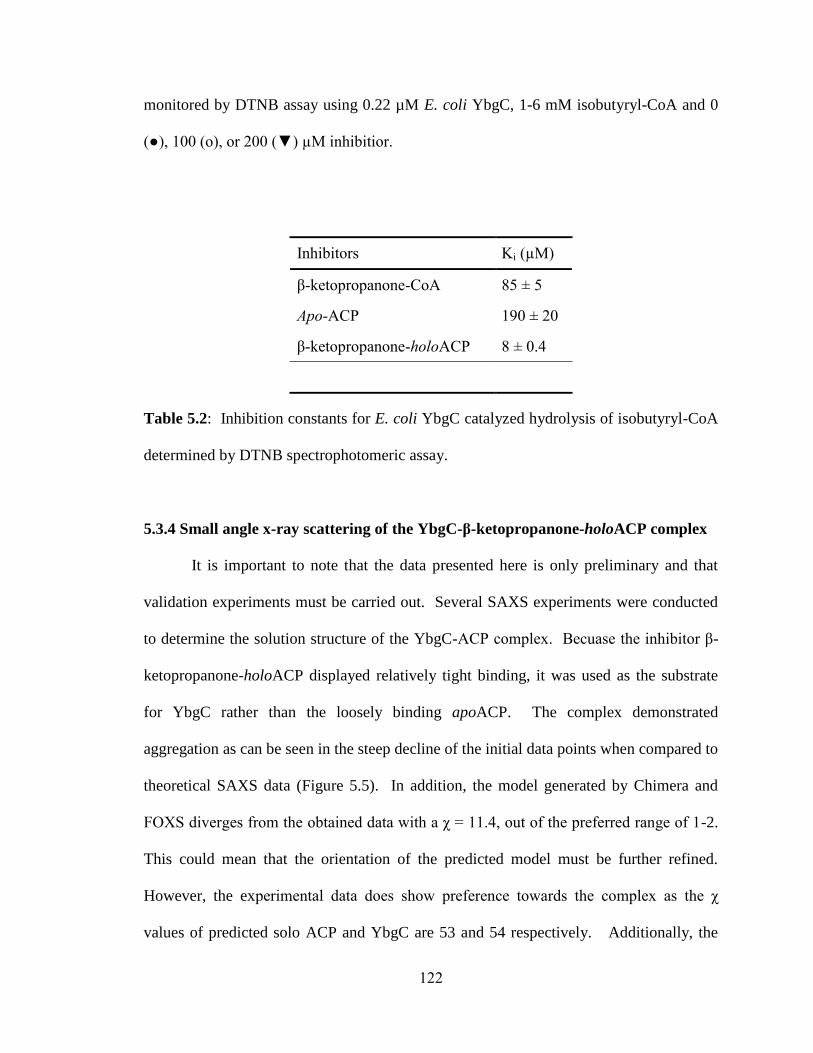
122
monitored by DTNB assay using 0.22 µM E. coli YbgC, 1-6 mM isobutyryl-CoA and 0
(●), 100 (o), or 200 (▼) µ inhibitior.
Inhibitors Ki (µM)
β-ketopropanone-CoA 85 ± 5
Apo-ACP 190 ± 20
β-ketopropanone-holoACP 8 ± 0.4
Table 5.2: Inhibition constants for E. coli YbgC catalyzed hydrolysis of isobutyryl-CoA
determined by DTNB spectrophotomeric assay.
5.3.4 Small angle x-ray scattering of the YbgC-β-ketopropanone-holoACP complex
It is important to note that the data presented here is only preliminary and that
validation experiments must be carried out. Several SAXS experiments were conducted
to determine the solution structure of the YbgC-ACP complex. Becuase the inhibitor β-
ketopropanone-holoACP displayed relatively tight binding, it was used as the substrate
for YbgC rather than the loosely binding apoACP. The complex demonstrated
aggregation as can be seen in the steep decline of the initial data points when compared to
theoretical SAXS data (Figure 5.5). In addition, the model generated by Chimera and
F XS diverges from the obtained data with a χ = 11.4, out of the preferred range of 1-2.
This could mean that the orientation of the predicted model must be further refined.
However, the experimental data does show preference towards the complex as the χ
values of predicted solo ACP and YbgC are 53 and 54 respectively. Additionally, the
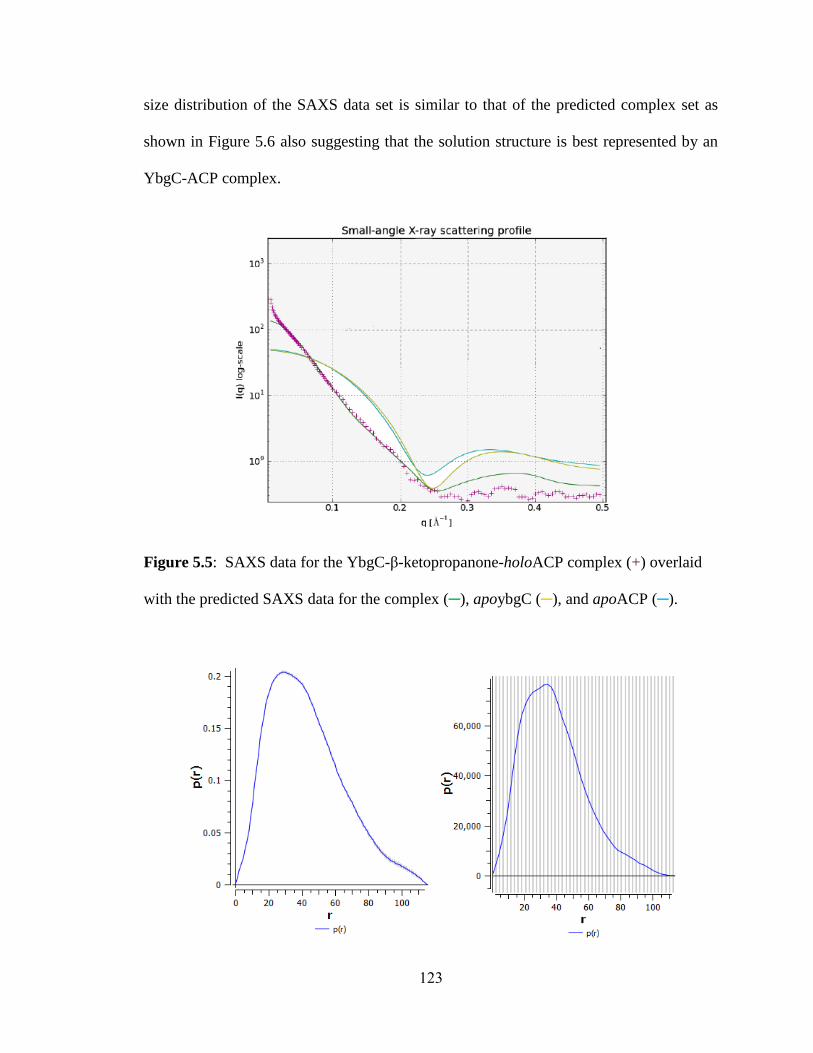
123
size distribution of the SAXS data set is similar to that of the predicted complex set as
shown in Figure 5.6 also suggesting that the solution structure is best represented by an
YbgC-ACP complex.
Figure 5.5: SAXS data for the YbgC-β-ketopropanone-holoACP complex (+) overlaid
with the predicted SAXS data for the complex (─), apoybgC (─), and apoACP (─).

124
Figure 5.6: GNOM calculated size distributions of the experimental YbgC-β-
ketopropanone-holoACP complex (A) and the predicted YbgC-β-ketopropanone-
holoACP complex (B), apoYbgC (C), and apoACP (D).
Even though the experimental data demonstrated signs of protein aggregation,
enough acceptable data points were collected to construct a molecular envelope of the
YbgC-β-ketopropanone-holoACP complex. A DAMMIN script was used to generate 20
possible envelopes with χ values below 1.5. The 20 envelopes were averaged to generate
a single molecular envelope with a χ value of 1.2. As shown in Figure 5.7, the
molecular envelope is consistent with two ACP's binding to the dimeric YbgC, similar to
other hotdog-fold proteins with acyl-CoA's in both active sites.

125
Figure 5.7: DAMMIN generated molecular envelope calculated from SAXS of the
YbgC-β-ketopropanone-holoACP complex (mesh) superimposed with the Chimera
generated model of the ybgC-ACP complex.
5.4 Summary
The Escherichia coli ybgC gene was cloned, expressed and purified to
homogeneity. Similar to the H. Hyplori YbgC, substrate activities of E. coli YbgC
demonstrate preferences to long chain acyl-CoA's such as lauroyl- and myristoyl-CoA.
Using the idea from previously reported TAP experiments showing that YbgC interacts
with ACP, I wanted to test E. coli YbgC for acyl-holoACP activity. To do this, a system
to synthesize large quantities of acyl-holoACP's was need. ApoACP was purified to
homogeneity at ~10 mg/mL and was verified by TOF-ESI-MS. The acyltransferase
BF1558 was used to load various acyl-phosphopantetheine onto apoACP to completion,
verified by TOF-MSI-MS, to yield final products of 8-10 mg/mL. YbgC greater activity
towards the acyl-holoACP thioesters, favoring >C10 acyl-holoACP, suggesting that its
physiological substrate is a long chain fatty acyl-holoACP. The inhibitor data both the

126
ACP and its pantetheine arm contribute to the substrate binding affinity. The correlation
between Km value and substrate acyl chain length (long chain having the smallest) of the
acyl-CoA and acyl-holoACP suggests that desolvation of the acyl chain contributes to the
binding affinity.
The idea to synthesize the inert substrate analog β-ketopropanone-holoACP was
part of a larger idea to generate a co-crystal of the YbgC-ACP complex (which is
underway in Professor Karen Allen’s laboratory at Boston University). The substrate
analog β-ketopropanone-holoACP was synthesized and showed modest inhibition with a
Ki ~ 8 µM, 25 times tighter than the apoACP, and 10 times tighter than β-ketopropanone-
CoA. Since currently only three different protein complex structure with ACP have been
reported, P450-ACP, FabI-ACP, and AcpS-ACP, small angle x-ray scattering seemed to
be a useful tool to quickly examine the mode of binding between ACP and YbgC (14–
16). Preliminary SAXS data of the YbgC-β-ketopropanone-holoACP complex provided a
first look at how ACP binds to the YbgC dimer, providing insight to how the two proteins
interact. Verification of the SAXS data along with a co-crystal of the YbgC-ACP
complex would further our understanding of how hotdog-fold thioesterases interact with
acyl-holoACP's. Although the exact biological function of YbgC was not determined,
this work provides supporting evidence that YbgC does play a role in the phospholipid
synthesis pathway as suggested by the TAP pull-down experiments. Specifically, YbgC
is posited to support the synthesis of fatty acids by releasing the fatty acid from the
holoACP once it has reached a length of 14 or more carbon atoms.

127
References
1. Gerding, M. a, Ogata, Y., Pecora, N. D., Niki, H., and de Boer, P. a J. (2007) The
trans-envelope Tol-Pal complex is part of the cell division machinery and required
for proper outer-membrane invagination during cell constriction in E. coli.,
Molecular Microbiology 63, 1008-25.
2. Gully, D., and Bouveret, E. (2006) A protein network for phospholipid synthesis
uncovered by a variant of the tandem affinity purification method in Escherichia
coli., Proteomics 6, 282-93.
3. Rawlings, M., and Cronan, J. E. (1992) The gene encoding Escherichia coli acyl
carrier protein lies within a cluster of fatty acid biosynthetic genes., The Journal of
Biological Chemistry 267, 5751-4.
4. Zhuang, Z., Song, F., Martin, B. M., and Dunaway-Mariano, D. (2002) The YbgC
protein encoded by the ybgC gene of the tol-pal gene cluster of Haemophilus
influenzae catalyzes acyl-coenzyme A thioester hydrolysis., FEBS Letters 516,
161-3.
5. Angelini, A., Cendron, L., Goncalves, S., Zanotti, G., and Terradot, L. (2008)
Structural and enzymatic characterization of HP0496, a YbgC thioesterase from
Helicobacter pylori., Proteins 72, 1212-1221.
6. Luo, L., Taylor, K. L., Xiang, H., Wei, Y., Zhang, W., and Dunaway-Mariano, D.
(2001) Role of active site binding interactions in 4-chlorobenzoyl-coenzyme A
dehalogenase catalysis., Biochemistry 40, 15684-92.

128
7. Cronan, J. E., and Thomas, J. (2009) Bacterial fatty acid synthesis and its
relationships with polyketide synthetic pathways., Methods in Enzymology 1st ed.,
pp 395-433. Elsevier Inc.
8. Huang, H. (2011) Functional assignment within the Haloacid Dehalogenase
Superfamily. The University of New Mexico.
9. Konarev, P. V., Volkov, V. V., Sokolova, A. V., Koch, H. J., and Svergun, D. I.
(2003) PRI US : a Windows PC-based system for small- angle scattering data
analysis, Journal of Applied Crystallography 36, 1277-1282.
10. Svergun, D. I. (1999) Restoring low resolution structure of biological
macromolecules from solution scattering using simulated annealing., Biophysical
Journal 76, 2879-86.
11. Wriggers, W. (2010) Using Situs for the integration of multi-resolution structures.,
Biophysical Reviews 2, 21-27.
12. Schneidman-Duhovny, D., Hammel, M., and Sali, A. (2010) FoXS: a web server
for rapid computation and fitting of SAXS profiles., Nucleic Acids Research 38,
W540-4.
13. Cronan, J. E. (1982) Molecular properties of short chain acyl thioesters of acyl
carrier protein., The Journal of Biological Chemistry 257, 5013-7.
14. Rafi, S., Novichenok, P., Kolappan, S., Zhang, X., Stratton, C. F., Rawat, R.,
Kisker, C., Simmerling, C., and Tonge, P. J. (2006) Structure of acyl carrier

129
protein bound to FabI, the FASII enoyl reductase from Escherichia coli., The
Journal of Biological Chemistry 281, 39285-93.
15. Cryle, M. J., and Schlichting, I. (2008) Structural insights from a P450 Carrier
Protein complex reveal how specificity is achieved in the P450(BioI) ACP
complex., Proceedings of the National Academy of Sciences 105, 15696-701.
16. Halavaty, A.S., Minasov, G., Filippova, E.V., Dubrovska, I., Winsor, J.,
Shuvalova, L., Peterson, S.N., Anderson, W. F. (2012) 2.52 Angstrom resolution
crystal structure of the acyl-carrier-protein synthase (AcpS)-acyl carrier protein
(ACP) protein-protein complex from Staphylococcus aureus subsp. aureus COL,
Unpublished.

130
CHAPTER SIX
BACILLUS HALODURANS GENTISYL-COA THIOESTERASE
MECHANISM: PRE-STEADY STATE KINETICS, STEADY STATE
KINETICS AND ACTIVE SITE PROPERTIES
6.1 Introduction
Pathways that lead to the mineralization of environmental aromatic compounds
are found in a variety of bacteria (1-5). Examples include the 4-chlorobenzoate, benzoate,
phenylacetate and gentisate (2,5-dihydroxybenzoate) degradation pathways. Because
these aromatic compounds are formed as intermediates in the degradation of larger
aromatic environmental pollutants (e.g., polychlorinated biphenyls, napthalenes and
polyaromatics), the genes that encode the pathway enzymes can be used for engineering
(“metabolic engineering”) bacteria for use in pollutant bioremediation. In order to target a
novel aromatic, the enzymes of a known pathway are engineered to redirect substrate
specificity so that the novel pathway substrate and intermediates are processed. The
starting point for enzyme engineering is the determination of the structural basis for
substrate recognition and catalysis.
In this chapter, I examine the structure-function relationships in the hotdog-fold
superfamily enzyme gentisyl-CoA thioesterase. Gentisyl-CoA is formed during
biodegradation of naphthalene and hydroquinone as well as in the conversion of a variety
of benzoates. The kinetic properties of the gentisyl-CoA thioesterase from Bacillus
halodurans C-125 (“BH1999”) was reported by the Dunaway-Mariano lab in 2004 (6).
BH1999 shares 27% sequence identity with its closest known homolog, the Pseudomonas

131
sp. strain CBS3 4-hydroxybenzoyl-CoA thioesterase (Ps. 4HBT), and it conserves the
active site residues Asp16, Asp31, and Arg108 which have counterparts in Ps. 4HBT
(Figure 6.1).
Figure 6.1: ESpript generated sequence alignment of BH1999 and Pseudomonas sp.
Strain CBS3 4-HBT where white font and red backgrounds represent identical residues
and red font white background represents similar residues.
Until recently, crystal structures of BH1999 have not been unavailable. In
collaboration with Professor Karen Allen and Dr. Lorenzo Finci at Boston University the
X-ray crystal structure of BH1999 bound with the inert substrate analog 2-
hydroxyphenacyl-CoA was recently solved. As shown in Figure 6.2A, the first noticalble
difference between BH1999 and Ps. 4HBT is the replacement of the active site Arg36
with a His residue. The second and perhaps more mechanistically important difference
between the two active sites is the two ordered water molecules in the active site of
BH1999, one of which is positioned close to what would correspond to the reaction site

132
of the bound substrate (Figure 6.2B). The X-ray crystal structures of the active site of Ps.
4HBT bound with the inert substrate analog 4-hydroxyphenacyl-CoA or the D17N
mutant bound with the substrate 4-HB-CoA, do not include an ordered water molecule at
the reaction site, nor does there appear to be room for one. In a previous paper we
reported that the Ps.4HBT Asp17 functions in nucleophilic catalysis (1). The central
question that I address in this chapter is whether the BH1999 Asp16 functions in
nucleophilic or base catalysis. These two mechanisms, introduced in previous chapters
are reviewed in Figure 6.3.
The X-ray structure of the 2-hydroxyphenacyl-CoA BH1999 complex supports both
scenarios because the Asp16 assumes a pose that places it in the now familiar “near
attack” conformation, and yet an ordered water molecule is present at the site and
engaged in hydrogen bond formation with the Asp16 carboxylate group.
Figure 6.2: A. Active site alignment of Ps. 4HBT (violet - PDB ID: 1LO8) and BH1999
(blue - PDB ID: unpublished) with liganded 4-HP-CoA and 2-HP-CoA respectively. B.
Active site of BH1999 with the 2-HP-CoA ligand showing the potential hydrogen
bonding network with active site waters.

133
My objective was to use transient kinetic techniques to measure the time course
for consecutive BH1666-catalyzed single-turnover reactions. If the BH1999 Asp16
functions in base catalysis one would expect a single-phase time course for the multiple-
turnover reaction forgoing a "burst" phase, as discussed in Chapter 3. However, if
BH1999 Asp16 functions in nucleophilic catalysis, similar to that of Ps. 4HBT, one
would expect a biphasic time course for the multiple-turnover reaction consisting of the
fast "burst" phase followed by a slower steady-state phase. In this chapter, I will present
rapid quench data measured for the wild-type BH1999 along with the the results from an
experiment aimed at trapping the covalent anhydride intermediate formed via the
nucleophilic catalysis mechanistic pathway.
O
O
AspH
OH
CoAS O
OH
HO
SCoA O
O
Asp
HO O
OH
HO
O
O
Asp
CoAS O
OH
HO
O
OAsp
O OH
OH
SCoAH
OH
O
O
Asp
HO O
OH
HO
Base Catalysis:
Nucleophilic Catalysis:
Figure 6.3. Illustration of the two possible roles of the Asp catalytic group in thioesterase
catalysis.
134
6.2 Materials and Methods
6.2.1 Materials
All restriction enzymes and T4 DNA ligase were purchased from Invitrogen. Pfu
Turbo DNA polymerases was purchased from Strategene. Oligonucleotide primers were
custom-synthesized by Invitrogen. DNA sequencing was performed by the DNA
Sequencing Facility of the University of New Mexico. 2,5-Dihydroxybenzoyl-CoA (2,5-
DHB-CoA) and 3-hydroxybenzyol-CoA (3-HBA-CoA) were synthesized as previously
reported (2).
6.2.2 Subcloning, expression, and purification
The wild-type (WT) BH1999 gene was amplified by PCR using the native
BH1999/pET23a plasmid as template, commercial oligonucleotides as primers, and Deep
Vent as the DNA polymerase. (3) The PCR-products were digested by the restriction
enzymes NdeI and XhoI and then purified by polyacrylamide gel electrophoresis. The
gene was ligated to an Nde I and XhoI -digested pET23a vector (Novagen) to include the
C-terminal His6 tag. The cloned gene was verified by DNA sequencing. The cloned
plasmid was used to transform competent E. coli BL21(DE3) cells (Invitrogen) for
expression. The BH1999/pET-23a transformed E. coli BL21(DE3) cells were grown
aerobically at 37 oC in LB media containing 50 µg/ml ampicillin. Production of the C-
terminal His6 tagged BH1999 was induced with 0.4 mM isopropyl-β-D-galactopyranoside
(IPTG) once the cell density reached A600 ~ 0.6. Following a 12 h induction period at 22
oC, the cells were harvested by centrifugation at 6,500 rpm for 10 min and then
resuspended in 100 mL of 50 mM K+HEPES buffer (pH 7.5), 50 mM imidazole, and 500

135
mM NaCl (Lysis Buffer). The cells were lysed using a French press at 1,200 psi and the
lysate was centrifuged at 20,000 rpm for 15 min. The supernatant as loaded onto a 5 mL
HisTrap FF column (GE Life Sciences) and the column was washed with Lysis Buffer at
4 oC to remove non-tagged protein and then with 50 mM K
+HEPES (pH 7.5), 500 mM
imidazole, and 500 mM NaCl (Elution Buffer) to elute the tagged protein. Column
fractions were monitored by their measuring absorbance at 280 nm and by carrying out
SDS-PAGE analysis. The BH1999 containing fractions were combined and dialyzed
three times against 1 L 50 mM K+HEPES (pH 7.5) and 50 mM NaCl. Yield: ~ 18 mg/g
of wet cells.
Site-directed mutagenesis was carried out to create the D16E mutant using the
Quick Change PCR strategy (Stratagene) with the WT-BH1999/pET-23a plasmid,
commercial primers, and Pfu Turbo polymerase. The PCR products were purified by
polyacrylamide gel electrophoresis and treated with DpnI to degrade the wild-type
plasmid. The Nde I and XhoI digested recombinant mutant plasmid was used to
transform competent E. coli BL21 (DE3) cells (Invitrogen) for expression. The sequence
of the mutated gene was confirmed by DNA sequencing. The mutant protein was
purified to homogeneity (as determined by SDS-PAGE analysis) by the same procedure
used for the wild-type BH1999. Yield: ~19 mg/g of wet cells.
6.2.3 Steady-state kinetic analysis of the WT BH1999 and the D16E mutant
Thioesterase activity was measured using the 5,5’-dithio-bis-(2-nitrobenzoic acid)
(DTNB) coupled assay. Reactions were monitored at 412 nm (Δε = 13.6 m -1•cm
-1)
using a Beckman 640U Spectrometer. Reactions were carried out in 50 mM K+HEPES

136
and 1 mM DTNB (pH 7.5, 25 oC) containing thioesterase and varying concentrations of
thioester (0.5 – 3 x Km) in a total volume of 500 µL. For all measurements, the initial
velocity data, measured as a function of substrate concentration, were analyzed using
Enzyme Kinetics v 1.4 and equation (1).
V = V max [S]/([S]+Km) (1)
where V is initial velocity, V max is maximum velocity, [S] is substrate concentration, and
Km is the Michaelis constant. The kcat was calculated from Vmax/[E] where [E] is the total
enzyme concentration as determined by the Bradford method.
6.2.4 Synthesis of 14
C radiolabled 3-hydroxybenzyol-CoA
[14
C]-3-HB-CoA was synthesized enzymatically by using the 4-hydroxybenozoic
acid ligase (4HBAL) from Rhodopseudomonas palustris. 4HBAL was purified using the
procedure reported in Chapter 3 (4). The [14
C]-3-hydroxybenzoic acid (specific activity
of 50 mCi/mol; American Radiolabeled Chemicals Inc.) was converted to the sodium salt
by the addition of 100 µL 0.1 M NaOH and then added to a final concentration of 2 µM
to a 1 mL solution comprised of 100 mM K+HEPES, 5 mM MgCl2, 13 mM coenzyme-A,
13 mM ATP, 8 U inorganic pyrophosphatase and 5 µM 4HBAL. The reaction mixture
was incubated at room temperature overnight and then acidified by the addition of 50 µL
of 1 M HCl. The precipitated protein was separated by centrifugation at 14,000 rpm for 5
min. [14
C]-3-HB-CoA was purified from the supernatant by chromatography on a semi-
prep Ultra Aqueous C-18 reverse phase HPLC column (RESTEK) eluted with a linear
gradient of 50% 20 mM KH2PO4 (pH 6.1) and 66% CH3CN at a flow rate of 3 mL/min.
The chromatography was monitored by an in-line SPD-20AV UV/Vis detector
137
(Shimadzu) at 260 and 310 nm. The target compound eluted at ~15 min. The desired
fractions were combined and lyophilized to a powder and then resuspended in water. The
yield of 25% was calculated from the absorbance at 261 nm (ε261 = 21.3 M-1
cm-1
) (5).
6.2.5 Rapid-quench studies of the WT BH1999 and D16E mutant catalyzed
hydrolysis of 3-hydroxybenzoyl-CoA under single and multiple turnover conditions
A rapid-quench instrument from KinTek Instruments was used to combine
buffered wild-type thioesterase with buffered [14
C]3-HB-CoA to initiate the reaction, and
then to add 0.2 M HCl to terminate the reaction. For the multiple turnover reactions,
mixtures initially contained 10 µM enzyme and 50 M [14
C]3-HB-CoA in 100 mM
NaCl/50 mM K+HEPES (pH 7.5, 25 C), whereas for the single turnover reactions,
enzyme and [14
C]3-HB-CoA concentrations were 50 M and 30 M, respectively. The
protein was removed from the quenched reaction solution using a 10,000 MWCO
centrifuge column prior to carrying out the separation of the [14
C]3-HB-CoA and [14
C]3-
HB on a C18-reversed phase analytical column (RESTEK), eluted using a linear gradient
of 50% 20 mM KH2PO4 (pH 6.1) and 66% CH3CN at a flow rate of 1 mL/min. The
radioactivity of the substrate and product fractions was quantified using an in-line β-
RAM4 (Lab Logic) scintillation counter. Peak integrations were performed by Laura
software (Lab Logic) and the progress curves were fitted by simulation using the KinTek
Corp. Global Kinetic Explorer computer program.

138
6.2.6 Trapping the catalytic aspartate with hydroxylamine
Thioesterase activity was monitored using the DTNB assay described above.
Reactions contained 0.07 µM WT BH1999 thioesterase, 70 µM 3-HB-CoA and 100 mM
hydroxylamine. Control reactions with substrate, substrate and enzyme, hydroxylamine,
and hydroxylamine and substrate were also conducted. A stock solution of protein
incubated with 100 mM hydroxylamine was prepared to ensure that hydroxylamine was
not modifying the enzyme directly without catalytic turnover. An aliquot of the
equilibrated BH1999 was used in a reaction void of hydroxylamine to demonstrate no
loss in activity. The final control reaction containing 100 mM hydroxylamine and 70 µM
CoA was carried out to verify that CoA reacts with DTNB in the presence of
hydroxylamine.
6.3 Results and Discussion
6.3.1 Steady-state kinetic analysis of wild-type BH1999 and the mutant D16E
The recombinant Bacillus halodurans thioesterase BH1999 was subjected to
steady-state kinetic analysis to verify the previously reported activity (7). The current
BH1999 preparation proved to be slightly more active (~2-fold increase in kcat) than the
previous preparation (Table 5.1) (3).
In order to determine the impact of altering the length of the side chain of the
catalytic carboxylate residue (Asp16) on the catalytic efficiency, the D16E mutant was
prepared for kinetic analysis. The BH1999 X-ray structure shows that the Asp16
carboxylate group is engaged in hydrogen bond interaction (2.6 Å) with the active site
water molecule but it is not pinned into position by an active site enzyme residue. It is
expected that the additional methylene group of the Glu side chain will perturb the

139
orientation of the carboxylate group relative to the substrate thioester group. If the Asp16
functions as a nucleophile, its orientation will be especially important because of the
steric requirements for the attack of a nucleophile on a carbonyl carbon. Likewise, if the
carboxylate group, in the role of base catalyst, orients the water nucleophile for attack at
the substrate thioester group the extension of the side chain by the additional methylene
group might cause misalignment of the water nucleophile. As shown in Table 5.1, the kcat
(and not the Km) value determined for BH1999 D16E catalyzed hydroylis of gentisyl-
CoA is altered. However, the 63-fold reduction compared to 500 and 5,000-fold
reduction in the kcat values reported for the D16N and D16A mutants (7), suggests that
the carboxylate group of the D16E mutant retains a majority of the function of the Asp16
of the wild-type enzyme.
* Data was taken from reference (6).
Table 6.1: Steady-state kinetic constants for BH1999-catalyzed hydrolysis of acyl-CoA
and and aroyl-CoA thioesters measured using DTNB spectrophotometric assay at pH 7.5
and 25 oC. ND - not determined.
Enzyme Substrate kcat
(s-1
)
KM
(µM)
kcat/KM
(M-1
s-1
)
Wild-type 4-HB-CoA (4.2 ± 0.2) x 10-2
120 ± 20 3.6 x 10²
Wild-type Gentisyl-CoA 15 ± 1 5.3 ± 0.5 2.9 x 10⁶
Wild-type Benzoyl-CoA (6.8 ± 0.3) x 10-2
330 ± 40 2.1 x 10²
Wild-type 3-HB-CoA 4.5 ± 0.2 5.0 ± 0.4 9.0 x 10⁵
D16E Gentisyl-CoA 0.24 ± 0.01 8.5 ± 0.9 2.8 x 10⁴
D16E 3-HB-CoA 0.30 ± 0.01 5.9 ± 0.6 5.0 x 10⁴
D16A* Gentisyl-CoA 3 x 10⁻³
ND ND
D16N* Gentisyl-CoA (2.8 ± 0.3) x 10-2
9 ± 2 3.1 x 10³

140
6.3.2 Kinetic analysis of wild-type BH1999
Global fitting of steady-state, single-turnover, and multiple-turnover time courses
for wild-type BH1999-catalyzed 3-HB-CoA was carried out to define microscopic rate
constants for the reaction steps. This particular substrate was chosen because 4HBAL
does not catalyze the ligation of 2,5-dihydroxybenzoic acid (2,5-DHB) to CoA and the
chemical synthesis of the 2,5-DHB-CoA requires large quantities of starting material.
The time course for the steady-state reaction was measured by monitoring of the
hydrolysis of the 3-HB-CoA thioester at 310 nm. The absorbance was converted to 3-
HB-CoA concentration using Δε = 2.18 m -1
cm-1
. The time course data were fitted by
simulation assuming the kinetic model shown in Scheme 6.1 and by restricting the values
of k1, k-3 and k-4 to 1000 s-1
and the value of k-2 to 0 s-1
.
The KM (k-1/k1) was calculated to be ~1 µM as compared to the KM value of 5 µM
determined from steady-state initial velocity data measured as a function of substrate
concentration (and fitted to the Michaelis-Menten equation). The Ki for CoA (k3/k-3) was
calculated to be ~300 µM and the Ki (k4/k-4) for 3-HBA acid was calculated to be ~ 800
µM. The kcat was in found to be 3-fold larger than the steady state derived kcat, ~14
versus 4.5 s-1
respectively.
E + S ES EPQ EP E + P
Qk1
k2k3 k4
k-1 k-2 k-3 k-4(Q)
(Scheme 6.1)

141
Figure 6.3: Experimental and simulated time courses for the steady state reaction
containing 0.035 µ wild type BH1999 and 14 (●) or 24 µ (●) 3-HB-CoA in 50 mM
K+HEPES (pH 7.5, 25
oC). Data was obtained by observing the hydrolysis of 3-HB-CoA
at 310 nm (Δε = 2.18 m -1
cm-1
). The simulated curves were generated using the kinetic
model in Scheme 1 and assuming k1 = 160 µM-1
s-1
, k-1 = 100 s-1
, k2 = 14 s-1
, k-2 = 0 s
-1, k3
= 150 s-1
, k-3 = 0.5 s-1
, k4 = 110 µM-1
s-1
, k-4 = 6 s-1
.
The time course measured for the multiple-turnover reaction of 10 µM BH1999
and 50 µM [14
C] 3-HB-CoA did not demonstrate a "burst" phase in contrast to the time
course measured for Ps. 4HBT (1). Instead the reaction time course appears to have a
single linear phase as shown in Figure 6.4. The time course was fitted by simulation
using the by KinTek Corp. Global Kinetic Explorer computer program in conjunction
with the kinetic model shown in Scheme 6.1 and the following rate constants: k1 = 200-
700 µM-1
s-1
, k-1 = 100-300 s-1
, k2 = 14-16 s-1
, k-2 = 0 s
-1, k3 = > 200 s
-1, k-3 = < 0.5 s
-1, k4 =
90-150 µM-1
s-1
, k-4 = 5-20 s-1
(Figure 6.4A) The kinetic model was expanded to that
shown in Scheme 5.2 and using the kinetic constants k1 = 175-700 µM-1
s-1
, k-1 = 180-400

142
s-1
, k2 = 15.5 -18 s-1
, k-2 = 0 s
-1, k3 = 40-100 s
-1, k-3 = 0 s
-1, k4 = >200 µM
-1s
-1, k-4 = <20 s
-
1, k5 = >200 µM
-1s
-1, k-5 = <10 s
-1 a time course was simulated to match the experimental
time course (Figure 6.4B).
A B
Figure 6.4: Experimental and simulated time courses for the multiple turnover reaction
containing 10 µM wild type BH1999 and 50 µM [14
C] 3HB--CoA in 50 mM K+Hepes
(pH 7.5, 25 oC). The time point data [
14C] 3-HB-CoA (●) and [
14C] 3-hydroxybenzoic
acid (●) were calculated from the fraction of [14
C] 3-HB-CoA and [14
C] 3-
hydroxybenzoic acid present in the acid quenched reaction. (A.) The simulated curves
were generated using the kinetic model in Scheme 6.1 using the rate constants k1 = 160
µM-1
s-1
, k-1 = 100 s-1
, k2 = 14 s-1
, k-2 = 0 s
-1, k3 = 150 s
-1, k-3 = 0.5 s
-1, k4 = 110 µM
-1s
-1, k-4
= 6 s-1
. (B) The simulated curves were generated using the kinetic model of Scheme 6.2
using the rate constants k1 = 250 µM-1
s-1
, k-1 = 400 s-1
, k2 = 14.5 s-1
, k-2 = 0 s
-1, k3 = 75 s
-
1, k-3 = 0 s
-1, k4 =325 µM
-1s
-1, k-4 = 1.5 s
-1, k5 = 300 µM
-1s
-1, k-5 = 2.5 s
-1.
E + S ES EPQ EP E + P
Qk1
k2k4 k5
k-1 k-2 k-4 k-5(Q)
EIQk3
k-3
(Scheme 6.2)

143
The single-turnover reaction of 50 µM BH1999 and 30 µM [14
C]3-HB-CoA was
conducted for the purpose of circumscribing the time course to reflect only the substrate
binding step (k1 and k-1) and the chemical step (concerted reaction; Kinetic model of
Scheme 6.1; k2 and k-2) or chemical steps (concerted reaction; Kinetic model of Scheme
6.2 ; k2, k-2, k3 and k-3) of the reaction. The time course for the single turnover reaction is
shown in Figure 6.5A fitted with curves simulated assuming the kinetic model of Scheme
6.1 and setting k-3 = 0 s-1
. The fitted data provided the following ranges: k1 = >100 µM-1
s-
1, k-1 = <300 s
-1, k2 = 13-15 s
-1 and k-2
= 0 s
-1. The time course for the single turnover
reaction is shown in Figure 6.5B fitted with curves simulated assuming the kinetic model
of Scheme 6.2 and setting k-3 = 0 s-1
. The fitted data provided the following ranges: k1 =
>100 µM-1
s-1
, k-1 = >300 s-1
, k2 = 13-15 s-1
and k-2 = 0 s
-1.
A B
Figure 6.5: Experimental and simulated time courses for the single turnover reaction
containing 50 µM wild type BH1999 and 30 µM [14
C]3-HB-CoA in 50 mM K+HEPES
(pH 7.5, 25 oC). The time point data [
14C]3-HB-CoA (●) and [
14C]3-hydroxybenzoic
acid (●) were calculated from the fraction of [14
C] 3-HB-CoA and [14
C] 3-
hydroxybenzoic acid present in the acid quenched reaction. (A) The simulated curves
were generated using the kinetic model in Scheme 6.1 using the rate constants k1 = 160

144
µM-1
s-1
, k-1 = 100 s-1
, k2 = 14 s-1
, k-2 = 0 s
-1, k3 = 150 s
-1, k-3 = 0.5 s
-1, k4 = 110 µM
-1s
-1, k-4
= 6 s-1
. (B) The simulated curves were generated using the kinetic model of Scheme 6.2
using the rate constants k1 = 250 µM-1
s-1
, k-1 = 400 s-1
, k2 = 14.5 s-1
, k-2 = 0 s
-1, k3 = 75 s
-
1, k-3 = 0 s
-1, k4 =325 µM
-1s
-1, k-4 = 1.5 s
-1, k5 = 300 µM
-1s
-1, k-5 = 2.5 s
-1.
6.3.3 - Trapping the covalent enzyme intermediate by reaction with hydroxylamine
The absence of the "burst" phase in the in the time course measured for the
multiple turnover reaction of 3-HB-CoA is consistent with a single chemical step
involving Asp16 base catalysis as well as a two-step reaction (involving Asp16
nucleophilic catalysis) in which the first step (anhydride intermediate formation) is rate-
limiting. To distinguish between these two scenarios we measured the time course for
BH1999-catalyzed hydrolysis of 3-HB-CoA hydrolysis in the presence of the nucleophile
hydroxylamine. Hydroxylamine as a more reactive nucleophile than is water and thus can
potentially compete with an active site water molecule for attack at the electrophilic
center. Hydroxylamine has previously been shown to trap a ubiquitin-carboxylase mixed
anhydride by forming the carboxylase-hydroxamate (6). Reaction of the hydroxylamine
at the carbonyl carbon of the acylated Asp16 would displace the 3-HB and convert the
Asp16 carboxylate group to a hydroxyamide adduct, and thus inactive the enzyme (see
Figure 6.6). Alternatively, if the attack occurs at the 3-hydroxybenzoyl carbonyl carbon
no inactivation will be observed.

145
Figure 6.6. Reaction scheme showing the products of the hydroxylamine incorporation
into the mixed anhydride.
The inactivation experiment was carried out in parallel with several control
experiments. Accordingly, the time course for the hydrolysis of 70 µM 3-HB-CoA
catalyzed by 0.07 µM BH1999 was measured using the DTNB coupled assay in the
presence (in duplicate) and absence of 100 mM hydroxylamine. The results are presented
in Figure 6.7. Absorbance changes that might result from DTNB in combination with 70
µM 3-HB-CoA or 100 mM hydroxylamine were ruled out in the respective control
reactions. Likewise, inactivation by reaction of the 100 mM hydroxylamine with the
BH1999 in the absence substrate was eliminated on the basis of the control reaction
which contained 0.07 µM BH1999 that had been subjected to preincubation with 100
mM hydroxylamine prior to reaction with 70 µM 3-HB-CoA. Lastly, a control reaction
was carried out to show that the 100 mM hydroxylamine does not inhibit the reaction of
DTNB with the CoA.
O
O
Glu/AspR
O
HN
O
Glu/Asp
OH
R
O
NH
OH
NH2OH
+

146
Figure 6.7. All reaction solutions contained 1 mM DTNB in 50 mM K+HEPES (pH 7.5,
25 oC). Test Reactions: (─) 70 µM 3-HB-CoA and 0.07 µM BH1999; (─,─) 70 µM 3-
HB-CoA, 100 mM hydroxylamine, and 0.07 µM BH1999; Control Reactions: (─) 70 µM
3-HB-CoA and 0.07 µM BH1999 preincubated with 100 mM hydroxylamine; (─) 70 µM
CoA and 100 mM hydroxylamine; (─) 70 µM 3-HB-CoA; (─)100 mM hydroxylamine;
(─)70 µM 3-HB-CoA and 100 mM hydroxylamine.
6.4 Conclusion: Catalytic Mechanism
Like the AA clade prototype Ps 4HBT, BH1999 forms a tetrameric structure in
which each central helix is located inside the interfaced dimer of dimer (Figure 6.8A).
Furthermore, the active site thioester-polarizing residue and the catalytic carboxylate
residue are contributed by one of the paired subunits that form the active site (Figure

147
6.8B) (the AB clade is distinguished by one of the subunits contributing the catalytic
carboxylate residue and the other the thioester-polarizing residue). The X-ray structure of
the Ps 4HBT complexed with the inert substrate analog 4-hydroxyphenacyl-CoA
revealed the same alignment of reaction center with catalytic residues as did the X-ray
structure of the substrate (4-hydroxybenzoyl-CoA) complex with the catalytically inert Ps
4HBT mutant, in with the catalytic Asp17 was replaced with Asn. The structures of the
liganded active sites revealed the following key features: (1) the Asp17 carboxylate group
is in near-attack conformation relative the thioester C=O, (2) the thioester carbonyl is
positioned for hydrogen bond formation with the backbone amide NH of the central -
helix N-terminal residue, (3) the thioester group is tightly encased such that there is room
for a solvent molecule, (4) there is no polar residue in the vicinity of the thioester S atom
to function in acid catalysis and (5) there is no polar residue in the correct position to
function in base catalysis of the anhydride intermediate.
A B

148
Figure 6.8. (A). The cartoon representation of the BH1999 tetramer with subunits
colored green, yellow, red and blue. (B) The BH1999 dimer showing the truncated 2-
hydroxyphenacyl-CoA ligand in grey stick and the Asp16 and Tyr23 in red stick. The
Asp31 located on the opposing subunit (red stick), is conserved in the Ps 4HBT.
The alignment of BH1999 catalytic residues with the substrate thioester group
suggested by the structure of BH1999 bound with the inert substrate analog 2-
hydroxyphenacyl-CoA deviates from the pattern observed with Ps 4HBT. Specifically,
whereas the catalytic scaffolds of the two thioesterases superimpose very well, the ligand
2-hydroxyphenacyl group does not align with the 4-hydroxyphenacyl group of the Ps
4HBT (Figure 6.2). The change in pose is stabilized by a network of hydrogen bonds
formed with active site water molecules that function as bridges between ligand and
active site residues. The C=O is pulled away from the Asp16 carboxylate group. This
created the room for a solvent water molecule, which engages both oxygen atoms in
hydrogen bond formation.
The BH1999 X-ray structure provides a snapshot of the active site which captured
the Asp16 carboxylate group engaging a water molecule for attack at the thioester C=O
as defined by inert substrate analog. This picture served as the starting point for the
application of kinetic experiments that had been used earlier to demonstrate the catalytic
mechanism of Ps 4HBT. The result of the transient kinetic test of the two-step pathway
associated with Asp16 functioning in nucleophilic catalysis did not prove or disprove
either mechanism. On the other hand, the chemical trapping experiment provides strong

149
evidence that the BH1999 catalyzed reaction is a two-step reaction in which Asp16
functions in nucleophilic catalysis.

150
References
1. Zhuang, Z., Latham, J., Song, F., Zhang, W., Trujillo, M., and Dunaway-Mariano,
D. (2012) Investigation of the catalytic mechanism of the hotdog-fold enzyme
superfamily Pseudomonas sp. strain CBS3 4-hydroxybenzoyl-CoA thioesterase.,
Biochemistry 51, 786-94.
2. Guo, Z.-F., Sun, Y., Zheng, S., and Guo, Z. (2009) Preferential hydrolysis of
aberrant intermediates by the type II thioesterase in Escherichia coli nonribosomal
enterobactin synthesis: substrate specificities and mutagenic studies on the active-
site residues., Biochemistry 48, 1712-22.
3. Zhuang, Z., Song, F., Takami, H., and Dunaway-Mariano, D. (2004) The BH1999
Protein of Bacillus halodurans C-125 Is Gentisyl-Coenzyme A Thioesterase The
BH1999 Protein of Bacillus halodurans C-125 Is Gentisyl-Coenzyme A
Thioesterase, Journal of Bacteriology 186.
4. Wu, R., and of New Mexico, T. U. (2007) Domain Movement and Substrate
Recognition in 4-chlorobenzoate: Coenzyme A Ligase from Alcaligenes Sp. Strain
AL3007. The University of New Mexico.
5. Webster Jr., L. T., Mieyal, J. J., and Siddiqui, A. (1974) Benozyl and
Hydroxybenzoyl Esters of Coenzyme A, The Journal of Biological Chemistry 249,
2641-2645.
6. Pickart, C. M., and Rose, A. (1986) Mechanism of Ubiquitin Carboxyl-terminal
Hydrolase, The Journal of Biological Chemistry 261, 10210-10217.
151
APPENDIX
A.1 Published Collaborative Work
A1.1 Regioselectivity of Enzymatic and Photochemical Single Electron Transfer
Promoted Carbon-Carbon Bond Fragmentation Reactions of Tetrameric Lignin
Model Compounds
aDae Won Cho
*,
aJohn A. Latham,
bHea Jung Park,
bUng Chan Yoon,
cPaul Langan,
aDebra Dunaway-Mariano,
aPatrick S. Mariano
*
aDepartment of Chemistry and Chemical Biology, University of New Mexico,
Albuquerque, New Mexico, 87131
bDepartment of Chemistry and Chemistry Institute for Functional Materials, Pusan
National University, Busan 609-735, Korea
cBioscience Division, Los Alamos National Laboratory
Los Alamos, NM 87545, USA

152
Abstract
New types of tetrameric lignin model compounds, which contain the common -O-4
and -1 structural subunits found in natural lignins, have been prepared and carbon-
carbon bond fragmentation reactions of their cation radicals, formed by photochemical
(9,10-dicyanoanthracene) and enzymatic (lignin peroxidase) SET-promoted methods,
have been explored. The results show that cation radical intermediates generated from the
tetrameric model compounds undergo highly regioselective C-C bond cleavage in their -
1 subunits. The outcomes of these processes suggest that, independent of positive charge
and odd electron distributions, cation radicals of lignins formed by SET to excited states
of sensitizers or heme-iron centers in enzymes degrade selectively through bond cleavage
reactions in -1 vs. -O-4 moieties. In addition, the findings made in the enzymatic
studies demonstrate that the sterically large tetrameric lignin model compounds undergo
lignin peroxidase catalyzed cleavage via a mechanism involving preliminary formation of
an enzyme-substrate complex.

153
A.1.2 Investigation of the Catalytic Mechanism of the Hotdog-fold
Enzyme Superfamily Pseudomonas sp. strain CBS3 4-Hydroxybenzoyl-
CoA Thioesterase+
Zhihao Zhuang1#
, John Latham1, Feng Song
1#, Wenhai Zhang
1#, Michael Trujillo
2# and
Debra Dunaway-Mariano1*
1Department of Chemistry and Chemical Biology, University of New Mexico,
Albuquerque, NM 87131; 2Scientific Laboratory Division, New Mexico Department of
Health, Albuquerque, NM 87131
Abstract
The 4-hydroxybenzoyl-CoA (4-HB-CoA)1 thioesterase from Pseudomonas sp strain
CBS3 catalyzes the final step of the 4-chlorobenzoate degradation pathway, which is the
hydrolysis of 4-hydroxybenzoyl-CoA (4-HB-CoA) to coenzyme A (CoA) and 4-
hydroxybenzoate. In previous work, X-ray structural analysis of the substrate-bound
thioesterase provided evidence for the role of an active site Asp17 in nucleophilic
catalysis (Thoden, J. B., Holden, H. M., Zhuang, Z., Dunaway-Mariano, D. (2002) X-ray
crystallographic analyses of inhibitor and substrate complexes of wild-type and mutant 4-
hydroxybenzoyl-CoA thioesterase. J. Biol. Chem. 277, 27468-27476.). In the present
study, kinetic techniques were used to test the catalytic mechanism that was suggested by
the X-ray structural data. The time course for the multiple-turnover reaction of 50 M

154
[14
C]4-HB-CoA catalyzed by 10 M thioesterase supported a two-step pathway in which
the second step is rate-limiting. Steady-state product inhibition studies revealed that CoA
(Kis = 250 ± 70 M, Kii = 900 ± 300 M) and 4-HB (Kis = 1.2 ± 0.2 mM) binding is
weak, suggesting that product release is not rate-limiting. A substantial D2O solvent
kinetic isotope effect (3.8) on the steady-state kcat value (18 s-1
) provided evidence that a
chemical step involving proton transfer is the rate-limiting step. Taken together, the
kinetic results support a two-chemical pathway. The microscopic rate constants
governing the formation and consumption of the putative aspartyl17-(4-
hydroxybenzoyl)anhydride intermediate were determined by simulation-based fitting of a
kinetic model to time courses for the substrate binding reaction (5.0 M 4-HB-CoA and
0.54 M thioesterase), single-turnover reaction (5 M [14
C]4-HB-CoA catalyzed by 50
M thioesterase), steady-state reaction (5.2 M 4-HB-CoA catalyzed by 0.003 M
thioesterase) and transient-state multiple-turnover reaction (50 M [14
C]4-HB-CoA
catalyzed by 10 M thioesterase). Together with the results obtained from solvent 18
O-
labeling experiments, the findings are interpreted as evidence for the formation of an
aspartyl17-(4-hydroxybenzoyl)anhydride intermediate that undergoes rate-limiting
hydrolytic cleavage at the hydroxybenzoyl carbonyl carbon atom.
155
A.2 Manuscript of Collaborative Work Submitted for Publication
A2.1 Regioselectivity of Enzymatic and Photochemical Single Electron Transfer
Promoted Carbon-Carbon Bond Fragmentation Reactions of Tetrameric Lignin Model
Compounds
aDae Won Cho
*,
aJohn A. Latham,
bHea Jung Park,
bUng Chan Yoon,
cPaul Langan,
aDebra Dunaway-Mariano,
aPatrick S. Mariano
*
aDepartment of Chemistry and Chemical Biology, University of New Mexico,
Albuquerque, New Mexico, 87131
bDepartment of Chemistry and Chemistry Institute for Functional Materials, Pusan
National University, Busan 609-735, Korea
cBioscience Division, Los Alamos National Laboratory
Los Alamos, NM 87545, USA
([email protected], [email protected])
Introduction
The cellulose found in plant cell walls can be transformed to glucose, the starting
materials for fermentation that efficiently yields bioethanol. However, a large barrier
exists to accessing and hydrolytically cleaving cellulose in most plant materials, owing to
its encasement in networks comprised of lignin. Lignin is a natural, heterogeneous

156
arylpropanoid polymer that is biosynthesized in plants in order to provide structural
rigidity and prevent hydrolysis of cellulose and, thereby, to protect plants from external
chemical and/or biological attack.1,2
As a result, a large effort is underway to develop
mild, non-energy-intensive and eco-friendly methods to bring about delignification of
plant materials so that cellulose can be easily converted to glucose, the precursor of
bioethanol.
One approach to delignification employs fungi (eg., the white rot fungus
Phanerochaete chrysosporium) that excrete iron-heme containing enzymes, such as
lignin peroxidase (LP) and manganese peroxidase (MnP), which catalyze oxidation
reactions that lead to cleavage of C-C bonds in lignin.3 The cleavage reactions result in a
decrease of the structural integrity and an increase in the permeability of the
arylpropanoid polymer. The mechanistic pathway for LP induced degradation of lignin
involves initial single electron transfer (SET) from the aromatic groups in the polymer to
the doubly oxidized form of LP (i.e., LP I) to generate lignin radical cations, which
undergo carbon-carbon bond cleavage (Scheme 1).4-13
An alternative route has been
suggested that involves mediation by small molecules (eg., veratryl alcohol) whose cation
radicals formed by SET to LP I are responsible for one electron oxidation of lignin.
Studies are underway in our laboratory to gain fundamental information about how
the composition of lignins might govern the efficiencies of delignification reactions that
proceed via SET pathways. We believe that this information is potentially relevant to
ethanol production
Scheme 1.

157
from plant materials14,15
since it could provide a framework for the genetic design of
plants16,19
that have the type of lignin that are more readily cleaved by enzymatic or other
oxidative processes. Prior to our efforts in this area, nothing was known about the C-C
bond cleavage reactivity of sites in lignin where radical cation formation can take place.
This is an extremely important issue since it is possible that SET from lignin to either LP
I directly and/or to hole carrier mediator cation radicals produces a mixture of
intermediates that differ in the site where the cation radical center exists and that these
intermediates undergo rapid and reversible interconversion by an electron hopping
mechanism. As we have shown in previous investigations,20
in this event, the site(s) at
which cation radical C-C bond cleavage takes place more rapidly will strongly influence
the nature and overall efficiency of the lignin cleavage process.
In an earlier study,21
information was gained about the efficiencies/rates of C-C
bond cleavage of arylpropanoid units in lignin. For this purpose, SET photochemical,
Ce(IV), and LP promoted oxidation reactions were carried out on dimeric lignin model
compounds 1 and 4 that represent the -1 (1,2-diarylpropanoid) and -O-4 (1-aryl-2-
aryloxypropanoid) groups that are present in the lignin skeleton (Scheme 2). The

158
observations made in that effort show that, regardless of the method used for their
generation, cation radicals derived by SET oxidation of -1 lignin model undergo C-C
bond cleavage more rapidly than do those produced from -O-4 model compounds.
Scheme 2.
Another approach to assessing how structure governs the C-C bond cleavage
reactivity of lignin cation radicals involves the use of the more complex lignin models.
This approach was employed in an earlier study of trimeric lignin models by Baciocchi
and his coworkers.22
The results of that investigation showed that LP generated radical
cations of trimeric models composed of two -O-4 units degrade by C-C or benzyl C-H
bond cleavage processes to give aldehyde and -hydroxyketone products by pathways
that mimic fragmentation patterns seen in dimeric model compounds. To our knowledge,
no investigation has been conducted using more complex lignin models that contain
different arylpropanoid units to assess the sites at which cation radical C-C bond cleavage
takes place more efficiently.

159
As part of our continuing efforts in this area we have designed a study of SET-
photochemical and LP-catalyzed reactions of tetrameric lignin model compounds that are
comprised of both -1 and -O-4 moieties. We envisaged that analysis of products
produced in low conversion reactions of these models would yield information about the
relative rates of C-C bond cleavage in interconverting radical cations in which the charge
and odd electron is distributed over -1 and -O-4 moieties. For example, if the -1 > -
O-4 reactivity pattern observed in our earlier investigation with dimeric models is
general, it is anticipated that cation radicals of mixed -1 and -O-4 tetrameric models
will undergo predominant cleavage of 1,2-diaryl rather than 1-aryl-2-aryloxy C-C bonds.
To probe this feature, two tetrameric lignin model compounds, 6EE and 7TE
(Scheme 3), in which -1 and -O-4 groups are connected via an ether linkage in a
manner that mimics arylpropanoid arrays in the natural polymer, were prepared. Studies
of the time courses of SET-promoted photochemical and LP enzymatic reactions of these
substances were carried out. The results of this effort demonstrate that the most rapid
reaction pathways followed by 6EE and 7TE involve C-C bond cleavage of -1 units
within their tetrameric skeletons. These findings along with observations made in probing
the kinetics of the LP processes are described and discussed below.
Scheme 3.

160
Results
Synthesis of Tetrameric Lignin Models. A convergent strategy was used for the
preparation of the tetrameric model compounds 6EE and 7TE (Scheme 4). The approach
involves the preparation and coupling of the selectively protected, diastereomerically
pure phenols 12E and 16T with the respective primary tosylates 23E and 24E. The
synthesis of 12E was initiated by aldol condensation of the aryloxyacetate 8 with the
selectively protected veratraldehyde derivative 9 (Scheme 4). This process afforded a
separable mixture of the diastereomeric esters 10T and 10E, the latter of which was
treated with LiAlH4 followed by acetonide protection of the resulting 1,3-diol to form the
erythro phenol 12E. A similar route beginning with the arylacetate 13 was employed to
generate the threo phenolic acetonide 16T. The stereochemical assignments to these
substances were made by comparison of their spectroscopic properties with those
previously reported for closely related compounds whose stereochemistry was
determined by using X-ray crystallographic analysis.21,23,24
Scheme 4.

161
The tosylate coupling partners 23E and 24E were synthesized by using processes
developed in our earlier effort21
beginning with MOM protection of the erythro -
hydroxyesters 17E and 18E. The protected hydroxyesters were then transformed to the
respective target tosylates 23E and 24E by sequential treatment with LiAlH4 and p-
toluenesulfonyl chloride (Scheme 5).
Scheme 5.
Scheme 6.

162
Preparation of the tetrameric lignin model compounds 6EE and 7TE was
accomplished by using respective hetero-coupling reactions of the -O-4 phenol 5E with
the -1 tosylate
24E, and of the -1 phenol 16T with the -O-4 tosylate 23E (Scheme 6). These processes
were promoted by treatment of the phenol derivatives with NaH. The products of these
reactions, 25EE and 26TE, were then treated with 3N HCl to remove the acetonide and
MOM protecting groups and furnish the desired tetrameric models 6EE and 7TE. Owing
to the fact that enantiomeric mixtures of the phenol and tosylate subunits were used in the
coupling reactions, 6EE and 7TE are produced as ca. 1:1 mixtures of inseparable
diastereomers.

163
DCA-Promoted Photoreaction of Tetrameric Lignin Models. One method
employed for the generation of cation radicals of the tetrameric lignin model compounds
6EE and 7TE involves SET-photosensitization with the acceptor 9,10-dicyanoanthracene
(DCA). Prior to beginning photochemical studies, the oxidation potentials and rates of
DCA fluorescence quenching were determined for 6EE and 7TE (see Supporting
Information for fluorescence spectra and Stern-Volmer plots). The results of these
experiments show that SET from tetrameric lignin models to the singlet excited state of
DCA (E1/2(-) DCAS1
= +2.8 V) is both predicted and observed to take place at diffusion
controlled rates (Table 1).
Table 1. Oxidation potentials and DCA-fluorescence quenching rate constants of
tetrameric models 6EE and 7TE.
Substrate Oxidation Potentials
E1/2(+) (V vs Ag/AgCl)
DCA Fluorescence
Quenching rate
Constants
kq x 10-10
(M-1
s-1
)a
6EE 1.38 1.15
7TE 1.38 1.06
aDCA = 14.9 ns
Photochemical reactions of 6EE and 7TE using DCA as the electron acceptor were
performed on oxygenated 5% aqueous acetonitrile solutions. Inspection of the results
displayed in Scheme 7 and Table 2 shows that low conversion (18%) SET-photochemical
reaction of the -O-4 (top) -1 (bottom) tetramer 6EE takes place cleanly to form nearly
equal amounts of veratrylaldehyde (VAD) and aryloxyketone 27E. In a similar manner,

164
DCA sensitized, low conversion (32%) photoreaction of the -1 (top) -O-4 (bottom)
tetramer 7TE in the presence of O2 produces aldehyde 28E as the major product along
with minor amounts of VAD and the ketol 3 (Scheme 7 and Table 2).
Scheme 7.
Table 2. Products and yields of DCA-promoted photoreactions of tetrameric models 6EE
and 7TE.a

165
Substrate Percent Conversion
b
Product (Percent Yield)c
VAD 27E 3 28E
6EE 18 79 83 - -
7TE 32 16 - 6 59
aUranium glass filtered light irradiation (0.5 h) of O2 satd 5% aq. MeCN solutions
of DCA (0.27 mM) and substrate (0.22 mM of 6EE, 0.46 mM of 7TE). bBased on
recovered substrates determined by HPLC analysis. cDetermined by HPLC
analysis and based on amounts of substrates reacted.
Structural assignments to photoproducts 27E and 28E were made by comparing
their spectroscopic data to those of independently synthesized substances. The route
employed to prepare ketone 27E (Scheme 8) involves condensation of phenol 12E and
3,4-dimethoxyphenacyl bromide to form the aryloxyketone 30E. Removal of the
acetonide protecting group then furnishes photoproduct 27E. An authentic sample of the
aldehyde photoproduct 28E was produced by using a sequence starting with condensation
of vanillin with tosylate 23E to yield aldehyde 34E, followed by MOM-deprotection
(Scheme 9). Another possible product that could arise by cleavage of the -1 C-C bond in
tetrameric model 6EE (see below) is the benzylic alcohol 31E. This substance was
independently prepared (Scheme 8) in order to unambiguously rule out its presence by
inspection of the product mixture produced by DCA irradiation of 6EE. Likewise, the
aryloxyketone 32, a possible product of -O-4 C-C bond cleavage reaction of the initially
formed photoproduct 27E, produced by irradiation of 6EE, was prepared (Scheme 8) to
demonstrate that it does form in a secondary reaction. Finally, it is important to note that
careful 1H NMR and HPLC analysis of the crude mixtures arising by DCA promoted
photoreactions of 6EE and 7TE failed to reveal the presence of products other than those
displayed in Scheme 7.

166
Scheme 8.
Scheme 9.
Monitoring product distributions generated in the DCA-sensitized photoreactions of
6EE and 7TE as a function of irradiation time gives more detailed information about
preferences displayed in C-C bond cleavage processes (Figure 1). The time course of low
conversion (<10%) reaction of 6EE shows that C-C bond cleavage in the -1 subunit
takes place exclusively to form VAD and ketone 27E (Figure 1A). Thereafter, formation
of VAD increases continuously but production of 27E reaches a maximum at ca. 50%
conversion of tetramer 6EE. This observation suggests that both reactant 6EE and

167
fragment 27E undergo SET-induced photoreactions that generate VAD, as the only
detectable product in the latter case. Importantly, even though secondary SET reaction of
27E might have been expected to undergo -O-4 C-C bond cleavage, ketone 32 that
would have formed by such a pathway is not observed (see above).
Study of the time dependence of the product distributions in photoreaction of the
tetrameric model 7TE (Figure 1B) showed that at low conversion (<40%), 28E, VAD
and ketol 3 were formed in ratios that were invariant with time. At higher conversions,
the initially formed -1 C-C bond cleavage product 28E slowly disappears while the
amount of VAD gradually increases.
Figure 1. Plots of percentages of reactants remaining (6EE and 7TE ()) and products
formed (VAD () and 27E (), and VAD (), 3 () and 28E () in DCA-promoted
photoreactions of 6EE (A) and 7TE (B) in O2 saturated conditions as functions of
irradiation times.
0.0 0.5 1.0 1.5 2.0 2.5 3.0 3.5 4.0
0
20
40
60
80
100
% R
ea
cta
nt
an
d %
Pro
du
ct
Time (h)
(A)
0.0 0.5 1.0 1.5 2.0 2.5 3.0 3.5 4.0
0
20
40
60
80
100
% R
ea
cta
nt
an
d %
Pro
du
cts
Time (h)
(B)

168
A brief study was carried out to explore the reactivity of the ketone 27E, a product
of SET-induced cleavage of 6EE. Irradiation of a DCA and O2 saturated solution of this
substance in 5% aqueous MeCN with Uranium glass filtered light leads to clean
production of the acetophenone derivative 35 (10%) and 1,4-diketone 3625
(70%)
(Scheme 10). This process appears to be initiated by direct excitation of 27E, which
absorbs light, albeit weakly, in the wavelength region transmitted by the Uranium glass
filter, followed by documented25
-aryloxyketone homolytic cleavage. The –acyl
radical produced in this manner undergoes H-atom abstraction and coupling to form the
respective products 35 and 36.
Scheme 10.
The observation that VAD and ketol 3 are generated in the C-C bond cleavage
reaction of the -1 unit in 7TE is interesting since these substances would need to arise
via a radical intermediate produced in this process or through secondary reaction of the
initially formed diol 2, which we have observed earlier21
as a minor product in reactions
of related -1 model compounds. To explore the latter possibility, diol 2 was subjected to
the DCA-sensitized photochemical reaction conditions. As shown in Scheme 11, under
these conditions 2 is efficiently converted to VAD and ketol 3.
Enzymatic Reactions of Tetrameric Lignin Model Compounds. Low conversion,
lignin peroxidase catalyzed reactions of 6EE and 7TE initiated by H2O2 were performed

169
in tartrate buffer solutions (pH 3.4) containing 17% acetonitrile. HPLC analysis of the
product mixtures
Scheme 11.
provided the results listed in Table 3. As can be seen by viewing the data, the LP-
catalyzed reaction generate the same products in the same relative yields as those arising
from DCA-promoted photoreactions of 6EE and 7TE by way of selective C-C bond
cleavage in the -1 unit.
Table 3. LP-catalyzed reaction of tetramers 6EE and 7TE
Substrate
Percent
Conversiona.b
VAD
Products (Percent Yield)c
27E 28E 3
6EE
6EE
16
31
7
18
100
81
13
26
-
-
-
-
7TE
7TE
14
22
-
-
57
67
-
6 a
LP (8 M), 6EE and 7TE (0.2 mM), and H2O2 (1.2 mM) in 17% MeCN-
buffer solution (pH 3.4) were used. a Percent conversion based on recovered
substrate determined by HPLC analysis. cDetermined by HPLC and based on
amounts of substrates reacted.
Steady state kinetic constants for the LP catalyzed bond cleavage reactions of 6EE
and 7TE were determined. As can be seen by the results displayed in Figure 2A, 6EE and
7TE form complexes with LP, in which SET takes place to produce cation radicals that
undergo -1 bond breaking. Comparing the kcat values of the LP catalyzed reaction with

170
6EE and 7TE shows that both substances react at about the same rate a 2-fold rate
increase for the 6EE compound. However, regardless of the KM and kcat differences
between 6EE and 7TE, their catalytic efficiencies (kcat/KM) are approximately the same.
Furthermore, in agreement to previously reported results by other groups,22,26,27
the
catalytic efficiency is influenced by the size of the lignin model compounds. Specifically,
the tetrameric models have lower catalytic efficiencies than dimeric models as compared
to our previous studies.21
Figure 2. Plots of the (A) rate vs. tetrameric model concentrations in LP catalyzed
reactions of 6EE (■) and 7TE (▼), and (B) Lineweaver Burke plots of the reciprocals of
rates vs. reciprocals of concentration of 6EE (■) and 7TE (▼).
.
0 100 200 300 400 500
0.00
0.01
0.02
0.03
0.04
0.05
0.06
rate
[tetramer] (M)
(A)
0.000 0.004 0.008 0.012 0.016 0.020 0.024
15
20
25
30
35
40
45
1/r
ate
1/[tetramer] (M-1)
(B)

171
Table 4. Steady state kinetic constants of the LP-catalyzed reaction of tetramers 6EE and
7TE.a
Substrate kcat (s-1
) KM (M) kcat/KM (M-1
s-1
)
6EE 0.39±0.01 130 3.0 x 10³
7TE 0.30±0.01 80 3.8 x 10³
a 20-300 M substrates in 25% MeCN-tartrate buffer solution
(50 mM, pH 3.4, 25oC), 0.26 M of LP, 50 M H2O2 were
used.
Conclusions
As stated in the Introduction, one of the major hurdles that needs to be surmounted in
the conversion of plant materials to ethanol is related to the development of efficient and
low energy requiring pretreatment methods that facilitate access of cellulase enzymes to
cellulose that is encased in lignin networks in plant cell walls. An interesting approach to
this problem relies on the use of microbial or enzyme based lignin degradation processes.
It is known that wood rotting fungi (eg., the white rot fungus Phanerochaete
chrysosporum) secrete enzymes like LP that catalyze depolymerization of lignin3 through
SET-promoted C-C bond cleavage pathways. Being a complex heterogeneous polymer,
lignin is comprised of several major types of dimeric structural units containing
propanoid moieties with 1-aryl-2-aryloxy (-O-4), 1,2-diaryl (-1), benzofuran (-5) and
spirodienone structural frameworks (see below). It should be noted that the -5 unit is a
cyclized form of the -1 structure and that spirodienone units28
likely convert to -1
moieties under the highly acidic conditions present in LP containing secretions of wood
rotting the fungi.

172
Cation radicals arising by SET from alkoxyaryl sites in lignin to the oxidized form of
LP (termed LP I) are believed to undergo C-C bond cleavage to generate cation and
radical intermediates, the latter of which are further oxidized under aerobic conditions. It
is highly probable that the lignin cation radicals are comprised of a mixture of potentially
rapidly interconverting species that differ in the location of the arene ring delocalized
positively charged radical centers. As we have demonstrated in earlier studies20
with
more simple polydonor derived cation radicals, the sites at which bond cleavage reactions
take place more rapidly in systems of this type is governed by the rates of the processes
and not the relative populations of the interconverting species. An example taken from
this earlier effort that demonstrates this principle is found in the SET promoted
photochemical reaction of the thioether linked, -silymethansulfonamide terminated
phthalimide 37 (Scheme 12). In this system, SET from the two possible heteroatom donor
sites to the phthalimide excited state gives rise to two interconverting zwitterionic
biradicals 38 and 39, whose population is governed by differences in the oxidation
potentials of the thioether (ca. +1.4 V)29
and sulfonamide (ca. +2.5 V).30
As a result, 38 is
heavily favored at equilibrium. However, as product yield determinations show, the
exclusive reaction pathway followed involves -desilylation of 39 to form biradical 41,
which then undergoes cyclization to yield 40. Thus, the much larger rate of methanol

173
promoted -desilylation at the methansulfonamide cation radical site vs. -deprotonation
at the thioether cation radical site is the major factor controlling the nature of the SET
process.31
Scheme 12.
An example in which the rates of bond cleavage are important in governing product
profiles of reactions proceeding through the intermediacy of competitively formed cation
radicals that arise by SET from sites of differing oxidation potential, is found in studies
by Baciocchi and his coworkers.22
Specifically the major product produced in LP
promoted reaction of the tetrameric lignin model 42 (Scheme 13) is aldehyde 43, formed
by C-C bond cleavage at the monoalkoxy substituted -O-4 center, which in contrast to
the dialkoxy substituted unit, has a higher oxidation potential.
Scheme 13.

174
In the same manner, it is expected that preferences for C-C bond cleavage in reactions
of lignin cation radicals will be governed by reactivity rather than population factors. In
an earlier effort,21
we probed reactions of cation radicals of simple dimeric lignin model
compounds that possess either -1 or -O-4 structures that were generated by using
DCA-photosensitized, CAN and LP initiated SET processes. The results showed that -1
cation radicals undergo C-C bond cleavage at rates that far exceed those of their -O-4
counterparts. We also determined that these findings are consistent with the results of
DFT calculations, which indicate that the C1-C2 bond dissociation energies of -1 cation
radicals are significantly lower than those of similarly substituted -O-4 analogs.
The major aim of the current effort was to determine if the reactivity profiles
observed using dimeric models can be employed to predict the site(s) of C-C bond
cleavage in more complex lignin cation radicals. For this purpose, the tetrameric models
6EE and 7TE, which contain both -1 and -O-4 units, were prepared and subjected to
SET promoted reactions using DCA-photosensitization and LP catalysis. It is important
to note that 6EE and 7TE contain an array of alkoxy-substituted arene rings that should
have nearly the same oxidation potentials. As a result, cation radicals of these substances
are expected to exist as mixtures of interconverting, near equal energy positively charged
radical species (Scheme 14).

175
Scheme 14.

176
Reaction Mechanism. The photosensitized reactions are initiated by SET from 6EE
and 7TE to the singlet excited state of DCA, processes that take place at diffusion
controlled rates as judged by the results of fluorescence quenching studies summarized in
Table 1. Using 6EE as an example, SET forms a mixture of four interconverting radical
cations (44-47, Scheme 14) that differ in the arene ring where the odd electron and
positive charge are localized. Two of the four cation radicals, 46 and 47, are capable of
undergoing -1 type C-C bond cleavage to generate the cation radical pair 49+49, while
one (42) could undergo -O-4 type bond cleavage. That the former reaction pathway
dominates in the SET-photoreaction of 6EE is reflected in the exclusive formation of
VAD and -aryloxyketone 27E. VAD arises by deprotonation of cation 48 while 27E is
produced by reaction of radical 49 with oxygen followed by loss of water from the
resulting hydroperoxide 50. Importantly, the failure to detect substances that would have
been formed by -O-4 type C-C bond cleavage of cation radical 44 further evidences the
exclusive operation of -1 type cleavage in 6EE.
In a similar fashion, -1 C-C bond fragmentation in the cation radical arising from
7TE leads to formation of the radical cation pair 51+52 (Scheme 15). The major products
formed in this process are aldehyde 28E, coming from proton loss from cation 52, and
ketol 3, arising by oxygen capture of radical 51 followed by dehydration of the resulting
hydroperoxide. The production of VAD in this process is interesting since this substance
could arise by -O-4 type cleavage. However, another reasonable route exists for the
formation of VAD following -1 C-C bond cleavage of the 7TE cation radical. This
proposal is based on the results of unpublished studies with unsymmetrically substituted
dimeric -1 lignin model compounds (Scheme 16), which show that cation radical C-C

177
bond cleavage gives aldehydes that originate from both aryl moieties. This observation
suggests that the -hydroxy-hydroperoxides 54 formed by oxygen addition to the C2
radical fragment 53, are capable of undergoing retro-aldol type cleavage in competition
with dehydration to yield aldehyde products. Thus, radical 51, produced by cation radical
-1 bond fragmentation (Scheme 15) is likely one source of VAD in the DCA
photosenstitized reaction of 7TE.
Scheme 15.
Scheme 16.
LP Catalyzed Processes. The outcomes of LP catalyzed reactions of tetrameric
lignin models 6EE and 7TE are remarkably similar to those of the DCA-sensitized
processes, despite the fact that the reactions are carried out under quite different
conditions. For example, LP promoted reaction of 7TE, occurring in pH 3 aq. tartrate

178
buffer containing 15% MeCN, produces a ca. 1:2.4-4 ratio of VAD+3 and aldehyde 28E.
In contrast, a ca. 1:3 ratio of these products is generated in the DCA sensitized
photoreaction in 5% aq. MeCN. Furthermore, although differences exist in the relative
amounts of VAD and -aryloxyketone 27E formed in the photochemical (ca. 1:1) and LP
(ca. 3-8:1) reactions of 6EE, the reduced amount of 27E generated in the former process
is a likely consequence of its highly efficient photochemical reactivity (Scheme 10) and
uv-spectroscopic properties (max 278 and 310 nm with absorption extending to 330 nm)
that enable it to absorb light competitively with DCA under the photochemical reaction
conditions. Very closely related direct irradiation reactions of 3,4-dimethoxyphenacyl
phenol ethers have been observed to take place to generate the acetophenone derivative
35 and 1,4-diketone 36. However, it is possible that a DCA SET sensitized reaction of
27E is responsible for the formation of 35 and 36.
The chemical mechanism of the LP catalyzed C-C bond cleavage reactions of 6EE
and 7TE are the same as those for the DCA-sensitized processes. However, an interesting
difference exists in the way the reactive cation radical intermediates are produced. In the
photochemical process, SET occurs from the tertrameric substrates to the singlet excited
state of DCA in a diffusion governed manner. However, as the kinetic data displayed in
Figure 2 and Table 4 show, SET in the enzymatic reactions occurs in LP-substrate
complexes. The KM values for LP promoted reactions of 6EE (130 M) and 7TE (80
M) reflect reasonably tight binding of these substrates that resemble those for C-C bond
cleavage of simple dimeric lignin model compounds (50-250 M)21
and for oxidation of
the mono-arene ring containing substrate veratrylalcohol (72M).6 It should be noted
that, by using a resonant mirror biosensor system, it has been shown that a synthetic

179
lignin formed by polymerization of coniferyl alcohol binds reversibly to both LP and its
oxidized form LP I with respective dissociation constants of 330 and 350 M.12
The kcat
values for LP catalyzed cleavage of 6EE and 7TE fall in the range of 0.3-0.4 s-1
and are
approximately one order of magnitude smaller that those of simple -1 dimeric model
compounds (ca. 4-9 s-1
).21
Based on these observations, a plausible enzymatic mechanism for the -1 C-C bond
cleavage reactions involves SET in complexes of 6EE and 7TE with LPI. Since no
structures of LP or LP I complexed with substrates or substrate analogs have been
determined thus far, the exact manner in which the tetrameric models bind to LP I is not
known. However, it is reasonable to expect that only one of the four arene rings of these
substances is positioned close to the porphyrin--cation, which serves as the electron
acceptor in LP I. The results of x-ray crystallographic studies conducted by Poulos and
his coworkers32
suggest that the heme moiety in LP is buried in the protein skeleton but
modeling shows that the active site could accommodate the aromatic ring of
verytrylalcohol. In addition, kinetic studies33,34
have led to the conclusion that LP
oxidizes natural lignins through a long range SET pathway much in the same way that
cytochrome-c peroxidase oxidizes its substrates.35,36
In any event, SET from the
tetrameric models to LPI generates cation radicals that are initially localized in one arene
ring but that can undergo delocalization by intramolecular SET. Two of the four possible
cation radicals derived from either 6EE or 7TE (exemplified by 44 and 45 for 6EE in
Scheme 13) can participate in -1 C-C bond fragmentation, whereas one of the other two
(eg., 42 for 6EE) can only undergo less efficient -O-4 cleavage. Since C-C bond
cleavage in these cation radicals is expected to compete with back SET to regenerate LPI

180
and nonoxidized substrate, the fact that less- or un-reactive species comprise the mixture
of cation radicals arising from 6EE and 7TE could be one of the reasons why the kcat
values for LP promoted reactions of the tetrameric substrates are lower than those for
dimeric -1 models in which all cation radicals are reactive.
Summary. The results of this effort have provided interesting information about the
regioselectivities of C-C bond cleavage reactions of cation radical intermediates formed
by SET from tetrameric lignin model compounds that contain both -1 and -O-4
structural units. The findings could be relevant to LP catalyzed reactions of natural
lignins and, consequently, to the genetic design of plants that contain lignins that more
efficiently undergo microbial and/or enzymatic delignification.
Experimental
General. All reagents were obtained from commercial sources and used without
further purification and solvents were dried using standard procedures. 1H and
13C NMR
(500 MHz) spectra were recorded on CDCl3 solutions and the chemical shifts of
resonances are reported in parts per million relative to CHCl3 (7.24 ppm in 1H-NMR,
77.0 ppm in 13
C-NMR) serving as an internal standard. HRMS data were obtained by
using electrospray ionization or fast atom bombardment. Photochemical reactions were
conducted with an apparatus consisting of a 450 W Hanovia medium vapor pressure
mercury lamp surrounded by a uranium glass filter in water-cooled quartz immersion
well and quartz glass tubes containing solutions of substrates in merry-go-round
photoreactor. All products were isolated as oils unless otherwise specified and the purity
of each was determined to be >90% by 1H and
13C NMR analysis. Column
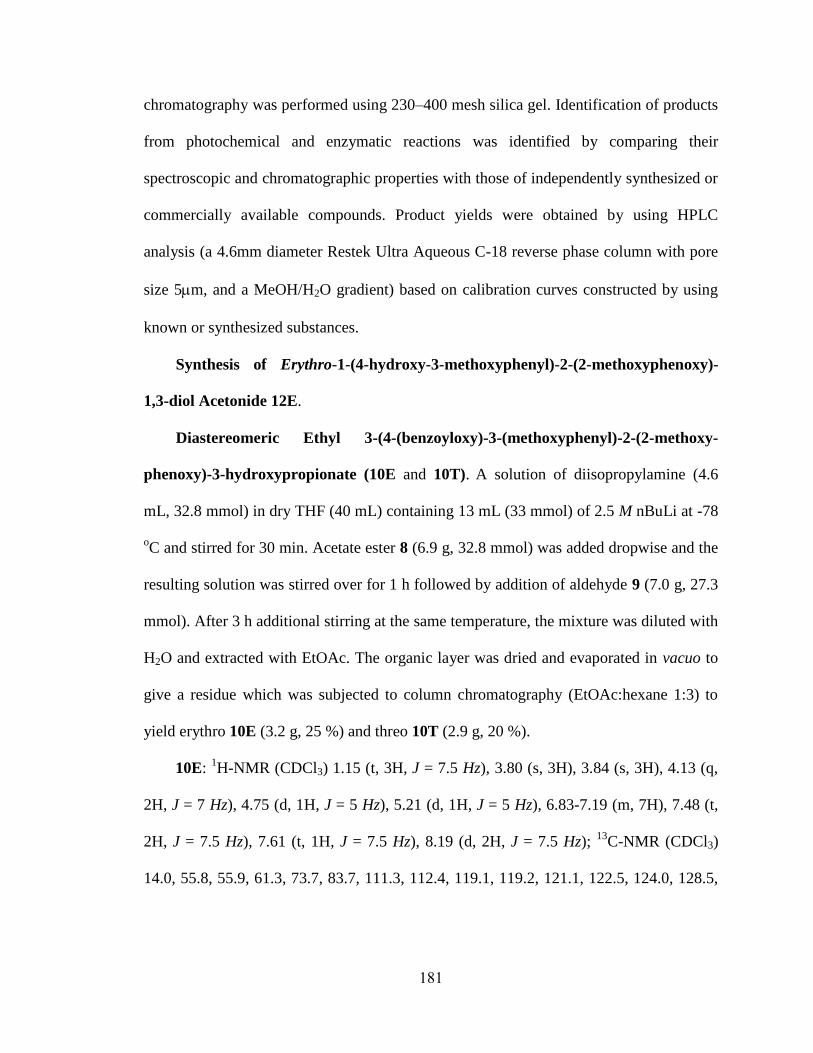
181
chromatography was performed using 230–400 mesh silica gel. Identification of products
from photochemical and enzymatic reactions was identified by comparing their
spectroscopic and chromatographic properties with those of independently synthesized or
commercially available compounds. Product yields were obtained by using HPLC
analysis (a 4.6mm diameter Restek Ultra Aqueous C-18 reverse phase column with pore
size 5m, and a MeOH/H2O gradient) based on calibration curves constructed by using
known or synthesized substances.
Synthesis of Erythro-1-(4-hydroxy-3-methoxyphenyl)-2-(2-methoxyphenoxy)-
1,3-diol Acetonide 12E.
Diastereomeric Ethyl 3-(4-(benzoyloxy)-3-(methoxyphenyl)-2-(2-methoxy-
phenoxy)-3-hydroxypropionate (10E and 10T). A solution of diisopropylamine (4.6
mL, 32.8 mmol) in dry THF (40 mL) containing 13 mL (33 mmol) of 2.5 M nBuLi at -78
oC and stirred for 30 min. Acetate ester 8 (6.9 g, 32.8 mmol) was added dropwise and the
resulting solution was stirred over for 1 h followed by addition of aldehyde 9 (7.0 g, 27.3
mmol). After 3 h additional stirring at the same temperature, the mixture was diluted with
H2O and extracted with EtOAc. The organic layer was dried and evaporated in vacuo to
give a residue which was subjected to column chromatography (EtOAc:hexane 1:3) to
yield erythro 10E (3.2 g, 25 %) and threo 10T (2.9 g, 20 %).
10E: 1H-NMR (CDCl3) 1.15 (t, 3H, J = 7.5 Hz), 3.80 (s, 3H), 3.84 (s, 3H), 4.13 (q,
2H, J = 7 Hz), 4.75 (d, 1H, J = 5 Hz), 5.21 (d, 1H, J = 5 Hz), 6.83-7.19 (m, 7H), 7.48 (t,
2H, J = 7.5 Hz), 7.61 (t, 1H, J = 7.5 Hz), 8.19 (d, 2H, J = 7.5 Hz); 13
C-NMR (CDCl3)
14.0, 55.8, 55.9, 61.3, 73.7, 83.7, 111.3, 112.4, 119.1, 119.2, 121.1, 122.5, 124.0, 128.5,

182
129.5, 130.3, 133.4, 138.1, 139.7, 147.1, 150.6, 151.1, 164.6, 169.2; HRMS (ES) m/z
489.1515 (M+Na, C26H26O8Na requires 489.1525).
10T: 1H-NMR (CDCl3) 1.11 (t, 3H, J = 7 Hz), 3.80 (s, 3H), 3.85 (s, 3H), 4.08 (q,
2H, J = 7 Hz), 4.51 (d, 1H, J = 6.5 Hz), 5.13 (d, 1H, J = 7 Hz), 6.84-7.13 (m, 7H), 7.48 (t,
2H, J = 8 Hz), 7.61 (t, 1H, J = 7.5 Hz), 8.19 (d, 2H, J = 8 Hz); 13
C-NMR (CDCl3) 13.8,
55.7, 55.9, 61.3, 74.7, 85.0, 111.2, 112.3, 118.3, 119.3, 121.0, 122.5, 123.9, 128.4, 129.3,
130.2, 133.3, 137.3, 139.9, 147.2, 150.3, 151.3, 164.5, 169.3; HRMS (ES) m/z 489.1522
(M+Na, C26H26O8Na requires 489.1525).
Erythro-1-(4-hydroxy-3-methoxyphenyl)-2-(2-methoxyphenoxy)-1,3-diol 11E.37
To solution of THF (50 mL) containing 1.0 M LiAlH4 (7.0 mL, 7.0 mmol) was added
10E (1.6 g, 3.4 mmol) at room temperature. After 3 h stirring, H2O (20 mL) and 1 N HCl
(20 mL) were added at 0 oC and the solution was extracted with CH2Cl2. The organic
extracts were dried and concentrated in vacuo to give a residue which was subjected to
column chromatography (EtOAc:hexane 1:1) to yield 11E (0.8 g, 73 %). 1H-NMR
(CDCl3) 3.64 and 3.89 (dd, 2H, J = 3.5 Hz, 12 Hz), 3.86 (s, 3H), 3.87 (s, 3H), 4.14 (m,
1H), 4.95 (d, 1H, J = 4.5 Hz), 5.58 (s, 1H), 6.80-7.06 (m, 7H).
Erythro-1-(4-hydroxy-3-methoxyphenyl)-2-(2-methoxyphenoxy)-1,3-diol
Acetonide 12E. A solution of 11E (4.7 g, 14.7 mmol) in CH2Cl2 (80 mL) containing
pyridinium p-toluenesulfonate (0.74 g, 3.0 mmol) and 2,2-dimethoxypropane (7.64 g,
73.4 mmol) was stirred at room temperature for 8 h and concentrated in vauco to give a
residue which was portioned between CH2Cl2 and sat NaHCO3. The organic layer was
dried and concentrated in vacuo to give a residue, which was subjected to column
chromatography (EtOAc:hexane 1:3) to yield 12E (3.76 g, 71 %). 1H-NMR (CDCl3)1.49

183
(s, 3H), 1.62 (s, 3H), 3.74 (s, 3H), 3.81 (s, 3H), 3.98-4.01 (m, 1H), 4.11-4.17 (m, 2H),
4.88 (d, 1H, J = 9 Hz), 5.55 (s, 1H), 6.48 (d, 1H, J = 8 Hz), 6.69 (t, 1H, J = 8 Hz), 6.77 (d,
1H, J = 8 Hz), 6.83-6.88 (m, 2H), 6.98 (s, 1H), 7.02 (d, 1H, J = 8 Hz); 13
C-NMR19.6,
28.5, 55.7, 55.8, 62.9, 74.6, 99.4, 109.9, 112.1, 114.0, 117.4, 120.5, 120.8, 122.7, 131.1,
145.4, 146.2, 147.1, 150.4; HRMS (ES) m/z 397.1630 (M+Na, C21H26O6Na requires
397.1627).
Synthesis of Erythro-2-(2-methoxyphenoxy)-3-(3,4-dimethoxyphenyl)-3-
methoxymethyloxy-1-tosyl propane 23E.
Ethyl Erythro-2-(2-methoxyphenoxy)-3-(3,4-dimethoxyphenyl)-3-
methoxymethyloxypropionate 19E. A solution of the 17E21
(0.64 g, 1.7 mmol) in THF
(40 mL) containing diisopropylethylamine (2.4 mL, 13.6 mmol) and methoxymethyl
ether (2.7 g, 34 mmol) was stirred at room temperature for 15 h and concentrated in
vauco to give a residue which was portioned between CH2Cl2 and H2O. The organic layer
was dried and concentrated in vacuo to give a residue, which was subjected to column
chromatography (EtOAc:hexane 1:3) to yield 19E (3.76 g, 71 %). 1H-NMR (CDCl3) 1.24
(t, 3H, J = 7 Hz), 3.31 (s, 3H), 3.71 (s, 3H), 3.85 (s, 3H), 3.86 (s, 3H), 4.22 (q, 2H, J = 7
Hz), 4.57 (s, 2H), 4.66 (d, 1H, J = 7.5 Hz), 5.03 (d, 1H, J = 7.5 Hz), 6.59 (d, 1H, J = 8
Hz), 6.72 (t, 1H, J = 7.5 Hz), 6.78-6.83 (m, 2H), 6.89 (t, 1H, J = 8 Hz), 7.00 (d, 1H, J = 8
Hz), 7.05 (s, 1H); 13
C-NMR (CDCl3) 14.2, 55.7, 55.8, 61.2, 82.4, 93.9, 110.5, 111.0,
112.5, 117.3, 120.7, 120.8, 123.1, 129.8, 147.3, 148.7, 149.0, 150.4, 170.0; HRMS (ES)
m/z 443.1689 (M+Na, C22H28O8Na requires 443.1682).
Ethyl Erythro-2-(2-methoxyphenoxy)-3-(3,4-dimethoxyphenyl)-3-
methoxymethyloxy-1-propanol 21E. To solution of THF (50 mL) containing 1.0 M

184
LiAlH4 (8.6 mL, 8.6 mmol) was added 19E (3.6 g, 8.6 mmol) at room temperature. After
3 h stirring, H2O (20 mL) and 1 N HCl (20 mL) were added at 0 oC and the solution was
extracted with CH2Cl2. The organic extracts were dried and concentrated in vacuo to give
a residue which was subjected to column chromatography (EtOAc:hexane 1:2) to yield
21E (2.1 g, 66 %). 1H-NMR (CDCl3) 3.39 (s, 3H), 3.80 (s, 3H), 3.80 (s, 3H), 3.82 (s,
3H), 3.82-3.94 (m, 2H), 4.10-4.13 (m, 1H), 4.59 (s, 2H), 4.88 (d, 1H, J = 7 Hz), 6.54 (d,
1H, J = 8 Hz), 6.75 (t, 1H, J = 7.5 Hz), 6.83 (d, 2H, J = 8 Hz), 6.93-6.96 (m, 3H); 13
C-
NMR (CDCl3) 55.7, 55.8, 55.9, 61.4, 76.3, 87.0, 94.1, 110.5, 110.8, 112.0, 120.4, 120.5,
121.3, 123.6, 131.2, 147.6, 148.7, 148.9, 151.1; HRMS (ES) m/z 401.1578 (M+Na,
C20H26O7Na requires 401.1576).
Erythro-2-(2-methoxyphenoxy)-3-(3,4-dimethoxyphenyl)-3-methoxymethyloxy-
1-tosyl-propane 23E. To solution of CH2Cl2 (70 mL) containing 21E (3.67 g, 9.7 mmol)
was added triethylamine (4.1 mL, 29.0 mmol) at 0 oC. After 1 h stirring, TsCl (2.8 g, 14.5
mmol) was added and the solution was stirred for 10 h at room temperature. The solution
was extracted with CH2Cl2 and sat. NaHCO3. The organic extracts were dried and
concentrated in vacuo to give a residue which was subjected to column chromatography
(EtOAc:hexane 1:2) to yield 23E (3.7 g, 72 %). 1H-NMR (CDCl3) 2.40 (s, 3H), 3.31 (s,
3H), 3.67 (s, 3H), 3.80 (s, 3H), 3.84 (s, 3H), 4.30-4.33 (m, 1H), 4.37-4.40 (m, 1H), 4.45-
4.48 (m, 1H), 4.52-4.56 (m, 2H), 4.84 (d, 1H, J = 6 Hz), 6.61 (d, 1H, J = 7 Hz), 6.70 (t,
1H, J = 7 Hz), 6.76 (d, 2H, J = 8 Hz), 6.84-6.90 (m, 3H), 7.24 (d, 2H, J = 8 Hz), 7.68 (d,
2H, J = 8 Hz); 13
C-NMR (CDCl3) 21.6, 55.6, 55.8, 55.8, 55.9, 68.5, 76.2, 81.3, 94.4,
110.6, 110.7, 112.3, 118.8, 120.5, 120.8, 123.1, 128.0, 129.7, 129.8, 132.8, 144.6, 147.1,
148.8, 150.7; HRMS (ES) m/z 555.1666 (M+Na, C27H32O9NaS requires 555.1665).

185
Synthesis of Erythro-2,3-(3,4-dimethoxyphenyl)-3-methoxymethyloxy-1-
tosylpropane 24E.
Ethyl Erythro-2,3-(dimethoxyphenyl)-3-methoxymethyloxypropionate 20E. A
solution of the 18E21
(2.5 g, 6.4 mmol) in THF (40 mL) containing
diisopropylethylamine (8.9 mL, 51.2 mmol) and methoxymethyl ether (10.3 g, 128.1
mmol) was stirred at room temperature for 15 h and concentrated in vauco to give a
residue which was portioned between CH2Cl2 and H2O. The organic layer was dried and
concentrated in vacuo to give a residue, which was subjected to column chromatography
(EtOAc:hexane 1:3) to yield 20E (2.0 g, 72 %). 1H-NMR (CDCl3) 1.26 (t, 3H, J = 7 Hz),
3.34 (s, 3H), 3.72 (s, 3H), 3.73 (s, 3H), 3.75 (s, 3H), 3.76 (s, 3H), 3.84-3.86 (m, 1H),
4.11-4.16 (m, 1H), 4.21-4.26 (m, 1H), 4.51 (s, 2H), 5.03 (d, 1H, J = 10.5 Hz), 6.54-6.61
(m, 5H), 6.67 (s, 1H); 13
C-NMR (CDCl3) 14.1, 55.7, 55.7, 55.9, 58.8, 60.9, 79.9, 94.0,
110.0, 110.3, 110.6, 111.5, 120.5, 121.2, 127.2, 130.6, 148.2, 148.4, 148.5, 148.6, 172.6;
HRMS (ES) m/z 457.1837 (M+Na, C23H30O8Na requires 457.1838).
Erythro-2,3-(dimethoxyphenyl)-3-methoxymethyloxy-1-propanol 22E. To
solution of THF (50 mL) containing 1.0 M LiAlH4 (4.9 mL, 4.9 mmol) was added 20E
(2.1 g, 4.8 mmol) at room temperature. After 3 h stirring, H2O (20 mL) and 1 N HCl (20
mL) were added at 0 oC and the solution was extracted with CH2Cl2. The organic extracts
were dried and concentrated in vacuo to give a residue which was subjected to column
chromatography (EtOAc:hexane 1:1) to yield 22E (1.05 g, 62 %). 1H-NMR (CDCl3)
3.04-3.07 (m, 1H), 3.43 (s, 3H), 3.71 (s, 3H), 3.74 (s, 3H), 3.78 (s, 3H), 3.79 (s, 3H),
3.91-3.96 (m, 1H), 4.15-4.19 (m, 1H), 4.49-4.53 (m, 2H), 4.78 (d, 1H, J = 10 Hz), 6.43 (s,
1H), 6.52-6.55 (m, 2H), 6.61-6.66 (m, 3H); 13
C-NMR (CDCl3) 54.5, 55.7, 55.8, 56.0,

186
66.0, 82.0, 93.8, 110.0, 110.3, 110.9, 111.8, 120.3, 120.5, 131.5, 131.8, 147.7, 148.4,
148.5, 148.6; HRMS (ES) m/z 415.1735 (M+Na, C21H28O7Na requires 415.1733).
Erythro 2,3-(3,4-dimethoxyphenyl)-3-methoxymethyloxy-1-tosylpropane 24E.
To solution of CH2Cl2 (60 mL) containing 22E (1.6 g, 4.1 mmol) was added
triethylamine (1.7 mL, 12.2 mmol) at 0 oC. After 1 h stirring, TsCl (1.2 g, 6.1 mmol) was
added and the solution was stirred for 10 h at room temperature. The solution was
extracted with CH2Cl2 and sat. NaHCO3. The organic extracts were dried and
concentrated in vacuo to give a residue which was subjected to column chromatography
(EtOAc:hexane 1:1) to yield 24E (1.5 g, 66 %). 1H-NMR (CDCl3) 2.34 (s, 3H), 3.17-3.21
(m, 1H), 3.29 (s, 3H), 3.64 (s, 3H), 3.70 (s, 3H), 3.78 (s, 6H), 4.41-4.51 (m, 2H), 4.46 (s,
2H), 4.68 (d, 1H, J = 8.5 Hz), 6.33 (s, 1H), 6.39 (d, 1H, J = 7.5 Hz), 6.51-6.62 (m, 4H),
7.21 (d, 2H, J = 8 Hz), 7.57 (d, 2H, J = 8 Hz); 13
C-NMR (CDCl3) 21.6, 51.2, 55.6, 55.7,
56.0, 70.7, 78.1, 94.0, 110.1, 110.3, 110.5, 111.7, 120.3, 121.2, 127.8, 129.6, 129.8,
131.0, 132.8, 144.5, 147.8, 148.3, 148.4, 148.5; HRMS (ES) m/z 569.1808 (M+Na,
C28H34O9NaS requires 569.1821).
Synthesis of tetrameric model -O-4 (top)--1 (bottom) 6EE.
Tetrameric model -O-4 actonide (top)--1 MOM (bottom) 25EE. To solution of
CH3CN (60 mL) containing 12E (3.9 g, 10.8 mmol) was added NaH (60 % in mineral
oil) (450 mg, 11.3 mmol) at room temperature. After 1 h stirring at 80 oC, 24E (3.94 g,
7.2 mmol) was added and the solution was stirred for 24 h at the same temperature. The
solution was concentrated following extraction with CH2Cl2 and H2O. The organic
extracts were dried and concentrated in vacuo to give a residue which was subjected to
column chromatography (EtOAc:hexane 1:1) to yield diastereomeric mixture 25EE (2.54

187
g, 48 %). (diastereomeric mixture): 1H-NMR (CDCl3)1.49 (s, 3H), 1.62 (s, 3H), 3.22 (s,
3H), 3.32-3.36 (m, 1H), 3.66 (s, 3H), 3.72 (s, 6H), 3.74 (s, 3H), 3.76 (s, 3H), 3.78 (s, 3H),
3.98-4.01 (m, 1H), 4.08-4.17 (m, 2H), 4.23-4.25 (m, 1H), 4.46-4.50 (m, 1H), 4.50 (s,
2H), 4.88 (d, 1H, J = 8.5 Hz), 4.98-5.01 (m, 1H), 6.45 (d, 1H, J = 8 Hz), 6.51 (d, 1H, J =
8 Hz), 6.55 (s, 1H), 6.59-6.66 (m, 4H), 6.75-6.85 (m, 4H), 7.00 (s, 2H); 13
C-NMR
(CDCl3)19.6, 28.5, 51.5, 55.6, 55.9, 62.8, 69.3, 74.5, 77.1, 78.1, 94.1, 99.4, 110.2, 110.4,
111.4, 112.0, 112.6, 113.1, 117.3, 117.4, 119.8, 119.9, 120.3, 121.4, 122.6, 131.7, 132.0,
147.0, 147.5, 148.1, 148.3, 149.4, 150.3; HRMS (ES) m/z 757.3195 (M+Na,
C41H50O12Na requires 757.3200).
Tetrameric model -1 (top)--O-4 (bottom) 6EE. To solution of THF (60 mL)
containing 25EE (1.2 g, 1.63 mmol) was added 3N HCl (20 mL) at room temperature and
the solution was stirred for 12 h at the room temperature. The solution was concentrated
following extraction with CH2Cl2 and 1N HCl. The organic extracts were dried and
concentrated in vacuo to give a residue which was subjected to column chromatography
(EtOAc:hexane 2:1) to yield diastereomeric mixture 6EE (230 mg, 22 %).
(diastereomeric mixture): 1H-NMR (CDCl3)3.32-3.36 (m, 1H), 3.69 (s, 3H), 3.72 (s,
3H), 3.77 (s, 3H), 3.78 (s, 3H), 3.85 (s, 6H), 3.85-3.91 (m, 1H), 4.11-4.17 (m, 2H), 4.28-
4.31 (m, 1H), 4.41-4.43 (m, 1H), 4.94-4.97 (m, 1H), 5.18 (d, 1H, J = 5 Hz), 6.61-7.05 (m,
13H); 13
C-NMR (CDCl3) 52.3, 55.6, 557, 55.8, 55.9, 60.6, 72.6, 77.5, 87.2, 109.5, 109.7,
110.4, 110.8, 112.1, 112.2, 114.1, 118.4, 119.1, 120.8, 121.6, 124.2, 131.7, 133.9, 135.1,
146.7, 147.8, 148.0, 148.1, 148.4, 148.4, 149.7, 151.5; HRMS (ES) m/z 673.2632
(M+Na, C36H42O11Na requires 673.2625).
Synthesis of tetrameric model -1 (top)--O-4 (bottom) 7TE.

188
Tetrameric model -1 acetonide (top)--O-4 MOM (bottom) 26TE. To solution
of CH3CN (60 mL) containing 16T (1.34 g, 3.6 mmol) was added NaH (60 % in mineral
oil) (143 mg, 3.6 mmol) at room temperature. After 1 h stirring at 80 oC, 23E (1.6 g, 3.0
mmol) was added and the solution was stirred for 24 h at the same temperature. The
solution was concentrated following extraction with CH2Cl2 and H2O. The organic
extracts were dried and concentrated in vacuo to give a residue which was subjected to
column chromatography (EtOAc:hexane 1:1) to yield diastereomeric mixture 26TE (1.2
g, 55 %). (diastereomeric mixture): 1H-NMR (CDCl3)1.62 (s, 3H), 1.64 (s, 3H), 3.30 (s,
3H), 3.49 and 3.51 (s, 3H), 3.65 and 3.66 (s, 3H), 3.75 (s, 6H), 3.77 and 3.78 (s, 3H), 3.83
(s, 3H), 3.75-3.78 (m, 1H), 4.08 (d, 1H, J = 7 Hz), 4.10-4.15 (m, 1H), 4.18-4.22 (m, 1H),
4.50-4.53 (m, 1H), 4.57-4.64 (m, 2H), 4.71-4.75 (m, 1H), 5.02 (d, 1H, J = 5 Hz), 5.28 (d,
1H, J = 3 Hz), 6.37 (d, 1H, J = 16.5 Hz), 6.50-6.61 (m, 4H), 6.76-6.78 (m, 3H), 6.86-6.98
(m, 4H), 7.10 (s, 1H); 13
C-NMR (CDCl3)55.6, 55.8, 65.4, 67.9, 73.6,
82.0, 94.4, 99.3, 110.0, 110.4, 110.9, 112.1, 112.8, 112.9, 113.2, 118.2, 118.2, 120.5,
120.6, 120.7, 122.0, 122.3, 130.2, 130.3, 132.5, 133.5, 147.2, 147.3, 147.9, 147.9, 148.5,
148.6, 149.0, 150.6; HRMS (ES) m/z 757.3190 (M+Na, C41H50O12Na requires 757.3200).
Tetrameric model -1 (top)--O-4 (bottom) 7TE. To solution of THF (60 mL)
containing 26TE (0.24 g, 0.33 mmol) was added 3N HCl (10 mL) at room temperature
and the solution was stirred for 12 h at the room temperature. The solution was
concentrated following extraction with CH2Cl2 and 1N HCl. The organic extracts were
dried and concentrated in vacuo to give a residue which was subjected to column
chromatography (EtOAc:hexane 2:1) to yield diastereomeric mixture 7TE (43 mg, 21
%). (diastereomeric mixture): 1H-NMR (CDCl3)3.00-3.05 (m, 1H), 3.70 (s, 3H), 3.78, (s,
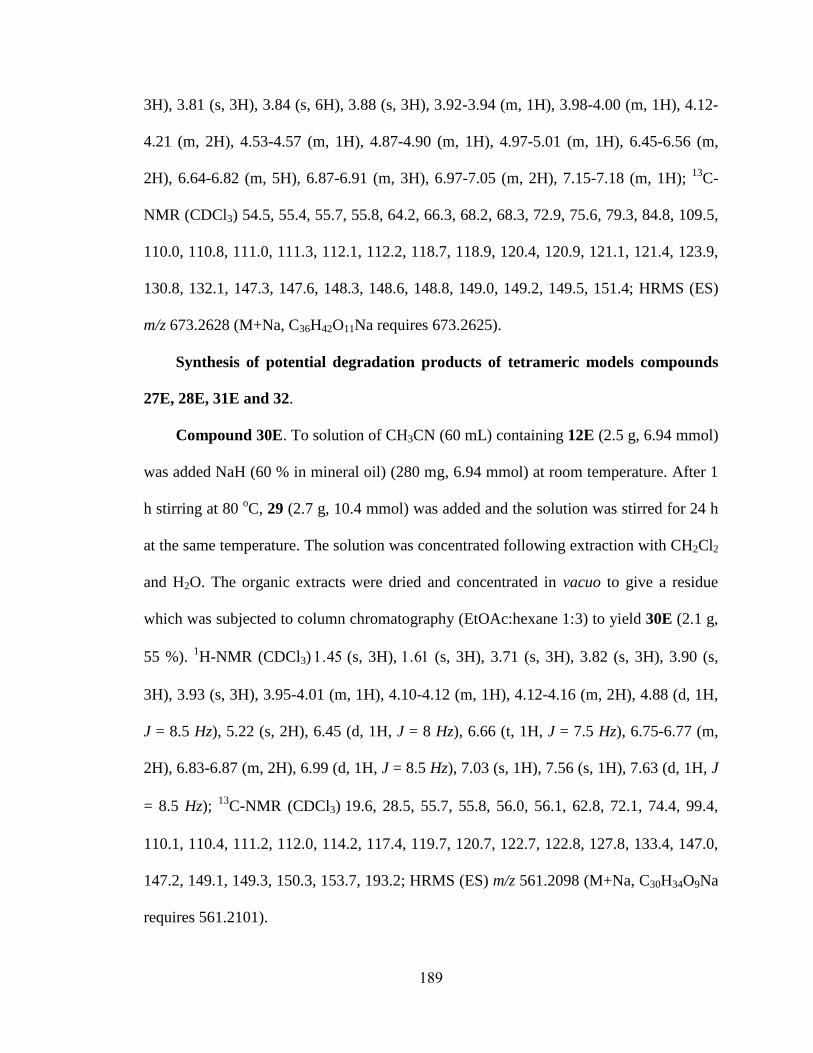
189
3H), 3.81 (s, 3H), 3.84 (s, 6H), 3.88 (s, 3H), 3.92-3.94 (m, 1H), 3.98-4.00 (m, 1H), 4.12-
4.21 (m, 2H), 4.53-4.57 (m, 1H), 4.87-4.90 (m, 1H), 4.97-5.01 (m, 1H), 6.45-6.56 (m,
2H), 6.64-6.82 (m, 5H), 6.87-6.91 (m, 3H), 6.97-7.05 (m, 2H), 7.15-7.18 (m, 1H); 13
C-
NMR (CDCl3) 54.5, 55.4, 55.7, 55.8, 64.2, 66.3, 68.2, 68.3, 72.9, 75.6, 79.3, 84.8, 109.5,
110.0, 110.8, 111.0, 111.3, 112.1, 112.2, 118.7, 118.9, 120.4, 120.9, 121.1, 121.4, 123.9,
130.8, 132.1, 147.3, 147.6, 148.3, 148.6, 148.8, 149.0, 149.2, 149.5, 151.4; HRMS (ES)
m/z 673.2628 (M+Na, C36H42O11Na requires 673.2625).
Synthesis of potential degradation products of tetrameric models compounds
27E, 28E, 31E and 32.
Compound 30E. To solution of CH3CN (60 mL) containing 12E (2.5 g, 6.94 mmol)
was added NaH (60 % in mineral oil) (280 mg, 6.94 mmol) at room temperature. After 1
h stirring at 80 oC, 29 (2.7 g, 10.4 mmol) was added and the solution was stirred for 24 h
at the same temperature. The solution was concentrated following extraction with CH2Cl2
and H2O. The organic extracts were dried and concentrated in vacuo to give a residue
which was subjected to column chromatography (EtOAc:hexane 1:3) to yield 30E (2.1 g,
55 %). 1H-NMR (CDCl3)(s, 3H), (s, 3H), 3.71 (s, 3H), 3.82 (s, 3H), 3.90 (s,
3H), 3.93 (s, 3H), 3.95-4.01 (m, 1H), 4.10-4.12 (m, 1H), 4.12-4.16 (m, 2H), 4.88 (d, 1H,
J = 8.5 Hz), 5.22 (s, 2H), 6.45 (d, 1H, J = 8 Hz), 6.66 (t, 1H, J = 7.5 Hz), 6.75-6.77 (m,
2H), 6.83-6.87 (m, 2H), 6.99 (d, 1H, J = 8.5 Hz), 7.03 (s, 1H), 7.56 (s, 1H), 7.63 (d, 1H, J
= 8.5 Hz); 13
C-NMR (CDCl3)19.6, 28.5, 55.7, 55.8, 56.0, 56.1, 62.8, 72.1, 74.4, 99.4,
110.1, 110.4, 111.2, 112.0, 114.2, 117.4, 119.7, 120.7, 122.7, 122.8, 127.8, 133.4, 147.0,
147.2, 149.1, 149.3, 150.3, 153.7, 193.2; HRMS (ES) m/z 561.2098 (M+Na, C30H34O9Na
requires 561.2101).

190
Compound 27E. A solution of 30E (0.54 g, 1.0 mmol) in acetone:H2O (v/v 3:2) 30
mL containing pyridinium p-toluenesulfonate (0.76 g, 3.0 mmol) was stirred at 80 oC for
10 h and concentrated in vauco to give a residue which was portioned between EtOAc
and sat. NaHCO3. The organic layer was dried and concentrated in vacuo to give a
residue, which was subjected to column chromatography (EtOAc:hexane 1:1) to yield
27E (0.38 g, 77 %). 1H-NMR (CDCl3)(d, 1H, J = 12 Hz), 3.86 (s, 3H), 3.86-3.88
(m, 1H), 3.91 (s, 3H), 3.93 (s, 3H), 4.10-4.14 (m, 1H), 4.95 (d, 1H, J = 4 Hz), 5.26 (s,
2H), 6.76-6.81 (m, 2H), 6.87-6.94 (m, 4H), 6.98 (s, 1H), 7.03-7.06 (m, 1H), 7.56(s, 1H),
7.64 (d, 1H, J = 8.5 Hz); 13
C-NMR (CDCl3)55.9, 56.0, 56.1, 60.7, 72.0, 72.6, 87.4,
109.9, 110.1, 110.3, 112.1, 114.3, 118.3, 121.2, 121.6, 122.7, 124.3, 127.7, 133.9, 146.8,
146.9, 149.2, 149.7, 151.6, 153.8, 193.1; HRMS (ES) m/z 521.1799 (M+Na, C27H30O9Na
requires 521.1788).
Compound 33E. To solution of 50 mL THF containing 1.0 M LiAlH4 (4.0 mL, 4.0
mmol) were added 30E (2.0 g, 3.7 mmol) at room temperature. After stirring for 3 h, 20
mL H2O and 20 mL 1 N HCl solution at 0 oC were added and the solutions were extracted
with CH2Cl2. The extracts were dried and concentrated in vacuo to afford a residue which
was subjected to column chromatography (EtOAc:hexane 1:2) to yield 33E (1.52 g, 76
%). 1H-NMR (CDCl3)(s, 3H), (s, 3H), 3.74 (s, 3H), 3.82 (s, 3H), 3.85 (s, 3H),
3.87 (s, 3H), 3.88-3.93 (m, 1H), 4.00-4.02 (m, 1H), 4.08-4.10 (m, 1H), 4.11-4.18 (m, 2H),
4.91 (d, 1H, J = 9 Hz), 4.98 (d, 1H, J = 7.5 Hz), 6.47 (d, 1H, J = 6.5 Hz), 6.69 (t, 1H, J =
7.5 Hz), 6.77 (d, 1H, J = 8.5 Hz), 6.82-6.90 (m, 4H), 6.96 (s, 1H), 7.04-7.06 (m, 2H); 13
C-
NMR (CDCl3)19.6, 25.6, 28.5, 55.7, 55.8, 55.8, 55.9, 62.8, 68.0, 71.9, 74.4, 76.6, 99.5,
109.3, 110.9, 111.1, 111.2, 112.1, 115.8, 115.9, 117.3, 118.5, 119.9, 120.0, 120.7, 122.7,

191
132.0, 133.7, 147.0, 147.6, 147.6, 148.7, 149.0, 149.8, 150.3; HRMS (ES) m/z 563.2262
(M+Na, C30H36O9Na requires 563.2257).
Compound 31E. A solution of 33E (1.54 g, 2.85 mmol) in acetone:H2O (v/v 3:2)
80 mL containing pyridinium p-toluenesulfonate (2.15 g, 8.6 mmol) was stirred at 80 oC
for 24 h and concentrated in vauco to give a residue which was portioned between EtOAc
and sat. NaHCO3. The organic layer was dried and concentrated in vacuo to give a
residue, which was subjected to column chromatography (EtOAc:hexane 1:1) to yield
31E (1.15 g, 81 %). 1H-NMR (CDCl3)(dd, 1H, J = 3 Hz, 12.5 Hz), 3.84 (s, 3H),
3.85 (s, 3H), 3.86 (s, 3H), 3.87 (s, 3H), 3.89-3.91 (m, 1H), (dd, 1H, J = 4 Hz, 10 Hz),
4.09-4.14 (m, 2H), 4.96 (d, 1H, J = 5 Hz), 5.02 (d, 1H, J = 9.5 Hz), 6.82-7.06 (m, 10H);
13C-NMR (CDCl3)55.8, 55.9, 60.6, 72.0, 72.5, 76.2, 87.3, 109.3, 109.7, 111.0, 112.1,
115.3, 118.6, 121.0, 121.6, 124.3, 132.1, 134.1, 146.7, 147.3, 148.7, 149.0, 149.9, 151.6;
HRMS (ES) m/z 523.1942 (M+Na, C27H32O9Na requires 523.1944).
Compound 34E. To solution of CH3CN (50 mL) containing vanillin (0.4 g, 2.6
mmol) was added NaH (60 % in mineral oil) (105 mg, 2.6 mmol) at room temperature.
After 1 h stirring at 80 oC, 23E (0.93 g, 1.75 mmol) was added and the solution was
stirred for 24 h at the same temperature. The solution was concentrated following
extraction with CH2Cl2 and H2O. The organic extracts were dried and concentrated in
vacuo to give a residue which was subjected to column chromatography (EtOAc:hexane
1:3) to yield 34E (680 mg, 76 %). 1H-NMR (CDCl3)3.34 (s, 3H), 3.68 (s, 3H), 3.79 (s,
3H), 3.83 (s, 3H), 3.85 (s, 3H), 4.34-4.37 (m, 1H), 4.42-4.45 (m, 1H), 4.65 (dd, 2H, J = 7
Hz, 26.3 Hz), 4.75-4.78 (m, 1H), 5.08 (d, 1H, J = 5 Hz), 6.80 (d, 3H, J = 8 Hz), 6.89-6.96
(m, 5H), 7.35-7.37 (m, 2H); 13
C-NMR (CDCl3)55.6, 55.7, 55.8, 68.0, 82.4, 94.6, 109.2,

192
110.6, 111.8, 112.1, 118.8, 120.3, 120.8, 122.8, 126.6, 130.1, 130.2, 147.8, 148.7, 148.8,
150.0, 150.8, 153.9190.9; HRMS (ES) m/z 535.1935 (M+Na, C28H32O9Na requires
535.1944).
Compound 28E. To solution of THF (60 mL) containing 34E (0.64 g, 1.2 mmol)
was added 3N HCl (10 mL) at room temperature and the solution was stirred for 12 h at
the room temperature. The solution was concentrated following extraction with CH2Cl2
and 1N HCl. The organic extracts were dried and concentrated in vacuo to give a residue
which was subjected to column chromatography (EtOAc:hexane 2:1) to yield
diastereomeric mixture 28E (240 mg, 43 %). 1H-NMR (CDCl3)3.79 (s, 3H), 3.84 (s, 3H),
3.86 (s, 3H), 3.87 (s, 3H), 4.11-4.14 (m, 1H), 4.30-4.33 (m, 1H), 4.61-4.64 (m, 1H), 5.02
(d , 1H, J = 3.5 Hz), 6.79-6.83 (m, 2H), 6.88-6.94 (m, 4H), 6.98 (s, 1H), 7.03-7.07 (m,
1H), 7.21-7.23 (m, 1H), 7.34-7.38 (m, 1H), 9.82 (s, 1H); 13
C-NMR (CDCl3)29.7, 55.7,
55.8, 55.8, 55.9, 67.8, 72.5, 84.9, 109.2, 109.3, 110.9, 111.8, 112.1, 118.5, 121.2, 121.5,
124.2, 126.6, 130.3, 131.7, 147.1, 148.4, 148.9, 149.9, 151.5, 153.6, 190.9; HRMS (ES)
m/z 491.1684 (M+Na, C26H28O8Na requires 491.1682).
Compound 32.38
To solution of CH3CN (50 mL) containing vanillin (2.2 g, 14.5
mmol) was added NaH (60 % in mineral oil) (580 mg, 14.5 mmol) at room temperature.
After 1 h stirring at 80 oC, 29 (2.5 g, 9.6 mmol) was added and the solution was stirred
for 24 h at the same temperature. The solution was concentrated following extraction
with CH2Cl2 and H2O. The organic extracts were dried and concentrated in vacuo to give
a residue which was subjected to column chromatography (EtOAc:hexane 1:3) to yield
32 (2.2 g, 70 %). 1H-NMR (CDCl3)3.92 (s, 3H), 3.95 (s, 6H), 5.42 (s, 2H), 6.83 (d, 1H, J
= 8.5 Hz), 6.90 (d, 1H, J = 8 Hz), 7.36 (d, 1H, J = 8 Hz), 7.43 (s, 1H), 7.63 (s, 1H), 7.63

193
(d, 1H, J = 8.5 Hz), 9.82 (s, 1H); 13
C-NMR (CDCl3)56.0, 56.0, 56.1, 71.1, 109.7, 110.1,
110.2, 112.4, 122.6, 126.3, 127.3, 130.8, 149.3, 149.9, 152.8, 154.1, 190.8, 191.8; HRMS
(ES) m/z 353.0996 (M+Na, C18H18O6Na requires 353.1001).
Photoreaction of 27E. A DCA saturated, O2 purged solution of 27E (150 mg, 0.3
mmol) in 150 mL of 5% aqueous MeCN was irradiated by using Uranium glass filtered
light for 6 h (50% conversion). Concentration of the photolysate gave a residue, which
was subjected to silica gel chromatography (1:3 EtOAc-hexane) to yield 35 (3 mg, 10%)
and 3625,39
(38 mg, 70%).
DCA Fluorescence quenching by tetrameric lignin models 6EE and 7TE.
Fluorescence spectra were recorded on 2 mL of MeCN solutions of DCA (5.4 x 10⁻⁶
M)
each containing 0, 0.25, 0.5, 1.0, 2.0 mM of the respective tetrameric lignin model
compounds. The excitation wavelength was 400 nm.
DCA-promoted photoreactions of tetrameric lignin models 6EE and 7TE.
Independent DCA saturated, O2 purged solutions containing each tetrameric lignin model
compounds (0.22 mM of , 0.46 mM of ) in 4 mL of 5 % aqueous MeCN in
quartz tubes were simultaneously irradiated by using uranium filtered light in a merry-go-
round apparatus for time periods of 0.5, 1, 1.5, 2, 3, 4 and 5 h. Each photolysate was
subjected to HPLC analysis, giving the yields reported in Table 2 and Figure 1.
Lignin peroxidase (LP) catalyzed reactions of tetrameric lignin models 6EE
and 7TE. To 200 L of 50 mM tartrate buffer (pH 3.4) were added 200 L of tetrameric
lignin models (0.5 mM dissolved in 17% MeCN-tartrate buffer, final concentration 0.2
mM) and 40 L of lignin peroxidase (100.5 M, final concentration 8 M, 17.2 units per
mL). After 60 L of H2O2 (10 mM, final concentration 1.2 mM) was added, the solutions

194
were agitated for 30 min and then subjected to HPLC analysis to give the results included
in Table 3 and Figure 2.
Determination of steady state kinetic constants of LP Reactions of tetrameric
model compounds 6EE and 7TE. LP reactions were carried out by monitoring the
formation of bond cleavage products at 310 nm. Reactions were performed in 50 mM
tartate buffer (pH 3.4 at 25 oC) with fixed concentrations of LP (0.26 M of 17.2 units
per mL) and varying concentrations of 6EE and 7TE dissolved in 25 % MeCN-buffer
solution, and initiated by the addition of a fixed concentration of H2O2 (50 µM). For all
measurements, the initial velocity data, measured as a function of substrate concentration,
were analyzed using following equations: V = V max [S]/([S]+KM), where V is initial
velocity, V max is maximum velocity, [S] is substrate concentration, and KM is the
Michaelis constant. The kcat was calculated from Vmax/[E] where [E] is the total enzyme
concentration.
Acknowledgement
This research was supported financially in part by a subcontract to DDM from a U.S.
Department of Energy grant to Paul Langan (20080001DR) through the LANL/LDRD
program and a National Research Foundation of Korea Grant (2009-0072585) to UCY.
Also, we are grateful to David Fox for generously providing the lignin peroxidase used in
this effort.
Supporting Information

195
Contained in this are 1H and 13C NMR spectra of all previously unidentified
compounds, and fluorescence quenching plots. This material is available free of charge
via the Internet at http://pubs.acs.org/.
References
1. Adler, E. Wood Sci. Technol. 1977, 11, 169-218.
2. Sarkanen, K. V. Lignins: Occurrence, Formation, Structure and Reactions:
Sarkanen, K. V., Ludwig, C. H., Eds.; Wiley-Interscience: New York, 1971; p 95-
495.
3. Hammel, K. E.; Jensen, K. A.; Mozuch, M. D.; Landucci, L. L.; Tien, M.; Pease, E.
A. J. Biol. Chem., 1993, 268, 12274.
4. Tien, M.; Kirk, T. K. Science 1983, 221, 661.
5. Harvey, P. J.; Schoemaker, H. E.; Bowen, R. M.; Palmer, J. M. FEBS Lett. 1985,
183, 13.
6. Tien, M.; Kirk, T. K.; Bull, C.; Fee, J. A. J. Biol. Chem. 1986, 261, 1687.
7. Schmidt, H. W.; Haemmerli, S. D.; Schoemaker, H. E.; Leisolar, M. S.
Biochemistry. 1989, 28, 1776.
8. Hammel, K. E.; Kalyanaraman, B.; Kirk, T. K. Proc. Natl. Acad. Sci. U.S.A. 1986,
83, 3708.
9. Glenn, J. K.; Morgan, M. A.; Mayfield, M. B.; Kuwahara, M.; Gold, M. H. Biochem.
Biophys. Res. Commun. 1983, 114. 1077.
10. Umezawa, T.; Higuchi, T. FEBS Lett. 1987, 218, 255.
196
11. Kawai, S.; Shoji, S. I.; Nabeta, K.; Okuyama, H.; Higuchi, T. Mokuzai Gakkaishi
1990, 36, 126.
12. Johjima, T.; Itoh, N.; Kabuto, M.; Tokimura, F.; Nakagawa, T.; Wariishi, H.;
Tanaka, H. Proc. Natl. Acad. Sci. U.S.A. 1999, 96, 1989.
13. Have, R. T.; Teunissen, P. J. M. Chem. Rev. 2001, 101, 3397.
14. de Wild, P.; Van der Laan, R.; Kloekhorst, A.; Heeres, E. Environ. Prog.
Sustainable energy. 2009, 28, 461.
15. Dabo, P.; Cyr, A.; Lessard, J.; Brossard, L.; Menard, H. Can. J. Chem. 1999, 77,
1225.
16. Hu, W. J.; Kawaoka, A.; Tsai, C. J.; Lung, J.; Osakabe, K.; Ebinuma, H.; Chiang, V.
L. Proc. Natl. Acad. Sci. U.S.A. 1998, 95, 5407.
17. Ralph, J.; MacKay, J. J.; Hatfield, R. D.; O’Malley, D. M.; Whetten, R. W. Science.
1997, 277, 235.
18. Ralph, J.; Kim, H.; Peng, J.; Lu, F. Org. Lett. 1999, 1, 323.
19. Tsai, C. J.; Podila, G. K.; Chiang, V. L. Plant Cell Rep. 1994, 14, 94.
20. Yoon, U. C.; Kwon, H. C.; Hyung, T. G.; Choi, K. H.; Oh, S. W.; Yang, S.; Zhao,
Z.; Mariano, P. S. J. Am. Chem. Soc. 2004, 126, 1110.
21. Cho, D. W.; Parthasarathi, R.; Pimentel, A. S.; Maestas, G. D.; Park, H. J.; Yoon, U.
C.; Dunaway-Mariano, D.; Gnanakaran, S.; Langan, P.; Mariano, P. S. J. Org.
Chem. 2010, 75, 6549.
22. Baciocchi, E.; Fabbri, C.; Lanzalunga, O. J. Org. Chem. 2003, 68, 9061.
23. Langer, V.; Lundquist, K. Acta Crystallogr. Sect. E.-Struct Rep. Online, 2002,
E58(4), 433.

197
24. Stomberg, R.; Lundquist, K. Nord. Pulp Paper Res. J. 1994, 9(1), 37.
25. Castellan, A.; Zhu, J. H.; Colombo, N.; Nourmamode, A.; Davidson, R. S.; Dunn, L.
J. Photochem. Photobiol. A: Chem. 1991, 58, 263.
26. Ciofi-Baffoni, S.; Banci, L.; Brandi, A. J. Chem. Soc., Perkin Trans. 1. 1998, 1,
3207.
27. Banci, L.; Ciofi-Baffoni, S.; Tien, M. Biochemistry. 1999, 38, 3205.
28. Setala, H.; Pajunen, A.; Rummakko, P.; Brunow, G. J. Chem. Soc., Perkin Trans. 1,
1999, 461.
29. Cottrell, P. T.; Mann, C. K. J. Electrochem. Soc., 1969, 116, 1499.
30. Yoon, U. C.; Kim, J. W.; Ryu, J. Y.; Cho, S. J.; Oh, S. W. J. Photochem. Photobiol.
A, 1997, 106, 145.
31. Su, Z.; Mariano, P. S.; Falvey, D. E.; Yoon, U. C.; Oh, S. W. J. Am. Chem. Soc.
1998, 120, 10676.
32. Poulos, T. L.; Edwards, S. L.; Warishi, H.; Gold, M. H. J. Biol. Chem., 1993, 268,
4429.
33. Shoemaker, H. E.; Lundell, T. K.; Hataka, A. I.; Piontek, K. FEMS Microbiol. Rev.,
1994, 13, 321.
34. Wariishi, H.; Sheng, D.; Gold, M. H. Biochemistry 1994, 33, 5545.
35. Beratan, D. N.; Onuchic, J. N.; Winkler, J. R.; Gray, H. B. Science 1992, 258, 1740.
36. Moser, C. C.; Keske, J. M.; Waruche, K.; Farid, R. S.; Dutton, L. Nature (London)
1992, 355, 796.
37. Pardini, V. L.; Smith, C. Z.; Utley, J. H. P.; Vargas, R. R.; Viertler, H. J. Org. Chem.
1991, 56, 7305.

198
38. Criss, D. L.; Fisher, T, H.; Schultz, T. P. Holzforschung 1998, 52, 57.
39. Nishiyama Y.; Kobayashi, A. Tetrahedron Lett. 2006, 47, 5565.
A2.2 Investigation of the Catalytic Mechanism of the Hotdog-fold
Enzyme Superfamily Pseudomonas sp. strain CBS3 4-Hydroxybenzoyl-
CoA Thioesterase+
Zhihao Zhuang1#
, John Latham1, Feng Song
1#, Wenhai Zhang
1#, Michael Trujillo
2# and
Debra Dunaway-Mariano1*
1Department of Chemistry and Chemical Biology, University of New Mexico,
Albuquerque, NM 87131; 2Scientific Laboratory Division, New Mexico Department of
Health, Albuquerque, NM 87131
Running Title: 4-Hydroxybenzoyl-CoA Thioesterase
Key Words: 4-Hydroxybenzoyl-CoA thioesterase, nucleophilic catalysis, base catalysis,
solvent kinetic isotope effects, transient kinetics, thioester hydrolysis, hotdog-fold family,
divergent evolution, enzyme mechanism.
+This work was supported by N.I.H. grant GM 28688
#Current Addresses: Z .Z.: 214A Drake Hall, Department of Chemistry and Biochemistry,
University of Delaware, Newark DE 19716; F. S.: 3054 E, Syngenta Crop Protection,
LLC, Research Triangle Park, NC 27709; W.Z.: Millennium Pharmaceuticals,
Cambridge, MA 02139; M.T.: New Mexico Department of Health 1101 Camino de
Salud, Albuquerque, NM 87106

199
*To whom correspondence should be addressed: Debra Dunaway-Mariano, Department
of Chemistry and Chemical Biology, University of New Mexico, Albuquerque, NM
87111, Tel: (505) 277-3383, Email: [email protected], Fax: (505) 277-6202

200
Footnotes
1Abbreviations used are: coenzyme A (CoA), 4-hydroxybenzoyl-CoA (4-HB-CoA), 4-
hydroxybenzoyl-3'-dephospho-CoA (4-HB-3'-dephospho-CoA), 4-hydroxyphenacyl-CoA
(4-HP-CoA), 2-(N-morpholino)ethanesulfonate (MES); N-(2-hydroxyethyl)piperzine-N'-
2-ethanesulfonate (HEPES); N-tris(hydroxymethyl)methyl-3-aminopropane sulfonate
(TAPS); 3-(cyclohexylamino)-2-hydroxy-1-propanesulfonate (CAPSO).
Cellular carboxylic acids are activated for acyl transfers, Michael additions and
Claisen condensations by conversion to the corresponding thioester. The thiol unit is
typically coenzyme A (CoA)1 or an acyl carrier protein (ACP) modified at a serine
residue with a pantetheine phosphate unit. Following the conversion of the thioester, the
CoA or holo-ACP is released via hydrolysis, a reaction that is catalyzed by a thioesterase.
The majority of these thioesterases belong to the hotdog-fold enzyme superfamily (1).
The 4-hydroxybenzoyl-CoA (4-HB-CoA) thioesterase from Pseudomonas sp strain CBS3
was the first hotdog-fold thioesterase to be characterized (2). This particular thioesterase
is used in the three-step pathway that converts 4-chlorobenzoate to the metabolite 4-
hydroxybenzoate (Scheme 1) (3).
The X-ray structure of the apo Pseudomonas 4-HB-CoA thioesterase revealed a
homotetrameric structure comprised of a dimer of dimer (4). The subunits consist of a
five-stranded anti-parallel sheet that wraps an elongated -helix. The ensuing atomic
resolution X-ray structure determinations of the tetrameric thioesterase, bound with
substrate (4-HB-CoA) or a substrate analog (4-hydroxybenzyl-CoA; 4-hydroxyphenacyl-
CoA) (PDB accession codes 1LO7, 1LO8 and 1LO9), showed that the active sites are

201
located at the subunit-subunit interfaces (Figure 1A) (5). The structure of the active site
suggested a unique catalytic mechanism for thioester hydrolysis, as well as a strict order
for product release.
The catalytic scaffold, which is quite minimal, consists of the N-terminal region
of the elongated -helix and its connecting loop (Figure 1B). The loop Asp17
carboxylate oxygen atom (at 3.7 Å from the thioester C=O carbon atom) is optimally
positioned for nucleophilic addition to the substrate. Notably, there is no room for a water
molecule to bind in between the Asp17 carboxylate group and thioester moiety (Figure
1C). The amide NH of the -helix N-terminal residue Tyr24 is within hydrogen bond
distance (3.2 Å) of the thioester C=O oxygen atom (Figure 1B). Also, the positive pole of
the -helix macrodipole is directed at the thioester group. Raman spectral analysis has
shown that these electrostatic interactions orient and polarize the thioester C=O for
nucleophilic attack (6).
There are no electropositive side chains located near the substrate thioester sulfur
atom. Thus, the CoA leaving group appears to be displaced by the Asp17 as a “naked”
thiolate anion, stabilized only by the electrostatic field emanating from the -helix
macrodipole. Notably, the catalytic site is devoid of a basic amino acid side chain to
perform the role of base in the activation the water molecule for hydrolysis of the
anhydride intermediate. It is conceivable that the CoA thiolate serves this function, and
once protonated it dissociates from its binding site allowing the exit of the 4-HB, which is
otherwise trapped at the bottom of the active site (Figure 1D).
The kinetic studies reported herein, were carried out to test and explore the
catalytic mechanism of thioesterase-catalyzed 4-HB-CoA hydrolysis suggested by the
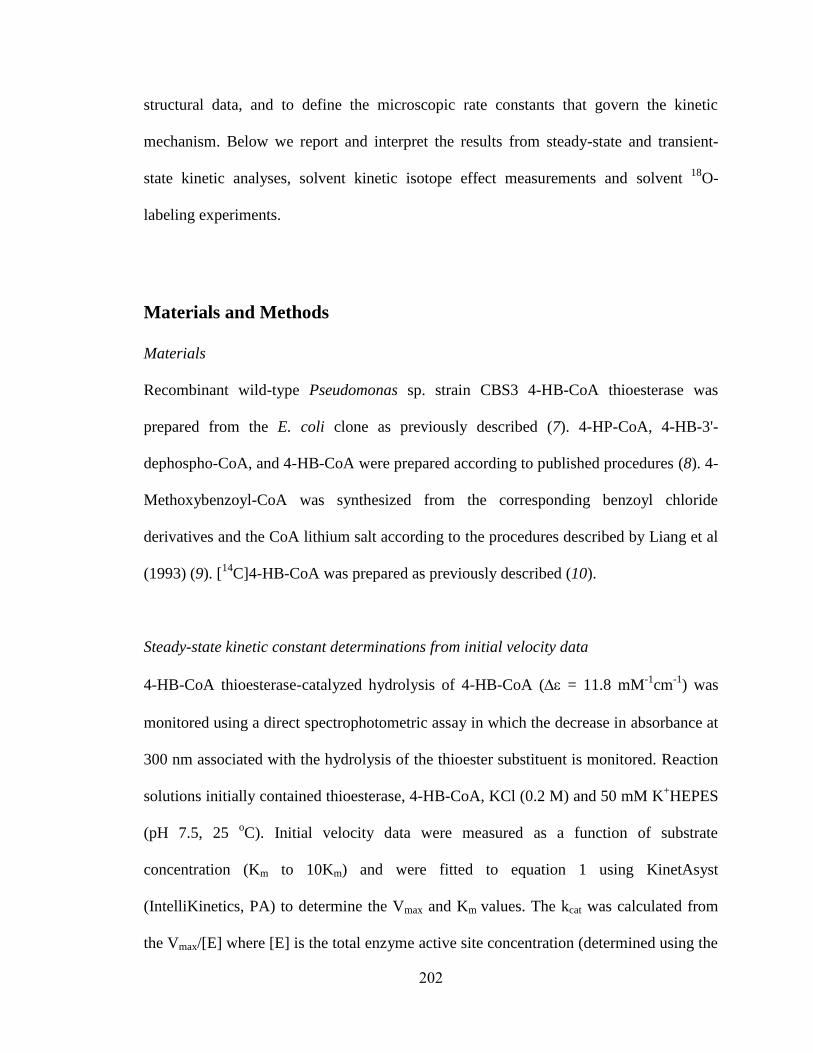
202
structural data, and to define the microscopic rate constants that govern the kinetic
mechanism. Below we report and interpret the results from steady-state and transient-
state kinetic analyses, solvent kinetic isotope effect measurements and solvent 18
O-
labeling experiments.
Materials and Methods
Materials
Recombinant wild-type Pseudomonas sp. strain CBS3 4-HB-CoA thioesterase was
prepared from the E. coli clone as previously described (7). 4-HP-CoA, 4-HB-3'-
dephospho-CoA, and 4-HB-CoA were prepared according to published procedures (8). 4-
Methoxybenzoyl-CoA was synthesized from the corresponding benzoyl chloride
derivatives and the CoA lithium salt according to the procedures described by Liang et al
(1993) (9). [14
C]4-HB-CoA was prepared as previously described (10).
Steady-state kinetic constant determinations from initial velocity data
4-HB-CoA thioesterase-catalyzed hydrolysis of 4-HB-CoA ( = 11.8 mM-1
cm-1
) was
monitored using a direct spectrophotometric assay in which the decrease in absorbance at
300 nm associated with the hydrolysis of the thioester substituent is monitored. Reaction
solutions initially contained thioesterase, 4-HB-CoA, KCl (0.2 M) and 50 mM K+HEPES
(pH 7.5, 25 oC). Initial velocity data were measured as a function of substrate
concentration (Km to 10Km) and were fitted to equation 1 using KinetAsyst
(IntelliKinetics, PA) to determine the Vmax and Km values. The kcat was calculated from
the Vmax/[E] where [E] is the total enzyme active site concentration (determined using the

203
Bradford method (11)).
V = Vmax [S] / ([S] + Km) eq. 1
Where V = initial velocity, Vmax = maximum velocity, [S] = substrate concentration and
Km= Michaelis constant.
Initial velocity data were measured in the absence or presence (1Ki, 2Ki and 3Ki) of 4-HB
or CoA and were fitted to equation 2 (to define the competitive inhibition constant Kis) or
to equation 3 (to define the kinetic constants for noncompetitive inhibition Kii and Kis),
respectively.
V = Vmax [S] / [Km (1+[I]/Kis) + [S]] eq. 2
V = Vmax [S] (1+[I]/Kii) / [Km (1+[I]/Kis) + [S]] eq. 3
Where [I] = inhibitor concentration, Kis = the slope inhibition constant and Kii = the
intercept inhibition constant.
Steady-state multiple turnover time courses
The full time courses for 0.003 M thioesterase-catalyzed 4-HB-CoA hydrolysis of 4-
HB-CoA (1.4, 3.5 and 5.2 M) in 50 mM K+HEPES (pH 7.5, 25
oC) were monitored at
300 nm (ε = 11.8 m -1
s-1
). To determine the kcat and Km values, the data were fitted by
curve simulation using the kinetic model:
E + S ES E + P
k1 k2
k-1 k-2

204
and the definitions: kcat = k2 and Km = (k-1 + k2)/k1
The KinTek Corporation Global Kinetic Explorer (www.kintek-
corp.com/KGExplorer/index.php) was used to generate the simulations (12).
Determination of the Solvent Kinetic Isotope Effect on kcat
The pH rate profiles for thioesterase-catalyzed hydrolysis of 4-HB-CoA in H2O and D2O
solvent were measured using a dual buffer system consisting of 50 mM acetate and 50
mM MES (pH 4.0 – 5.6); 50 mM MES and 50 mM HEPES (pH 5.6-8.0); 50 mM HEPES
and 50 mM TAPS (pH 8.0-9.1); 50 mM TAPS and 50 mM CAPSO (pH 9.1-9.6). The
enzyme activity at overlapping pH values was measured to ensure equal enzyme activity
in the different buffer systems. The stability of the thioesterase at the acidic and basic pH
values was verified by carrying out pre-incubation tests. The kcat pH profile was fitted
using equation 4.
logY = log [C (1 + H/Ka1)/(1 + H/Ka2)] eq. 4
where Y is the steady-state kinetic constant kcat, H is the proton concentration of the
reaction solution, Ka and Kb are the apparent ionization constants of the acidic and basic
groups, C is the constant value of Y where it does not change with the solution pH.
Rapid quench transient kinetic determinations

205
A rapid-quench instrument from KinTek Instruments was used to combine buffered wild-
type thioesterase with buffered [14
C]4-HB-CoA to initiate the reaction, and then to add
0.2 M HCl to terminate the reaction. For the multiple turnover reactions, mixtures
initially contained 10 M enzyme and 50 M [14
C]4-HB-CoA in 0.15 M KCl/50 mM
K+HEPES (pH 7.5, 25 C), whereas for the single turnover reactions, enzyme and [
14C]4-
HB-CoA concentrations were 50 M and 5 M, respectively. The enzyme was
precipitated from the quenched reaction solution by vigorous mixing with 200 L CCl4
using a Vortex mixer, and then pelleted by (micro)centrifugation of the mixture (14,000
rpm for 1 min). The water phase was injected into an HPLC for separation of the [14
C]4-
HB-CoA and [14
C]4-HB as described previously (13). The eluent was collected using a
fraction collector and analyzed by liquid scintillation counting. Control reactions (lacking
enzyme) were carried out in parallel to establish the background radioactivity associated
with the [14
C]4-HB fraction. The background (~2%) was taken into account when
calculating the concentrations of substrate and product remaining in each quenched
reaction mixture. The amounts of radioactivity (in CPM) contained in the [14
C]4-HB-
CoA and [14
C]4-HB HPLC fractions were used in conjunction with the specific activity
(CPM/micromole) of the substrate to calculate the concentration of substrate remaining
and product formed in the reaction mixture for each time point. The time courses for
[14
C]4-HB-CoA consumption and [14
C]4-HB formation were plotted and then fitted by
simulation using the KinTek Corporation Global Kinetic Explorer. The initial estimate of
an apparent rate constant governing a single turnover of substrate was determined by
fitting the single-turnover time course data to equation 5.
ln [S] = -k t + ln [S]o eq. 5

206
where [S] is the substrate concentration at time “t” , [S]o is the initial substrate
concentration and k is the apparent first order rate constant.
4-HB-CoA and 4-HP-CoA binding to wild-type thioesterase measured by stopped-flow
fluorescence spectroscopy.
Kinetic experiments were performed with an Applied Photophysics DX.17MV sequential
stopped-flow spectrophotometer (optical path length 1 cm, mixing time ~3 ms) fitted
with a 340 nm cutoff filter. The excitation wavelength was 280 nm. The measurement of
the time-dependent quenching of the wild-type thioesterase (0.54 M) fluorescence by 4-
HP-CoA (5.3 M) or 4-HB-CoA (5.0 M) was carried out under pseudo-first-order
conditions. The observed pseudo-first-order rate constant, kobs, was obtained by fitting the
data to equation 6 using the software package provided by Applied Photophysics.
ln (F0 – Ft)/(F0 - F∞) = -kobst eq. 6
Where Ft = the fluorescence at time “t”, F0 = initial fluorescence , F∞ = final fluorescence,
kobs = the observed first-order rate constant.
To measure the association rate constant (kon) and dissociation rate constant (koff ) of 4-
HP-CoA or 4-HB-CoA binding to wild-type thioesterase, time courses for fluorescence
quenching were measured as a function of ligand concentration at fixed enzyme
concentration. The resulting kobs values were plotted against the ligand concentrations
([L]) and the data were fitted to equation 7 in order to define the kon and koff values.
kobs = kon [L] + koff eq. 7

207
18O-Incorporation into 4-hydroxybenzoate (4-HBA) during wild-type thioesterase
catalyzed hydrolysis in 18
O-enriched water
A 320 L solution of 1.9 mM wild-type thioesterase in 10 mM K+HEPES (pH 7.5)
containing 0.2 M KCl and 1 mM DTT was lyophilized. To the resulting powder 230 L
of 95% H218
O (Aldrich) was added. After a 30 min incubation period at 25 ˚C, the
enzyme solution in H218
O buffer was assayed to ensure that catalytic activity was
retained. Next, 20 L of H218
O was added to a sample of 4-HB-CoA powder obtained by
lyophilization of 20 L of 3.0 mM 4-HB-CoA in natural isotopic abundance water. A 5
L aliquot of the 4-HB-CoA in H218
O solution was mixed with the enzyme solution at
room temperature. After ~ 1 min a second 5 L aliquot was added. This was repeated
twice more. The final enzyme concentration in the reaction solution was 2.4 mM,
whereas the final substrate concentration was 0.24 mM ([E]:[S]=10:1). After incubation
at room temperature for 15 min, the reaction solution was filtered using a 10 kDa micro
separation filter (Pall Filtron). The filtrate was acidified by adding 5 L of 6 N HCl and
extracted four times with 1 mL portions of ethyl acetate. The ethyl acetate extracts were
combined, dried over anhydrous sodium sulfate and the solvent was evaporated in vacuo.
The solid was dissolved in 100 L of absolute methanol and subjected to GC-MS
analysis using a Saturn GC-MS spectrometer equipped with a Restek XTI-5 column.
Results and Discussion
Detection of the Anhydride Intermediate
Experimental design. Enzyme covalent intermediates can usually be captured by
using a fast quench technique or a steady-state chemical trap (14-15). However, in view

208
of the intrinsic chemical reactivity of anhydrides it was not surprising that our attempts to
isolate the putative aspartyl17-(4-hydroxybenzoyl)anhydride intermediate by using C-14
labeled 4-HB-CoA, in conjunction with rapid quench techniques and enzyme separation,
failed. An attempt to trap the anhydride intermediate with the nucleophilic reagent
hydroxylamine was also unsuccessful.
Stopped-flow spectroscopy provides a noninvasive method to observe enzyme
intermediates provided that their spectral properties are easily distinguished from those of
the bound substrate and product. Although stopped-flow UV-absorbance proved to be an
effective method to monitor the consumption of 4-HB-CoA (at 300 nm = 11.8 mM-1
cm-1
), the signal from the anhydride intermediate was found to be obscured by those
emanating from the substrate and product complexes. Ultimately, we relied on the
accurate measurement of radiolabeled substrate and product to reveal, via kinetic
analyses, the anhydride intermediate. Based on this strategy, the kinetic experiments
reported below were designed and executed.
The kinetic “burst” experiment. The time course for the multiple-turnover of
[14
C]4-HB-CoA (50 M) catalyzed by wild-type thioesterase (10 M) was measured
using rapid (acid) quench techniques coupled with HPLC separation and quantitation of
the [14
C]4-HB-CoA and [14
C]4-HB present in the quenched reaction mixtures (Figure 2).
The acid quench denatures the enzyme, thereby releasing the bound substrate and
product. The anhydride is hydrolyzed to form [14
C]4-HB which contributes to the
“product pool” of [14
C]4-HB (i.e., [4-HB]observed = [enzyme anhydride intermediate] +
[enzyme(CoA)(4-HB)] + [4-HB]free). Providing that the anhydride intermediate is
formed at a rate that exceeds the rate of its hydrolysis, the first catalytic turnover of

209
substrate will be observed to take place faster than will the subsequent turnovers. Indeed,
the measured time course for the first few catalytic turnovers shows an initial “burst
phase” of [14
C]4-HB-CoA consumption, which roughly corresponds to one half of the
active sites initially present in the reaction solution. The burst phase is followed by a
slower, linear phase of substrate consumption that takes place during the subsequent
catalytic turnovers (Figure 2).
Although the observed time course is consistent with the intermediacy of the
anhydride intermediate as proposed, so too is a single-step reaction pathway that
proceeds with rate-limiting CoA and/or 4-HB product release. Consequently, further
experimentation was undertaken to distinguish between rate-limiting anhydride
intermediate hydrolysis and rate-limiting product release. To this end, the D2O solvent
kinetic isotope effect (SKIE) on kcat was measured. Product release is typically isotope
insensitive whereas a rate-limiting hydrolysis step is expected to give rise to a significant
SKIE. Accordingly, the kcat pH profile (Figure 3) was measured in D2O solvent as well as
in H2O solvent so that the SKIE could be accurately determined. The pH profile shows a
double wave, indicative of slowly exchanging substrate and proton (16). The kinetic data
were fitted to equation (4) to define a break at 5.15 ± 0.09 and C1 = 5.0 ± 0.1 and a break
at 7.70 ± 0.08 and C2 = 55 ± 4 for catalysis in buffered H2O, and a break at 5.1 ± 0.1 and
C1 = 1.3 ± 0.2 and a break at 8.0 ± 0.1 and C2 = 15 ± 1 for catalysis in buffered D2O. The
pH independent isotope effect was calculated from the ratio of the respective C1 or C2
values to be 3.8 or 3.7.
Together, the substantial SKIE of 3.7-3.8 and the observed burst-phase kinetic time
course (Figure 2), constitute strong evidence for the proposed two-step chemical

210
pathway. Our next step was to define the microscopic rate constants governing
thioesterase catalysis by fitting these and additional kinetic data to a kinetic model
representing a two-step chemical pathway.
Substrate binding and product release. The X-ray structure of the D17N
thioesterase(4-HB-CoA) complex reveals a “worm-hole”-like active site in which the
CoA pantetheine arm fills the tunnel leading to a tight pocket that accommodates the 4-
hydroxybenzoyl unit, while the CoA nucleotide units sits at the entrance to this tunnel
(Figure 1D) (5). In earlier work, we measured the Kd values for the wild-type
thioesterase(4-hydroxyphenacyl-CoA) inhibitor complex and the inert D17N
thioesterase(4-HB-CoA) complex to be 0.33 and 0.14 M, respectively by using steady-
state fluorescence quenching techniques (5). In the present study, stopped-flow
fluorescence quenching techniques were used to measure the corresponding binding
rates. In Figure 4A, the time course for the binding reaction of 5.3 M 4-
hydroxyphenacyl-CoA with 0.54 M thioesterase is shown, whereas Figure 4B shows the
time course for the binding reaction of 4.0 M 4-HB-CoA with 0.54 M thioesterase.
The values of the respective apparent pseudo-first order rate constants kobs = 350 ± 4 s-1
and 280 ± 30 s-1
were obtained by data fitting (equation 6). The plots of kobs vs ligand
concentration, shown as insets to Figures 4A and 4B, defined a linear correlation. The
association (kon) and dissociation (koff) rate constants were determined by fitting the data
to equation 7. For 4-hydroxyphenacyl-CoA, kon = 59 1 M-1
s-1
and koff = 20 5 s-1
define the microscopic rate constants for substrate binding and dissociation. Indeed, the
ratio koff/kon = 0.33 M is in perfect agreement with the independently measured Kd =
0.33 M (5). For 4-HB-CoA, we note that only if the substrate binding step is in rapid

211
equilibrium do the kon = 65 2 M-1
s-1
and the koff = 13 5 s-1
values accurately define
the microscopic rate constants for substrate binding and dissociation. The ratio koff/kon =
0.20 M falls halfway in between the 4-HB-CoA Km = 0.26 M (vide infra) and the
independently measured Kd = 0.14 M (5).
The quantitative analysis of product binding was limited (for technical reasons)
to the determination of the steady-state inhibition constants for thioesterase-catalyzed
hydrolysis of 4-HB-CoA. CoA proved to be a weak noncompetitive inhibitor (Kis = 250 ±
70 M, Kii = 900 ± 300 M) and 4-HB, a weak competitive inhibitor (Kis = 1.2 ± 0.2
mM). The competitive inhibition observed for 4-HB (binds only to the free enzyme), and
the noncompetitive inhibition (binds to the free enzyme (slope effect) and to the enzyme-
anhydride intermediate and/or enzyme(4-HB) complex (intercept effect)) observed for
CoA are consistent with CoA departure preceding that of 4-HB, as was predicted from
the X-ray structure the D17N thioesterase(4-HB-CoA) complex.
Reaction time course analysis. In order to define the microscopic rate
constants for thioesterase catalysis, the measurement of time courses, which would
supplement the transient-state, multiple-turnover time course (Figure 2) and the time
course for substrate binding (Figure 4) was pursued. Firstly, the time course for a single-
turnover reaction was measured by using 50 M wild-type thioesterase to catalyze the
hydrolysis of 5 M [14
C]4-HB-CoA (Figure 5). Secondly, steady-state multiple-turnover
time courses were measured using 1.4, 3.5 or 5.2 M 4-HB-CoA and 0.003 M
thioesterase (Figure 6).
The simulation-based fitting of the four sets of time-course data was carried out
using the kinetic model shown in Scheme 2. This model assumes includes the substrate-

212
binding step, the two chemical steps and the two (ordered) product release steps. A more
complex model in which CoA dissociates prior to the hydrolysis of the anhydride
intermediate was also considered. However, the divergence observed in the sets of
microscopic rate constants used to generate optimal fits to the respective time courses,
was comparatively large. For this reason, the model was not carried forward.
To initiate the simulation process, estimates of the microscopic rate constants
were obtained by conventional fitting of the individual data sets (see Material and
Methods). The values of the microscopic rate constants were varied individually, and in
combination, until the simulated curve matched the experimental time course. The
simulated curves are shown in Figures 2, 4, 5 and 6 along with the values of the
microscopic rate constants used in the simulation. During the process of fitting the four
time courses we discovered, as one might anticipate, that there is some variation in the
extent to which the allowed range of a given microscopic rate constant can be confined.
For instance, the value of k3 (governs the rate-limiting anhydride hydrolysis step) was
inconsequential to the simulation of the substrate-binding time course, whereas it could
not deviate more that 10% without noticeably compromising the respective fits of the
simulated curves to the other time courses. On the other hand, the values of the
microscopic rate constants governing the product release steps had a limited impact on
the simulation process.
Everything considered, the rate microscopic rate constants governing the
substrate-binding step and the two chemical steps are reasonably well defined. We show
in Figure 5, along with the simulated single-turnover time course data, the simulated
curves representing the anhydride intermediate and the 4-HB product. At 25 ms the

213
anhydride intermediate peaks at ~40% and then slowly declines. The slow onset of 4-HB
formation (i.e., initial lag in the simulated time course colored green) is the reflection of
the rate-limiting hydrolysis step. In the section that follows, we report the 18
O-solvent
labeling experiment that was used to determine the regiochemistry of hydrolysis of the
anhydride intermediate.
Regiochemistry of the Hydrolysis of the Anhydride Intermediate
The attack of the water nucleophile at the anhydride intermediate formed in the
first step of thioesterase catalysis can potentially occur at either the benzoyl carbonyl
carbon or the aspartyl carbonyl carbon. In order to determine the regiochemistry of the
hydrolysis step, single turnover reactions were carried out in 95% H218
O solvent. If the
Asp17 carbonyl carbon is attacked, the 4-HB product will not contain the solvent-derived
18O atom in its carboxylate group, but instead it will contain the Asp17-derived
16O atom.
On the other hand, if the benzoyl carbonyl carbon is attacked, the 4-hydroxybenzoate
product will contain the 18
O atom derived from solvent. The mass spectrum of the 4-
hydroxybenzoic acid standard (see Figure 7A) contains the parent ion (M*) peak at 138
m/z, parent ion fragment (M*-OH) peak at 121 m/z (note that the OH group lost is from
the carboxylic acid group, not the aromatic ring), a fragment (M*-COOH) at 93 m/z and
lastly, a fragment at 65 m/z (not assigned). The parent ion (M*) and parent ion fragment
(M*-OH) contain oxygen from the carboxylic acid group, and can thus be used to
measure the oxygen-18 incorporation.
The mass spectrum of the 4-hydroxybenzoic acid isolated from the single
turnover reaction of 4-HB-CoA (0.24 mM) catalyzed by the wild-type thioesterase (2.4

214
mM) in 95% H218
O revealed that >90% of the parent ion peak occurs at 140 m/z (see
Figure 7B), which means that the vast majority of the 4-hydroxybenzoic acid is labeled at
the carboxylic acid group with one 18
O atom and one 16
O atom. The equal probability of
losing either carboxylic acid oxygen atom in the parent ion resulted in an equal amount of
(M*-OH) specie at 121 and 123 m/z. These findings demonstrate that hydrolysis occurs
at the benzoyl carbonyl carbon of the Asp17-(4-hydroxybenzoyl)anhydride intermediate.
Conclusions
In Figure 8 we propose a reaction mechanism for 4-HB-CoA catalysis, which
integrates the findings from earlier investigations (5, 6) with those presented here. The
reaction begins with very tight substrate binding. The catalytic site is located at the end of
a narrow tunnel that leads from solvent to an enclosed, largely hydrophobic pocket
(Figure 1D). The conformation of the thioesterase, and the substrate-binding site in
particular, is unchanged by substrate binding. Thus, a “lock-in-key” model of substrate
binding is applicable. The substrate-binding rate (k1 ~ 70 M-1
s-1
) is about average,
however the dissociation rate is slow (k-1 ~15 s-1
) and therefore the Kd = 0.14 M is quite
small. The substrate 4-hydroxybenzoyl unit is immobilized by tight packing with the
surrounding side chains, several of which are aromatic. The single hydrogen bond
formation with the benzoyl ring hydroxyl group involves the indole NH of Trp47 (Figure
1B).
At the catalytic site, the substrate thioester C=O is oriented and activated for
nucleophilic attack by the Asp17 carboxylate group. The range for a pre-transition state
conformation (i.e, “near-attack-conformation”) of a carboxylate oxygen anion and the

215
carbonyl carbon electrophile, posited by Lightstone and Bruice (17), is depicted in Figure
8 alongside the orientation of the Asp17 observed in the thioesterase X-ray structures (5).
The Asp17 thus appears to be in a “near-attack-conformation”. Substitution of the Asp17
with a Glu extends the side chain by one methylene group, which we expect would offset
the alignment of the carboxylate oxygen anion with the 4-HB-CoA thioester C=O.
Indeed, the magnitude of the rate reduction observed for the D17E thioesterase is ~1000-
fold (6), is consistent with a significant perturbation of the ground state.
The displacement of the CoA thiolate anion is assumed to be a concerted reaction.
This is because the pKa of the conjugate acid (= 9.7) is low enough to fall well within the
limit prescribed for concerted ester hydrolysis (18). The CoA thiolate anion is not within
reach of an active site residue, yet it could favorably interact with electropositive field
generated by the -helix N-terminus. If the CoA does not depart before the ensuing
hydrolysis step, it might serve to orient and activate the water molecule for attack at the
4-hydroxybenzoyl carbonyl carbon. This scenario is depicted in Figure 8, with the caveat
that we have provided little in the way of supporting evidence. Additional work will be
required in order to define the mechanism of the rate-limiting step of thioesterase
catalysis.
The proposed mechanism of the Pseudomonas 4-HB-CoA thioesterase catalysis
deviates from the mechanisms employed by the thioesterases of the -fold hydrolase
enzyme superfamily, which are centered on covalent catalysis by the Ser of the Ser-His-
Asp/Glu catalytic triad, and on electrophilic catalysis by an oxyanion hole (19). In
contrast, the thioesterase of the crotonase enzyme superfamily (3-hydroxyisobutyryl-CoA
thioesterase) shares with the 4-HB-CoA thioesterase the use of a carboxylate residue

216
(Glu143) in nucleophilic catalysis and the use of the N-terminus (positive pole) of an -
helix in electrophilic catalysis (20). A detailed comparison of the catalytic mechanisms of
hotdog-fold thioesterases, including the 4-HB-CoA thioesterase, is planned for a separate
publication. Nevertheless, to date the 4-HB-CoA thioesterase is the only member of the
hotdog-fold family known to use the catalytic carboxylate group in nucleophilic catalysis.
Acknowledgements
The authors thank Drs. Zhibing Lu and Karen Allen for preparing Figure 1C and W. W.
Cleland for critically reading the manuscript. Also, we say “thank you” to a very helpful
reviewer.

217
References
1. Dillon, S. C., and Bateman, A. (2004) The Hotdog fold: wrapping up a
superfamily of thioesterases and dehydratases. BMC Bioinformatics 5, 109.
2. Scholten, J. D., Chang, K. H., Babbitt, P. C., Charest, H., Sylvestre, M., and
Dunaway-Mariano, D. (1991) Novel enzymic hydrolytic dehalogenation of a
chlorinated aromatic. Science 253, 182-185.
3. Dunaway-Mariano, D., and Babbitt, P. C. (1994) On the origins and functions of
the enzymes of the 4-chlorobenzoate to 4-hydroxybenzoate converting pathway.
Biodegradation 5, 259-276.
4. Benning, M. M., Wesenberg, G., Liu, R., Taylor, K. L., Dunaway-Mariano, D.,
Holden, H. M. (1998) The three-dimensional structure of 4-hydroxybenzoyl-CoA
thioesterase from Pseudomonas sp. Strain CBS-3. J. Biol. Chem. 273, 33572-
33579.
5. Thoden, J. B., Holden, H. M., Zhuang, Z., Dunaway-Mariano, D. (2002) X-ray
crystallographic analyses of inhibitor and substrate complexes of wild-type and
mutant 4-hydroxybenzoyl-CoA thioesterase. J. Biol. Chem. 277, 27468-27476.
6. Zhuang, Z., Song, F., Zhang, W., Taylor, K., Archambault, A., Dunaway-
Mariano, D., Dong, J., Carey, P. R.. (2002) Kinetic, Raman, NMR, and site-
directed mutagenesis studies of the Pseudomonas sp. strain CBS3 4-
hydroxybenzoyl-CoA thioesterase active site. Biochemistry 41, 11152-11160.
7. Chang, K. H., Liang, P. H., Beck, W., Scholten, J. D., and Dunaway-Mariano, D.
(1992) Isolation and characterization of the three polypeptide components of 4-

218
chlorobenzoate dehalogenase from Pseudomonas sp. strain CBS-3. Biochemistry
31, 5605-5610.
8. Luo, L., K. L. Taylor, H. Xiang, Y. Wei, W. Zhang, and D. Dunaway-Mariano.
(2001) Role of active site binding interactions in 4-chlorobenzoyl-coenzyme A
dehalogenase catalysis. Biochemistry 40, 15684-15692.
9. Liang, P. H., G. Yang, and D. Dunaway-Mariano. (1993) Specificity of 4-
chlorobenzoyl coenzyme A dehalogenase catalyzed dehalogenation of
halogenated aromatics. Biochemistry 32, 12245-12250.
10. Zhuang, Z., Gartman, K-H, Eichenlaub, R. and Dunaway-Mariano, D. (2003)
Characterization of the 4-hydroxybenzoyl-coenzyme A thioesterase from
Arthrobacter sp. strain SU. Appl. Environ. Microbiol. 69, 2707-2711.
11. Bradford, M. M. (1976) A rapid and sensitive method for the quantitation of
microgram quantities of protein utilizing the principle of protein-dye binding.
Anal Biochem 72, 248-254.
12. Johnson, K. A. (2009) Fitting enzyme kinetic data with KinTek Global Kinetic
Explorer. Methods Enzymol. 467, 601-626.
13. Zhang, W., Wei, Y., Luo, L., Taylor, K. L., Yang, G., Dunaway-Mariano, D.,
Benning, M. M., and Holden, H. M. (2001) Histidine 90 function in 4-
chlorobenzoyl-coenzyme A dehalogenase catalysis. Biochemistry 40, 13474-
13482.
14. Johnson, K. A. (2003) Kinetic Analysis of Macrolecules. A Practical Approach.
15. Purich, D. Covalent enzyme-substrate compounds: detection and catalytic
competence. (2002) Methods Enzymol. 354, 1-27.

219
16. Cleland, W. W. (1977) Determining the chemical mechanisms of enzyme-
catalyzed reactions by kinetic studies. Adv. Enzymol. Relat. Areas Mol. Biol. 45,
273-387.
17. Lightstone, F. C., Bruice, Thomas C. (1996) Ground state conformations and
entropic and enthalpic factors in the efficiency of intramolecular and enzymic
reactions. 1. Cyclic anhydride formation by substituted glutarates, succinate, and
3,6-endoxo-D4-tetrahydrophthalate monophenyl esters. J. Amer. Chem. Soc.
118,2595-2605.
18. Hess, R.A, Hengge, A.C., and Cleland, W.W. (1998) Isotope effects on enzyme-
catalyzed acyl transfer from p-nitrophenyl acetate: Concerted mechanisms and
increased hyperconjugation in the transition state. J. Amer. Chem. Soc. 120, 2703-
2709.
220
19. OLLIS, D. L., CHEAH E., CYGLER M., DIJKSTRA B., FROLOW
F., FRANKEN S. M., HAREL M, REMINGTON S. J., SILMAN I.,
SCHRAG J., SUSSMAN, J. L., VERSCHUEREN, K.H. G., AND
GOLDMAN, A. (1992) THE ALPHA/BETA HYDROLASE FOLD.
PROTEIN ENG. 5, 197-211.
20. WONG, B. J. AND GERLT, J. A. (2003) DIVERGENT FUNCTION
IN THE CROTONASE SUPERFAMILY: AN ANHYDRIDE
INTERMEDIATE IN THE REACTION CATALYZED BY 3-
HYDROXYISOBUTYRYL-COA HYDROLASE. J. AMER. CHEM.
SOC. 125, 12076-12077.
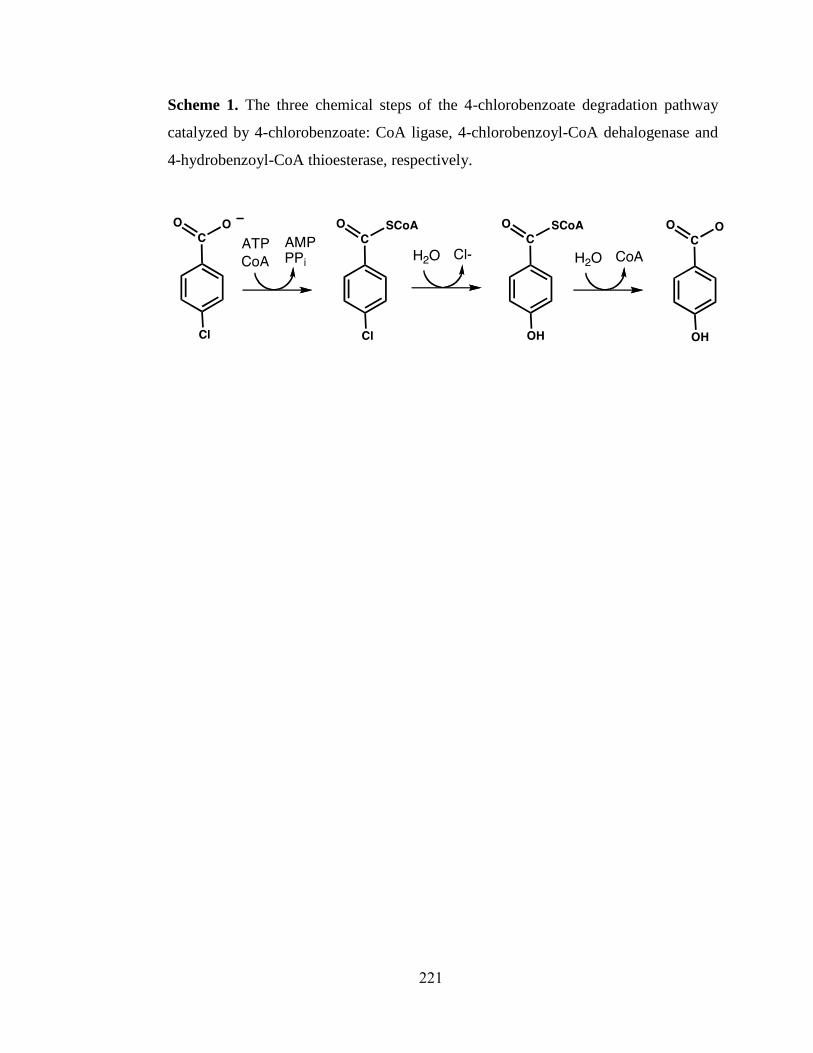
221
Scheme 1. The three chemical steps of the 4-chlorobenzoate degradation pathway
catalyzed by 4-chlorobenzoate: CoA ligase, 4-chlorobenzoyl-CoA dehalogenase and
4-hydrobenzoyl-CoA thioesterase, respectively.

222
Scheme 2. The kinetic model representing 4-HB-CoA thioesterase catalysis.
Abbreviations: E, thioesterase; EI, thioesterase-anhydride intermediate; S, 4-HB-CoA; P,
CoA; Q, 4-HB.

223
Figure Legends
Figure 1. The structure of D17N Pseudomonas sp. strain CBS3 4-HB-CoA thioesterase
bound with 4-HB-CoA (PDB accession code 1LO9). (A.) The tetramer shown in Pymol
cartoon with the 4-HB-CoA ligands shown in yellow stick. (B.) The active site structure
wherein the 4-HB-CoA has been truncated for better viewing and the Asn17 has been
mutated in silico to Asp17. Hydrogen bonds are indicated in gray or black dashed lines.
The 3.7 Å distance between the Asp17 carboxylate group oxygen atom and the 4-HB-
CoA ring carbonyl carbon atom is represented by the magenta dashed line. The nitrogen
atoms are colored blue, the oxygen atoms red, the sulfur atom yellow and the enzyme
carbons atoms are colored gray whereas the 4-HB-CoA carbon atoms are colored cyan.
(C.) Stereo figure of the active site solvent cage generated from the empty active site
cavity produced in VOIDOO (teal colored mesh). The 4-HB-CoA ligand fills the cage.
Carbon atoms are shown in gray, oxygen atoms in red, nitrogen atoms in blue and sulfur
atoms in yellow. (D) The surface representation of the thioesterase substrate-binding site.
The 4-HB-CoA ligand is shown in stick with carbon atoms colored cyan. The Asp17 side
chain and Tyr24 amide unit are shown in stick with carbon atoms colored green.
Figure 2. A plot of the experimental and simulated time courses for the transient-state
multiple-turnover reaction of 10 M wild-type thioesterase and 50 M [14
C]4-HB-CoA
in 50 mM K+HEPES (pH 7.5, 25
oC). The time point data ([
14C]4-HB-CoA () and
[14
C]4-HB ()) were calculated from the fraction of [14
C]4-HB-CoA or [14
C]4-HB
present in the acid-quenched reaction mixture multiplied by the initial concentration of

224
[14
C]4-HB-CoA present in the reaction. The simulated curves were generated using the
kinetic model shown in Scheme 2 and the following set of rate constants: k1 = 71 M-1
s-
1, k-1 = 12 s
-1, k2 = 290 s
-1, k-2 = 67 s
-1, k3 = 23 s
-1, k-3 = 0 s
-1, k4 /k-4 = 300 M and k5 /k-5
= 1200 M. The simulated curve-coloring scheme is as follows: E-I(CoA) + E(4-
HB)(CoA) + E(4-HB) + 4-HB (red); E(4-HB-CoA) + 4-HB-CoA (black).
Figure 3. A plot of log kcat vs reaction solution pH measured for wild Pseudomonas sp.
strain CBS3 4-HB-CoA thioesterase-catalyzed hydrolysis of 4-HB-CoA in H2O solvent
() or D2O solvent ().
Figure 4. (A) Time-dependent fluorescence change associated with the binding reaction
between 5.3 M 4-HP-CoA and 0.54 M thioesterase in 50 mM K+HEPES (pH 7.5, 25
oC). The data were fitted to equation 6 to define the observed rate constant kobs as 350 4
s-1
. Inset: a plot of the kobs vs 4-HP-CoA concentration (1.0 - 5.3 M). The data were
fitted to equation 7 to define the association rate constant kon as 59 1 M-1
s-1
and the
dissociation rate constant koff as 20 5 s-1
. (B.) Time-dependent fluorescence change
associated with the binding reaction between 5.0 M 4-HB-CoA and 0.54 M
thioesterase in 50 mM K+HEPES (pH 7.5, 25
oC). The data were fitted to equation 6 to
define the observed rate constant kobs as 280 30 s-1
. Inset: a plot of the kobs vs 4-HB-
CoA concentration (1.0 - 5.0 M). The data were fitted to equation 7 to define the

225
association rate constant kon as 65 2 M-1
s-1
and the dissociation rate constant koff as 13
5 s-1
. (C) The time course for the binding reaction between 3.0 M 4-HB-CoA and 0.54
M thioesterase in 50 mM K+HEPES (pH 7.5, 25
oC). The simulated curved was
generated using the kinetic model shown in Scheme 2 and the rate constants k1 = 70 M-
1s
-1 and k-1 = 15 s
-1.
Figure 5. The experimental and simulated time courses for the single-turnover reaction
of 50 M wild-type thioesterase and 5 M [14
C]4-HB-CoA in 50 mM K+HEPES (pH 7.5,
25 oC). The time point data ([
14C]4-HB-CoA () and [
14C]4-HB ()) were calculated
from the fraction of [14
C]4-HB-CoA or [14
C]4-HB present in the acid-quenched reaction
mixture multiplied by the initial concentration of [14
C]4-HB-CoA present in the reaction.
The simulated curves were generated using the kinetic model shown in Scheme 2 and the
following set of rate constants: k1 = 79 M-1
s-1
, k-1 = 20 s-1
, k2 = 76 s-1
, k-2 = 50 s-1
, k3 =
26 s-1
, k-3 = 0 s-1
, k4 /k-4 = 300 M and k5 /k-5 = 1200 M. The simulated curve-coloring
scheme is as follows: E-I(CoA) + E(4-HB)(CoA) + E(4-HB) + 4-HB (red); E(4-HB-
CoA) + 4-HB-CoA (black); E-I(CoA) (yellow); E(4-HB)(CoA) + E(4-HB) + 4-HB
(green).
Figure 6. The time courses for the steady-state multiple-turnover reactions of 1.4 (black),
3.5 (red) or 5.2 (green) M 4-HB-CoA catalyzed by 0.003 M thioesterase in 50 mM
K+HEPES (pH 7.5, 25
oC). The 300 nm absorbance traces (dotted lines) are shown in the
context of the calculated concentration of 4-HB-CoA ( = 11.8 mM-1
cm-1
) present in the
reaction mixture (y-axis) as a function of reaction time (x-axis). The simulated curves

226
(solid lines) were generated using the kinetic model shown in Scheme 2 and rate
constants: k1 = 71 M-1
s-1
, k-1 = 12 s-1
, k2 = 290 s-1
, k-2 = 67 s-1
, k3 = 23 s-1
, k-3 = 0 s-1
, k4
/k-4 = 300 M and k5 /k-5 = 1200 M.
Figure 7. The GC-MS analysis of the 4-HB product generated in the single turnover
reaction of 4-HB-CoA (0.24 mM) catalyzed by the wild-type thioesterase (2.4 mM) in
95% H218
O containing 50 mM K+HEPES (pH 7.5, 25
oC) (A.) GC-MS spectrum of the 4-
hydroxybenzoic acid standard. (B.) GC-MS spectrum of the 4-hydroxybenzoic acid
isolated the quenched reaction mixture.
Figure 8. A cartoon representation of the proposed mechanism of 4-HB-CoA
thioesterase catalysis. The rates shown over the arrows correspond to the range of values
obtained for the microscopic rate constants via the time course simulations. The boxed
content: (left) an adaptation of a figure from reference (17), which depicts the ranges of
optimal positions for nucleophilic attack of a carboxylate oxygen anion at a carbonyl
carbon as posited by Lightstone and Bruice and (right) the distance and angle of attack of
the Asp17 carboxylate oxygen atom at the 4-HB-CoA carbonyl carbon as inferred from
the X-ray structure of the D17N thioesterase(4-HB-CoA) complex (PDB accession code
1LO9).

227
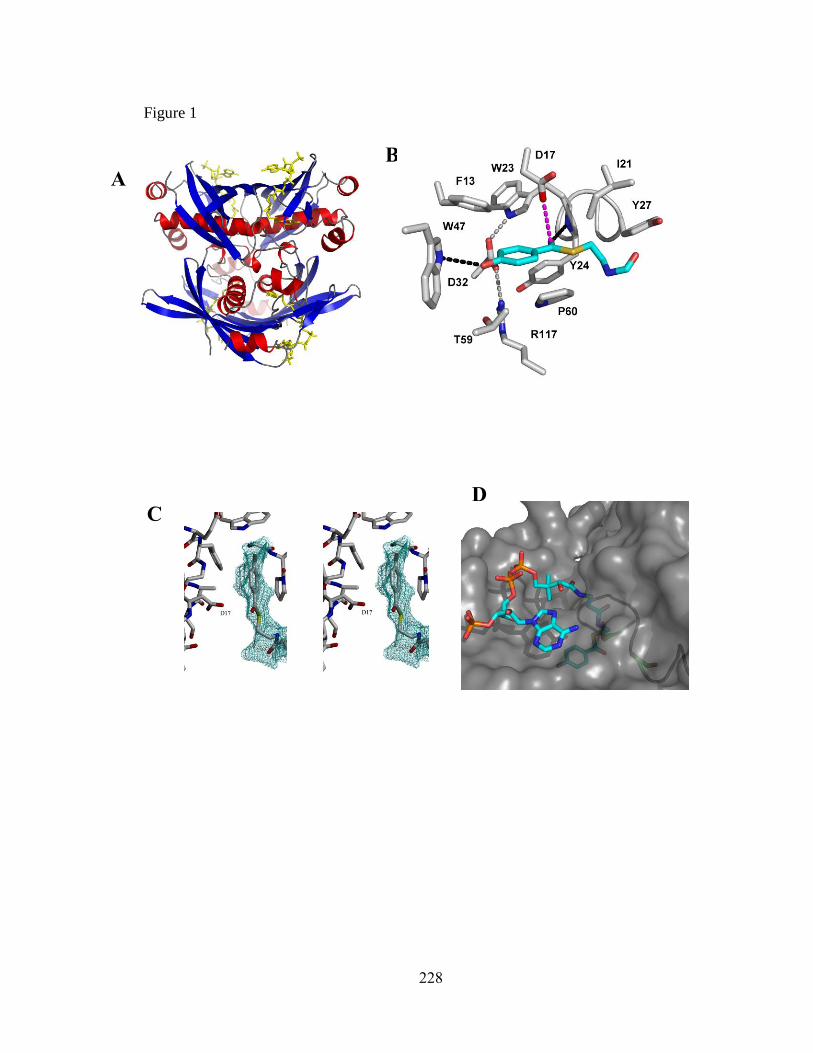
228
Figure 1
A
B
C
D
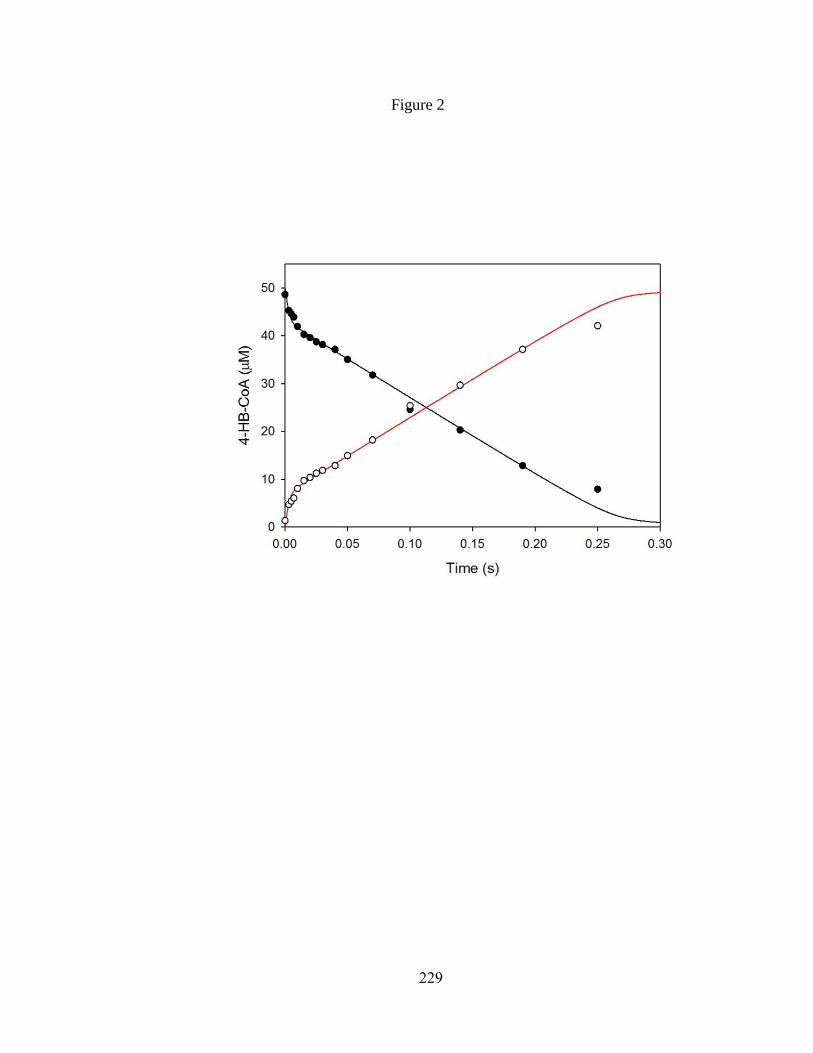
229
Figure 2

230
Figure 3
H2O
D2O

231
Figure 4
A
0 10 20 30 40
6.6
6.5
6.4
6.3
6.2
B
C

232
Figure 5
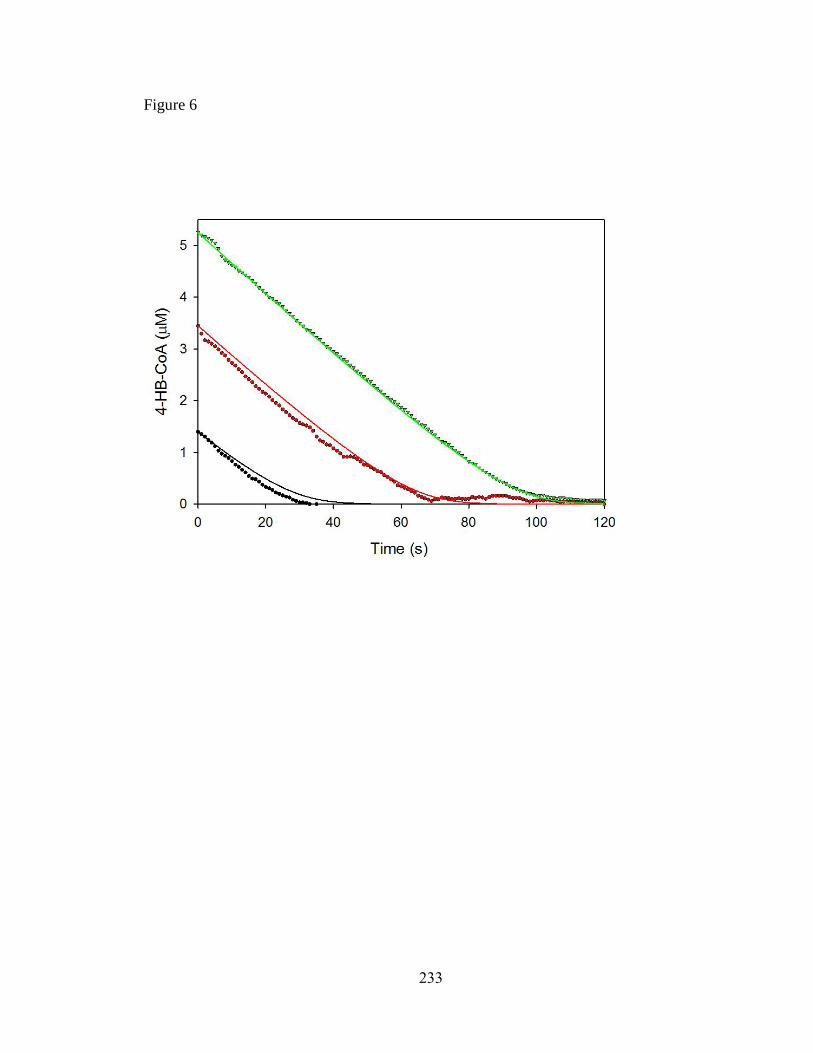
233
Figure 6

234
Figure 7
A
B
m/z
m/z
m/z

235
Figure 8

236
For Table of Contents use only
Investigation of the Catalytic Mechanism of the Hotdog-fold Enzyme
Superfamily Pseudomonas sp. strain CBS3 4-Hydroxybenzoyl-CoA
Thioesterase+
Zhihao Zhuang1, John Latham
1, Feng Song
1, Wenhai Zhang
1, Michael Trujillo
2 and
Debra Dunaway-Mariano1*