student and exchange visitor information …€¦ · sevis by the numbers is a quarterly report...
TRANSCRIPT

STUDENT AND EXCHANGE VISITOR
INFORMATION SYSTEM
SEVIS BY THE NUMBERS GENERAL SUMMARY QUARTERLY REVIEW
July 2016

HIGHLIGHTS GENERAL DATA
• 1.11 million F & M students currently study in the United States.
• 258,012 J-1 exchange visitors are currently in the United States.
• SEVP currently certifies 8,673 U.S. schools to enroll international students.
• 77 percent of SEVP-certified schools have 50 or less enrolled F & M students.
• 77 percent of all F & M students are enrolled in bachelor’s, master’s or doctoral programs.
• 42 percent of all F & M students, or 466,964 nonimmigrant students, study science, technology, engineering and mathematics (STEM)
fields in the United States.
TRENDS
• The number of active F & M students studying in the United States grew from 1.05 million in July 2015 to 1.11 million in July 2016,
an increase of 5.5 percent.
• The number of active J-1 exchange visitors in the United States grew from to 244,766 in July 2015 to 258,012 in July 2016,
an increase of 5.4 percent.
• The number of active STEM F & M students studying in the United States grew from 405,308 in July 2015 to 466,964 in July 2016, an
increase of 15.2 percent.
REMINDERS
• This report compares data from July 2016 to July 2015, continuing the practice of making year-over-year comparisons, which
provides users a better snapshot of international student trends in the United States.
• Check out the Mapping SEVIS by the Numbers interactive tool on Study in the States to research information about where
international students are studying in the United States.

TABLE OF CONTENTS
I. INTRODUCTION: What is the Student and Exchange Visitor Program?
II. DEFINITIONS: What Do These Terms Mean?
III. GENERAL OVERVIEW: School and Nonimmigrant Student Data
IV. STUDENTS: F-1 & M-1 Nonimmigrant Student Data
V. SCHOOLS: SEVP-certified School Data
VI. STEM DATA: Nonimmigrant Student Data
VII. FOCUS ON EUROPE: Overview of European Nonimmigrant Students Studying in the United States
4
7
8
9
16
21
29

INTRODUCTION What is the Student and Exchange Visitor Program?
SEVP, a program within the U.S. Immigration and Customs Enforcement, acts as a
bridge for government organizations that have an interest in information on
nonimmigrants whose primary reason for coming to the United States is to be
students.
On behalf of the U.S. Department of Homeland Security (DHS), SEVP
manages schools, nonimmigrant students in the F & M visa classifications
and their dependents.
The U.S. Department of State manages exchange visitor programs, nonimmigrant
exchange visitors in the J visa classification and their dependents. Both SEVP and
the Department of State use the Student and Exchange Visitor Information System
(SEVIS) to track and monitor schools; exchange visitor programs; and F, M and J
nonimmigrants while they visit the United States and participate in the U.S.
education system.
4 | Real-time SEVIS Data from July 7, 2016

SEVIS is the web-based system that DHS uses to maintain information on
SEVP-certified schools and the F & M students who come to the United States to
attend those schools. SEVIS also maintains information on Department of
State-designated exchange visitor program sponsors and J-1 visa exchange visitor
program participants. It is a critical tool in SEVP’s mission to protect national
security while supporting the legal entry of the more than one million F, M and J
nonimmigrants to the United States for education and cultural exchange.
INTRODUCTION What is the Student and Exchange Visitor Information System?
5 | Real-time SEVIS Data from July 7, 2016

SEVIS by the Numbers is a quarterly report that highlights nonimmigrant student
and exchange visitor trends and information using data from SEVIS, which SEVP
uses to track and monitor the status and activities of nonimmigrant students and
exchange visitors who enter the United States.
The report highlights key SEVIS data in an engaging way to illustrate trends,
values and information on nonimmigrant students studying in the United States.
6 | Real-time SEVIS Data from July 7, 2016
INTRODUCTION What is the SEVIS by the Numbers?

DEFINITIONS What do these terms mean?
• Nonimmigrant – Person entering the United States to visit, study or work (depending on
the type of visa) temporarily, but not to stay permanently in the United States.
• F-1 nonimmigrant student – Nonimmigrant status conferred on a student pursuing a full
program of study in a college, university, seminary, conservatory, academic high school,
private elementary school, other academic school or language training program in the
United States that is SEVP-certified to enroll F and/or M students.
• M-1 nonimmigrant student – Nonimmigrant status conferred on a foreign national
pursuing a full program of study at an SEVP-certified vocational school or other recognized
non-academic school (other than in language training programs).
• J-1 exchange visitor – Foreign national selected by a Department of State-designated
program to participate in an exchange visitor program.
7 | Real-time SEVIS Data from July 7, 2016

* F-1/M-1 – Active students considered in F-1 or M-1 status and enrolled in a
full course of study.
* Certified Schools – An academic/vocational institution or language training
program that has received certification to enroll nonimmigrant students.
* Completed – The student has finished their program of study and intends
on/already has returned to their home country.
* J-1 – Active exchange visitors considered in J-1 status and participating in
their program.
* Designated Programs – A J-1 program that is approved to accept
exchange visitors.
8 | Real-time SEVIS Data from July 7, 2016
TOTAL # OF ACTIVE STUDENTS
STUDENTS (F-1 & M-1) AND EXCHANGE VISITORS (J-1)
JULY 2015 JULY 2016 % CHANGE
F-1 & M-1 1,054,505 1,112,554 +5.50%
J-1 244,766 258,012 +5.41%
DEPENDENTS 152,553 153,761 +0.79%
COMPLETED 2,413,757 2,688,929 +11.40%
SCHOOLS AND PROGRAMS
JULY 2015 JULY 2016 % CHANGE
CERTIFIED SCHOOLS (F & M) 8,887 8,673 -2.41%
DESIGNATED PROGRAMS (J) 1,448 1,492 +3.04%
GENERAL OVERVIEW School and nonimmigrant student data
Since July 2015, the total number of SEVIS records for active F & M students, J exchange visitors and
their dependents increased by 4.99 percent, from 1,451,824 to 1,524,327.


This chart and the following maps show the areas of origin for
F & M students by continent and subregion.
* Continent information was compiled using the United Nation's composition of macro
geographical (continental) regions, geographical subregions, and selected economic and
other groupings. 10 | Real-time SEVIS Data from July 7, 2016
PLACES OF ORIGIN Where do nonimmigrant students in the United States originate from?

* Continent information was compiled using the United Nation's composition of macro
geographical (continental) regions, geographical subregions, and selected economic and
other groupings.
11 | Real-time SEVIS Data from July 7, 2016
PLACES OF ORIGIN A global view — July 2016 compared to July 2015

* Continent information was compiled using the United Nation's composition of macro
geographical (continental) regions, geographical subregions, and selected economic and
other groupings. 12 | Real-time SEVIS Data from July 7, 2016
PLACES OF ORIGIN A closer look at Asia — July 2016 compared to July 2015

* Continent information was compiled using the United Nation's composition of macro geographical (continental)
regions, geographical subregions, and selected economic and other groupings.
* Stripes through the bars indicate China-only data
13 | Real-time SEVIS Data from July 7, 2016
TOP 10 COUNTRIES OF CITIZENSHIP
77% of all F & M students originate from Asian
nations, followed by 7 percent from Europe, 6 percent from
North America, 5 percent from South America, 4 percent from
Africa and 0.5 percent from Australia/Pacific Islands.

57% of all F & M students studying in the
United States are male. Eastern Europe sends the most females (57 percent) and
Western Asia the most males (76 percent).
* Continent information was compiled using the United Nation's composition of macro geographical
(continental) regions, geographical subregions, and selected economic and other groupings. 14 | Real-time SEVIS Data from July 7, 2016
STUDENT BY GENDER How many male F & M students come to the United States compared to females?
The graph below shows the United States' proportion of male
versus female F & M students from each region of the world.

CONTINENT DESTINATION
ASIA CA: 19%
EUROPE CA: 19%
AUSTRALIA & PACIFIC
ISLANDS CA: 18%
AFRICA TX: 13%
NORTH AMERICA TX: 13%
SOUTH AMERICA FL: 23%
15 | Real-time SEVIS Data from July 7, 2016
STUDENTS BY STATE Which states host the highest population of F & M students?
20% increase in the number of F & M students studying at schools in Arkansas, and a 19 percent increase
for schools in New Hampshire since July 2015.
6% increase in the number of F & M students studying
at schools in CA, NY and TX since July 2015.


# OF SCHOOLS BY ACTIVE STUDENT ENROLLMENT
# OF SCHOOLS # OF ACTIVE STUDENTS
33 >5,000
212 1,001-5,000
179 501-1,000
878 101-500
672 51-100
1,974 11-50
2,956 1-10
1,763 0
F SCHOOLS
F & M SCHOOLS
M SCHOOLS
CERTIFIED SCHOOLS Which SEVP-certified schools have the largest population
of F & M students per visa category?
17 | Real-time SEVIS Data from July 7, 2016
PERCENT OF SCHOOLS BY VISA CATEGORY
TOP FIVE M-1 APPROVED SCHOOLS
SCHOOL NAME # OF ACTIVE STUDENTS
U.S. AVIATION ACADEMY 335
CAE GLOBAL ACADEMY PHOENIX, INC. 321
DEAN INTERNATIONAL, INC. 309
TRANSPAC AVIATION ACADEMY 307
WESTWIND SCHOOL OF AERONAUTICS, PHOENIX, LLC 227
TOP FIVE F-1 & M-1 APPROVED SCHOOLS
SCHOOL NAME # OF ACTIVE STUDENTS
CORNELL UNIVERSITY 5,604
HOUSTON COMMUNITY COLLEGE SYSTEM 4,627
THE UNIVERSITY OF IOWA 3,337
COMPUTER SYSTEMS INSTITUTE 3,186
SANTA MONICA COLLEGE 3,146
TOP FIVE F-1 APPROVED SCHOOLS
SCHOOL NAME # OF ACTIVE STUDENTS
NEW YORK UNIVERSITY 13,327
UNIVERSITY OF SOUTHERN CALIFORNIA 12,703
NORTHEASTERN UNIVERSITY 10,807
ARIZONA STATE UNIVERSITY 10,532
COLUMBIA UNIVERSITY IN THE CITY OF NEW YORK 10,530
18 | Real-time SEVIS Data from July 7, 2016
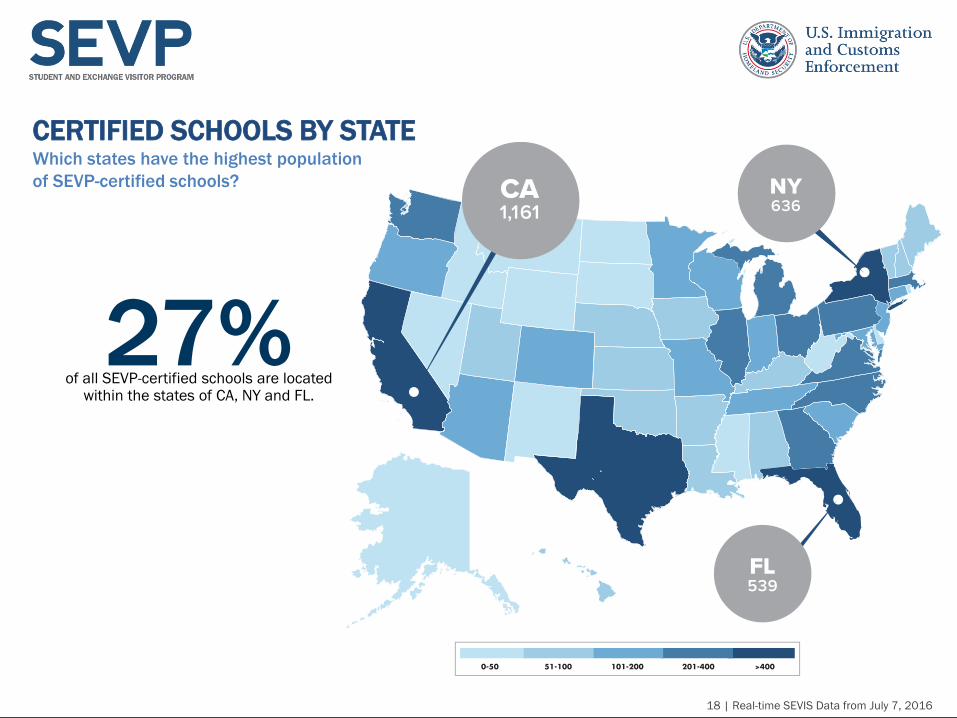
27% of all SEVP-certified schools are located
within the states of CA, NY and FL.
CERTIFIED SCHOOLS BY STATE Which states have the highest population
of SEVP-certified schools?

19 | Real-time SEVIS Data from July 7, 2016
LEVEL OF EDUCATION How many F & M students study at each level of education?
16% decrease in the number of
F & M students enrolled in language training programs since July 2015.
15% increase in the number of F & M
students enrolled in master’s programs since July 2015.
77% of F & M students are enrolled in bachelor’s, master’s or doctoral
programs.

* Continent information was compiled using the United Nation's composition of macro
geographical (continental) regions, geographical subregions, and selected economic
and other groupings. 20 | Real-time SEVIS Data from July 7, 2016
TOP MAJORS What are the most popular majors among
F & M students studying in the United States?
10% increase in the number of all F & M
students pursuing engineering degree programs since July 2015.
13% increase in the number of F & M
students pursuing mathematics and statistics degrees since July 2015.

STEM DATA
STEM FIELDS OF STUDY STEM programs are popular at American colleges and universities. Graduates from
these programs are important to innovation and job creation in the United States.
An F-1 and/or M-1 student can find STEM programs at all educational levels. Many
colleges and universities offer programs in these fields at both the undergraduate
and graduate levels. Community colleges also have a variety of STEM programs in
which a student may enroll.
STEM programs are classified according to the Classification of Instructional
Programs codes developed by the U.S. Department of Education's National
Center for Education Statistics.
22 | Real-time SEVIS Data from July 8, 2016

TOTAL # OF STEM AND ALL F & M STUDENTS, JULY 2016
STEM ALL F & M PERCENTAGE
IN STEM
F-1 & M-1 STUDENTS 466,964 1,112,554 42%
TOTAL # OF F & M STEM STUDENTS PER CONTINENT, JULY 2015-2016
CONTINENT JULY 2015 JULY 2016 % CHANGE
ASIA 348, 871 406,732 17%
AFRICA 17,200 18,682 9%
EUROPE 15,117 15,834 5%
NORTH AMERICA 14,324 14,891 4%
SOUTH AMERICA 8,842 9,738 10%
AUSTRALIA & PACIFIC
ISLANDS 954 1,087 14%
GRAND TOTAL 405,308 466,964 15%
* Continent information was compiled using the United Nation's composition of macro
geographical (continental) regions, geographical subregions, and selected economic
and other groupings. 23 | Real-time SEVIS Data from July 7, 2016
PERCENT OF F & M STEM STUDENTS IN THE
UNITED STATES PER CONTINENT
STEM STUDENTS, SCHOOLS AND FIELDS OF STUDY How many F & M STEM students are in the United States, and where are they from?

24 | Real-time SEVIS Data from July 7, 2016
PLACES OF ORIGIN A global view of each continent’s F & M
students that are in STEM fields
* Continent information was compiled using the United Nation's composition of macro
geographical (continental) regions, geographical subregions, and selected economic
and other groupings.

PLACES OF ORIGIN A closer look at Asian F & M STEM students
* Continent information was compiled using the United Nation's composition of macro
geographical (continental) regions, geographical subregions, and selected economic and
other groupings. 25 | Real-time SEVIS Data from July 7, 2016

26 | Real-time SEVIS Data from July 7, 2016
15% increase in the number of all F & M STEM students studying in TX since July 2015.
STEM STUDENTS BY STATE Which states host the largest population
of F & M STEM students?
TOP THREE STATES WITH LARGEST
PROPORTION OF STEM STUDENTS
STATE % of STEM STUDENTS
WYOMING 65%
SOUTH DAKOTA 62%
DELAWARE 56%
13% increase in the number of all F & M STEM students studying in NY since July 2015.
21% increase in the number of all F & M STEM students studying in CA since July 2015.

The following graphs show the
proportion of F & M STEM
male and female students
versus all F & M students from
each region of the world.
*Continent information was compiled using the United Nation's composition of macro
geographical (continental) regions, geographical subregions, and selected economic
and other groupings. 27 | Real-time SEVIS Data from July 7, 2016
STEM STUDENTS BY GENDER How many male F & M students are in STEM fields in the United States compared to females?
69% of F & M students studying STEM
fields in the United States are male. The continent with the greatest
percentage of female STEM students (38 percent) is North America and the one with the
greatest percentage of male STEM students (70 percent)
is Asia.

*Continent information was compiled using the United Nation's composition of macro
geographical (continental) regions, geographical subregions, and selected economic
and other groupings. 28 | Real-time SEVIS Data from July 7, 2016
TOP 10 STEM DEGREES What are the most popular majors among
F & M STEM students studying in the United States?
83% of all F & M students from India
pursue degrees in a STEM field; more STEM students are from India than
any other country.
68% of all F & M students who pursue
mathematics and statistics coursework are from China.

FOCUS ON: EUROPEAN STUDENTS
FAST FACTS ABOUT EUROPEAN STUDENTS
COMPARISON OF MALE /FEMALE STUDENTS
TOTAL
MALE
PERCENT OF
TOTAL MALE
TOTAL
FEMALE
PERCENT OF
TOTAL FEMALE
EUROPEAN
STUDENTS 41,935 52.0% 38,785 48.0%
REST OF THE
WORLD 594,785 57.7% 436,808 42.3%
TOP THREE STATES OF STUDY FOR EUROPEAN STUDENTS
STATE NUMBER OF STUDENTS PERCENT OF TOTAL
EUROPEAN STUDENTS
CALIFORNIA 15,205 18.8%
NEW YORK 13,438 16.6%
MASSACHUSETTS 6,843 8.5%
EUROPEAN STUDENTS BY REGION
REGION NUMBER OF STUDENTS PERCENT OF TOTAL
EUROPEAN STUDENTS
WESTERN EUROPE 22,922 28.4%
NORTHERN EUROPE 21,043 26.1%
SOUTHERN EUROPE 19,659 24.4%
EASTERN EUROPE 17,106 21.2%
30 | Real-time SEVIS Data from July 7, 2016
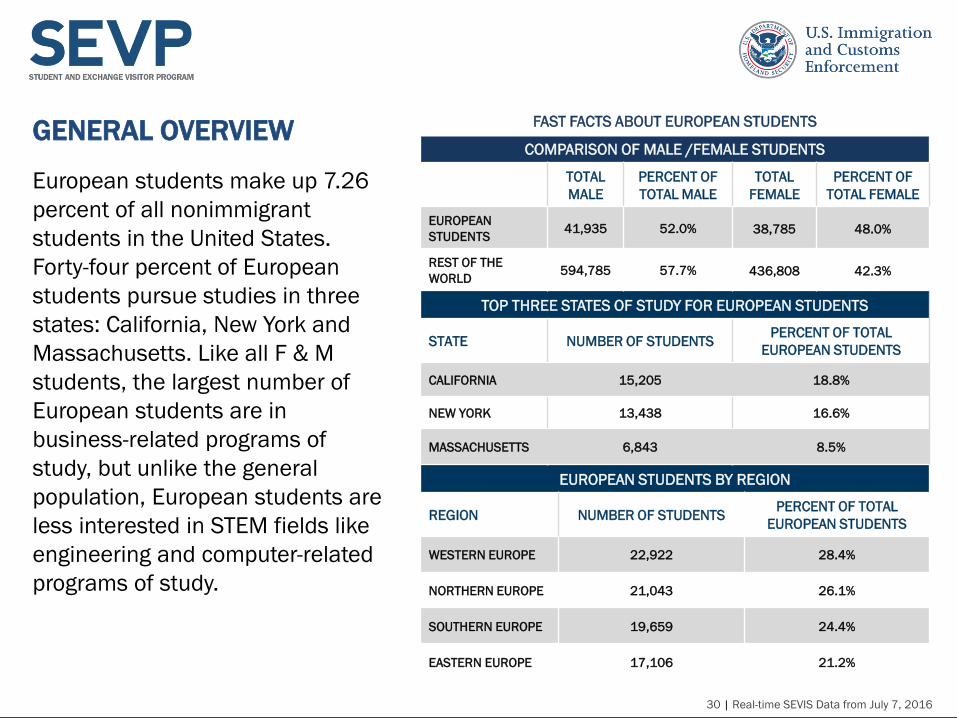
GENERAL OVERVIEW
European students make up 7.26
percent of all nonimmigrant
students in the United States.
Forty-four percent of European
students pursue studies in three
states: California, New York and
Massachusetts. Like all F & M
students, the largest number of
European students are in
business-related programs of
study, but unlike the general
population, European students are
less interested in STEM fields like
engineering and computer-related
programs of study.

31 | Real-time SEVIS Data from July 7, 2016
57% of all F & M European students are from the six
countries highlighted on the right: the
United Kingdom, France, Germany, Spain,
Russia and Italy.
A CLOSER LOOK AT EUROPE Which countries do European students come from? — July 2016 compared to July 2015
13% of all F & M European students are
from the United Kingdom.

Top
Majors for
Chinese
Students
32 | Real-time SEVIS Data from July 7, 2016
TOP MAJORS—EUROPEAN STUDENTS What are the most popular majors among European students who study in the United States?
22% of all F & M European students
pursue programs of study in one major: business, management, marketing, and related support
services. The next most popular major is basic skills and developmental/
remedial education.