student and exchange visitor … is the student and exchange visitor information system (sevis)?...
TRANSCRIPT
STUDENT AND EXCHANGE VISITOR
INFORMATION SYSTEM GENERAL SUMMARY QUARTERLY
REVIEW
TABLE OF CONTENTS
I. INTRODUCTION: What is the Student and Exchange
Visitor Information System (SEVIS)?
II. DEFINITIONS: What Do These Terms Mean?
III. GENERAL OVERVIEW: School and Nonimmigrant
Student Data
IV. STUDENTS: F-1 and M-1 Nonimmigrant Student Data
V. SCHOOLS: SEVP-Certified Schools Data
3
5
6
7
14
WHAT IS THE STUDENT AND EXCHANGE
VISITOR INFORMATION SYSTEM (SEVIS)?
SEVIS came online in 2003 to track and monitor the status and activities of
nonimmigrant students and exchange visitors who enter the United States. This
web-based system collects real-time information on nonimmigrant students,
exchange visitors, approved schools, and program sponsors. SEVIS also retains
information on Exchange Visitor Program sponsors and visitors that are approved by
the Department of State (DoS).
3 | Data from January 15, 2014
WHAT IS SEVIS BY THE NUMBERS?
SEVIS by the Numbers is a statistical summary report produced using data
compiled from SEVIS. This report provides a snap-shot of relevant and useful
information and is used as a resource by a variety of SEVP stakeholders and
partner agencies.
This quarterly review is based on information retrieved on January 15, 2014. As
SEVIS is a real-time database, exact numbers within this review were accurate as of
the date retrieved.
4 | Data from January 15, 2014
DEFINITIONS
• Student and Exchange Visitor Program (SEVP) – acts as a bridge for government
organizations that have an interest in information on nonimmigrants whose
primary reason for coming to the United States is to be students. SEVP
manages schools, nonimmigrant students in the F and M visa classifications
and their dependents.
• F-1 nonimmigrant students – nonimmigrant students coming to the United
States to pursue a full course of academic study in SEVP-certified schools.
• M-1 nonimmigrant students – nonimmigrant nationals pursuing a full course of
study at an SEVP-certified vocational or other recognized nonacademic
institution (other than in language training programs) in the United States.
• J-1 exchange visitors – nonimmigrants approved to participate in work-and
study-based exchange visitor programs.
5 | Data from January 15, 2014
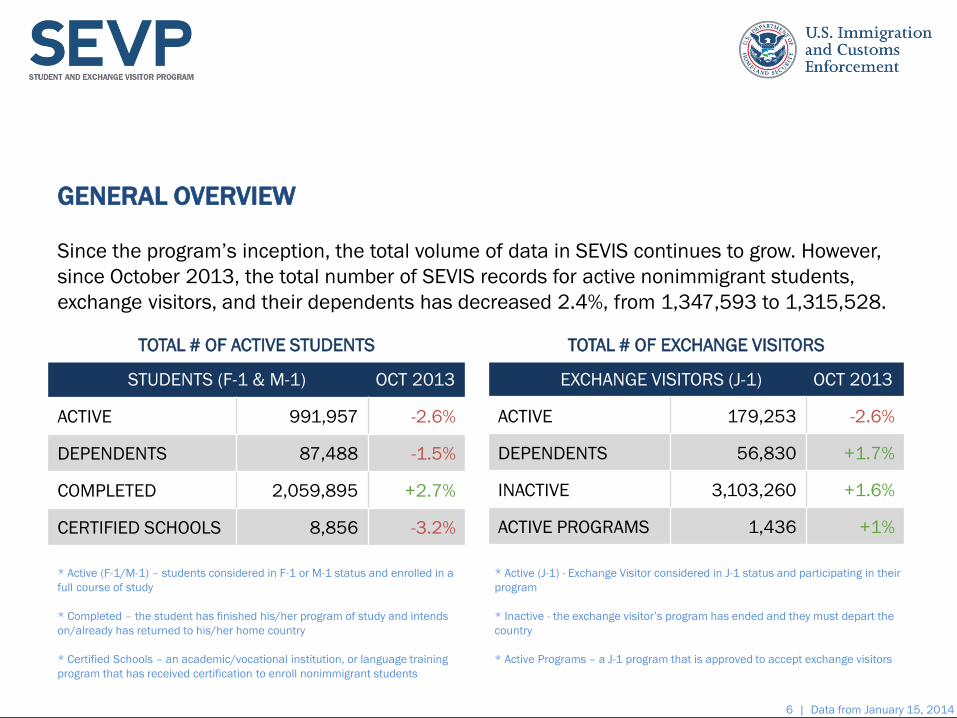
GENERAL OVERVIEW
Since the program’s inception, the total volume of data in SEVIS continues to grow. However,
since October 2013, the total number of SEVIS records for active nonimmigrant students,
exchange visitors, and their dependents has decreased 2.4%, from 1,347,593 to 1,315,528.
* Active (F-1/M-1) – students considered in F-1 or M-1 status and enrolled in a
full course of study
* Completed – the student has finished his/her program of study and intends
on/already has returned to his/her home country
* Certified Schools – an academic/vocational institution, or language training
program that has received certification to enroll nonimmigrant students
* Active (J-1) - Exchange Visitor considered in J-1 status and participating in their
program
* Inactive - the exchange visitor’s program has ended and they must depart the
country
* Active Programs – a J-1 program that is approved to accept exchange visitors
TOTAL # OF ACTIVE STUDENTS
STUDENTS (F-1 & M-1) OCT 2013
ACTIVE 991,957 -2.6%
DEPENDENTS 87,488 -1.5%
COMPLETED 2,059,895 +2.7%
CERTIFIED SCHOOLS 8,856 -3.2%
TOTAL # OF EXCHANGE VISITORS
EXCHANGE VISITORS (J-1) OCT 2013
ACTIVE 179,253 -2.6%
DEPENDENTS 56,830 +1.7%
INACTIVE 3,103,260 +1.6%
ACTIVE PROGRAMS 1,436 +1%
6 | Data from January 15, 2014
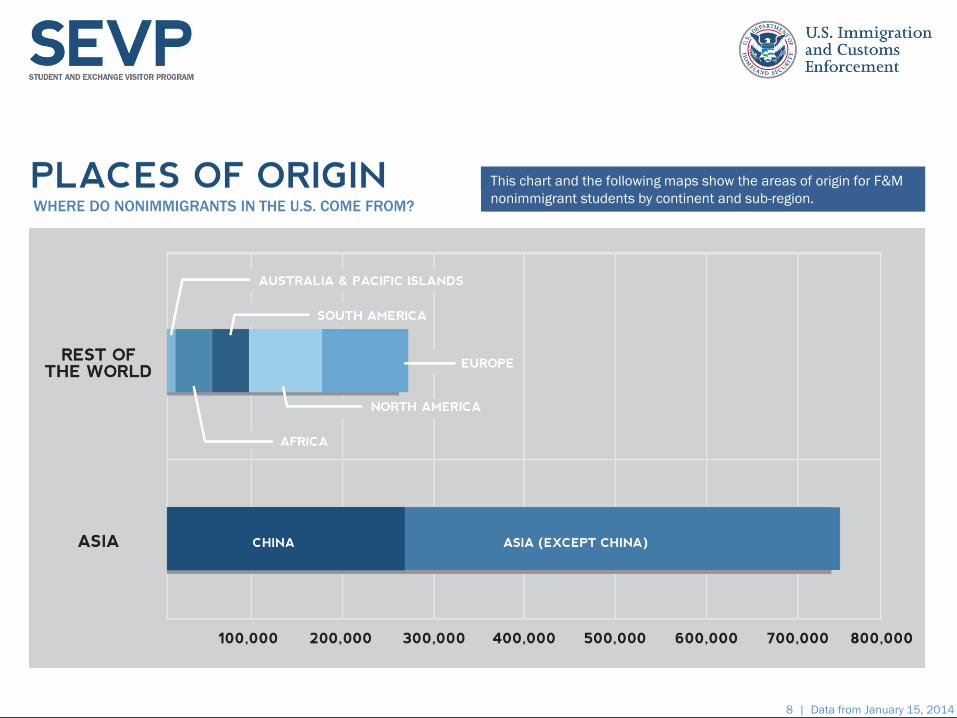
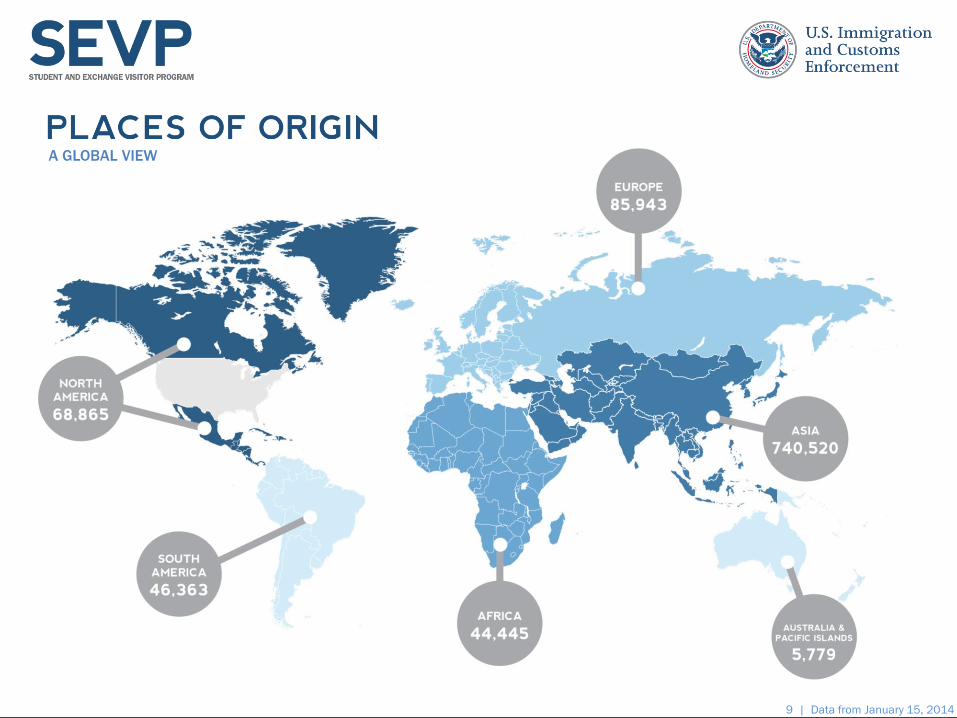
This chart and the following maps show the areas of origin for F&M
nonimmigrant students by continent and sub-region.
8 | Data from January 15, 2014
WHERE DO NONIMMIGRANTS IN THE U.S. COME FROM?
9 | Data from January 15, 2014
A GLOBAL VIEW
10 | Data from January 15, 2014
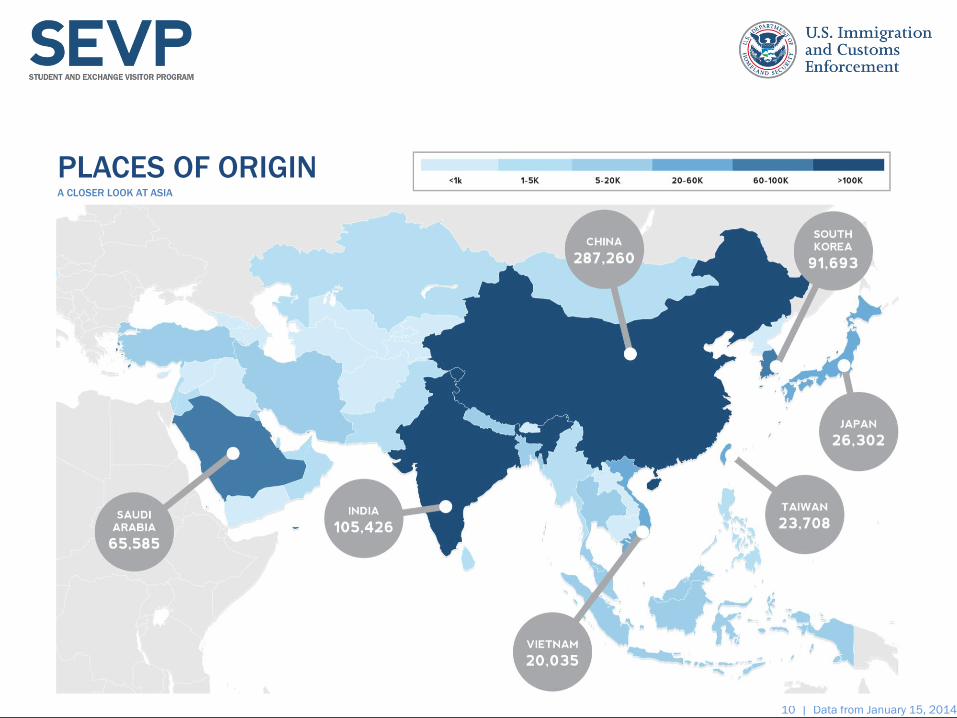
PLACES OF ORIGIN A CLOSER LOOK AT ASIA
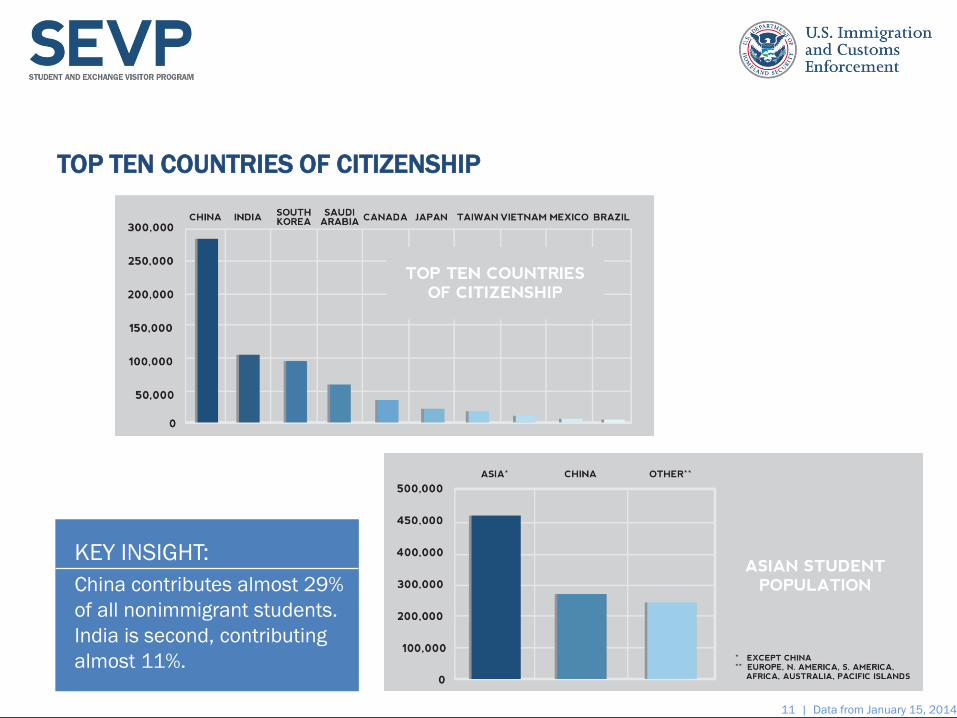
TOP TEN COUNTRIES OF CITIZENSHIP
KEY INSIGHT:
China contributes almost 29%
of all nonimmigrant students.
India is second, contributing
almost 11%.
11 | Data from January 15, 2014
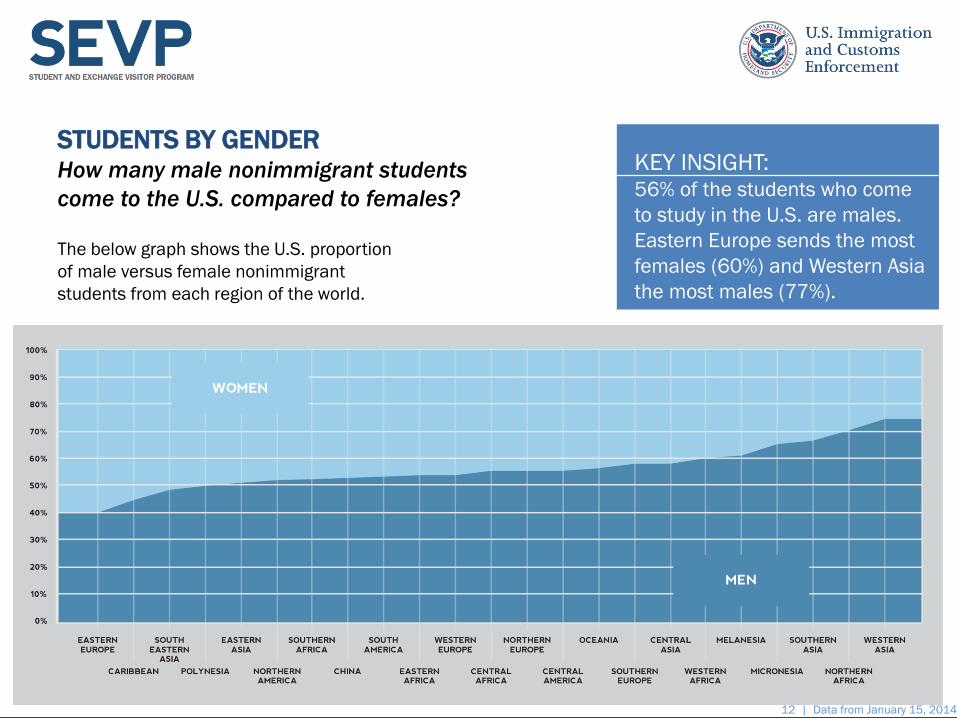
STUDENTS BY GENDER How many male nonimmigrant students
come to the U.S. compared to females?
The below graph shows the U.S. proportion
of male versus female nonimmigrant
students from each region of the world.
KEY INSIGHT: 56% of the students who come
to study in the U.S. are males.
Eastern Europe sends the most
females (60%) and Western Asia
the most males (77%).
12 | Data from January 15, 2014
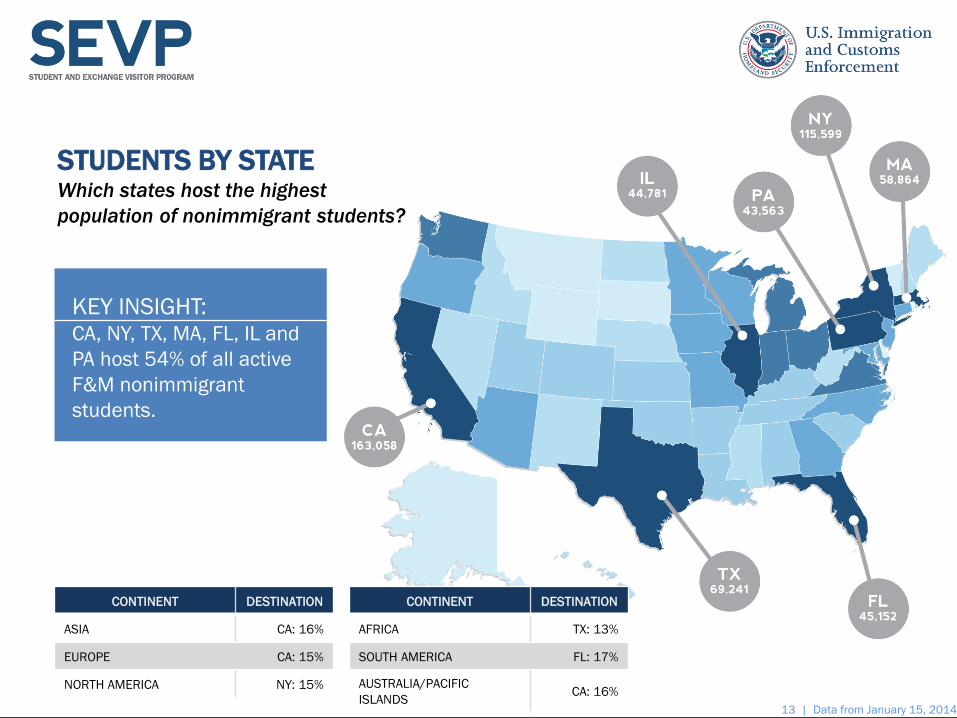
STUDENTS BY STATE Which states host the highest
population of nonimmigrant students?
CONTINENT DESTINATION
ASIA CA: 16%
EUROPE CA: 15%
NORTH AMERICA NY: 15%
KEY INSIGHT: CA, NY, TX, MA, FL, IL and
PA host 54% of all active
F&M nonimmigrant
students.
CONTINENT DESTINATION
AFRICA TX: 13%
SOUTH AMERICA FL: 17%
AUSTRALIA/PACIFIC
ISLANDS CA: 16%
13 | Data from January 15, 2014
84%
10%
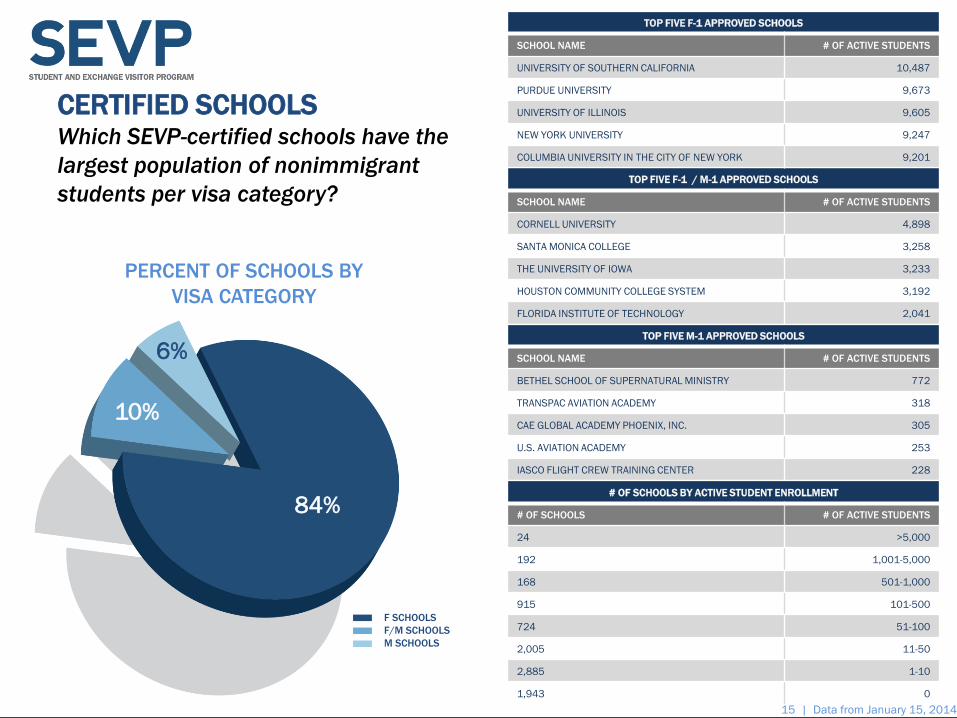
CERTIFIED SCHOOLS Which SEVP-certified schools have the
largest population of nonimmigrant
students per visa category? TOP FIVE F-1 / M-1 APPROVED SCHOOLS
SCHOOL NAME # OF ACTIVE STUDENTS
CORNELL UNIVERSITY 4,898
SANTA MONICA COLLEGE 3,258
THE UNIVERSITY OF IOWA 3,233
HOUSTON COMMUNITY COLLEGE SYSTEM 3,192
FLORIDA INSTITUTE OF TECHNOLOGY 2,041
TOP FIVE F-1 APPROVED SCHOOLS
SCHOOL NAME # OF ACTIVE STUDENTS
UNIVERSITY OF SOUTHERN CALIFORNIA 10,487
PURDUE UNIVERSITY 9,673
UNIVERSITY OF ILLINOIS 9,605
NEW YORK UNIVERSITY 9,247
COLUMBIA UNIVERSITY IN THE CITY OF NEW YORK 9,201
TOP FIVE M-1 APPROVED SCHOOLS
SCHOOL NAME # OF ACTIVE STUDENTS
BETHEL SCHOOL OF SUPERNATURAL MINISTRY 772
TRANSPAC AVIATION ACADEMY 318
CAE GLOBAL ACADEMY PHOENIX, INC. 305
U.S. AVIATION ACADEMY 253
IASCO FLIGHT CREW TRAINING CENTER 228
# OF SCHOOLS BY ACTIVE STUDENT ENROLLMENT
# OF SCHOOLS # OF ACTIVE STUDENTS
24 >5,000
192 1,001-5,000
168 501-1,000
915 101-500
724 51-100
2,005 11-50
2,885 1-10
1,943 0
PERCENT OF SCHOOLS BY
VISA CATEGORY
15 | Data from January 15, 2014
84%
6%
10%
F SCHOOLS
F/M SCHOOLS
M SCHOOLS
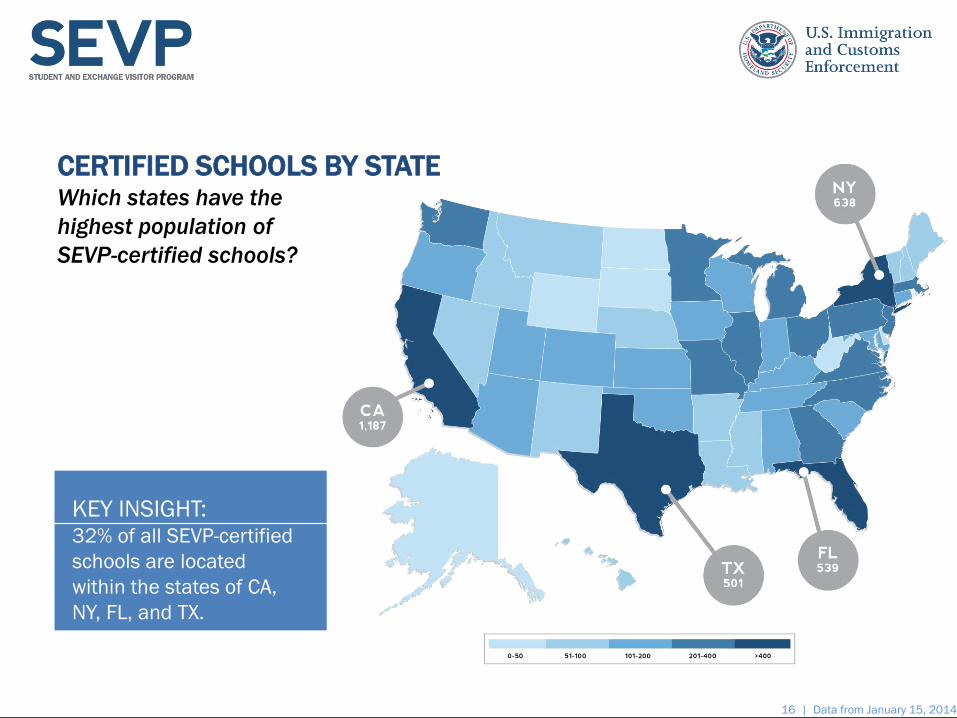
CERTIFIED SCHOOLS BY STATE Which states have the
highest population of
SEVP-certified schools?
KEY INSIGHT: 32% of all SEVP-certified
schools are located
within the states of CA,
NY, FL, and TX.
16 | Data from January 15, 2014
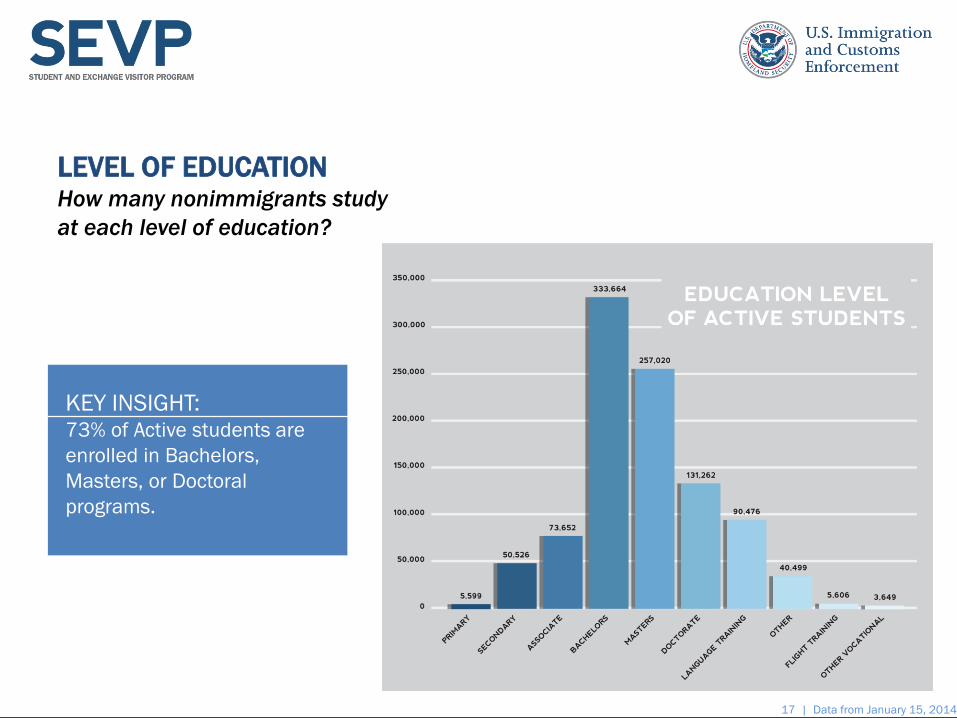
LEVEL OF EDUCATION How many nonimmigrants study
at each level of education?
KEY INSIGHT: 73% of Active students are
enrolled in Bachelors,
Masters, or Doctoral
programs.
17 | Data from January 15, 2014
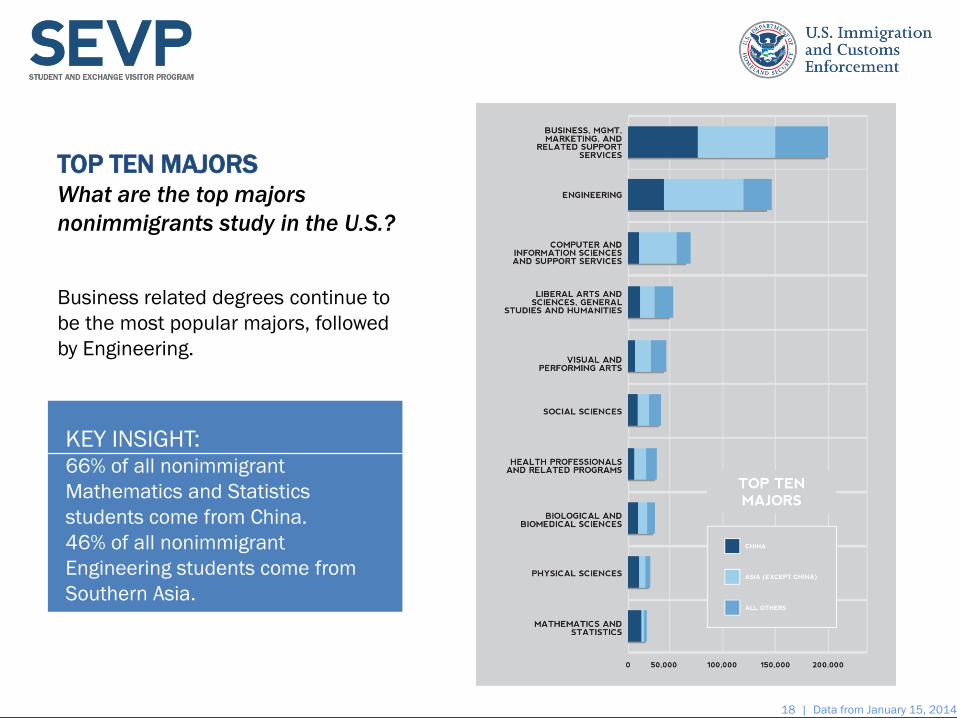
TOP TEN MAJORS What are the top majors
nonimmigrants study in the U.S.?
Business related degrees continue to
be the most popular majors, followed
by Engineering.
KEY INSIGHT: 66% of all nonimmigrant
Mathematics and Statistics
students come from China.
46% of all nonimmigrant
Engineering students come from
Southern Asia.
18 | Data from January 15, 2014