student mobility patterns and achievement in wisconsin · student mobility patterns and achievement...
TRANSCRIPT

Student Mobility Patterns and Achievement in Wisconsin
Prepared for the Wisconsin Department of Public Instruction
By Selina Eadie Ryan Eisner Bryan Miller
Leni Wolf
Workshop in Public Affairs Robert M. La Follette School of Public Affairs
Spring 2013

©2013 Board of Regents of the University of Wisconsin System
All rights reserved.
For additional copies: Publications Office
La Follette School of Public Affairs 1225 Observatory Drive, Madison, WI 53706
www.lafollette.wisc.edu/publications/workshops.html [email protected]
The Robert M. La Follette School of Public Affairs is a teaching and research department
of the University of Wisconsin–Madison. The school takes no stand on policy issues; opinions expressed in these pages reflect the views of the authors.
The University of Wisconsin–Madison is an equal opportunity and affirmative-action educator and employer.
We promote excellence through diversity in all programs.

iii
Table of Contents
List of Tables ........................................................................................................ iv Foreword ................................................................................................................ v Acknowledgments ............................................................................................... vii Executive Summary ............................................................................................. ix Introduction ........................................................................................................... 1 Background on Mobility ...................................................................................... 1
Existing Research ............................................................................................... 2 Nationally representative findings .................................................................. 2 State-specific trends ........................................................................................ 4
Motivation ........................................................................................................... 5 Overview of the Data ............................................................................................ 5
Methodology ....................................................................................................... 7 Description of Mobility Trends.......................................................................... 10
Demographics of Movers .................................................................................. 10 Moves by race/ethnicity ................................................................................ 10 Moves by homeless status ............................................................................. 12 Moves by economically disadvantaged status .............................................. 12 Moves by English language learner status .................................................... 13
Timing of Moves .............................................................................................. 14 Origin and Destination of Moves ...................................................................... 14
Statewide intra- and inter-district moves ...................................................... 14 Moves within the five largest Wisconsin districts ........................................ 17 Moves out of the five largest Wisconsin districts ......................................... 19
Achievement and Performance of Mobile Students ........................................ 25 Moves and Graduation ...................................................................................... 25 Prior-Year Moves and Test Scores ................................................................... 25 Cumulative Moves and Test Scores .................................................................. 26
Modeling the Association between Mobility and Achievement ...................... 27 Mobility-Related Policy Considerations ........................................................... 32
Communication with Families .......................................................................... 32 Information and Record-keeping Systems ........................................................ 32 Training and Technical Assistance ................................................................... 33 Funding Mechanisms and Sources ................................................................... 33 Accountability ................................................................................................... 33
Conclusion ........................................................................................................... 34 Appendix A: Technical Appendix ..................................................................... 35
Accounting for Incorrect Enroll and Exit Dates ............................................... 35 Generating “Majority District” ......................................................................... 35 Definition of a School Year .............................................................................. 36
Works Cited ......................................................................................................... 37
iv
List of Tables
Table 1: Comparison between Cohorts and All Students in WSLS (2005-06 through 2010-11) .................................................................... 9
Table 2: Cohort Member Moves by Race/Ethnicity ............................................. 11 Table 3: Cohort Member Moves by Homeless Status .......................................... 12 Table 4: Cohort Member Moves by Economically Disadvantaged
Status .................................................................................................... 13 Table 5: Cohort Member Moves by English Language Learner Status ................ 13 Table 6: Total Weighted Moves by Time of Year ................................................ 14 Table 7: Cohort Member Intra- and Inter-District Moves .................................... 15 Table 8: Districts with High Numbers of Students with Two or More
Intra-District Moves ............................................................................. 16 Table 9: Districts with High Numbers of Students with Three or More
Intra-District Moves ............................................................................. 16 Table 10: Cohort Member Moves in the 5 Largest Wisconsin School
Districts ................................................................................................ 18 Table 11: Top Receiving Districts from Milwaukee Public Schools ................... 20 Table 12: Top Receiving Districts from Madison Metropolitan School
District .................................................................................................. 21 Table 13: Top Receiving Districts from Green Bay Area Public
School District ...................................................................................... 22 Table 14: Top Receiving Districts from Racine Unified School
District .................................................................................................. 23 Table 15: Top Receiving Districts from Kenosha Unified School
District .................................................................................................. 24 Table 16: Total Moves by Graduation Status in 2010-11 ..................................... 25 Table 17: Prior Year Moves & Tenth-Grade Test Scores, 2010-11 ..................... 26 Table 18: Cumulative Moves & Tenth-Grade Test Scores, 2010-11 ................... 26 Table 19: Regression Results of Mobility on Reading Scores ............................. 30 Table 20: Regression Results of Mobility on Math Scores .................................. 31 Table A1: Majority District Example ................................................................... 36

v
Foreword
This report is the result of collaboration between the Robert M. La Follette School of Public Affairs at the University of Wisconsin–Madison and the Wisconsin Department of Public Instruction (henceforth the DPI). Our objective is to provide graduate students at La Follette the opportunity to improve their policy analysis skills while contributing to the capacity of the DPI to improve the quality of public education in Wisconsin.
The La Follette School offers a two-year graduate program leading to a master’s degree in public affairs. Students study policy analysis and public management, and they can choose to pursue a concentration in a policy focus area. They spend the first year-and-a-half of the program taking courses in which they develop the expertise needed to analyze public policies.
The authors of this report are all in their last semester of their degree program and are enrolled in Public Affairs 869: Workshop in Public Affairs. Although acquiring a set of policy analysis skills is important, there is no substitute for doing policy analysis as a means of learning policy analysis. Public Affairs 869 gives graduate students that opportunity.
This year the students in the workshop were divided into six teams. One other team completed a project for the DPI, and the other teams completed projects for the Division of Budget and Management of the City of Milwaukee; the Wisconsin Department of Children and Families and the Department of Health Services; the Wisconsin Department of Revenue; and the Wisconsin Legislative Council. After soliciting possible research ideas from throughout the DPI, Superintendent of Public Instruction Tony Evers chose the topic of this report.
A number of public school students in Wisconsin change schools relatively frequently. A body of research suggests that frequent moves are detrimental to students’ academic progress. Using enrollment data from the DPI, this report provides a detailed analysis of student mobility in Wisconsin and begins to assess the links between student mobility and academic achievement.
This report would not have been possible without the support and encouragement of Jared Knowles, the project liaison at the DPI. A number of other people contributed to the success of the report. Their names are listed in the report’s acknowledgments.
The report also benefited greatly from the support of the staff of the La Follette School. Marjorie Matthews contributed logistic support and Karen Faster, the La Follette publications director, edited and managed production of the final bound and online document.
By involving La Follette students in the tough issues confronting state governments, I hope they not only have learned a great deal about doing policy

vi
analysis but have gained an appreciation of the complexities and challenges facing state government in Wisconsin and elsewhere. I also hope that this report will contribute to the policymaking process at the Department of Public Instruction.
Andrew Reschovsky May 2013
Madison, Wisconsin

vii
Acknowledgments
We are grateful for the guidance we were given in conducting this analysis. We would like to thank Jared Knowles from the Wisconsin Department of Public Instruction for providing us with data, valuable background information, and suggestions. We are extremely grateful to Russell Dimond, Statistical Computing Specialist at the University of Wisconsin-Madison, for sharing his technical expertise and assistance with statistical software. We would also like to thank Jed Richardson from the Wisconsin Center for Education Research for his helpful suggestions and expertise in this area. Finally, we would like to thank Professor Andrew Reschovsky for providing us with thoughtful comments throughout the process.

viii

ix
Executive Summary
Over the past few decades, student mobility and its potential impact on student achievement have become a concern to local, state, and federal education agencies. Current research suggests that student mobility, which this report defines as students switching schools outside of the natural progression of their academic career, affects academic outcomes.
Although the effect of mobility has been thoroughly explored at the national level, no research has examined student mobility trends across Wisconsin. The Wisconsin Department of Public Instruction asked the authors to analyze statewide administrative data to (1) describe mobility-related trends within Wisconsin and (2) determine the association these moves may have with students’ academic performance.
Using a cohort analysis, we find that roughly 36 percent of all Wisconsin students made at least one move between the 2006-07 and 2010-11 school years. However, this mobility is not evenly distributed throughout the state. Approximately 65 percent of students in Milwaukee and 52 percent of students in Racine made these types of moves. Additionally, 63 percent of black students and 44 percent of Hispanic students experienced at least one move outside their natural academic progression. Conversely, 29 percent of white students experienced this type of move.
We also find that moving is a negative factor in students’ achievement on statewide standardized tests. We subsequently employ several ordinary least squares regressions, which determine that moves are a statistically significant and negative predictor of tenth-grade students’ reading and math scores on the Wisconsin Knowledge and Concepts Examination (WKCE). This relationship holds true when controlling for race, free or reduced-price lunch status, homeless status, and school district. These results suggest mobility is another hurdle some students must clear to succeed academically. We conclude with a set of policy questions to consider when creating potential strategies to address mobility.

x

1
Introduction
Policymakers, district administrators, and educators are increasingly concerned about the potential harm that changing schools, or student mobility, may have on students’ academic achievement. Student mobility refers to any movement between schools for reasons other than grade promotion. Several researchers find that changing schools, particularly mid-year, can have deleterious effects on students’ academic outcomes (Burkam et al. 2009; Grigg 2012; Hanushek et al. 2004; Voight et al. 2012). Researchers also find that differential achievement rates between mobile and non-mobile students are often associated with socioeconomic status and race. Despite the prevalence of mobility-related research, little is known about mobility among students in Wisconsin or the associations it has with achievement.
Responding to a request from the Wisconsin Department of Public Instruction (henceforth the DPI), we analyze mobility patterns and the relationship between student mobility and academic achievement in the state. This report draws on a DPI dataset that tracks student-specific enrollments and exits for all public school attendees in Wisconsin from the 2006-2007 to the 2010-2011 school year. Using this information, we identify major trends in student mobility.
We begin by discussing the mobility literature, which examines different outcomes of student mobility associated with various student characteristics. The literature review also addresses the difficulty of determining whether mobility impedes student achievement or whether confounding factors influence mobility and achievement. Next, we describe mobile students in the state to illustrate the demographic characteristics of movers as well as the timing and location of their moves throughout the state. We subsequently link mobility patterns and student test scores to better understand the potential relationship between mobility and achievement. Finally, our analysis identifies policy questions for the DPI to consider in the creation of mobility-related policies.
Previous analyses of student mobility have studied sample populations across the nation or particular regions (Rumberger 2002), but our analysis will be the first to examine student mobility throughout Wisconsin. We hope this report contributes to the DPI’s understanding of Wisconsin mobility trends so policymakers can address mobility-related concerns.
Background on Mobility
Most students change schools at least once (excluding changes due to grade promotion) over the course of their elementary and secondary careers (Rumberger 2002). Students may attend a new school for a variety of reasons. Some students move because their family relocates. These family moves may occur because of a parental job change or because the family is forced to move due to rising rent or home foreclosure. Moves may also be unrelated to residential changes. For
2
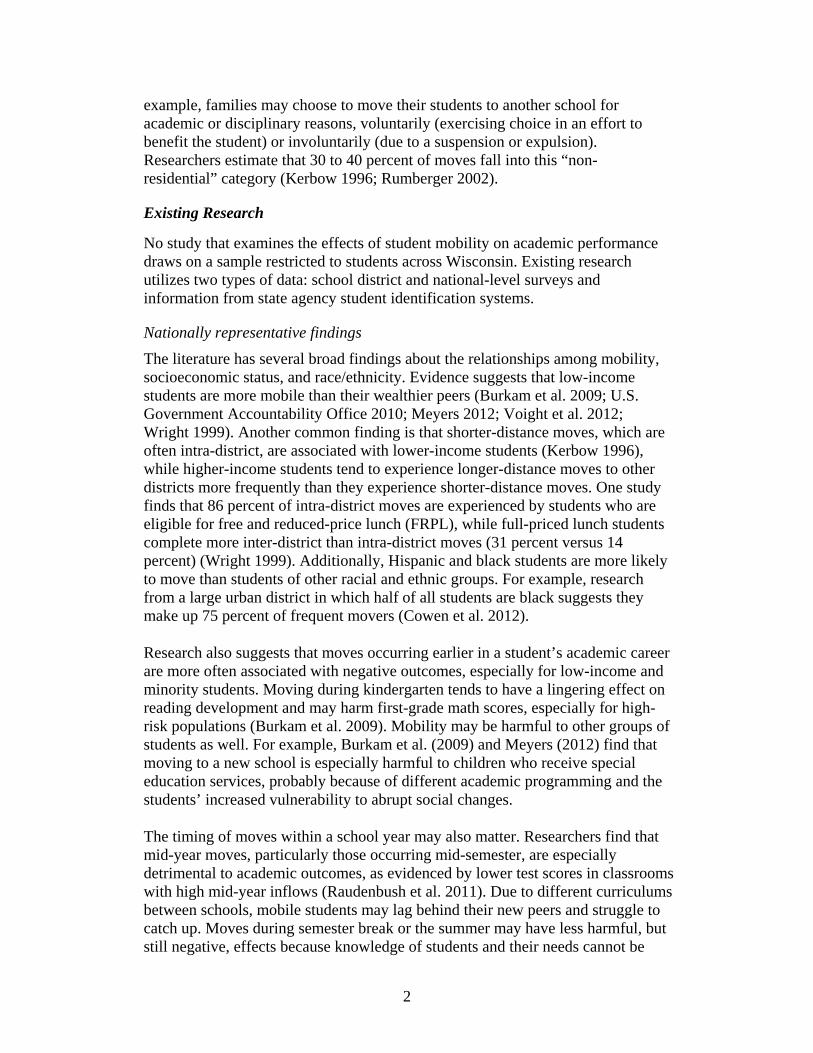
example, families may choose to move their students to another school for academic or disciplinary reasons, voluntarily (exercising choice in an effort to benefit the student) or involuntarily (due to a suspension or expulsion). Researchers estimate that 30 to 40 percent of moves fall into this “non-residential” category (Kerbow 1996; Rumberger 2002).
Existing Research
No study that examines the effects of student mobility on academic performance draws on a sample restricted to students across Wisconsin. Existing research utilizes two types of data: school district and national-level surveys and information from state agency student identification systems.
Nationally representative findings
The literature has several broad findings about the relationships among mobility, socioeconomic status, and race/ethnicity. Evidence suggests that low-income students are more mobile than their wealthier peers (Burkam et al. 2009; U.S. Government Accountability Office 2010; Meyers 2012; Voight et al. 2012; Wright 1999). Another common finding is that shorter-distance moves, which are often intra-district, are associated with lower-income students (Kerbow 1996), while higher-income students tend to experience longer-distance moves to other districts more frequently than they experience shorter-distance moves. One study finds that 86 percent of intra-district moves are experienced by students who are eligible for free and reduced-price lunch (FRPL), while full-priced lunch students complete more inter-district than intra-district moves (31 percent versus 14 percent) (Wright 1999). Additionally, Hispanic and black students are more likely to move than students of other racial and ethnic groups. For example, research from a large urban district in which half of all students are black suggests they make up 75 percent of frequent movers (Cowen et al. 2012).
Research also suggests that moves occurring earlier in a student’s academic career are more often associated with negative outcomes, especially for low-income and minority students. Moving during kindergarten tends to have a lingering effect on reading development and may harm first-grade math scores, especially for high-risk populations (Burkam et al. 2009). Mobility may be harmful to other groups of students as well. For example, Burkam et al. (2009) and Meyers (2012) find that moving to a new school is especially harmful to children who receive special education services, probably because of different academic programming and the students’ increased vulnerability to abrupt social changes.
The timing of moves within a school year may also matter. Researchers find that mid-year moves, particularly those occurring mid-semester, are especially detrimental to academic outcomes, as evidenced by lower test scores in classrooms with high mid-year inflows (Raudenbush et al. 2011). Due to different curriculums between schools, mobile students may lag behind their new peers and struggle to catch up. Moves during semester break or the summer may have less harmful, but still negative, effects because knowledge of students and their needs cannot be
3
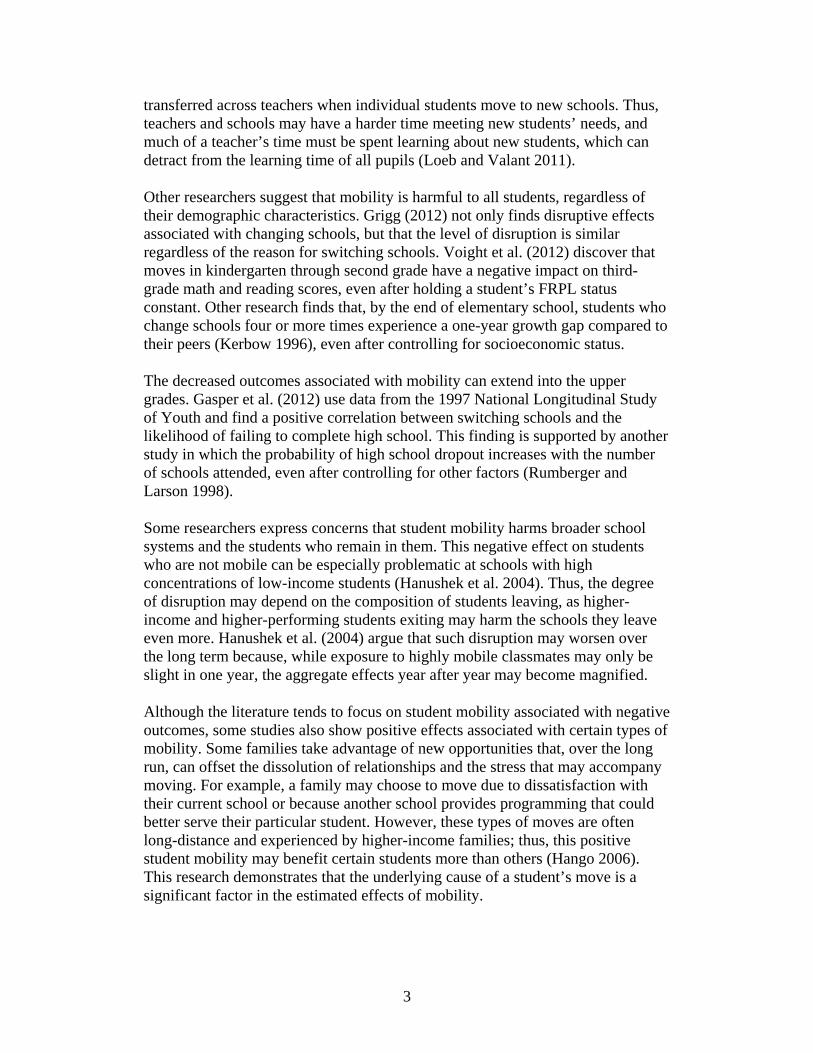
transferred across teachers when individual students move to new schools. Thus, teachers and schools may have a harder time meeting new students’ needs, and much of a teacher’s time must be spent learning about new students, which can detract from the learning time of all pupils (Loeb and Valant 2011).
Other researchers suggest that mobility is harmful to all students, regardless of their demographic characteristics. Grigg (2012) not only finds disruptive effects associated with changing schools, but that the level of disruption is similar regardless of the reason for switching schools. Voight et al. (2012) discover that moves in kindergarten through second grade have a negative impact on third-grade math and reading scores, even after holding a student’s FRPL status constant. Other research finds that, by the end of elementary school, students who change schools four or more times experience a one-year growth gap compared to their peers (Kerbow 1996), even after controlling for socioeconomic status.
The decreased outcomes associated with mobility can extend into the upper grades. Gasper et al. (2012) use data from the 1997 National Longitudinal Study of Youth and find a positive correlation between switching schools and the likelihood of failing to complete high school. This finding is supported by another study in which the probability of high school dropout increases with the number of schools attended, even after controlling for other factors (Rumberger and Larson 1998).
Some researchers express concerns that student mobility harms broader school systems and the students who remain in them. This negative effect on students who are not mobile can be especially problematic at schools with high concentrations of low-income students (Hanushek et al. 2004). Thus, the degree of disruption may depend on the composition of students leaving, as higher-income and higher-performing students exiting may harm the schools they leave even more. Hanushek et al. (2004) argue that such disruption may worsen over the long term because, while exposure to highly mobile classmates may only be slight in one year, the aggregate effects year after year may become magnified.
Although the literature tends to focus on student mobility associated with negative outcomes, some studies also show positive effects associated with certain types of mobility. Some families take advantage of new opportunities that, over the long run, can offset the dissolution of relationships and the stress that may accompany moving. For example, a family may choose to move due to dissatisfaction with their current school or because another school provides programming that could better serve their particular student. However, these types of moves are often long-distance and experienced by higher-income families; thus, this positive student mobility may benefit certain students more than others (Hango 2006). This research demonstrates that the underlying cause of a student’s move is a significant factor in the estimated effects of mobility.

4
The literature suggests a number of caveats. Specifically, we must address the question of causality related to mobility and student achievement. It is difficult to show that mobility causes poor academic outcomes, rather than mobility and poor outcomes resulting from other underlying concerns such as homelessness and other poverty-related issues. Rumberger (2002) and Wright (1999) suggest that poor school performance may precede moves rather than mobility contributing to poor academic achievement. Rumberger (2002) posits that because mobile students may have personal or family issues affecting their mobility, studies should consider such prior characteristics to more accurately determine whether mobility is in itself a cause of later decreases in achievement or whether certain family issues and characteristics that are correlated with mobility result in lower achievement. Wright (1999) adds that while mobility is likely a predictor of academic achievement, it may have a smaller influence on achievement than other factors such as ethnicity and family income.
State-specific trends
In addition to looking at national findings, reviewing research on Florida and North Carolina may be particularly useful because these states have comprehensive kindergarten-12th-grade data collection systems and may provide additional context for our own state-specific analysis (Knowles 2013). Similar to our Wisconsin dataset, these statewide databases contain information about student populations. Studies on Florida and North Carolina may also provide examples of potential variables of interest for our study.
Xu et al. (2009) show that North Carolina’s data reinforce many nationally representative mobility trends. In general, schools with higher percentages of minority and FRPL students tend to have higher rates of mobility. Students at these schools are more likely to experience intra-district moves, particularly due to negative reasons such as family disruption or job loss, both of which are more frequently associated with poor achievement outcomes. Additionally, North Carolina students from higher-income families are more likely to move between districts for positive reasons.
Dukes (2009) tells a similar story about mobile students in Florida. His study of longitudinal data focuses on children in kindergarten and third grade and counts the number of moves each child experiences in that time frame. Dukes finds that minority, English language learner (henceforth ELL), and FRPL students are more likely to experience one or more moves by the end of third grade. These students score below their more stable peers on standardized tests, and their overall proficiency drops as the number of moves increases. Students in the five largest urban districts in Florida are more likely to have experienced multiple moves than students in the five smallest rural districts.

5
Motivation
Our Wisconsin study has several goals. Milwaukee Public School (henceforth MPS) students historically experience lower achievement compared to other Wisconsin students. One hypothesis about the reason for this lower academic achievement is that the vast number of school choices offered to MPS families generates intra-district student mobility. Milwaukee students face myriad school selection options:
district-wide open enrollment within its boundaries,1 through which parents can choose almost any public school for their students and the district must provide busing;2
open enrollment in schools in the Milwaukee suburbs;3 charter schools operated by MPS, the University of Wisconsin–
Milwaukee, and the city of Milwaukee;4 and the Milwaukee Parental Choice Program,5 which provides vouchers to
low-income students to enroll at participating Milwaukee private schools.
Research suggests that high intra-district mobility is associated with larger negative academic effects than mobility between school districts (Kerbow 1996).
Although many factors (such as poverty) are associated with lower achievement, the contribution of student mobility remains understudied. By capturing Milwaukee-specific mobility trends, our report can provide the DPI with data-driven evidence about the potential causes of MPS’s academic underperformance.
We also wish to explore which regions of the state experience high rates of student mobility. While the media tend to focus on Milwaukee, we also look at other large districts to see if mobility trends are consistent.
Overview of the Data
The DPI provided us with four datasets with which to conduct our analysis, spanning the 2005-2006 to 2010-2011 school years. The first dataset contains information from the Wisconsin Student Number Locator System (henceforth WSLS), which includes student school enrollment and exit data. Each student is assigned an identification number when he or she first enrolls in a public school within Wisconsin, and this number follows the student as he or she enrolls in 1 Within-district open enrollment is referred to in MPS as the Three-Choice Enrollment Process (Milwaukee Public Schools n.d.). 2 This program is separate from Chapter 220, the Voluntary Student Transfer Program, which promotes racial integration by allowing minority students from MPS schools in which more than 30 percent of students are minorities to attend predominantly non-minority schools in suburban areas (Milwaukee Public Schools 2013). 3 1997 Wisconsin Act 27 (Rossmiller n.d.) 4 1993 Wisconsin Act 16; 1997 Wisconsin Act 27 (Merrifield 2011) 5 1989 Wisconsin Act 336 (Rossmiller n.d.)

6
different schools throughout the state. This identification number only applies to movement within public schools,6 so we are unable to track students who enroll in private schools7 or schools in other states. However, students maintain their unique IDs if and when they switch back to Wisconsin public schools from private or out-of-state schools. The WSLS dataset also contains basic student and school information, such as student name, date of birth, birthplace, gender, school, and district (Department of Public Instruction [DPI] n.d.). This information is modified when any changes occur. The database itself is run by the DPI’s central office, and school administrators use a remote login to enroll and exit students. Administrators are required to enroll new students and exit students within 14 days of any move. However, some schools also exit continuing students at the end of each school year and re-enroll them at the start of the subsequent year. To account for this inconsistency in the reporting of data, we devised a strategy detailed in Appendix A.
Our main variables of interest from the WSLS dataset are enrollment date, exit date, student date of birth, district number, and school number. These data allow us to calculate when and how often students move between schools, the number of times they move, and their length of enrollment at each school.
The second dataset we use is the Individual Student Enrollment System, which tracks student demographic information. The DPI collects the data from all public schools at the end of every school year, including race, gender, FRPL status, disciplinary history, special education status, limited English proficiency status, native language, and homeless status (DPI n.d.).
Next, we use the Wisconsin Student Assessment System (henceforth WSAS) to gather data about student academic testing outcomes. WSAS tracks students’ academic performance using the Wisconsin Knowledge and Concepts Examination (henceforth WKCE) and two alternatives: the Wisconsin Alternate Assessment for Students with Disabilities (also known as WAA-SwD) and the Assessing Comprehension and Communication in English State-to-State for English Language Learners (also known as ACCESS). All three assessments test students in reading and mathematics in grades 3 through 8 and grade 10, and in social studies, language arts, and science in grades 4, 8, and 10. The DPI and testing vendors jointly compile the WSAS dataset. The DPI submits student information to the vendor before the test, and the vendor then returns the test results and the student information in one dataset. In particular, our study uses the WSAS subject proficiency level and scale score variables to examine the relationship between student mobility and academic performance.
6 Students who attend public charter schools are included in the dataset, but students who receive publicly funded vouchers to attend private schools within the state through the Milwaukee Parental Choice Program are not included. 7 Total private school enrollment in Wisconsin as of February 2013 is 122,949 students (DPI 2013).
7
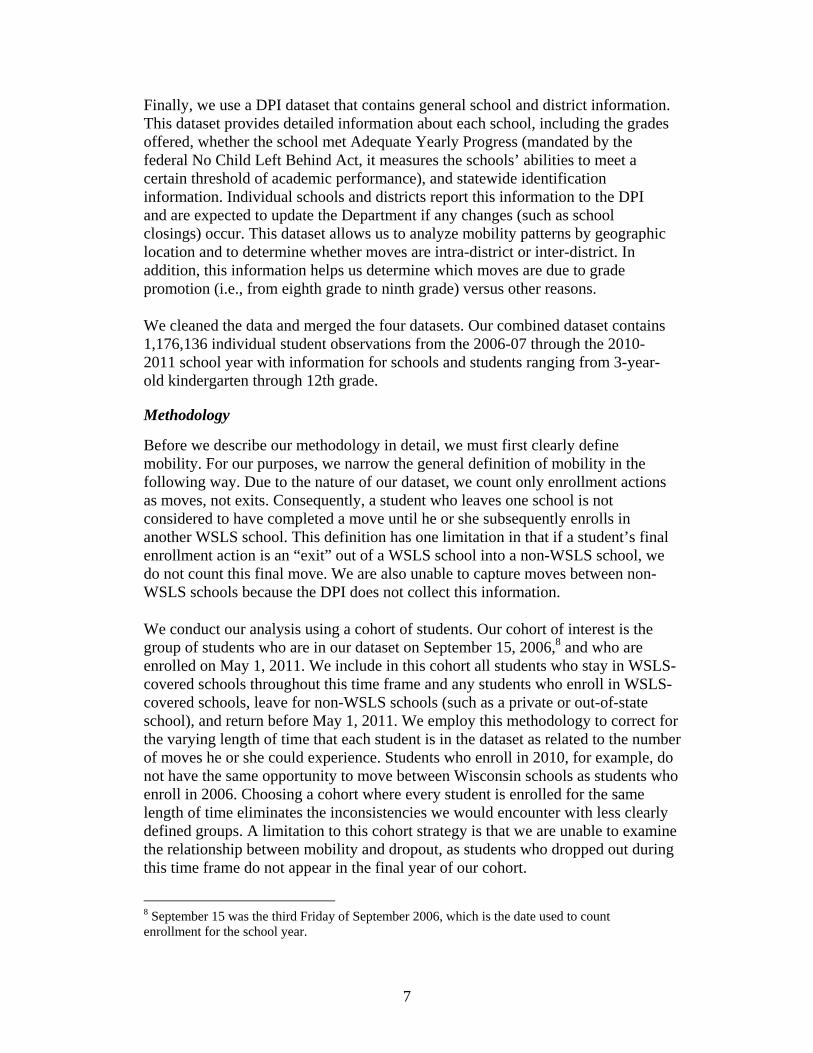
Finally, we use a DPI dataset that contains general school and district information. This dataset provides detailed information about each school, including the grades offered, whether the school met Adequate Yearly Progress (mandated by the federal No Child Left Behind Act, it measures the schools’ abilities to meet a certain threshold of academic performance), and statewide identification information. Individual schools and districts report this information to the DPI and are expected to update the Department if any changes (such as school closings) occur. This dataset allows us to analyze mobility patterns by geographic location and to determine whether moves are intra-district or inter-district. In addition, this information helps us determine which moves are due to grade promotion (i.e., from eighth grade to ninth grade) versus other reasons.
We cleaned the data and merged the four datasets. Our combined dataset contains 1,176,136 individual student observations from the 2006-07 through the 2010-2011 school year with information for schools and students ranging from 3-year-old kindergarten through 12th grade.
Methodology
Before we describe our methodology in detail, we must first clearly define mobility. For our purposes, we narrow the general definition of mobility in the following way. Due to the nature of our dataset, we count only enrollment actions as moves, not exits. Consequently, a student who leaves one school is not considered to have completed a move until he or she subsequently enrolls in another WSLS school. This definition has one limitation in that if a student’s final enrollment action is an “exit” out of a WSLS school into a non-WSLS school, we do not count this final move. We are also unable to capture moves between non-WSLS schools because the DPI does not collect this information.
We conduct our analysis using a cohort of students. Our cohort of interest is the group of students who are in our dataset on September 15, 2006,8 and who are enrolled on May 1, 2011. We include in this cohort all students who stay in WSLS-covered schools throughout this time frame and any students who enroll in WSLS-covered schools, leave for non-WSLS schools (such as a private or out-of-state school), and return before May 1, 2011. We employ this methodology to correct for the varying length of time that each student is in the dataset as related to the number of moves he or she could experience. Students who enroll in 2010, for example, do not have the same opportunity to move between Wisconsin schools as students who enroll in 2006. Choosing a cohort where every student is enrolled for the same length of time eliminates the inconsistencies we would encounter with less clearly defined groups. A limitation to this cohort strategy is that we are unable to examine the relationship between mobility and dropout, as students who dropped out during this time frame do not appear in the final year of our cohort.
8 September 15 was the third Friday of September 2006, which is the date used to count enrollment for the school year.

8
The restrictions applied to this cohort result in just more than 319,000 students being included in our analysis.
Students in our cohort look similar demographically to all students who appeared in WSLS from the 2005-06 through 2010-11 school years. Table 1 compares the characteristics of students in the cohort to all students across several dimensions. The largest discrepancy between the cohort and the overall student population is that a greater percentage of the cohort students are identified as economically disadvantaged9 at some point during the time period in our analysis (49.6 percent of the cohort versus 43.8 percent of the population). Also, white students make up a somewhat larger portion of our cohort (73.1 percent) than the overall population (68.6 percent). All other proportional measures vary by less than 2 percent in any given category.
Because our cohort restrictions eliminate more than two-thirds of the total population in our dataset, we also create a second cohort that verifies the robustness of our original cohort sample. This second cohort includes all students who are enrolled on the third Friday of the 2008-09 school year and are still enrolled on May 1, 2010. Summary demographic data for the second cohort are similar to our primary cohort and the population. Because the analyses performed on the second cohort are also consistent with those of the primary cohort, other analyses present only the results from our primary cohort.
9 We determine “economic disadvantage” by whether a student was eligible for free or reduced price lunch at any point from 2005-06 through 2010-11.

9
Table 1: Comparison between Cohorts and All Students in WSLS (2005‐06 through 2010‐11)
Population Primary Cohort Cohort 2
Race
Asian 3.7% 3.6% 3.7%
Black 10.8% 10.8% 10.1%
Hispanic 8.1% 8.2% 8.1%
Native American 1.4% 1.4% 1.5%
White 68.6% 73.1% 76.2%
Total Studentsa 1,176,136 319,230 683,148
Ever Homeless?
No 99.0% 98.7% 99.3%
Yes 1.0% 1.3% 0.7%
Total Studentsa 1,176,136 319,230 683,148
Ever Economically Disadvantaged?
No 56.2% 50.4% 60.0%
Yes 43.8% 49.6% 40.0%
Total Studentsa 1,176,136 319,230 683,148
Gender
Male 51.2% 51.5% 51.5%
Female 48.8% 48.5% 48.5%
Total Studentsa 1,088,403 310,189 679,303
English Language Proficientb
Yes 94.8% 94.1% 94.3%
No 5.2% 5.9% 5.7%
Total Studentsa 1,054,024 310,189 679,303
District of Majority Attendancec
Milwaukee 11.6% 9.9% 9.0%
Kenosha 3.1% 4.3% 2.9%
Racine 2.5% 2.7% 2.5%
Green Bay 2.9% 4.0% 2.7%
Madison 3.1% 2.9% 2.9%
Total Studentsa 1,176,136 319,230 683,148
Source: Authors’ calculations from DPI data aThe number of total students varies depending on the amount of information available for a given variable. The total number of students may be lower if values for individuals are missing. bWe determine English proficiency by whether a student received ELL assistance at any point captured in our dataset. cSee Appendix A for a description of how “majority district” is determined.
10
Description of Mobility Trends
Before linking achievement to mobility, we determine general trends about who moves and when moves occur. Overwhelmingly, the data demonstrate that certain types of students are highly mobile. These include minorities, ELL students, and students who are homeless or economically disadvantaged. Additionally, we find that students are more likely to move at certain times of year and that the largest districts experience higher-than-average mobility rates.
Demographics of Movers
Determining the impact of student mobility first requires identifying common characteristics of mobile students. We examine the demographic characteristics of students in our cohort to ascertain which traits are more closely associated with mobility. We examine each student’s race and ethnicity, homeless status, economic disadvantage, English language proficiency, and the school district attended most often.10 Though these demographic analyses only consider a single characteristic at a time without controlling for other factors, they nonetheless reveal several commonalities among our mobile cohort members.
Moves by race/ethnicity
On average, about 34 percent of students in our cohort experience at least one move, but there is extensive variation among racial and ethnic groups. As Table 2 indicates, white students move less frequently than any other group, with 28.6 percent moving one or more times. Asian-American students move at only slightly higher-than-average rates, with 37.6 percent moving at least once. A larger proportion of Hispanic and Native American students move, with 43.7 and 43.5 percent (respectively) experiencing at least one move. Black students move at much higher rates than any other group; 62.8 percent of black students in our cohort move at least once, a rate nearly double the overall average.
A racial disparity exists between highly mobile students, defined as experiencing five or more moves. Among all races in our cohort, 1.8 percent of students accumulate five or more moves. White students experience five or more moves at half the average rate (0.9 percent) and Asian-American students at even lower rates (0.7 percent). Hispanic students are frequent movers at slightly higher-than-average rates (2.1 percent). Native American students see much higher-than-average rates of high mobility, with 4.3 percent moving five or more times (more than double the overall average). Black students make up by far the largest group of highly mobile students; 7.3 percent of black students in our cohort move five or more times, a mobility rate that is more than quadruple the overall average. These statistics not only show that black, Hispanic, and Native American students are more likely to experience a move than their white and Asian-American peers, but they are also more likely to accumulate a greater number of moves during the time period in our sample. 10 See Appendix A for a description of how we determined the “majority district.”

11
Table 2: Cohort Member Moves by Race/Ethnicity
Moves Asian American Black Hispanic Native American White Entire Cohort
0 7,259 62.4% 12,872 37.2% 14,735 56.3% 2,605 56.5% 166,417 71.4% 205,500 64.4%
1 2,765 23.8% 8,232 23.8% 6,341 24.2% 851 18.5% 43,028 18.5% 64,225 20.1%
2 1,053 9.0% 5,604 16.2% 2,748 10.5% 510 11.1% 14,086 6.0% 25,936 8.1%
3 358 3.1% 3,321 9.6% 1,247 4.8% 289 6.3% 5,233 2.2% 11,565 3.6%
4 115 1.0% 2,038 5.9% 523 2.0% 163 3.5% 2,268 1.0% 5,701 1.8%
5 + 91 0.8% 2,504 7.2% 561 2.1% 193 4.2% 2,179 0.9% 6,303 2.0%
Total 11,641 100.0% 34,571 100.0% 26,155 100.0% 4,611 100.0% 233,211 100.0% 319,230 100.0%Note: Percentages may not add to 100 due to rounding.
Source: Authors’ calculations from DPI data

12
Moves by homeless status
The dataset also shows student mobility trends among the 4,189 homeless students in our cohort who have been reported as homeless at least once. This group of students moves much more frequently than the rest of the cohort. More than 78 percent of homeless students move at least once compared to 35.1 percent of all students in the cohort who have never been reported as homeless. In addition, 16.3 percent of homeless students move five or more times versus 1.9 percent of non-homeless students. This pattern demonstrates that mobility differences between homeless and non-homeless students are striking; homeless students in the cohort are, on average, much more mobile than their non-homeless peers. Table 3 compares moves by homeless cohort members to their non-homeless peers.
Table 3: Cohort Member Moves by Homeless Status
Moves Cohort Members Ever Homeless
Cohort Members Never Homeless
0 918 21.9% 204,582 64.9%
1 818 19.5% 63,407 20.1%
2 760 18.1% 25,176 8.0%
3 593 14.2% 10,972 3.5%
4 415 9.9% 5,286 1.7%
5 + 685 16.4% 5,618 1.8%
Total 4,189 100.0% 315,041 100.0%
Source: Authors’ calculations from DPI data
Moves by economically disadvantaged status
Administrators have identified more than 158,000 students in the cohort as economically disadvantaged at least once. About half (50.1 percent) of these students experience at least one move, and 26.6 percent experience multiple moves. These figures are much higher than the averages for all students in the cohort, and they are more than double the rate of mobility among students who have never been reported as economically disadvantaged. Additionally, 3.8 percent of economically disadvantaged students in our cohort move five or more times, compared to 0.2 percent of non-economically disadvantaged students, suggesting that economically disadvantaged students are considerably more mobile than their non-economically disadvantaged peers. See Table 4 for the full comparison between students who have and have not ever been reported as economically disadvantaged.

13
Table 4: Cohort Member Moves by Economically Disadvantaged Status
Moves Cohort Members Ever Economically Disadvantaged
Cohort Members Never Economically Disadvantaged
0 79,044 49.9% 126,456 78.6%
1 37,113 23.4% 27,112 16.8%
2 20,391 12.9% 5,545 3.4%
3 10,320 6.5% 1,245 0.8%
4 5,379 3.4% 322 0.2%
5 + 6,018 3.8% 285 0.2%
Total 158,265 100.0% 160,965 100.0% Note: Percentages may not add to 100 due to rounding.
Source: Authors’ calculations from DPI data
Moves by English language learner status
According to our data, ELL status, when considered on its own, appears to have little impact on student mobility. We identify students as either “Requires ELL Instruction” (i.e., students with an ELL score of 1 through 5) or “Native English Speaker/Fully Proficient” (ELL score of 6 or 7).
Table 5 shows that the mobility of students receiving ELL instruction is similar to the mobility patterns of students who are fully proficient or are native English speakers, with ELL students moving at least once at only slightly higher rates.
Table 5: Cohort Member Moves by English Language Learner Status
Moves Requires ELL Instruction
Native English Speaker/Fully Proficient
0 11,711 64.3% 192,177 65.8%
1 3,944 21.7% 57,273 19.6%
2 1,555 8.5% 22,446 7.7%
3 605 3.3% 9,843 3.4%
4 203 1.1% 4,904 1.7%
5 + 196 1.1% 5,332 1.8%
Total 18,214 100.0% 291,975 100.0%
Source: Authors’ calculations from DPI data

14
Timing of Moves
We are interested in the timing of student moves, primarily because moves that occur at different times of the year may have different effects on student performance. In particular, mid-year moves may be more disruptive to learning than moves that take place during summer break. To measure the prevalence of moves in each time of year, we calculate the total weighted number of moves by counting every move by every student as a unique instance rather than counting the number of students who move. For example, if four distinct students each move three times during summer breaks, we report 12 moves during summer breaks. With this method, we find that the 319,230 students in our cohort move a total of 292,085 times from 2005-06 to 2010-11.
More than 75 percent of the total moves by all students take place during the summer break. Few moves occur during the winter break, accounting for just 7.1 percent of the total moves. In our cohort, mid-year moves make up 17.3 percent of all moves by all students, suggesting that a sizable portion of students experience moves at these more disruptive times. These weighted totals are presented in Table 6.
Table 6: Total Weighted Moves by Time of Year
Time of Year Total Weighted Moves
Summer Break 220,915 75.6%
Winter Break 20,729 7.1%
Mid‐Year 50,441 17.3%
Total 292,085 100.0%
Source: Authors’ calculations from DPI data
Origin and Destination of Moves
We are interested not only in the characteristics of mobile students in Wisconsin, but also in how mobility patterns vary within and across districts. Students in rural districts, for example, may have more limited options for moving to new schools or changing school districts than students in more densely populated urban areas. In this section, we examine the location of moves in detail and pay special attention to determining how many moves occur within a given district (intra-district moves) as compared to moves that occur between different districts (inter-district moves).
Statewide intra- and inter-district moves
Research on mobility differentiates between student moves in which the receiving school is within the same district as the originating school and moves made to schools outside of the original district. We set out to determine the number of moves Wisconsin students make within their same district and to other districts.

15
In our cohort, students are much more likely to experience an intra-district move. Of the 113,730 students who move, 79.5 percent have at least one intra-district move, whereas only 33.7 percent move to a school outside their initial district. Table 7 contains more detailed information about the number of each type of move experienced by cohort members.
Table 7: Cohort Member Intra‐ and Inter‐District Moves
Intra‐District Moves
Number of Students
Inter‐District Moves
Number of Students
0 23,297 20.5% 0 75,349 66.3%
1 52,455 46.1% 1 23,663 20.8%
2 25,411 22.3% 2 8,821 7.8%
3 7,522 6.6% 3 3,188 2.8%
4 2,856 2.5% 4 1,374 1.2%
5 + 2,189 1.9% 5 + 1,335 1.2%
Total 113,730 100.0% Total 113,730 100.0% Note: Percentages may not add to 100 due to rounding.
Source: Authors’ calculations from DPI data
We also examine the districts that have the most students with multiple intra-district moves. Unsurprisingly, the ten districts with the most students experiencing two or more intra-district moves are the largest districts in the state (see Tables 8 and 9).
Larger districts have a greater number of schools, so students have more opportunities to make intra-district moves. Milwaukee, which is the state’s largest district, has the highest number of students with two or more intra-district moves. More than 37 percent of Milwaukee students in our cohort have two or more intra-district moves, and these students make up nearly 31 percent of statewide movers with two or more moves. Even more importantly, they make up 48 percent of the state’s students with three or more intra-district moves. A further examination of Milwaukee students reveals that few of them stay in the same school from 2006-07 to 2010-11. During this time frame, less than 4 percent of Milwaukee students in our cohort attend only one Milwaukee school.

16
Table 8: Districts with High Numbers of Students with Two or More Intra‐District Moves
District Number of
Students with 2+ Moves
Percentage of Students in
District with 2+ Moves
Percentage of Students in WI with 2+ Moves
(n=37,978)
Milwaukee 11,708 37.1% 30.8%
Racine 2,093 24.6% 5.5%
Kenosha 2,010 14.7% 5.3%
Green Bay 1,857 14.6% 4.9%
Madison 1,620 17.8% 4.3%
Appleton 810 16.4% 2.1%
Oshkosh Area 720 18.1% 1.9%
Sheboygan Area 710 17.6% 1.9%
Waukesha 644 13.9% 1.7%
Beloit 525 21.2% 1.4%
Total 22,697 59.8%
Source: Authors’ calculations from DPI data
Table 9: Districts with High Numbers of Students with Three or More Intra‐District Moves
District Number of
Students with 3+ Moves
Percentage of Students in
District with 3+ Moves
Percentage of Students in WI with 3+ Moves
(n=12,567)
Milwaukee 6,032 19.1% 48.0%
Racine 958 11.3% 7.6%
Green Bay 880 6.9% 7.0%
Kenosha 819 6.0% 6.5%
Madison 654 7.2% 5.2%
Sheboygan Area 214 5.3% 1.7%
Oshkosh Area 210 5.3% 1.7%
Appleton Area 199 4.0% 1.6%
Waukesha 199 4.3% 1.6%
Beloit 191 7.7% 1.5%
Total 10,356 82.4%
Source: Authors’ calculations from DPI data
17
Moves within the five largest Wisconsin districts
When all public Wisconsin districts are considered, 35.6 percent of students in the cohort move at least once, and 2 percent move five or more times. There is, however, a great deal of variation between cohort members in different school districts. Members of the five largest Wisconsin school districts, Milwaukee, Racine, Madison, Kenosha, and Green Bay, are much more mobile than statewide averages would suggest: For example, 64.6 percent of Milwaukee students in the cohort move at least once, 38.8 percent move more than once, and 6.9 percent move five or more times. Racine students in the cohort are also highly mobile compared to statewide averages; 51.7 percent of students in the district move at least once, and 28.3 percent move multiple times. Madison students in the cohort are only slightly above the state average, with 38.9 percent experiencing at least one move and 20.8 percent having multiple moves. In the other two of the top five districts, Kenosha and Green Bay, members of the cohort move somewhat less frequently than the state average.
Highly mobile students with five or more moves are overrepresented in all but one of the five largest Wisconsin districts. Statewide, 1.9 percent of students move five or more times. By comparison, 1.5 percent of Kenosha students experience five or more moves. The other four districts exceed this rate; Milwaukee leads the group with 6.9 percent of students experiencing five or more moves. Additional details about cohort members in the five largest districts are presented in Table 10.

18
Table 10: Cohort Member Moves in the 5 Largest Wisconsin School Districts
Moves Milwaukee Racine Madison Kenosha Green Bay Statewide
0 11,176 35.4% 4,113 48.3% 5,563 61.1% 10,121 72.5% 9,287 73.0% 205,500 64.4%
1 8,125 25.7% 1,988 23.4% 1,646 18.1% 2,009 14.4% 1,504 11.8% 64,225 20.1%
2 5,198 16.5% 1,130 13.3% 808 8.9% 951 6.8% 820 6.4% 25,936 8.1%
3 3,054 9.7% 624 7.3% 424 4.7% 452 3.2% 448 3.5% 11,565 3.6%
4 1,814 5.7% 321 3.8% 291 3.2% 221 1.6% 255 2.0% 5,701 1.8%
5 + 2,188 6.9% 333 3.9% 374 4.1% 211 1.5% 403 3.2% 6,303 2.0%
Total 31,555 100.0% 8,509 100.0% 9,106 100.0% 13,965 100.0% 12,717 100.0% 319,230 100.0%Note: Percentages may not add to 100 due to rounding.
Source: Authors’ calculations from DPI data

19
Moves out of the five largest Wisconsin districts
Students move from one school district to another for reasons such as family migration, parental divorce, availability of employment, or any number of other reasons. Literature suggests that these inter-district moves may affect students differently than intra-district moves, and higher-income students are more likely to experience an inter-district move than their lower-income peers. In addition to their impact on student achievement and success, inter-district moves might have policy implications when factors like aid distribution are considered.
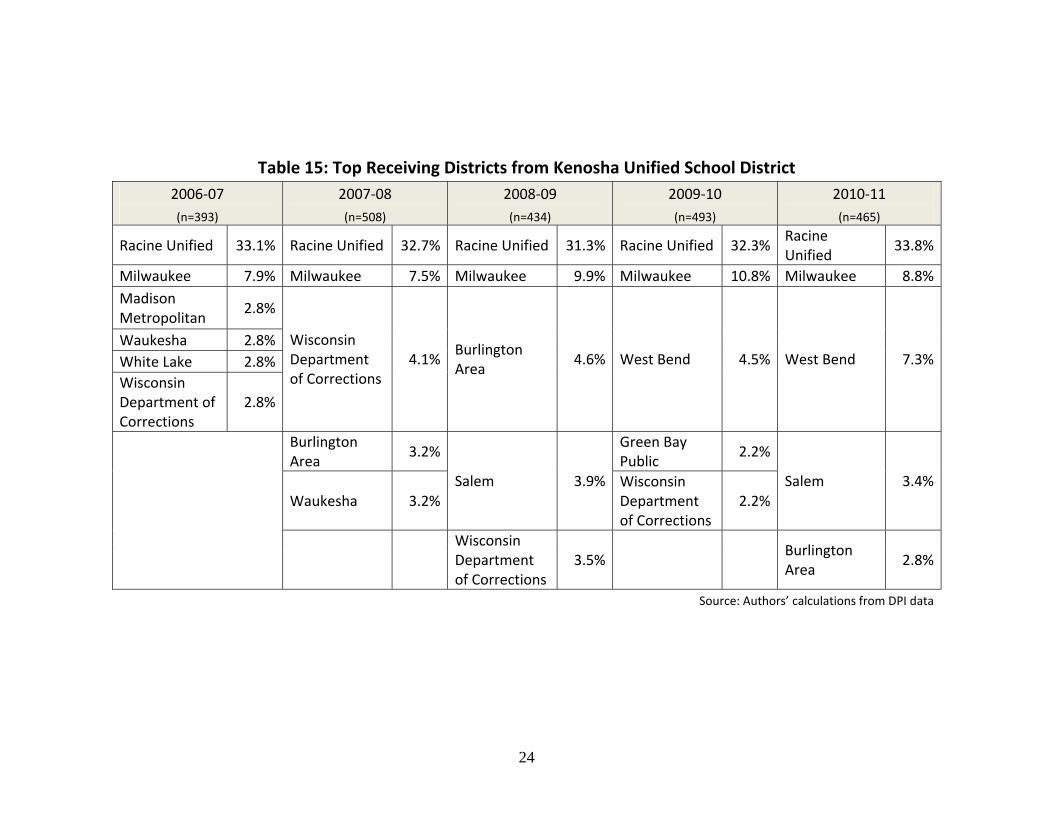
In this section, we examine where students from the five largest Wisconsin districts go as a result of inter-district moves. As shown in Table 11, the districts that receive students from Milwaukee Public Schools are fairly consistent across years, with West Allis–West Milwaukee appearing as the first or second highest receiving district. The Franklin School District also appears in all years of the sample. The Wisconsin Department of Corrections is another one of the top five receivers of Milwaukee students in four out of the five years. The department is also a top receiver for students from Racine and Kenosha.
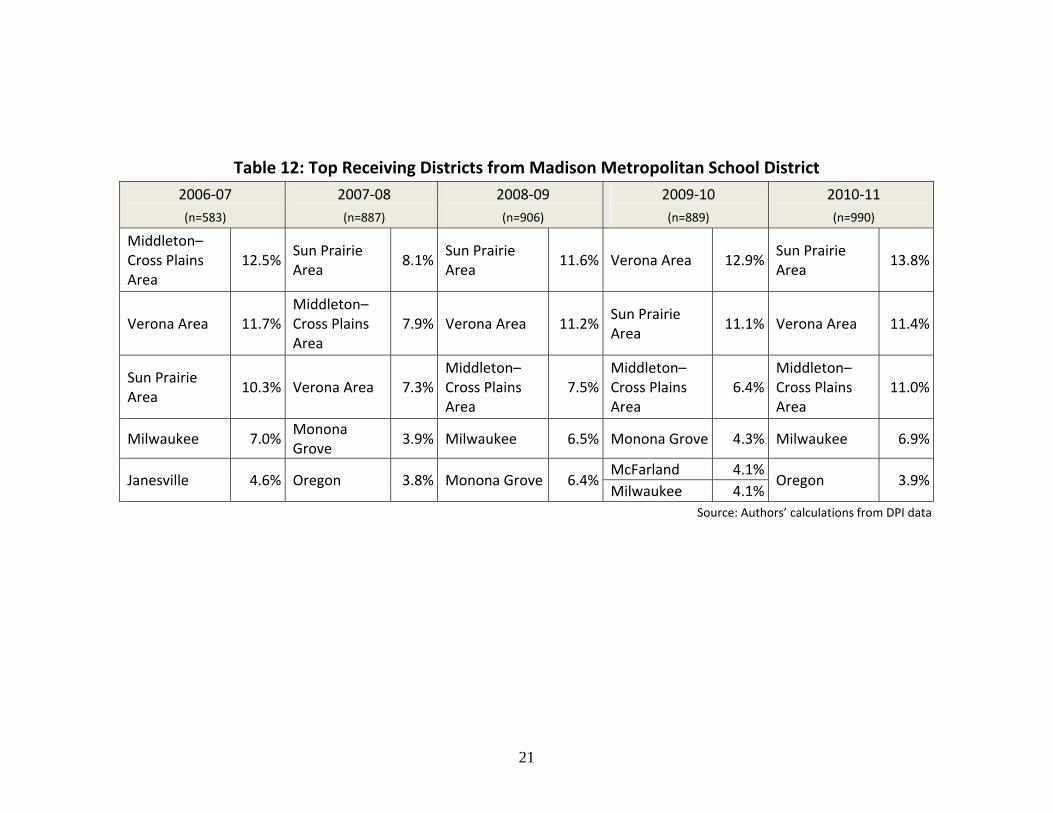
Table 12 through 15 contain similar descriptive statistics for the other four largest districts in Wisconsin. Moves out of these districts are largely to nearby school districts. This finding is especially true for Madison Metropolitan School District, where receivers of Madison students are almost exclusively districts in Madison suburbs. Milwaukee is consistently the second highest-receiving district for students moving from Green Bay Area Public Schools, Kenosha Unified School District, and Racine Unified School District. Additionally, Kenosha and Racine are each other’s top receivers for every year in the sample. We also note that Madison only appears as a top receiver for Kenosha and only for one year in the sample.

20
Table 11: Top Receiving Districts from Milwaukee Public Schools
2006‐07 2007‐08 2008‐09 2009‐10 2010‐11 (n=2,054) (n=2,855) (n=2,875) (n=3,157) (n=3,600)
Franklin Public 9.6% West Allis–West Milwaukee
8.1% West Allis–West Milwaukee
9.0% Wauwatosa 9.1% West Allis–West Milwaukee
8.3%
West Allis–West Milwaukee
9.0% Wisconsin Department of Corrections
7.9% Wisconsin Department of Corrections
7.3% West Allis–West Milwaukee
7.4% Franklin Public 6.3%
Racine Unified 5.4% Franklin Public 7.3% Franklin Public 6.8% Franklin Public 6.2% Wauwatosa 5.9%
Business and Economics Academy of Milwaukeea
5.2% Racine Unified 3.9% Wauwatosa 4.8% Wisconsin Department of Corrections
5.3% Waukesha 4.9%
Wisconsin Department of Corrections
4.4%
Business and Economics Academy of Milwaukeea
3.8% Academy of Learning and Leadershipa
4.1% Bruce Guadalupea
4.6% Greenfield 4.6%
aDenotes public, non‐MPS charter school
Source: Authors’ calculations from DPI data
21
Table 12: Top Receiving Districts from Madison Metropolitan School District
2006‐07
(n=583)
2007‐08
(n=887)
2008‐09
(n=906)
2009‐10
(n=889)
2010‐11
(n=990)
Middleton–Cross Plains Area
12.5% Sun Prairie Area
8.1%Sun Prairie Area
11.6% Verona Area 12.9%Sun Prairie Area
13.8%
Verona Area 11.7% Middleton–Cross Plains Area
7.9% Verona Area 11.2%Sun Prairie Area
11.1% Verona Area 11.4%
Sun Prairie Area
10.3% Verona Area 7.3%Middleton–Cross Plains Area
7.5%Middleton–Cross Plains Area
6.4%Middleton–Cross Plains Area
11.0%
Milwaukee 7.0% Monona Grove
3.9% Milwaukee 6.5% Monona Grove 4.3% Milwaukee 6.9%
Janesville 4.6% Oregon 3.8% Monona Grove 6.4%McFarland 4.1%
Oregon 3.9%Milwaukee 4.1%
Source: Authors’ calculations from DPI data

22
Table 13: Top Receiving Districts from Green Bay Area Public School District
2006‐07
(n=735)
2007‐08
(n=869)
2008‐09
(n=825)
2009‐10
(n=861)
2010‐11
(n=990)
Howard–Suamico
10.8% Howard–Suamico
12.1%Howard–Suamico
10.7% Ashwaubenon 9.5% Ashwaubenon 10.1%
Milwaukee 8.0% Ashwaubenon 8.6% Milwaukee 9.1% Milwaukee 9.3% Milwaukee 9.8%
De Pere 6.8% Milwaukee 7.1% Ashwaubenon 7.5%Howard–Suamico
9.2% De Pere 9.6%
Ashwaubenon 6.5% De Pere 6.7% De Pere 6.6% De Pere 8.0%Howard–Suamico
9.0%
Pulaski Community
4.8% West De Pere 5.5% West De Pere 5.8% West De Pere 5.5% West De Pere 4.3%
Source: Authors’ calculations from DPI data

23
Table 14: Top Receiving Districts from Racine Unified School District
2006‐07
(n=421)
2007‐08
(n=565)
2008‐09
(n=557)
2009‐10
(n=546)
2010‐11
(n=675)
Kenosha Unified
23.8% Kenosha Unified
18.4%Kenosha Unified
18.1%Kenosha Unified
22.3%Kenosha Unified
26.8%
Milwaukee 22.3% Milwaukee 17.7% Milwaukee 15.6% Milwaukee 12.8% Milwaukee 16.3%
21st Century Prep Schoola
3.6% Wisconsin Department of Corrections
7.3%21st Century Prep Schoola
5.6%Green Bay Area Public
4.2%21st Century Prep Schoola
3.6%
Union Grove J1
2.9% 21st Century Prep School
4.8%Wisconsin Department of Corrections
5.4% Waukesha 3.9% Waukesha 3.1%
Wisconsin Department of Corrections
2.9%
Burlington Area
2.3%
Burlington Area
3.2% 21st Century Prep Schoola
3.7% Wisconsin Department of Corrections
3.0% Oak Creek–Franklin Joint
2.3%
Waukesha 2.3%aDenotes public, non‐MPS charter school
Source: Authors’ calculations from DPI data
24
Table 15: Top Receiving Districts from Kenosha Unified School District
2006‐07
(n=393)
2007‐08
(n=508)
2008‐09
(n=434)
2009‐10
(n=493)
2010‐11
(n=465)
Racine Unified 33.1% Racine Unified 32.7% Racine Unified 31.3% Racine Unified 32.3%Racine Unified
33.8%
Milwaukee 7.9% Milwaukee 7.5% Milwaukee 9.9% Milwaukee 10.8% Milwaukee 8.8%
Madison Metropolitan
2.8%
Wisconsin Department of Corrections
4.1%Burlington Area
4.6% West Bend 4.5% West Bend 7.3%Waukesha 2.8%
White Lake 2.8%
Wisconsin Department of Corrections
2.8%
Burlington Area
3.2%
Salem 3.9%
Green Bay Public
2.2%
Salem 3.4%Waukesha 3.2%
Wisconsin Department of Corrections
2.2%
Wisconsin Department of Corrections
3.5% Burlington Area
2.8%
Source: Authors’ calculations from DPI data

25
Achievement and Performance of Mobile Students
Information about mobile students’ demographic characteristics and district mobility provides us with greater insight about mobility trends in Wisconsin. However, these statistics do not capture whether, in general, mobility helps or harms affects students. Next, we examine achievement-related mobility trends in our dataset. We use two measures of achievement: graduation, which is measured as “graduated” or “did not graduate,” and WKCE math and reading test scores. Although these data do not control for other factors that correlate with test score outcomes—such as race, income, and ELL status—the statistics do suggest a relationship between mobility and student achievement.
Moves and Graduation
First, we examine the mobility rates of high school graduates and non-graduates who are 12th-graders in 2010-11. Table 16 indicates that those who fail to graduate are mobile: 32.6 percent of non-graduates move one to three times compared to 15.5 percent of high school graduates. Additionally, 10 percent of non-graduates move four or more times compared to 2 percent of their graduate counterparts.
Table 16: Total Moves by Graduation Status in 2010‐11
Moves Did Not Graduate
Graduated Total
0 1,679 57.3% 16,141 82.6% 17,820
1 to 3 955 32.6% 3,005 15.4% 3,960
4 + 294 10.0% 389 2.0% 683
Total 2,928 100.0% 19,535 100.0% 22,463
Source: Authors’ calculations from DPI data
The data indicate that, overwhelmingly, 12th-graders who fail to graduate move more times than 12th-graders who graduate. This finding suggests that a student’s mobility and his or her ability to graduate high school may be interconnected.
Prior-Year Moves and Test Scores
Next, we examine the relationship between moving at all in the prior year (referred to as a “prior year move”) and a student’s WKCE math and reading test scores. By accounting for moves in the year before taking a test, we can attempt to capture whether moving has an immediate effect on a student’s academic achievement. As Table 17 demonstrates, tenth-grade students who do not move in 2009-10 have statistically significantly higher test scores in 2010-11 than students who do move in the same year. These trends are consistent for both the reading and math tests. As with graduation, test scores also seem to be related to a student’s mobility.

26
Table 17: Prior Year Moves & Tenth‐Grade Test Scores, 2010‐11
Moved in
2009‐10
Reading Math
Mean Standard Deviation
Total Students
Mean Standard Deviation
Total Students
No 542.03*** 58.2 32,906 565.23** 45.18 32,904
Yes 531.84*** 61.42 9,295 556.35** 48.23 9,287
TOTAL 539.79*** 59.08 42,201 563.28** 46.01 42,191*** p<0.01, ** p<0.05
Source: Authors’ calculations from DPI data
Cumulative Moves and Test Scores
We also attempt to capture the effect of all the moves tenth-grade students make over the covered years in our analysis on their test scores in 2010-11. The trends for prior-year moves remain consistent. Table 18 demonstrates that achievement is statistically significantly lower for students who experience one to three moves or at least four moves than for students who experience no moves.
Table 18: Cumulative Moves & Tenth‐Grade Test Scores, 2010‐11
Number of
Moves Prior to 2009‐10
Reading Math
Mean Standard Deviation
Total Students
Mean Standard Deviation
Total Students
0 546.31 56.4 11,139 568.73 43.51 11,144
1 to 3 539.09 59.01 30,225 562.66 46.08 30,206
4 + 478.27 59.26 837 512.98 44.25 841
Total 539.79 59.08 42,201 563.28 46.01 42,191 All differences are significant at the .01 level Source: Authors’ calculations from DPI data
Overall, the trends described by the graduation and test score descriptive statistics for mobile students suggest that prior and cumulative mobility may affect achievement outcomes. However, the exact relationship is ambiguous because we do not control here for student characteristics that may affect student achievement or student mobility. Next, we utilize an exploratory regression that accounts for various student factors in order to more accurately capture the relationship between mobility and achievement.

27
Modeling the Association between Mobility and Achievement
There is some uncertainty in our initial analysis of the relationship between mobility and achievement. Simply comparing the number of moves a student experiences with a test score ignores all other factors that contribute to a student’s success or failure. As discussed, students who move are generally more likely to qualify for FRPL and are less likely to be white; both of these factors are predictors of lower test scores. Hence, it is unclear if lower test scores among high movers are a function of their mobility or of other factors. To explore this relationship, we conduct a set of regressions to ascertain whether mobility appears to have a significant relationship with achievement even after controlling for other factors believed to be correlated with test score outcomes.
These results are intended to inform research, not to serve as a definitive answer regarding the causal direction between achievement and mobility in Wisconsin. Our model lacks more sophisticated controls and statistical techniques such as the use of a student’s growth in scores from previous years. However, we believe that by conducting these preliminary, more simplistic regressions, the DPI can determine whether to include mobility metrics in their student achievement models. In addition, this model will provide researchers with justification for conducting a more thorough statistical analysis.
Our model of student achievement attempts to understand the effect of moves on students’ WKCE test scores. We conduct a series of simple ordinary least squares (OLS) regressions with fixed effects. In this model, a student’s reading and math scores are a result of the number of moves he or she experiences up until the test date while controlling for race,11 FRPL status, ELL status, and whether the student has ever been identified as homeless. We also control for the district the student attends the most from 2006-07 through 2010-11.
Our analysis uses the following linear regression model:
We initially regress tenth-grade reading and math scores in 2010-11 on the number of moves made prior to October 2010 and the controls described above.12 The WKCE is only administered to students in grades 3 through 8 and 10. Because tenth-graders in 2010-11 are in our dataset for the longest period of time, we have the greatest amount of test score and mobility data for them. We also run
11 By including race, we do not mean to imply that race causes lower test scores. However, race has traditionally been used as a proxy for other socio-economic factors that relate to achievement but are not present in our data. 12 We use moves up to October of a given year, because the WKCE is administered in the fall.
28
another set of regressions that replace the number of cumulative moves with the number of moves made in 2009-10.
The results from regressions 1 and 2 in Table 19 and regressions 5 and 6 in Table 20 indicate that moving has a statistically significant, negative effect on students’ expected test scores. Each additional cumulative move is expected to produce a 6.1-point loss on the reading exam and a 4.7-point loss on the math exam after controlling for race, FRPL receipt, ELL status, reported homeless status, and school district. Moves in the previous school year predict a 4.9-point loss on the reading test and a 4.0-point loss on the math exam.
There is reason to believe that the relationship between mobility and achievement may not be linear. A student who moves five times over the course of his/her academic career may be predicted to perform worse than a student who made just one move over the same period of time. Hence, we add a binary variable to our regression that takes on a value of “1” if the student moves four or more times before taking the WKCE in October 2010 and “0” if otherwise. We perform a similar test for moves made in the prior year. We create a binary variable that takes on a value of “1” if the student moves two or more times in 2009-10 and “0” if otherwise. Results from these modified models can be found in regressions 3 and 4 in Table 19 and in regressions 5 and 6 in Table 20.
Modifying the model in this way reveals that additional moves impose an exponential13 decrease in test scores. Students with four or more moves are predicted to experience an additional 10.2-point decrease on their reading tests and 5.2 points on math. Students who make two moves in the prior year are predicted to score 15.7 points lower on their reading tests and 11.6 points lower on math. These results suggest that the relationship between mobility and achievement is not linear.
The results from our regressions also show that while moving matters, it may not be as significant as other factors that affect student achievement. Across our models, the black, FRPL, and ELL14 coefficients are all larger than that of mobility. Rather than suggesting that black or Hispanic students innately score below their white peers, these effects should be seen as proxies of variables not available in our dataset that are often associated with race, such as family wealth, neighborhood, and family composition.
Our regressions suggest student mobility will predict a decrease in achievement, as measured by the WKCE. However, additional controls and/or enhanced statistical techniques may bolster this analysis. For example, this analysis lacks students’ prior years’ achievement as well as precise measures of school and district quality. More
13 “Exponential” refers not to a particular magnitude, but rather to a non-linear relationship. 14 The negative coefficient on ELL does not suggest receiving ELL services results in a lower expected test score. Rather, this suggests students whose native language is not English are expected to score lower on the WKCE, holding all else constant.
29
sophisticated statistical techniques or additional controls may be able to better estimate the impact of moves on achievement. In addition, our R-squared terms, which is a measure that estimates the model’s fit with actual causal patterns, are all somewhat low. This finding suggests our model is on the right track but still lacks additional controls for modeling moves and achievement. However, based on the similar results in previous literature, we hypothesize that mobility will continue to have a negative relationship with achievement.

30
Table 19: Regression Results of Mobility on Reading Scores
(1) (2) (3) (4)
Tenth‐Grade Reading (2010‐11)
Tenth‐Grade Reading (2010‐11)
Tenth‐Grade Reading (2010‐11)
Tenth‐Grade Reading (2010‐11)
Moves Before October 2010
‐6.09*** ‐5.18***
(0.31) (0.38)
4+ Moves Before October 2010
‐10.22***
(2.40)
Moves in 2009‐10 School Year
‐4.93*** ‐3.33***
(0.58) (0.65)
2+ Moves in 2009‐10 School Year
‐15.70***
(2.81)
Asian 7.46*** 7.40*** 7.86*** 7.79***
(1.61) (1.61) (1.61) (1.61)
Black ‐28.47*** ‐28.36*** ‐30.20*** ‐30.00***
(1.19) (1.19) (1.19) (1.19)
Hispanic ‐3.47*** ‐3.57*** ‐3.10** ‐3.05**
(1.33) (1.33) (1.34) (1.34)
Native American ‐16.94*** ‐16.81*** ‐18.07*** ‐18.00***
(2.39) (2.39) (2.40) (2.40)
Ever FRPL ‐27.21*** ‐27.21*** ‐28.72*** ‐28.58***
(0.61) (0.61) (0.61) (0.61)
Ever Homeless ‐9.97*** ‐9.58*** ‐14.36*** ‐13.94***
(2.82) (2.82) (2.83) (2.83)
Ever Received ELL Services
‐32.78*** ‐32.82*** ‐32.45*** ‐32.60***
(1.54) (1.54) (1.55) (1.55)
Constant 561.90*** 561.20*** 557.80*** 557.50***
(0.45) (0.48) (0.38) (0.39)
No. of Students 41,661 41,661 41,460 41,460
R‐squared 0.12 0.12 0.11 0.11
Standard errors in parentheses
*** p<0.01, ** p<0.05
Source: Authors’ calculations from DPI data

31
Table 20: Regression Results of Mobility on Math Scores
(5) (6) (7) (8)
Tenth‐Grade Math (2010‐11)
Tenth‐Grade Math (2010‐11)
Tenth‐Grade Math (2010‐11)
Tenth‐Grade Math (2010‐11)
Moves Before October 2010
‐4.66 ‐4.20
(0.24) (0.29)
4+ Moves Before October 2010
‐5.23
(1.82)
Moves in 2009‐10 School Year
‐3.99 ‐2.80
(0.44) (0.49)
2+ Moves in 2009‐10 School Year
‐11.64
(2.13)
Asian 11.58 11.55 11.92 11.87
(1.21) (1.21) (1.22) (1.22)
Black ‐28.20 ‐28.14 ‐29.59 ‐29.44
(0.90) (0.90) (0.90) (0.90)
Hispanic ‐6.25 ‐6.30 ‐6.09 ‐6.05
(1.01) (1.01) (1.01) (1.01)
Native American ‐17.37 ‐17.30 ‐18.20 ‐18.15
(1.81) (1.81) (1.82) (1.82)
Ever FRPL ‐22.34 ‐22.34 ‐23.47 ‐23.36
(0.46) (0.46) (0.46) (0.46)
Ever Homeless ‐11.79 ‐11.58 ‐15.02 ‐14.71
(2.13) (2.13) (2.14) (2.14)
Ever Received ELL Services
‐21.62 ‐21.64 ‐21.43 ‐21.54
(1.16) (1.16) (1.17) (1.17)
Constant 581.30 580.90 578.30 578.10
(0.34) (0.36) (0.29) (0.29)
No. of Students 41,650 41,650 41,449 41,449
R‐squared 0.14 0.14 0.13 0.13
Standard errors in parentheses
All differences are significant at the .01 level
Source: Authors’ calculations from DPI data

32
Mobility-Related Policy Considerations
The focus of this report has been to identify student mobility trends and their link to student achievement. Our purpose here is not to make a particular recommendation for action based on our findings. Rather, we aim to provide examples of policies based on researchers’ recommendations for reducing student mobility and combating the negative effects of mobility on achievement when moves do occur. We frame the considerations below around research questions we believe are important to consider when developing mobility-related policies:
What communication strategies have been utilized to combat the effects of student mobility?
How can records systems efficiently share information to facilitate student transfers when moves occur?
How can Wisconsin districts best prepare to work with mobile students? Can a flexible funding mechanism be utilized to meet the needs of schools
serving a mobile student population? Additionally, how can mobility-related programs be funded?
How can Wisconsin schools that work with mobile student populations be recognized for their efforts?
Communication with Families
Building family awareness of the consequences of mobility could influence a family’s decision to move or assist in making the moving transition smoother when a move is unavoidable. A state education agency could create materials to be distributed in schools that, for example, encourage families to plan their moves for summer whenever possible and discuss moves with school staff to ease transitions. One example of this type of communication is Chicago’s “Staying Put” campaign, which produced brochures about the effects of student mobility to be distributed to parents and throughout the community (Rennie Center for Education Research & Policy 2011). Another example is the Minneapolis Public Schools’ Kids Mobility Project, which went even further by setting attendance goals for students and working with families with high absenteeism to address causes and create strategies for improving attendance (Kids Mobility Project 1998). It is possible that working with families early on will prevent later mobility and improve academic achievement.
Information and Record-keeping Systems
Implementing a statewide record-keeping system for recording and sharing information about student mobility could facilitate more efficient and effective transfer of records between districts (Paik and Phillips 2002). Such a system would contain academic records (including transcripts) and disciplinary information that could ease transitions between schools by giving receiving schools more information about students’ backgrounds. This information could help teachers better and more easily identify and meet the needs of mobile students. Rumberger et al. (1999) also recommend closely monitoring exiting
33
students to ensure that these students immediately enroll in another school. This monitoring system could be included in the above record-keeping system and could be enforced by the state education agency or by the sending district.
Training and Technical Assistance
Once schools with high mobility rates are identified, state education agencies can support districts by providing technical assistance and professional development on best practices for working with mobile students. Additional training regarding particular sub-groups of mobile students, such as homeless and migrant students, may be appropriate (Paik and Phillips 2002). Districts might choose, for example, to work on aligning curricula across schools to provide greater continuity in educational programming (Kids Mobility Project 1998). This strategy could be especially useful for districts with high intra-district mobility, as students may change schools but will continue to be exposed to similar curricular content. It may also ease the transition of new students for instructional staff, as students will potentially require less assistance when becoming acclimated to the academic content of a new classroom.
Funding Mechanisms and Sources
High mobility rates for certain schools may have implications for school funding mechanisms. Specifically, it may be beneficial to develop a more flexible funding system that is responsive to changes in the size and characteristics of a school’s student body. The Rennie Center for Education Research & Policy (2011) suggests that a state could base initial funding on a school’s prior year enrollment and re-examine budgets on a quarterly basis to consider whether changes need to be made. This strategy would allow schools the flexibility to change staffing and/or resources during the year if necessary to meet the fluctuating needs of highly mobile schools.
Because funding would be required for mobility-related programming and state budgets are constrained, the U.S. Government Accountability Office (2010) suggests that programs could be funded in part by federal programs already in place to meet the needs of mobile students. For example, Title I funds targeting disadvantaged students (low-income, limited English proficiency, those who have migrant status, etc.) can help pay for additional tutoring, teachers’ salaries, and professional development that will address the needs of mobile students.
Accountability
Student mobility may have implications for accountability policies. Some researchers propose including mobility rates as part of a state’s accountability system by identifying highly mobile students as a separate subgroup (similar to ELL and other student groups). Doing so might better show if schools are making progress with all groups of students; it could also underscore successful schools as paradigms for other schools (Rennie Center for Education Research & Policy 2011). Additionally, schools that are recognized as working with highly mobile populations might be targeted for additional resources.
34
Conclusion
Overall, this report should illuminate state and local mobility trends for Wisconsin state officials. Our analysis reveals that certain types of students are more likely to move than others, and the frequency of student mobility is not evenly distributed throughout the state. Students in larger districts experience higher rates of mobility than their peers in smaller districts. Notably, Milwaukee students account for a disproportionate number of moves in of Wisconsin.
Additionally, this report should alert policymakers to the fact that mobility appears to have an impact on students’ academic achievement, including their performance outcomes on the state standardized tests. While our regression models are exploratory in nature, their consistent results and statistical significance suggest that more mobile students are more likely to underperform on state tests than their less mobile counterparts, holding constant other observable characteristics. We hope that, along with the other mobility trends presented in this report, this information will be useful to the DPI as the Department continues to investigate mobility-related academic outcomes and consider policies or programs that target highly mobile students.

35
Appendix A: Technical Appendix
While using data collected from an assortment of administrative datasets has its advantages, we needed to clean the data of inconsistencies before beginning our analysis. Several data inconsistencies stemmed from input errors, including multiple birthdays for a single student and enrollment dates that preceded exit dates. In addition, inconsistent coding policies across districts result in data that needed to be standardized before we could analyze the data. This section outlines some of the assumptions we made as we conducted our analysis.
Accounting for Incorrect Enroll and Exit Dates
The DPI alerted us to the fact that several schools un-enroll continuing students at the end of the year and then subsequently re-enroll them before the start of the next school year. This scenario could make it look like some students accumulated more moves than they actually did if we only looked at the number of times they enrolled at and exited from a school. In addition, these policies skew the number of calendar days students remain enrolled in a given school.
To correct for this inconsistency, we sorted the WSLS dataset by student ID number and the date of enrollment so that each entry was arranged chronologically. Next, we programmed our statistical software to detect whether a student’s current school was the same as the previous school and the re-entry occurred sometime in the summer months. If this was the case, we then ensured the student did not exit their school to attend a non-WSLS school and then re-enroll. To account for this, we created a sliding scale of the number of days between the two entries. If the student re-enrolled in the previous school in June, there had to have been no more than 30 days between the exit and enroll date. This number is 60 for re-enrolls that occurred in July, 100 for re-enrolls in August, and 120 for those in September. Students who met both of these criteria (the two schools were the same, and the number of days between the previous exit and current enroll is no more than the ones programmed) were dubbed as probably subjected to the dropped and re-enrolled policy. Once we identified the students who were likely subjected to this policy, we then needed to fix the student’s enrollment and exit dates to reflect the student’s first enrollment and final exit at the given school.
Generating “Majority District”
For some items in our analysis, it was important to include the district a student attended. However, some students attended multiple schools and multiple districts over the course of their career. Rather than relying on the first or the last district attended, we decided to base our analysis on the district the student attended for the longest duration. To determine which district the student attended for the majority of his/her academic career, we instructed our statistical software to count the number of times a district appeared for a student based on the number of moves they made and the number of years they were enrolled.
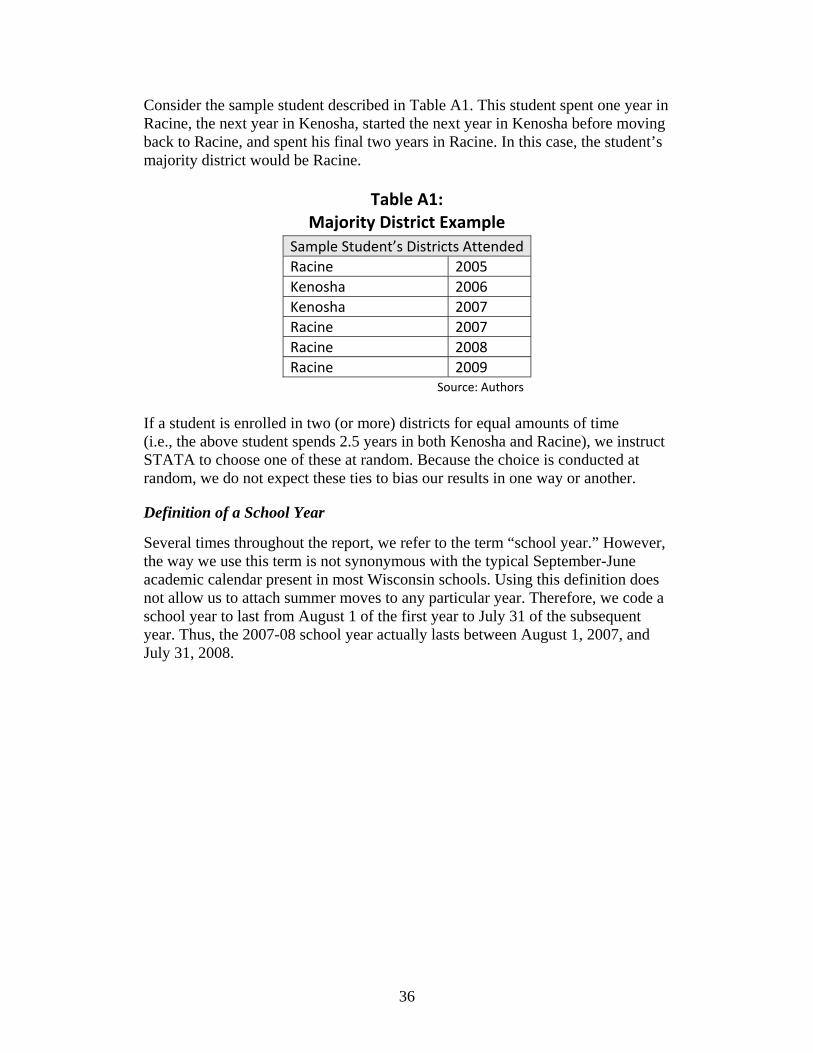
36
Consider the sample student described in Table A1. This student spent one year in Racine, the next year in Kenosha, started the next year in Kenosha before moving back to Racine, and spent his final two years in Racine. In this case, the student’s majority district would be Racine.
Table A1: Majority District Example
Sample Student’s Districts Attended
Racine 2005
Kenosha 2006
Kenosha 2007
Racine 2007
Racine 2008
Racine 2009 Source: Authors
If a student is enrolled in two (or more) districts for equal amounts of time (i.e., the above student spends 2.5 years in both Kenosha and Racine), we instruct STATA to choose one of these at random. Because the choice is conducted at random, we do not expect these ties to bias our results in one way or another.
Definition of a School Year
Several times throughout the report, we refer to the term “school year.” However, the way we use this term is not synonymous with the typical September-June academic calendar present in most Wisconsin schools. Using this definition does not allow us to attach summer moves to any particular year. Therefore, we code a school year to last from August 1 of the first year to July 31 of the subsequent year. Thus, the 2007-08 school year actually lasts between August 1, 2007, and July 31, 2008.

37
Works Cited
Burkam, David T., Valerie E. Lee, and Julie Dwyer. 2009. “School Mobility in the Early Elementary Grades: Frequency and Impact from Nationally-representative Data.” Prepared for the Workshop on the Impact of Mobility and Change on the Lives of Young Children, Schools, and Neighborhoods, June 29-30, 2009. http://pop.visionforchildren.org/dmdocuments/QE-School_Mobility_in_the_Early_Elementary_Grades.pdf.
Cowen, Joshua M., David J. Fleming, John F. Witte, and Patrick J. Wolf. 2012. “Going Public: Who Leaves a Large, Longstanding, and Widely Available Urban Voucher Program?” American Educational Research Journal 49 (2) (April): 231–256. DOI: 10.3102/0002831211424313.
Department of Public Instruction, Wisconsin. n.d. “ESEA Data Map for ISES, CWCS, WSLS.” http://lbstat.dpi.wi.gov/lbstat_eseamap.
Department of Public Instruction, Wisconsin. 2013. “Private (Non-Public) School Enrollment Data.” http://lbstat.dpi.wi.gov/lbstat_privdata.
Dukes, Lavan. 2009. “Student Mobility in Primary Grades in Florida.” Presentation Slides. Tallahassee, FL: Florida Department of Education. http://www.iom.edu/~/media/Files/Activity%20Files/Children/ChildMobility/5%20Dukes%20Presentation%20to%20Post%20Online.ashx.
Gasper, Joseph, Stefanie DeLuca, and Angela Estacion. 2012. “Switching Schools: Revisiting the Relationship between School Mobility and High School Dropout.” American Educational Research Journal 49 (3) (June): 487–519. DOI: 10.3102/0002831211415250.
Grigg, Jeffrey. 2012. “School Enrollment Changes and Student Achievement Growth A Case Study in Educational Disruption and Continuity.” Sociology of Education 85 (4) (October): 388–404. DOI:10.1177/0038040712441374.
Hango, Darcy W. 2006. “The Long-Term Effect of Childhood Residential Mobility on Educational Attainment.” The Sociological Quarterly 47 (4) (October): 631–664. DOI: 10.1111/j.1533-8525.2006.00065.
Hanushek, Eric A., John F. Kain, and Steven G. Rivkin. 2004. “Disruption Versus Tiebout Improvement: The Costs and Benefits of Switching Schools.” Journal of Public Economics 88 (9–10) (August): 1721–1746. DOI:10.1016/S0047-2727(03)00063-X.
Kerbow, David. 1996. “Patterns of Urban Student Mobility and Local School Reform.” Journal of Education for Students Placed at Risk 1 (2) (October): 147–169. DOI:10.1207/s15327671espr0102_5.

38
Kids Mobility Project. 1998. A Report from the Kids Mobility Project. Minneapolis: Kids Mobility Project, Minneapolis Public Schools. http://www.cura.umn.edu/publications/catalog/d9800.
Knowles, Jared. 2013. In-person interview with Policy Research Advisor, Wisconsin Department of Public Instruction by Selina Eadie, Ryan Eisner, Bryan Miller, and Leni Wolf, March 13. Notes in possession of Leni Wolf, April 20.
Loeb, Susanna, and Jon Valant. 2011. Student Mobility in Milwaukee: The Effects of School Transfers on Mobile and Non-mobile Students. Palo Alto, CA: Stanford Center for Education Policy Analysis. http://cepa.stanford.edu/content/student-mobility-milwaukee-effects-school-transfers-mobile-and-non-mobile-students. (Obtained author's permission to cite.)
Merrifield, Layla. 2011. “Charter Schools.” Informational Paper No. 30, Wisconsin Legislative Fiscal Bureau, Madison, WI. http://legis.wisconsin.gov/lfb/publications/Informational-Papers/Documents/2011/30_Charter%20Schools.pdf.
Meyers, H. Bud. 2012. “Student Mobility and Opportunity to Learn: Money Matters.” Issue Brief Vol. 2 No. 1, University of Vermont James M. Jeffords Center, Burlington, VT. http://www.uvm.edu/~jeffords/reports/pdfs/Student_Mobility_Opportunity_to_Learn.pdf.
Milwaukee Public Schools. n.d. “How to Enroll Your Child.” http://www5.milwaukee.k12.wi.us/school/selections/how-to-enroll-online/.
Milwaukee Public Schools. 2013. Suburban School Opportunities: Chapter 220 Program for Milwaukee Students for Fall 2013. Milwaukee, WI: Milwaukee Public Schools. http://www2.milwaukee.k12.wi.us/extra/docs/Chapter-220-Suburban-2013.pdf.
Paik, Sandra, and Rebecca Phillips. 2002. Student Mobility in Rural Communities: What Are the Implications for Student Achievement? Washington, D.C.: Georgetown University North Central Regional Educational Laboratory. http://www.scribd.com/doc/132637588/Student-Mobility-1.
Raudenbush, Stephen W., Marshall Jean, and Emily Art. 2011. “Year-by-year and Cumulative Impacts of Attending a High-mobility Elementary School on Children’s Mathematics Achievement in Chicago, 1995 to 2005.” In Whither Opportunity? edited by Greg J. Duncan and Richard J. Murnane, 359–376. New York: Russell Sage Foundation.

39
Rennie Center for Education Research & Policy. 2011. A Revolving Door: Challenges and Solutions to Educating Mobile Students. Cambridge, MA: Rennie Center for Education Research & Policy. http://www.unitedwaycm.org/images/uploads/pdfs/renniecenter_RevolvingDoor.pdf.
Rossmiller, Dan. n.d. “School Choice.” Issue Paper, Wisconsin Association of School Boards, Madison, WI. http://www.wasb.org/websites/advoc_gov_relations/File/2009-11_state_bill_tracking_chart/school_choice.pdf.
Rumberger, Russell W. 2002. “Student Mobility and Academic Achievement.” EDO-PS-02-1, ERIC Clearinghouse on Elementary and Early Childhood Education, Champaign, IL. http://ceep.crc.illinois.edu/eecearchive/digests/2002/rumberger02.pdf.
Rumberger, Russell W., and Katherine A. Larson. 1998. “Student Mobility and the Increased Risk of High School Dropout.” American Journal of Education 107 (1) (November): 1–35. http://www.jstor.org/stable/1085729.
Rumberger, Russell W., Katherine A. Larson, Robert K. Ream, and Gregory J. Palardy. 1999. The Educational Consequences of Mobility for California Students and Schools. Berkeley, CA: Policy Analysis for California Education. http://www.education.ucsb.edu/rumberger/internet%20pages/Papers/Stuart%20Report--final.pdf.
U.S. Government Accountability Office. 2010. K-12 Education: Many Challenges Arise in Educating Students Who Change Schools Frequently. Washington, D.C.: GAO-11-40. http://www.gao.gov/products/GAO-11-40.
Voight, Adam, Marybeth Shinn, and Maury Nation. 2012. “The Longitudinal Effects of Residential Mobility on the Academic Achievement of Urban Elementary and Middle School Students.” Educational Researcher 41 (9) (December): 385–392. DOI: 10.3102/0013189X12442239.
Wright, Dan. 1999. “Student Mobility: A Negligible and Confounded Influence on Student Achievement.” The Journal of Educational Research 92 (6) (July–August): 347–353. DOI: 10.1080/00220679909597618.
Xu, Zeyu, Jane Hannaway, and Stephanie D’Souza. 2009. “Student Transience in North Carolina: The Effect of School Mobility on Student Outcomes Using Longitudinal Data.” Working Paper No. 22, National Center for Analysis of Longitudinal Data in Educational Research, Washington, D.C. http://www.urban.org/UploadedPDF/1001256_student_transience.pdf.