student need, spending, and resource use in oakland’s ... · has raised a number of important and...
TRANSCRIPT

1
Student Need, Spending, and Resource Use in Oakland’s Public Schools
Informing Equity
Education Resource Strategies and Oakland Achieves
June 2017

2
About the Authors
The Oakland Achieves Partnership is a coalition of education and community organizations working to create a common set of indicators for understanding and improving student success. Coalition members are Alameda First 5, Educate78, GO Public Schools Oakland, Oakland Chamber of Commerce, Oakland Public Education Fund, Rogers Family Foundation, Urban Strategies Council, and United Way of the Bay Area. We envision an Oakland where students, regardless of background, are served equitably and receive a high-quality public education. To that end, we share information that inspires action, so that Oakland students have quality public schools. In addition to this report, we have completed public annual cradle-to-career reports as well as an in-depth report on school attendance.
Education Resource Strategies (ERS) is a non-profit organization dedicated to transforming how urban school systems organize resources—people, time, technology, and money—so that every school succeeds for every student. We have worked closely with nearly 40 school systems nationwide on topics that range from funding equity to strategic school design. Our signature project is a district “Resource Map” where we analyze budget, staffing, schedule and student performance data to understand how resource decisions align with goals. From our extensive dataset, we also provide research and practical tools to help school systems in their efforts.
Acknowledgements
This report was a true collaborative effort. We would like to gratefully acknowledge Jonathan Travers, Joe McKown, Courtney Hitchcock, Taran Raghuram, Danielle Smith, Melissa Galvez, and Allison Hausman from Education Resource Strategies; and Marc Tafolla, Ash Solar, and Raymonde Charles from GO Public Schools Oakland. We are indebted to the many staff members in Oakland Unified School District and the 32 charter schools who shared data and answered questions to create this fact base. This report was made possible with funding from the Rogers Family Foundation, Educate78, Overdeck Family Foundation, The William H. Donner Foundation, and The Hastings Fund.
And finally, this entire project was guided by the members of the Citywide Steering Committee, who came together with the singular vision of improving education for Oakland children. We’d like to thank all of the people who participated in the Steering Committee meetings (identified with an asterisk) as well as others with whom we spoke who provided invaluable feedback and reflections on the report.:
• Larissa Adam*
• Sondra Aguilera
• Ruth Alahydoian*
• Carey Ash*
• Silke Bradford
• Noah Bradley*
• Devin Dillon*
• Jeff Duncan-Andrade
• Sharon Falk
• Mike Fenocketti*
• Michael Gaal*
• Kimi Kean
• Isaac Kos-Read*
• Gloria Lee*
• Sara Levine*
• Jesus Magana*
• Aron Michalski*
• David Montes*
• Kyra Mungia*
• Anne Okahara*
• David Patterson*
• Gina Plate
• David Silver*
• Anne Soto*
• Bob Spencer*
• Steve Spiker*
• Brian Stanley*
• Jonathon Stewart*
• Hae-Sin Thomas*
• Patrick Walsh*
• Louise Waters*
• Dana Wellhausen*
• Charles Wilson*
• Jean Wing*
• Xi Xu*
• Dorothy Young*

1
Letters of Introduction
Oakland AchievesThe Oakland Achieves Partnership is committed to providing the Oakland education community with the quality data and shared fact base that it needs to make informed and strategic decisions to increase school quality and equity for our students. The Partnership maintains a focus on engaging the community around critical issues affecting our students, facilitating the tough conversations that need to happen, and driving an agenda for change.
To that end, we commissioned this study to understand the financial and systemic dynamics of how public schools in Oakland—both district-run and charter—are serving all of our community’s students. We offer this report as a baseline assessment of where we stood in the 2014-15 school year and a launchpad for collaboration that will get us to where we want to be in 2020.
The study, conducted by Educational Resource Strategies (ERS), examined district-run and charter schools on three dimensions: 1) student need, 2) resource levels, and 3) resource use. This research has raised a number of important and troubling equity issues that require further conversation and action:
• District schools are serving a greater proportion of higher-needs students, in terms of incoming academic proficiency, students in need of special education services, and late entering students though there is significant variation among district schools as well as among charter organizations and schools.
• Compared to peer districts in California and nationally, OUSD places 30 percent more of its special needs students in restrictive environments, which are more costly.
• The state funding law that caps concentration funds for charter schools is resulting in millions of dollars of lost revenue for charters serving high-needs students, making it more challenging for charters to serve them.
With a better understanding of these issues, education leaders and the community can work together to create policies and practices that drive greater educational equity and quality for all Oakland students. These are deeply complicated problems and we don’t expect easy answers, but this study provides an empirical foundation for change, one that is unique in its breadth and scope anywhere in the country. We must seize this opportunity to take an honest look at our situation and begin the difficult work of collaborating across sectors and schools to find the solutions our students need.
We are deeply thankful for the hundreds of hours district and charter leaders invested in compiling this data, discussing it with the researchers, and gaining a better understanding of how Oakland’s public schools are, or are not, efficiently allocating resources in service of students.

2
More valuable than the time and effort invested in preparing the report was the time devoted to make meaning of the findings and begin to dialogue around opportunities for improvement
Our hope is that the community will take these reports in the spirit in which they were created—to engage in the constructive conversations and work necessary to improve education for all public school students across Oakland.
Sincerely,
The Oakland Achieves Partnership
Janis Burger, First 5 Alameda David Harris, Urban Strategies Council Gloria Lee, Educate78 Barb Leslie, Oakland Chamber of Commerce Ash Solar, GO Public Schools Rhonnel Sotelo, Rogers Family Foundation Brian Stanley, Oakland Public Education Fund
Education Resource Strategies (ERS)ERS is pleased to share this report—the first of its kind—that explores K-12 spending and resource allocation patterns across charter and district-run schools in Oakland. This study creates a rich fact-base to inform a city-wide conversation about how to ensure all of Oakland’s public school students attend a world-class school.
In presenting this fact base we do not express value judgments. Instead, we endeavor to provide a common set of facts to inform and catalyze solutions to issues that both district-run and charter schools face. We hope this report brings to light some of the challenges as well as the opportunities across all of Oakland’s public schools.
This study would not have been possible without many people who contributed time, energy, and data. We thank Oakland Unified School District for advocating for the work initially, sharing their data, and continuing to support this work throughout leadership transitions.
We also thank the school leaders from the 32 charter schools that elected to participate in this study; these schools serve 88% of all charter students in the city of Oakland. This high participation rate ensures that our data are highly representative of the Oakland charter school population. (You can find a list of participating schools in the Appendix.)
We’d also like to express particular appreciation to the members of the Citywide Study Steering Committee. This group (listed on the front cover) of Oakland district leaders, charter leaders, and education advocates played a tremendously important role in this work. The hypotheses and

3
questions that this group asked led us to focus on several key issues covered in this report. This analysis covers new ground—there is no defined methodology or a robust research base to draw from. It was their deep engagement in the analytic details that helped us refine our methodology to reflect the unique context of the district and charter sector, while also enabling apples-to-apples comparisons across schools. The Steering Committee’s commitment and determination to use this report to inform positive change in Oakland has helped us affirm the facts and identify recommended action steps. This study would have been impossible without this group’s willingness to follow the facts – wherever they led. They approached this work with a spirit of open inquiry in pursuit of equity, rather than cherry-picking data to affirm pre-existing assumptions or positions about the merits of one type of school system or another.
The financial and student-level data included in this study are from the school year 2014-2015. Since then, there have been meaningful changes—in spending, student populations across schools, strategies for serving special education students, etc.—that, consequently, are not reflected. Nonetheless, the core facts and takeaways continue to reflect overall trends and patterns across he city and are still relevant and timely.
We recognize that the methodologies and insights in this report may seem relevant for other cities, but we urge readers not extrapolate national implications based on this paper. This report tackles a set of empirical questions about resource use and equity in Oakland’s public schools. Differences in local context or in funding and charter authorization policies across cities and states will result in different patterns of resource allocation and different challenges. Focusing on Oakland makes us enthusiastic and optimistic about this study as a starting point—to reflect on past progress and to spur deeper work. We hope it engages Oakland’s citizens to collaborate on ensuring equitable access to education resources and excellent schools for all of the city’s students.
With gratitude,
Jonathan Travers, Partner, Head of Consulting Practice Area
Joe McKown, Partner, Head of the ERS California office

This study examines district-run and charter schools in Oakland across three dimensions: (1) student need (2) resource levels, and (3) resource use. We analyzed data for the 2014-15 school year from every school run by Oakland Unified School District (OUSD), as well as 32 charter schools, which serve 88% of all the charter school students in Oakland. In some cases, we also compared Oakland to a set of peer districts from around California or around the country.
This research was guided by a Citywide Study Steering Committee—a group of Oakland district leaders, charter leaders, and education advocates. The purpose of the study was to build a shared fact base. While this project aspires to ultimately impact student outcomes, we focused this analysis on resources and needs rather than performance outcomes. We believe that such a report is the first step in helping the many stakeholders in Oakland to explore new opportunities and solutions to common challenges.
Key Findings
1) Student Need: Overall, the student population in OUSD schools had greater needs than did the Oakland charter school student population.
• Special Education: District-run schools have a higher share of students receiving special education, and provide special education services in more restrictive settings.
o 12% of students in district-run schools received special education services, compared to 7% in charters.
o Special education students who are served by district-run schools were more likely to have disabilities requiring intensive services compared to those served by charter schools.
o Across all disability types, district-run schools served a much greater share of special education students in more restrictive—and costlier—settings than both charters and other large urban districts nationally.
• Academic need: When high-performing students (as measured on state tests) transition from elementary to middle school or from middle to high school, they disproportionately enroll in charter schools rather than district-run schools. On the other hand, students who performed below grade level in the prior year disproportionately transition into district-run schools. This means that district-run schools receive new 6th grade and 9th grade students who are academically less proficient on average, than do charters.
• “Late-entry” students: District-run schools also served a larger share of “late-entry” students—those who enrolled well after the beginning of the school year and who typically have greater needs and require additional supports.
Executive Summary
4

• Other aspects of need: There were not major differences in the concentrations of English learners and socioeconomically disadvantaged students. District-run schools did serve higher percentages of homeless and foster students than did charter schools on average.1
• Variation among schools of both types: Notably, there was wide variation in all types of student needs within each sector—that is, comparing individual charter schools to each other and district-run schools to each other.
2) Resource Levels: In 2014-2015 OUSD spent $1,400 more per pupil than the average charter school on operating expenses, adjusted for student need differences in special education, English learner status and eligibility for Free and Reduced Price Meals. This adjustment does not capture other potential differences in student need, such high mobility rates and or the number of students entering school significantly behind academically.
• Operating expenses: When we just compare “operating expenses,” district-run schools spend $2,800 more per pupil than the charter school average.2 As described in the footnote, “operating expenses” focuses on spending that directly supports the ongoing operation of and support to schools.
• Adjusting for student needs in special education, English learner status, and eligibility for Free and Reduced Price Meals: When we adjust for differences in these three types of student need across the two sectors, the difference reduces to $1,400.3 This is largely because district-run schools served a higher share of special education students in more resource-intensive placements. Adjusting per-pupil spending for student needs allows us to make an apples-to-apples comparison between sectors that serve different student populations.
• Effect of other student needs: We were not able to adjust spending levels for differences in the academic performance of students entering middle and high schools and for students who arrive at school late in the year, but if we had, we would expect to see an even smaller difference between per-pupil spending in district-run and charter schools.
1. While homeless and foster students are clearly an important and needy population, because of the small numbers of these students, they did not materially affect equity of funding.
2. “Operating expenses” refers to spending that directly supports the ongoing operation of and support to schools. For OUSD “exclusions and set/asides” spending includes such expenses as pass-throughs to other entities, capital spending, debt service, etc. For charter school spending it also included building rental. Further analysis is necessary to assess equity of revenue and expenses associated with “exclusions and set-asides” activities.
3. To adjust for student need we (1) exclude “exclusions and set-asides” spending and (2) adjust for differences in student need related to special education, English learners, and socioeconomic disadvantage. By adjusting this spending for student needs, we can make an apples-to-apples comparison between sectors.
5

6
• Cap on charter funding: The Local Control Funding Formula (LCFF) caps the amount of “concentration” funding that charter schools can receive.4 In 2014-15 this meant that 23 charter schools received fewer dollars from LCFF than their actual student need would suggest. This is a driver of lower per-pupil spending for charter schools.
3) Resource Use: OUSD district-run and charter schools used their resources differently in several important ways.
• Teacher time, compensation and student-teacher ratio: In 2014-15, Oakland charter schools had 14% more contractually-required teacher time per day, on average, than did district-run schools. District-run schools spent 18% more per teacher on compensation than the average charter school—mostly due to higher average teacher benefit costs. District-run schools had a slightly lower student-teacher ratio (18:1) than the charter school average (19:1), due to district-run schools’ much larger investment in special education teachers.
• Spending on administration and business services: Charter schools, on average, spent a larger share of resources on administration and business services as compared to district-run schools. This was likely due to differences in system size, as OUSD has greater economies of scale when it comes to administration and business services.
• Small schools: Oakland operated a high number of small schools—both district-run and charter—compared to other cities in California. OUSD spent disproportionately more on its small schools relative to small charters.
• Rent for space: Across charters, spending on rent varied from $190 to $2,250 per pupil, with those renting from OUSD generally spending less per pupil than others.
• Spending gap on special education: Both charter schools and district-run schools spent more on special education than they received in special education revenue, though they received and spent substantially different amounts of dollars.
4. Under California’s Local Control Funding Formula, school districts receive funding based on the number of enrolled students as well as the needs of those students. School systems with high concentrations of students who are low income, English learners, or foster youth receive extra funding called “concentration” funds. Charter school funding for these high need students is capped at the number of students their host district serves, not on the number of high-need students they (the charters themselves) serve.

7
Actions for Further ExplorationBased on Steering Committee member discussions, some of the following next steps emerged. There is strong agreement that these steps can only lead to meaningful change if OUSD leaders, charter leaders, Oakland education advocates, and other city stakeholders truly collaborate to create specific solutions and act on them:
• To ensure that school spending matches student need, explore opportunities for both the district and charter sectors to serve a more equitable percentage of students with higher needs, including needs related to special education, incoming proficiency and “late-entry” students. This includes increasing parent and student agency in choosing schools by increasing awareness of school options across Oakland, with a focus on families of students with greater needs.
• As part of a broader rethinking of revenue policies, explore using a more nuanced assessment of student need to differentiate resources across schools.
• Explore advocating for a state legislative change to address the current LCFF cap, in order to provide additional resources to charters serving high need student populations.
• Explore opportunities to optimize special education resources within the city by aligning financial incentives with the authentic needs of students to ensure that all schools both invest appropriately in all students and serve students in the least restrictive environment. This may include creating a special education funding system that incentivizes charters to remain in their local/regional Special Education Local Plan Area (SELPA), which are the organizations that receive revenue from the state earmarked for special education and that provide special education programs, services, and/or revenues for identified students within a defined region. This would increase overall local special education revenue and more equitably share cost.
• Articulate a citywide strategy on the number and mix of district-run and charter schools that maximizes the number of high-quality seats for all types of students and allows schools to operate at a size that’s financially sustainable over time—including sharing facilities across schools, as appropriate.

8
IntroductionThis study examines district-run and charter schools in Oakland across three dimensions: (1) student need (2) resource levels, and (3) resource use. We analyzed data for the 2014-15 school year from every school run by Oakland Unified School District (OUSD), as well as 32 charter schools, which represents 88% of all the charter school students in Oakland. (See Appendix 2 for a list of the charter schools) In some cases, we also compared Oakland to a set of peer districts from around California and/or around the country.
This research was guided by a Citywide Study Steering Committee—a group of Oakland district leaders, charter leaders, and education advocates. The purpose of the study was to build a shared fact base. We believe that such a report is the first step in helping the many stakeholders in Oakland to explore new opportunities and solutions to common challenges.
To address these three dimensions, this report is organized around four key questions:
1. How were the students in charter and district-run schools similar and different?
2. How much did district-run and charter schools spend serving their students?
At the end of each section, there is a summary of actions and further analyses that emerged from the Citywide Steering Committee’s discussions.
Considering Student Achievement:It is important to note that this study did not seek to measure student performance across schools or sectors or to discern relative “return-on-investment” for each school or sector. While understanding the relationship between resource allocation and student performance is critical to achieving success at scale, the current study is a necessary precursor: the fact base related to resource allocation and use.
Question 1: How were the students in charter and district-run schools similar and different?This study sought to understand resource equity in Oakland schools. Most broadly, resource equity means school spending is differentiated consistent with the needs of students—i.e. schools with higher concentrations of high needs students should spend more than schools with less. Therefore, we need first to understand the distribution of student need across Oakland schools. We looked at two categories of indicators:5
5. These indicators were chosen based on three criteria: i) Research supported additional resources should be given to students with these needs ii) The Steering Committee perceived these student needs as requiring additional services (and an associated cost) to address iii) Data on these needs were available for both OUSD and participating charters.
3. How did special education spending and practices compare across charter and district-run schools?
4. How was resource use different between charter and district-run schools?

9
LCFF Indicators of Need: Under the Local Control Funding Formula (LCFF), districts and charters receive extra funding for students with these characteristics:
1. FRPM students (FRPM: Free and Reduced Price Meals—a measure of socioeconomic disadvantage) 2. English Learners
Non-LCFF Indicators of Need: Districts and charters do not receive extra state dollars through LCFF for students with the following characteristics:1. Special education students2. Students with low academic proficiency
Our analysis showed wide variation in the profiles of student need between sectors and across individual schools within sectors. On average, district-run schools served students with higher needs in non-LCFF funded categories than did charter schools. District-run and charter schools served more similar populations with regard to LCFF indicators of need (though with wide variation across schools within each sector).
LCFF Indicators of NeedCalifornia’s LCFF provided additional funds for “high-needs” students who were socioeconomically disadvantaged (FRPM), English learners (EL), or in foster care in 2014-2015. Figure 1 shows that both district-run schools and charter schools served large percentages of students who were eligible for FRPM or English learners, with charters serving slightly higher percentages of students with these characteristics. The chart also shows that district-run schools served a higher percentage of students in foster care or who were homeless. While clearly an important and needy population, because of the small numbers of these students, they did not materially affect equity of funding.
Considering RaceIn 2014-15, there were notable differences in racial composition between sectors. Charter schools had a higher proportion of Latino students (58 percent) compared to district-run schools (40 percent), and a lower proportion of African-American students (17 percent compared to 29 percent in district-run schools). However, both district-run and charter schools have a wide range of racial and ethnic diversity at the school level. Five charter schools serve a student population that is at or above 40 percent African-American, while 16 charter schools serve under 10 percent African-American students. 21 charter schools serve a student population that is at or above 40 percent Latino, while two charter schools serve under 10 percent Latino students. Appendix 3 breaks out the racial composition of students at each school across both sectors.
This study does not attempt to unpack all the inequities associated with differences in the racial composition of schools, but it is important to acknowledge race when considering multiple dimensions of student need. The authors of this study recommend further analysis be done to explore the implications of race on resource equity, particularly concerning special education identification in middle school grades among African-American males and performance gaps for students in highly segregated schools—in both OUSD and charter schools.
3. Foster students4. Homeless students (qualifying for
socioeconomic disadvantage status)
3. Late-entry students (i.e. students who enter their school after October 1, and who contribute to high mobility rates in schools)

10
Non-LCFF Indicators of NeedAmong non-LCFF categories of student need, district-run schools had the needier student profile on average, with some individual school exceptions in the charter sector. These sector-level averages do mask substantial variation in student need across both charter and district-run schools, which is explored later in this report.
Incoming Student Proficiency
In general, students who enter school further behind academically need more support to catch-up to their peers. Neither research nor best practice has yet defined a set amount of additional resources needed to close these academic gaps, yet we know these students require additional services. For example, if two middle schools served student populations that were similarly eligible for Free and Reduced Price Meals, but one had a much larger share of its 6th graders coming in two or more grade levels behind, we would expect that school to need more resources to hit the same performance targets by 8th grade. This might mean more effective instruction, more time, tutoring, etc. As such, comparing rates of incoming student proficiency effectively assesses relative need at the middle and high school level, given the availability of 5th and 8th grade performance data. Unfortunately we did not have access to enough “kindergarten readiness” data across schools and sectors to do a similar analysis for elementary schools.
Eligible for Free andReduced Price Meals
English Learners Foster Youth Homeless Youth0%
20%
40%
60%
80%
100%
78%74%
32%29%
0.3% 0.8% 0.8% 1.1%
Charter schools District-run schools
FIGURE 1 District-run and charter school populations are broadly similar across LCFF “high-needs” categories 6
% OF STUDENT POPULATION
6. The minimal magnitude of percentage differences in Oakland, as illustrated in the graphic, doesn’t materially affect the equity of funding between the two sectors. This is especially true given that the additional spend typically devoted to meeting these extra needs is small—roughly 10-20% of total general education student spending nationally. Refer to page 71 of the following report delivered to OUSD: https://ousd.legistar.com/LegislationDetail.aspx?ID=2762595&GUID=35E31F52-92A0-44DE-BEE8-494B0ABCF966&Options=&Search=

11
In Oakland, we see that the level of academic preparedness for entering students varies significantly by school. Specifically, as shown in Figures 2A and 2B, new students in key transition grades (6th and 9th) were more likely to be at or above proficiency coming into charter schools than into district-run schools. This means that on average, district-run secondary schools tended to have newly-entered students that are further behind academically, and therefore likely require additional supports and resources to be able to catch up. Note that most of OUSD’s very small high schools had incoming 9th grade populations that were almost all starting high school below standard.
7. Incoming proficiency analysis uses 2014-15 SBAC data and 2014-15 and 2015-16 student enrollment data. With the exception of four schools serving sixth graders and six schools serving 9th graders, all students in transition grades were new to their school, with at least 90% of students having prior year SBAC performance data. Performance data was unavailable for students coming from schools outside the city of Oakland or from the following three charter schools serving 5th or 8th graders in 2014-15: Lighthouse Community Charter School, Downtown Charter Academy, and Oakland Charter Academy. Data on 2015-16 student enrollment was unavailable for Lighthouse Community Charter High and ARISE High School.
0%
20%
40%
60%
80%
100%
Oak
land
Cha
rter
Aca
dem
y
Asp
ire L
ione
l Wils
on
Co
lleg
e Pr
ep
Asp
ire G
old
en S
tate
Co
lleg
e Pr
ep
Ep
ic C
hart
er
*KIP
P B
ridg
e A
cad
emy
Am
eric
an In
dia
n Pu
blic
Cha
rter
*Am
eric
an In
dian
Pub
lic C
hart
er S
choo
l II
Do
wnt
ow
n C
hart
er A
cad
emy
Eas
t B
ay In
nova
tion
Aca
dem
y
Oak
land
Sch
oo
l of t
he A
rts
Elm
hurs
t C
om
mun
ity P
rep
*Mel
rose
Lea
der
ship
Aca
dem
y
Alli
ance
Aca
dem
y
Wes
t O
akla
nd M
idd
le S
cho
ol
Uni
ted
for
Succ
ess
Aca
dem
y
Co
liseu
m C
olle
ge
Prep
Aca
dem
y
Ro
ots
Inte
rnat
iona
l Aca
dem
y
Fric
k M
idd
le S
cho
ol
Bre
t H
arte
Mid
dle
Sch
oo
l
*Par
ker
Ele
men
tary
Wes
tlake
Mid
dle
Sch
oo
l
Urb
an P
rom
ise
Aca
dem
y
Mad
iso
n Pa
rk U
pp
er C
amp
us
Ro
ose
velt
Mid
dle
Sch
oo
l
Life
Aca
dem
y
Ed
na M
Bre
wer
Mid
dle
Sch
oo
l
Cla
rem
ont
Mid
dle
Sch
oo
l
Mo
nter
a M
idd
le S
cho
ol
Standardnearly met
Standardmet
Standardnot met
Standardexceeded
Average % Proficientor Above
Charter Weighted
Average 40%
Charter Schools District-run Schools
OUSD Weighted
Average 27%
FIGURE 2A Incoming sixth graders are more likely to be at or above proficiency in charter schools as compared to
district-run schools 7
PROFICIENCY OF INCOMING 6TH GRADE STUDENTS (NEW TO SCHOOL) ON ENGLISH LANGUAGE ARTS PORTION OF SBAC

12
0%
20%
40%
60%
80%
100%
Standardnearly met
Standardmet
Standardnot met
Standardexceeded
Average % Proficientor Above
Charter Weighted
Average 37%
Charter Schools District-run Schools
OUSD Weighted
Average 26%
*Asp
ire G
old
en S
tate
Co
lleg
e Pr
ep
LPS
Oak
land
R &
D C
amp
us
Envi
sion
Aca
dem
y fo
r Art
s &
Tec
hnol
ogy
*Oak
land
Cha
rter
Hig
h
Am
eric
an In
dia
n Pu
blic
Hig
h
*Oak
land
Sch
oo
l of t
he A
rts
*Mad
iso
n Pa
rk U
pp
er C
amp
us
Oak
land
Inte
rnat
iona
l HS
Cas
tlem
ont
Hig
h Sc
hoo
l
Frem
ont
Hig
h Sc
hoo
l
McC
lym
ond
s H
S
Stre
et A
cad
emy
*So
jour
ner
Trut
h In
dep
end
ent
Stud
y
Met
Wes
t H
igh
Scho
ol
Oak
land
Hig
h Sc
hoo
l
Skyl
ine
Hig
h Sc
hoo
l
*Life
Aca
dem
y
Oak
land
Tec
hnic
al H
igh
Scho
ol
FIGURE 2B Similarly, incoming 9th graders are more likely to be at or above proficiency in charter schools as compared to district-run schools
PROFICIENCY OF INCOMING 9TH GRADE STUDENTS (NEW TO SCHOOL) ON ENGLISH LANGUAGE ARTS PORTION OF SBAC

13
Late Entrants:
Students entering later in the school year can create challenges, both from an individualized planning perspective and for building relationships.8 In addition, though data for this analysis was not available to confirm it, Steering Committee members reported anecdotally that students entering a school later are also more likely to have other significant needs. As shown in Figure 3, in Oakland, we saw that district-run schools had more students enrolling after October 1 than did charter schools—a median of 7.1% of students compared to 2.3%.
Charter Schools District-runSchools
0%
2%
4%
6%
1%
3%
5%
7%
8%
2.3%
7.1%
FIGURE 3 As compared to charter schools, district schools have a higher percentage of students who enter the school in October or later 9
MEDIAN % OF STUDENTS ENTERING THE SCHOOL SYSTEM AFTER OCTOBER 1, 2015
# of students entering post 10/1 614 2,989
8. This challenge is also noted in the education literature: “ Teachers associate high student mobility with the extra work necessary to acclimate new students to the existing classroom…” “The teacher must often spend extra time catching the student up to the level or context of the lessons already in progress.” http://www.urbanedjournal.org/archive/volume-3-issue-3-spring-2005/kids-move-effects-student-mobility-nclb-school-accountability-r (Accessed 5/25/2017).
9. This does not account for students who left these schools, only those who entered. This means that the district’s enrollment did not increase by 7.1% after 10/1, but that the total number of students who entered the district after October 1 was 7.1% of the enrollment on October 1, independent of exits. This mobility analysis uses 2015-16 student enrollment data.

14
Special Education:
In understanding special education populations, we considered both the percentage of special education students, and the types of needs of the special education students. Both of these factors have important implications for overall spending. In Oakland, we found that the district-run schools not only served a higher percentage of students in special education settings, but also served a greater proportion of special education students with higher needs.
For the purposes of this study, special education students are those students who have been assigned an Individual Education Program (IEP) as a result of a formally identified learning disability. This study does not comment on the extent to which special education identification practices or the setting in which services are provided are appropriate. It merely provides a data set that shows details on differences in identification and setting across sectors and schools to help generate conversation and action to ensure all students are served equitably. We recognize that identification rates or placement practices may differ across schools and sectors due to philosophical or practice
differences, not because of fundamental differences in student needs. While some categories of special need are more likely to be identified objectively such as blindness or deafness, others may be more subject to a particular system’s beliefs or practices.
Though there was large variation in special education enrollment across schools, on average district-run schools served a higher proportion of students with disabilities, compared to charter schools, as shown in Figure 4.
District-run schoolsCharter schools0%
4%
8%
12%
2%
6%
10%
14%
7%
12%
FIGURE 4 12% of students in district-run schools are identified for special education services, compared to 7% at charters10
% OF SPECIAL EDUCATION STUDENTS
10. This includes 246 OUSD students served in private placements, hospital homebound and residential facilities. These 246 students are not included in further explorations of special education student-level data in the remainder of this report due to data availability.
15
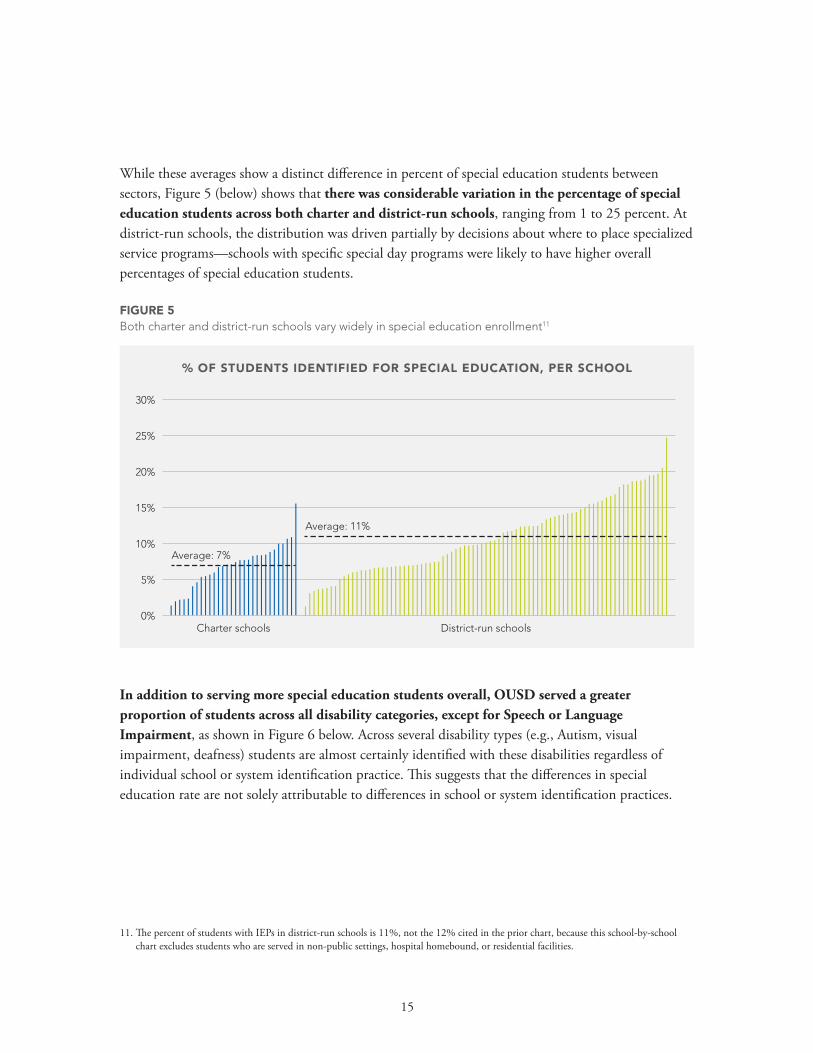
While these averages show a distinct difference in percent of special education students between sectors, Figure 5 (below) shows that there was considerable variation in the percentage of special education students across both charter and district-run schools, ranging from 1 to 25 percent. At district-run schools, the distribution was driven partially by decisions about where to place specialized service programs—schools with specific special day programs were likely to have higher overall percentages of special education students.
In addition to serving more special education students overall, OUSD served a greater proportion of students across all disability categories, except for Speech or Language Impairment, as shown in Figure 6 below. Across several disability types (e.g., Autism, visual impairment, deafness) students are almost certainly identified with these disabilities regardless of individual school or system identification practice. This suggests that the differences in special education rate are not solely attributable to differences in school or system identification practices.
Charter schools District-run schools0%
10%
5%
15%
20%
25%
30%
Average: 7%
Average: 11%
% OF STUDENTS IDENTIFIED FOR SPECIAL EDUCATION, PER SCHOOL
FIGURE 5 Both charter and district-run schools vary widely in special education enrollment11
11. The percent of students with IEPs in district-run schools is 11%, not the 12% cited in the prior chart, because this school-by-school chart excludes students who are served in non-public settings, hospital homebound, or residential facilities.

16
Implications for Oakland: Potential Actions and Further AnalysesThe idea of resource equity is to differentiate resources according to student need. In this section, we saw that student need differs across sectors and schools in three main areas: incoming student proficiency, late entrants, and special education student populations. This suggests several possible next steps:
• Explore further the reasons behind the stark differences in incoming proficiency across sectors at the middle school and high school level—and the extent to which those differences should trigger resource differentiation as a response.
• Explore opportunities for both the district and charter sectors to serve a more equitable percentage of students with higher needs—including needs related to special education, incoming proficiency and “late-entry” students—to ensure that school spending matches student need. This includes increasing parent and student agency in choosing schools by increasing awareness of school options across Oakland, with a focus on families of students with greater needs.
Speech orLanguage
Impairment
SpecificLearningDisability
IntellectualDisability
EmotionalDisturbance
OtherHealth
Impairment
Autism AllOther
0%
1%
2%
3%
4%
5%
3.8%
2.0% 2.0%
4.7%
0.5%
1.3%1.0% 1.1%1.1%
0.2% 0.2%
0.6%0.4%0.3%
Charter schools District-run schools
% OF ALL STUDENTS, BY IDENTIFIED DISABILITY TYPE
FIGURE 6 In most disability categories, district-run schools served a higher percentage of students than charters12
12. This graph includes 83% of all special education students in our charter sample. We did not receive more detailed disability type information for the remaining 17% of students. This graph also does not include the 246 OUSD special education students and fewer than 11 special education students enrolled in Oakland charter schools that were served in non-public settings at public expense.

17
• Analyze late entry students at the individual student level to better understand the extent to which the needs of this group of students is different from the rest of the population.
• Explore opportunities to deepen a shared understanding of special education needs across schools and across sectors.
Question 2: How much do district and charter schools spend on their students?The purpose of this part of the analysis was to look at OUSD and charter school spending levels for students served in 2014-15. This approach sought to examine issues of spending equity, not revenue equity (i.e., how funds allocated to schools across sectors varied based on student need).
The first step to examine the overall spending levels was to see how much each sector spent in two distinct areas: Operating Expenditures and Exclusions/Set-Asides.
• Operating Expenditures refers to the expenses of running the school system each year, such as salaries and benefits for leadership and central office staff, all expenses located at schools (including instruction, school leadership and support, and building upkeep and utilities), and any other services related to district operation, such as transportation.
• Exclusions/Set-Asides refers to anything outside of these categories—in particular, expenses that take place unpredictably across years and/or that don’t relate to district operation in that year. For example, this includes major capital expenses, debt service, rental/ purchase of property, etc. We did not analyze these expenses in detail because of limitations in data availability and comparability. Further analysis is needed to assess equity of revenue and expenses here.
Operating Expenses
All expenses located at schools
(includes those related to instruction, most notably school leadership, teacher, and support staff salaries
and benefits; and building upkeep and utilities)
Salaries and benefits for district or charter leadership and central office staff
Other services related to ongoing district operation, such as transportation
Special education services, including those provided by non-public agencies, or expenses for OUSD special
education students placed in non-public schools
FIGURE 7 Examples of Operating Expenditures and Exclusions/ Set-Asides (not an exhaustive list)
13. For OUSD, Fund 51 was not included as an exclusion (or as operating expense) as it is administered by the Alameda County Treasurer and does not pass through OUSD directly.
Exclusions and Set-Asides
Building and non-building capital, and charter facility rental
Risk management
(Includes worker compensation claims, legal settlements/ torts, etc.)
Early childhood
State debt-service
“Pass-throughs” to other agencies13

18
The study divided expenses this way to create an apples-to-apples comparison of spending across systems and schools.14 It is important to understand the various spending choices made by each system.
Overall, OUSD spent $541 million on its 37,224 students, while the 32 charter schools in the study spent a collective $113 million on their 11,456 students.15 Therefore, as Figure 8 shows, OUSD spent $14,534 per pupil while charter schools spent on average $9,861 per pupil—or a difference of about $4,700. But if we remove the “exclusions/ set-asides” bucket, we see that OUSD spent $11,760 per pupil, and charters, on average, spent $8,972—or a difference of about $2,800 per pupil. This study explores the composition of the $2,800 per pupil difference.
14. This report does not take a perspective on whether exclusions/set-asides spending is distributed equitably—for example, whether capital-designated revenue or responsibility for OUSD’s ongoing state loan repayment from the early 2000s should be shared in some way. Further analysis is needed to explore the most equitable way to distribute non-operating revenue and expenses.
15. This study looked only at expenditures and not at total revenues for 2014-15 for both OUSD and charter schools.
Charter Schools OUSD$0
$4,000
$8,000
$12,000
$14,000
$2,000
$6,000
$10,000
$16,000
$8,972
$11,760
$889
$2,773
$9,861
$14,534
Operating expenditure
Exclusions/set-asides
BREAKDOWN OF AVERAGE SPENDING PER PUPIL
FIGURE 8 Overall, OUSD spent ~$4,700 more per pupil than charter schools. But if we remove activities not directed at schools and students (i.e. exclusions and set asides), the difference in spending is ~$2,800
How to read this chart: If you subtract charter schools’ total spending ($,9,861) from OUSD’s total spending ($14,534), you get $4,673, or roughly $4,700. But if you remove the exclusion and set asides portion (the lighter colored bars), you can focus on only the operating expenditures (the darker colored bars). Subtract charter schools’ operating expenditures ($8,972) from OUSD’s operating expenditures ($11,760), and you get $2,788, or roughly $2,800.

19
Though the average district school spent more than the average charter school, there were large differences in the spending levels of individual schools. Across both sectors, the lowest spending school spent less than half of the top spending school, with spend ranging from $6,600 to $19,600 per pupil.16
Spending adjusted for student needIf we just look at total dollars spent without adjusting that number to account for the level of student need, then we overlook inequity in spending. Two schools can spend an equal number of dollars, but if one has a needier population, it is essentially trying to meet that need with fewer dollars.17
Adjusting for student need cuts the spending difference by about half, to $1,400 per pupil, as shown in Figure 9 below. Three of the seven student need characteristics described in the last section were used in our spending level need adjustment: special education, socioeconomic disadvantage, and English learner status.18
16. Please refer to Appendix 4 for a chart showing individual schools’ per pupil spend.
17. Please see Appendix 5 for a brief description of the methodology used to adjust spend.
18. The very small percentage of foster and homeless youth across both district-run and charter schools resulted in them having no discernible influence on the adjustment calculation.
Unadjusted for student need Adjusted for student need$0
$2,000
$4,000
$6,000
$8,000
$10,000
$12,000
$14,000
$8,972
$11,760
$10,050
$11,452
Charter schools OUSD
$1,402$2,788
PER PUPIL OPERATING SPEND
FIGURE 9 If we adjust per-pupil spending to account for student need, the difference between district and charter schools becomes ~$1,400

20
Unadjusted for student need Adjusted for student need$0
$4,000
$6,000
$8,000
$2,000
$10,000
$12,000
$14,000
$16,000
Median
Schools within 10% of median Schools more than 10% outside the median
41% of schools fall within 10% of the median spending level
67% of schools fall within 10% of the median spending level
Each bar represents one district-run school
This means the adjustment does not cover the other student characteristics of importance identified earlier, particularly incoming academic proficiency and late entrants. As shown earlier, although some individual charter schools were needier than some OUSD schools across these two dimensions of student need, on average OUSD schools were needier than charter schools across these dimensions. We expect that adjusting for these characteristics would further decrease the differences in spend between the charters and OUSD.19
Do Oakland schools which serve higher-needs students spend more?In any district, some schools spend more and some spend less per pupil than their student need profiles would warrant. As Figure 10a shows, OUSD schools vary in how much they spend per pupil. But when we adjust for student need, the differences among schools shrink. This shows that generally, district-run schools with higher student needs spent more per student than those with lower student needs. This is because the district was able to move some resources to higher-needs schools to help them address the challenges they faced.
FIGURE 10A When we adjust for three types of student need, per-pupil spending becomes more similar across district-run schools, reflecting the fact that OUSD spends more on schools with higher needs
19. Among the Steering Committee, there was some concern that OUSD is serving students in more restrictive and therefore more expensive settings. We compared OUSD special education practices to a set of national urban peer districts. Adjusting district spending levels using special education weights found in national urban peer districts would increase the gap by ~$450 per pupil.
PER-PUPIL OPERATING SPEND, PER DISTRICT-RUN SCHOOL
21
Unadjusted for student need Adjusted for student need$0
$4,000
$6,000
$8,000
$2,000
$10,000
$12,000
$14,000
$16,000
Median
Schools within 10% of median Schools more than 10% outside the median
47% of schools are within 10% of median spending level
50% of schools are within 10% of median spending level
Each bar represents one charter school
PER-PUPIL OPERATING SPEND, PER CHARTER SCHOOL
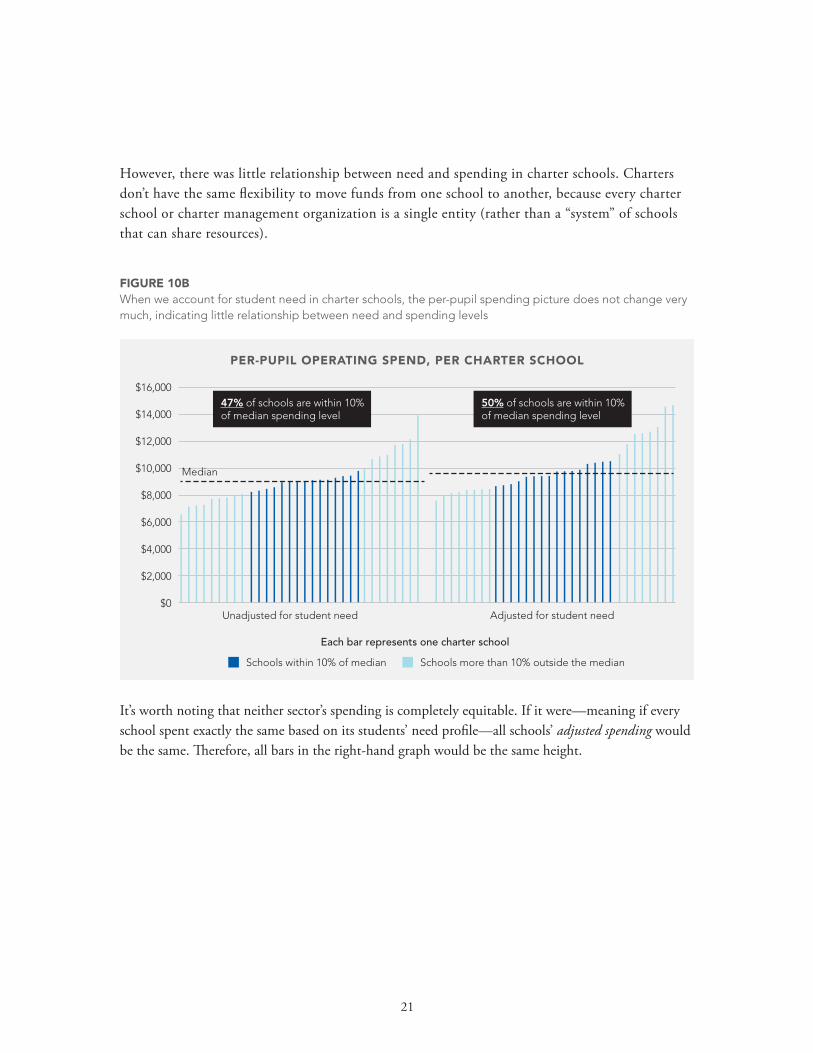
FIGURE 10B When we account for student need in charter schools, the per-pupil spending picture does not change very much, indicating little relationship between need and spending levels
It’s worth noting that neither sector’s spending is completely equitable. If it were—meaning if every school spent exactly the same based on its students’ need profile—all schools’ adjusted spending would be the same. Therefore, all bars in the right-hand graph would be the same height.
However, there was little relationship between need and spending in charter schools. Charters don’t have the same flexibility to move funds from one school to another, because every charter school or charter management organization is a single entity (rather than a “system” of schools that can share resources).

22
Spotlight on State Revenue Funding Cap for High-Needs Charters
Under the Local Control Funding Formula (LCFF), some Oakland charter schools receive fewer dollars than they merit, given their share of high-need students, due to the cap on concentration grant funding. In California, all districts receive funds to serve certain high-need students: those who receive Free and Reduced Price Lunch, English learners, and foster youth. When more than 55% of students meet at least one of these criteria, the district receives extra funds per student. This is called the “concentration grant.” But charter schools are “capped” at the percentage of these students that their local school district serves. In OUSD, 78 percent of students met criteria for the concentration grant in 2014-2015. Any charter school with over 78 percent high-need students did not receive concentration grants to serve those additional high-need students. For example, as Figure 11 shows, Aspire Monarch Academy merits nearly $800 more per pupil, based on its student need profile, than it receives through LCFF. If this funding cap did not exist, 23 charter schools would receive $4.3 million in additional revenue, or $380 per pupil. These funds were and will continue to be inaccessible to charters under current state policy.
$0
$200
$100
$400
$300
$600
$500
$700
$800
KIP
P B
ridg
e C
hart
er
Am
eric
an In
dia
n Pu
blic
Cha
rter
Sch
oo
l II
Urb
an M
ont
esso
ri C
hart
er
Yu M
ing
Cha
rter
Oak
land
Sch
oo
l fo
r th
e A
rts
Eas
t B
ay In
nova
tion
Aca
dem
y
Am
eric
an In
dia
n Pu
blic
Hig
h
Co
mm
unity
Sch
oo
l fo
r C
reat
ive
Ed
ucat
ion
Env
isio
n A
cad
emy
for
Art
s &
Tec
hno
log
y
Asp
ire B
erkl
ey M
ayna
rd A
cad
emy
Oak
land
Cha
rter
Hig
h
Do
wnt
ow
n C
hart
er A
cad
emy
Am
eric
an In
dia
n Pu
blic
Cha
rter
Oak
land
Uni
ty H
igh
Lig
htho
use
Co
mm
unity
Cha
rter
Asp
ire G
olde
n St
ate
Col
lege
Pre
para
tory
Aca
dem
y
Oak
land
Cha
rter
Aca
dem
y
Lig
htho
use
Co
mm
unity
Cha
rter
Hig
h
Vin
cent
Aca
dem
y
Asp
ire T
echn
olo
gy
Cha
rter
Aca
dem
Asp
ire T
rium
ph T
echn
olog
y Ep
ic C
hart
er
Laze
ar C
hart
er A
cad
emy
Lear
ning
With
out
Lim
its
Co
x A
cad
emy
ASC
EN
D
LPS
Oak
land
R &
D C
amp
us
Asp
ire C
olle
ge
Aca
dem
y
Asp
ire E
RE
S A
cad
emy
Asp
ire L
ione
l Wils
on
Co
lleg
e
Prep
arat
ory
Aca
dem
y A
RIS
E H
igh
Ach
ieve
Aca
dem
y
Asp
ire M
ona
rch
Aca
dem
yMedian = $416
FIGURE 11 23 charter schools receive fewer dollars through LCFF than their need would suggest
ESTIMATED PER-PUPIL REVENUE LOST DUE TO LCFF CHARTER FUNDING CAP, PER SCHOOL

23
Implications for Oakland: Potential Actions and Further Analyses After adjusting for student needs such as socioecomic status, English learners, and special education, OUSD’s operating spend per pupil was $1,400 greater than the charter average. But that figure does not take into account significant differences in need such as incoming student proficiency and student mobility. We need to better understand how these additional needs translate to additional costs, and how revenue may be shared accordingly. This will advance equity of per-pupil funding. Additionally, Oakland has a large number of charter schools denied revenue by the concentration of need cap—a particularly large share of schools relative to other cities in California. Some possible next steps include:
• Explore opportunities to differentiate funding for schools consistent with differentiated student needs, including needs related to incoming proficiency and “late-entry” students, as part of a broader rethinking of revenue policies
• Explore advocating for a state legislative change to address the current LCFF cap to provide additional resources to charters serving high need student populations.
Question 3: How do special education spending practices compare across systems? Given the role of special education spending in the equity differences described above, it’s important to understand more deeply the policies and practices that drive these differences. In 2014-2015, OUSD spent 65% more per special education student than the average across charter schools. That difference is due to two key factors: (1) OUSD district schools served a higher percentage of special education students needing specialized services and support; and (2) District-run schools were more likely than charter schools to serve students within each disability type in more restrictive settings, which are generally higher cost.
The magnitude of these two factors is noteworthy: the percent of special education students served in separate settings was 10 times higher in district-run schools than in charter schools. In district-run schools, these students in separate classrooms cost an average of $40,000 per student or nearly 5 times more than the spending on a general education student.
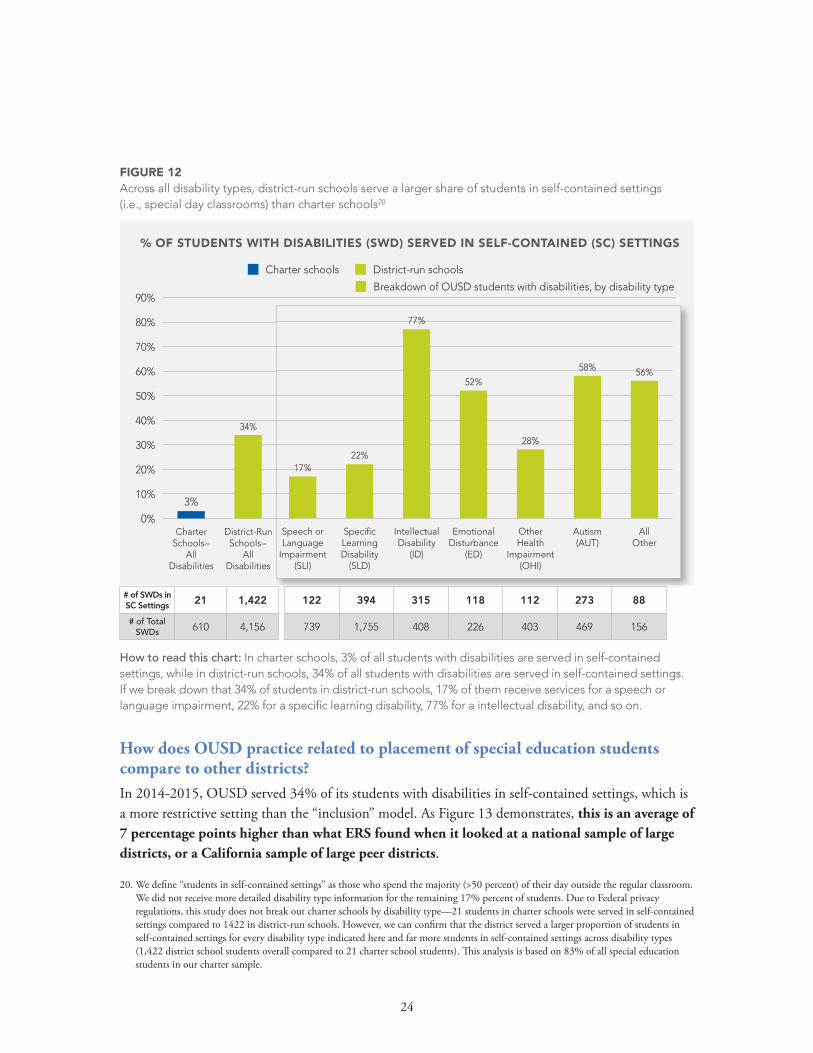
Figure 12 (below) illustrates the second factor identified above: across all disability types, district-run schools served a greater proportion of special education students in more restrictive placements as compared to charters. This could be because the needs of special education students in district-run schools were greater than those served in charters across all disability types (and, therefore required more restrictive placements). Or, it may be because district-run schools were more likely to place a student with a given need in a more restrictive setting than were charter schools. As noted above, this study is not a commentary on the appropriateness of a given special education assessment or placement. However, the wide disparity in placement patterns may require additional evaluation as to why so many special education students in district-run schools were being served in more restrictive environments.
24
How does OUSD practice related to placement of special education students compare to other districts? In 2014-2015, OUSD served 34% of its students with disabilities in self-contained settings, which is a more restrictive setting than the “inclusion” model. As Figure 13 demonstrates, this is an average of 7 percentage points higher than what ERS found when it looked at a national sample of large districts, or a California sample of large peer districts.
FIGURE 12 Across all disability types, district-run schools serve a larger share of students in self-contained settings (i.e., special day classrooms) than charter schools20
20. We define “students in self-contained settings” as those who spend the majority (>50 percent) of their day outside the regular classroom. We did not receive more detailed disability type information for the remaining 17% percent of students. Due to Federal privacy regulations, this study does not break out charter schools by disability type—21 students in charter schools were served in self-contained settings compared to 1422 in district-run schools. However, we can confirm that the district served a larger proportion of students in self-contained settings for every disability type indicated here and far more students in self-contained settings across disability types (1,422 district school students overall compared to 21 charter school students). This analysis is based on 83% of all special education students in our charter sample.
CharterSchools–
AllDisabilities
District-RunSchools–
AllDisabilities
Speech orLanguage
Impairment(SLI)
SpecificLearningDisability
(SLD)
IntellectualDisability
(ID)
EmotionalDisturbance
(ED)
OtherHealth
Impairment(OHI)
AllOther
Autism(AUT)
0%
20%
40%
60%
80%
10%
30%
50%
70%
90%
3%
Charter schools District-run schools
56%58%
28%
52%
77%
22%17%
34%
Breakdown of OUSD students with disabilities, by disability type
% OF STUDENTS WITH DISABILITIES (SWD) SERVED IN SELF-CONTAINED (SC) SETTINGS
# of SWDs in SC Settings 21 1,422
# of Total SWDs 610 4,156
122 394 315 118 112 273 88
739 1,755 408 226 403 469 156
CharterSchools–
AllDisabilities
District-RunSchools–
AllDisabilities
Speech orLanguage
Impairment(SLI)
SpecificLearningDisability
(SLD)
IntellectualDisability
(ID)
EmotionalDisturbance
(ED)
OtherHealth
Impairment(OHI)
AllOther
Autism(AUT)
0%
20%
40%
60%
80%
10%
30%
50%
70%
90%
3%
Charter schools District-run schools
56%58%
28%
52%
77%
22%17%
34%
Breakdown of OUSD students with disabilities, by disability type
How to read this chart: In charter schools, 3% of all students with disabilities are served in self-contained settings, while in district-run schools, 34% of all students with disabilities are served in self-contained settings. If we break down that 34% of students in district-run schools, 17% of them receive services for a speech or language impairment, 22% for a specific learning disability, 77% for a intellectual disability, and so on.

25
FIGURE 13 District-run schools served a larger share of students in self-contained settings compared to a sample of peer districts in California or nationwide 21
Charter Schools
3%
Large Peer Districts–National Sample
26%
Large Peer Districts–California Sample
28%
District-run Schools
34%
0%
5%
10%
15%
20%
25%
30%
35%
% OF STUDENTS WITH DISABILITIES SERVED IN SELF-CONTAINED SETTINGS
21. Large peer districts – national sample includes: Cleveland Metropolitan School District, Austin Independent School District, Prince George’s County Public Schools, Hall County Schools, Fulton County Schools, and Denver Public Schools
Large peer districts – California sample includes: San Francisco Unified, Los Angeles Unified, Hayward Unified, San Diego Unified, Stockton Unified, Sacramento City Unified, San Jose Unified, San Bernardino Unified, Garden Grove Unified, Riverside Unified, Fontana Unified, Santa Ana Unified
Spotlight on Pre-K Students with Disabilities
One reason district-run schools serve both a higher share of special education students and a higher share of special education students in more restrictive placement appears to be because almost all Pre-K students with disabilities were served in district-run schools. And, in 2014-2015, almost all of these students stayed in OUSD (instead of switching to charters) for kindergarten. Nationally, students who are identified for special education as early as Pre-K typically have greater needs than students who are identified later.
As Figure 14 shows, Pre-K students with disabilities are more likely to be enrolled in district-run schools than in charter schools. Moreover, they enroll in district-run schools at a far greater rate even than other students with disabilities.
continued

26
OUSD district-run schools’ tendency to serve special education students in more restrictive settings was a key reason that the district spent more on special education than it received to cover those costs. In fact, OUSD’s spend on special education was more than twice the amount of the earmarked special education revenue it received in 2014-15, a reality that repeats itself every year. Figure 15 (below) illustrates that although the district received $540 more per OUSD district school student in special education revenue than charter schools received per student, OUSD spent $1,548 more per special education student. For district-run schools, the combination of high student need, restrictive placements, and revenue not matching the resources used to meet the severity of disabilities resulted in the district spending substantially more than it received for special education students. To the extent that special education students in district-run schools were over-placed in restrictive settings, it was doubly costly—those over-placements didn’t truly meet students’ needs and they siphoned resources that could have been used for other purposes.
All Students Students with Disabilities Pre-K Studentswith Disabilities
0%
40%
60%
80%
20%
100%
24%
76%
16%
84%
98%
Attend a district-run school
Attend a charter school
2%
FIGURE 14 98% of Pre-K students with disabilities attend district-run schools
% OF STUDENTS CITYWIDE* (*Includes the 86 district-run schools and 32 charter schools in this study)

27
Special Education Revenue Special Education Spend$0
$500
$1,000
$1,500
$2,000
$2,500
$3,000
Do
llars
Per
Pup
il (a
ll st
uden
ts in
clud
ed)
$519
$1,060 $928
$2,476
Charter Schools OUSD
$541
$1,548
SPECIAL EDUCATION REVENUE VS EXPENSE PER PUPIL
FIGURE 15 District-run schools do receive more special education revenue per-pupil, but their costs are also significantly higher than charter schools’
Implications for Oakland: Potential Actions and Further Analyses Across schools in Oakland, we see differences in placement practices, with district-run schools serving substantially more students in self-contained settings. This has implications for the educational experiences of special education student across the city, as well as the costs of serving those students. Looking ahead, there are opportunities to explore options to improve service delivery and outcomes for students with disabilities across the city, while maximizing efficiency:
• Explore more fully the use of less restrictive placements and highlight across sectors high-quality programs that meet student needs cost effectively and in less restrictive settings
• Identify opportunities, where appropriate, to increase special education student access to least restrictive environments, particularly at district-run schools
• Explore potential to grow state special education revenue citywide by redesigning the Oakland SELPA structure

28
22. This study explored the structures of the El Dorado and Oakland Unified SELPAs, not the Sonoma County SELPA, where only one Oakland charter school was a member.
Spotlight on Special Education Local Plan Areas, or SELPAThree important factors contribute to the special education context in Oakland:
1) Every Local Education Agency (or LEA—i.e. a district, or a charter school or network) in California belongs to a ‘Special Education Local Plan Area’ or SELPA. SELPAs are the organizations that receive revenue from the state earmarked for special education and that provide special education programs, services, and/or revenues for students requiring special education services within a defined region.
2) Revenue to support special education is distributed by the state based on the average daily attendance (ADA) for all students, not the number or level of need for special education students in that region.
3) As in most cities, the revenue that LEAs receive for special education services does not cover the costs of delivering special education services. This means that LEAs pay for special education services partially with general fund dollars. That means fewer resources available for other purposes, including early intervention and remediation, that could help students stay in mainstream classes.
In 2014-2015, Oakland schools belonged to one of three SELPAs. All district-run schools—as required—belonged to the Oakland Unified (OUSD) SELPA. Oakland charter schools, who may choose their SELPA, belonged to either the OUSD SELPA, the El Dorado County SELPA (EDCOE), or Sonoma County SELPA. Of our charter sample in this study,
•23 charter schools belonged to the EDCOE SELPA
•8 belonged to the OUSD SELPA
•1 belonged to the Sonoma County SELPA.22
Generally, money flows in and out of the SELPA as follows: SELPAs receive revenue from the state based on the average daily attendance (ADA) of its schools, and a predetermined, SELPA-specific ADA rate based on historical calculations. The SELPA can then choose how it provides dollars and/or services to its schools. This structure plays out differently in the OUSD and the EDCOE SELPAs.
continued

29
Oakland Unified SELPA:
In the Oakland Unified SELPA revenue comes into the SELPA from the state based on the ADA of all schools in the SELPA, both district and charter.23 The SELPA then provides services to all schools and students within the SELPA. The cost of providing those services exceeds the revenue that the OUSD SELPA receives from the state. To cover those additional expenses, the OUSD SELPA divides the extra cost equally by the ADA of the SELPA. This means that financially, every school contributes equally to serving all students in the OUSD SELPA. Since the OUSD SELPA served a needier student population of special education students, the average extra spending by charter schools in the OUSD SELPA is higher than it would be if charter schools were responsible for only the extra spending on their students. Another factor leading to higher costs in the OUSD SELPA is the use of restrictive settings for students.
El Dorado SELPA:
As part of the SELPA structure, charter schools are allowed to opt out of their local SELPA and into other SELPAs. In 2014-15, 23 Oakland charter schools had opted to make the switch to EDCOE.
Like the OUSD SELPA, revenue comes into the EDCOE SELPA from the state based on ADA. However, unlike the OUSD SELPA, the EDCOE SELPA passes revenue directly through to its member schools. The EDCOE SELPA charges each charter school a flat percentage of its special education revenue (based on ADA) and passes the remaining dollars to schools regardless of the number of special education students in the school. Each school then decides on its own what special education services to purchase and, when necessary, covers its own excess costs to do so.
How does this impact schools in Oakland?
The state special education funding system and SELPA structure described above pose challenges for cities with both district and charter schools. In Oakland these challenges play out in multiple ways:
• Since 2014- 2015, nearly all charter schools have left the OUSD SELPA. The way the OUSD SELPA is structured, lower need special education schools are subsidizing the costs of higher need schools and students in the city. This means lower need charter schools spend more in the OUSD SELPA than they would if they moved to the EDCOE SELPA. This increased cost, along with the lack of control over the quality of service, were cited as two primary reasons for charters to exit the OUSD SELPA.
23. The ADA rate used by the state in the Oakland Unified SELPA is higher than it is for EL Dorado, based on historical spend. As such, the more students participating in the OUSD SELPA, the more state revenue for special education is allocated to Oakland schools.
continued

30
Implications for Oakland: Potential Actions and Further AnalysesGiven the challenges that the state funding system and SELPA structure pose, potential actions to explore include:
• Advocate for changes to the state special education funding system, to create an “equal playing field” for district and charter schools to serve special education students in placements and settings aligned with their needs and learning objectives.
• Identify opportunities to optimize special education resources within the city by creating financial incentives that encourage all schools to invest in serving special education students without also incentivizing over-identification.
• Redesign the Oakland Unified SELPA financing model to re-capture Oakland charter schools that have exited to the El Dorado SELPA.
• As charter schools leave the OUSD SELPA, it leaves fewer schools left to contribute towards students served in higher cost placements. The schools left to cover the costs are those that do not have the flexibility to switch SELPAs—specifically district-run schools, which creates further reallocation of general education revenue to special education cost.
• Additionally, once charter schools are in the EDCOE SELPA, the financial incentives operate against their missions and the desire to serve all students by discouraging them from taking on additional special education students in their schools. Since schools in the EDCOE SELPA pay on their own, as schools take on additional special education students, they also must take on any additional costs to cover those students. Similarly, since the state revenue formula is based on ADA for all students (not just special education students), schools with higher special education populations are not necessarily receiving additional revenue to cover those costs.
o Note: We recognize that there are many other factors (including non-financial factors) that impact special education populations. We simply note that the current state SELPA structure creates a financial disincentive to take on additional special education students or those with greater needs. To be clear, ERS did not find any evidence that charters in the EDCOE SELPA deterred enrollment or limited access of students with disabilities.
• Finally, as schools exit the OUSD SELPA, the city of Oakland loses out on the additional state special education revenue that would be generated from the higher state ADA rate at OUSD SELPA, as compared to the El Dorado SELPA. In 2014-15 district and charter schools in Oakland missed out on a potential $9.2 million of special education revenue due to the loss of Oakland charter schools from the Oakland SELPA to the ED SELPA.

31
Question 4: How was resource use different between charter and district-run schools?District and charter schools face different structural and policy conditions that influence their overall spending. OUSD has economies of scale that charters do not. Charters have more flexibility on how to structure staff compensation and do not have “legacy costs” that result from historical spending patterns. In this section, we describe several important differences in how resources were used across sectors and lay out some potential next steps for stakeholders interested in exploring how to improve the effectiveness of resource use across sectors.
Student and Teacher TimeBefore going into differences in the use of financial resources, it’s important to start with the fact that charters, on average, have 183 more hours annually in contract-required teacher time per day, per teacher, which enables them to provide more instructional time to students.24 If all teachers in the district were contracted to work 183 more hours annually, this would result in an additional 380,000 teacher hours per year. This is equivalent to the district hiring an additional 297 teachers under the current contracted schedule, an increase of 14% in the current teacher workforce.
Teachers and Teacher CompensationTeachers were the single biggest piece of total spending in district-run and charter schools. As Figure 16 (below) illustrates, teacher compensation in OUSD comprised 37 percent of total operating spend—roughly $4,342 per pupil before adjusting for student need. At 39 percent of total operating spend, the charter average spend was $3,510 per pupil, a difference of $831 per pupil before adjusting for student need.
24. Additional hours based on additional hours per day and does not take into account additional hours from differences in length of school year. Steering Committee members reported anecdotally that charters tend to have longer school years, which means the 183 additional hours likely understates the size of the difference. Please note that required hours are not the same as actual hours worked and that teachers across both sectors often work more than their contracted hours. This study does not capture differences in actual hours worked across schools.
Charter Schools District-run Schools$0
$2,000
$4,000
$5,000
$1,000
$3,000
$1,500
$3,500
$4,500
$500
$2,500
$3,510
$4,342
PER PUPIL SPENDING ON TEACHER COMPENSATION
FIGURE 16 OUSD spent about $800 per pupil more on teacher compensation (salaries and benefits) than charter schools

32
Charter Schools OUSD$0
$30,000
$50,000
$70,000
$80,000
$20,000
$40,000
$60,000
$90,000
$10,000
$52,885 $56,339
$13,522
$21,708$66,407
$78,047
Average BenefitsAverage Salary
AVERAGE TEACHER COMPENSATION (SALARY + BENEFITS)
FIGURE 17 OUSD’s higher spending on total teacher compensation is largely due to its higher benefits costs
Average years teaching in the LEA per teacher 2.5 9.0
This difference in total spend was driven by two factors. First, OUSD had a slightly smaller student-teacher ratio of 18:1 compared to 19:1 in charter schools. If OUSD had the same student-teacher ratio as the charter average, the difference in per pupil spend would be reduced to $574 per pupil. OUSD’s larger investment in the number of teachers was driven by special education—16 percent of teachers in district-run schools were special education teachers compared to just 5 percent of charter school teachers. Excluding special education teachers and students served only by special education teachers, charter schools and district-run schools had the same student-teacher ratio of 20:1.
Second, the spending on total compensation was significantly higher for teachers in district-run schools: $78,000 per teacher compared to the charter average of $66,000. As Figure 17 (below) illustrates, most of the compensation difference was due to higher average benefits spending, likely driven by two things: (1) differences in the benefit package offerings, (i.e., the district package may have offered additional benefits than charter school packages); and (2) differences in the mix of personnel who received benefits packages, (i.e., the age of personnel or percentage of personnel on single vs. family plans) and the associated cost of their coverage. Teacher average salaries were $3,500 higher in district-run schools. This difference appeared to be caused not by a higher salary schedule on the district side, but rather a more experienced teaching force (9.0 years of experience in the LEA on average for the district, compared to 2.5 years of experience in the LEA on average for charters.)

33
Teacher Time and CompensationThe differences in the average amount of required time for teachers combined with differences in compensation translated to charter schools spending significantly less than district-run schools per contract hour of teacher time—roughly 35% less on average. Holding aside potential differences in instructional effectiveness and teacher turnover that were beyond the scope of this project, these differences suggest that, dollar for dollar, charter schools can allocate larger quantities of teacher time to classrooms than can district-run schools.
Leadership and Business ServicesThe district spends less per pupil on Leadership and Business Services than does the average charter school, as shown in Figure 18 below. This was likely due to economies of scale: the larger district, which operated a large number of schools, could provide management functions at a lower cost per pupil than the multiple, relatively small charter schools/organizations, each of which required its own separate set of these functions.
Operations and Maintenance The district’s higher spend per pupil on Operations and Maintenance occurred across all functions, with the biggest spending differences in facilities and maintenance and student transportation, as shown in Figure 19. For transportation specifically, OUSD incurred 96 percent of its transportation spending to transport students with disabilities; for charters, conversely, transportation expense was minimal.
Note: We did not have detailed-enough data to break out spending by specific function for the charter school sector, which is why that bar is solid. We did have this data for district-run schools.
District
$1,732
Charter$0
$1,000
$500
$1,500
$2,000
$2,500
$2,014$25 Insurance$33 Communications$43 Student Assignment$51 Legal$95 Research & Accountability$111 Governance$144 School Supervision$147 Human Resources$147 Data Processing & Information Services$207 Finance, Budget, Purchasing & Distribution$729 School Administration
$ PER PUPIL ON LEADERSHIP AND BUSINESS SERVICES
FIGURE 18 Charters spend nearly $300 more per pupil more on leadership and business services than district-run schools, which would come to $3.2 million total for all charter schools studied
% of Total Direct Support Spend 22% 15%
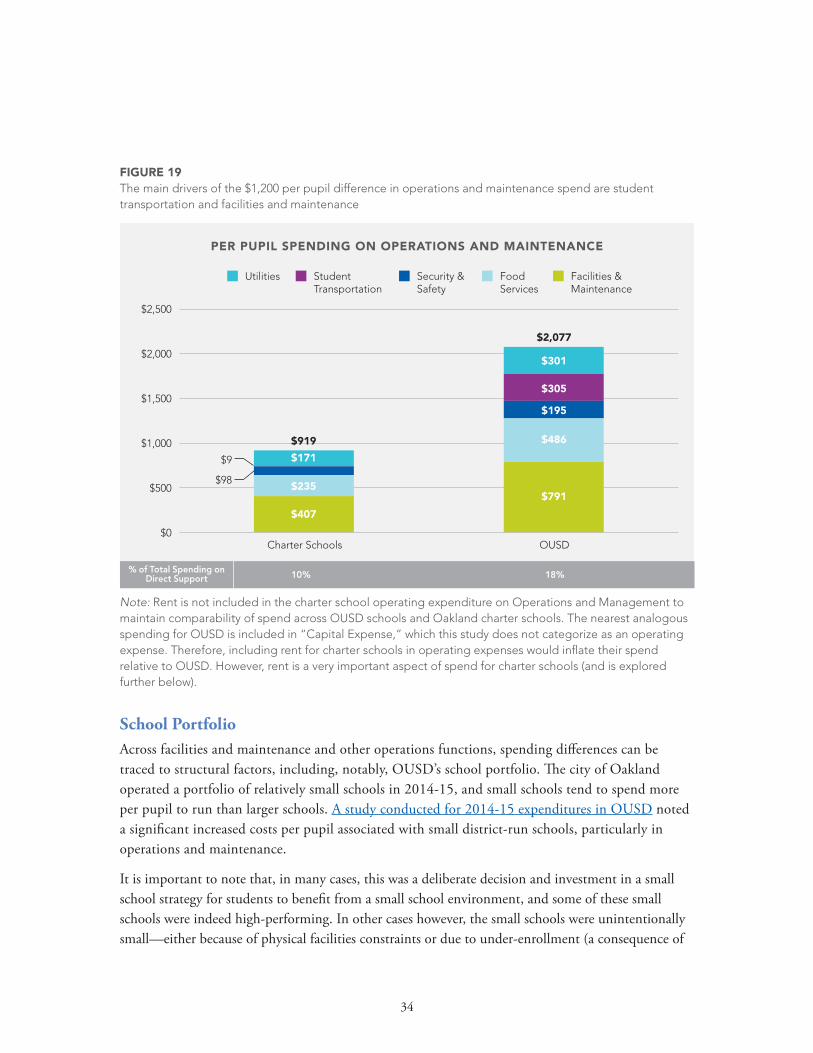
34
Note: Rent is not included in the charter school operating expenditure on Operations and Management to maintain comparability of spend across OUSD schools and Oakland charter schools. The nearest analogous spending for OUSD is included in “Capital Expense,” which this study does not categorize as an operating expense. Therefore, including rent for charter schools in operating expenses would inflate their spend relative to OUSD. However, rent is a very important aspect of spend for charter schools (and is explored further below).
FIGURE 19 The main drivers of the $1,200 per pupil difference in operations and maintenance spend are student transportation and facilities and maintenance
School PortfolioAcross facilities and maintenance and other operations functions, spending differences can be traced to structural factors, including, notably, OUSD’s school portfolio. The city of Oakland operated a portfolio of relatively small schools in 2014-15, and small schools tend to spend more per pupil to run than larger schools. A study conducted for 2014-15 expenditures in OUSD noted a significant increased costs per pupil associated with small district-run schools, particularly in operations and maintenance.
It is important to note that, in many cases, this was a deliberate decision and investment in a small school strategy for students to benefit from a small school environment, and some of these small schools were indeed high-performing. In other cases however, the small schools were unintentionally small—either because of physical facilities constraints or due to under-enrollment (a consequence of
Charter Schools OUSD$0
$1,000
$2,000
$2,500
$500
$1,500
$407
$171
$235$791
$195
$305
$301
$98
$9
$2,077
$486$919
Utilities Student Transportation
Security &Safety
FoodServices
Facilities &Maintenance
PER PUPIL SPENDING ON OPERATIONS AND MAINTENANCE
% of Total Spending on Direct Support 10% 18%

35
the district’s declining enrollment). Dollars used to meet higher per pupil spending needs in small schools—particularly under-enrolled/under-performing small schools—could potentially be used more effectively for other purposes.
On average both charter and OUSD schools were smaller compared to their counterparts across the state.25 As Figure 20 indicates, the city of Oakland has the smallest average school size among California cities (this includes both charter and district-run schools). If Oakland had the same average school size citywide (charters and OUSD combined) as the median California peer city, it would operate 45 fewer schools.
Oak
land
San
Fran
cisc
o
Los
Ang
eles
Hay
war
d
San
Die
go
Sto
ckto
n
San
Jose
San
Ber
nard
ino
Sacr
amen
to
Sant
a A
na
Font
ana
Riv
ersi
de
0
200
400
600
800
1,000
100
300
500
700
900
404
481
573617 625 627 629 644 658
827885 890
AVERAGE # OF STUDENTS PER SCHOOL, ACROSS A SAMPLE OF CALIFORNIA DISTRICTS
FIGURE 20 The City of Oakland operates a portfolio of small schools, relative to other California cities
25. While the average school size is smaller, it is important to note that a strategic portfolio of schools incorporates many factors in addition to school size. Most important is to create a set of schools that assure equitable access to high quality, cost effective educational opportunities for students across Oakland.

36
RentThe differences in facilities spending noted above do not incorporate rental costs for charter schools, which varies widely depending on the school, as Figure 21 illustrates. This represents significant opportunity cost for charters schools—spending more on rent means less to spend elsewhere. Additionally, if OUSD has the ability to lease these spaces to charter schools then the district can increase its revenue while allowing schools across the city to increase their investments in other areas. If the 16 charter schools above the median rent expenditure had instead spent the median amount of $651 per pupil, those schools would have spent $3.4 million less on rent.
$0
$1,600
$1,200
$1,600
$800
$400
$2,000
$2,400
Am
eric
an In
dia
n Pu
blic
Cha
rter
Sch
oo
l II
Ach
ieve
Aca
dem
y
Co
x A
cad
emy
Am
eric
an In
dia
n Pu
blic
Cha
rter
Laze
ar C
hart
er A
cad
emy
KIP
P B
ridg
e A
cad
emy
Urb
an M
ont
esso
ri C
hart
er
Am
eric
an In
dia
n Pu
blic
Hig
h
Lear
ning
With
out
Lim
its
Lead
ersh
ip O
akla
nd R
&D
Co
mm
unity
Sch
oo
l fo
r C
reat
ive
Ed
ucat
ion
Eas
t B
ay In
nova
tion
Aca
dem
y
ASC
EN
D
Yu M
ing
Cha
rter
Oak
land
Sch
oo
l fo
r th
e A
rts
Oak
land
Cha
rter
Hig
h
Vin
cent
Aca
dem
y
Lig
htho
use
Co
mm
unity
Cha
rter
Hig
h
Asp
ire B
erkl
ey M
ayna
rd A
cad
emy
Env
isio
n A
cad
emy
for
Art
s &
Tec
hno
log
y
Lig
htho
use
Co
mm
unity
Cha
rter
Asp
ire E
RE
S A
cad
emy
Asp
ire T
rium
ph
Tech
nolo
gy
Aca
dem
y
Oak
land
Uni
ty H
igh
Aris
e
Do
wnt
ow
n C
hart
er A
cad
emy
Asp
ire M
ona
rch
Aca
dem
y
Asp
ire C
olle
ge
Aca
dem
y
Ep
ic C
hart
er
Asp
ire L
ione
l Wils
on C
olle
ge P
repa
rato
ry A
cade
my
Asp
ire G
olde
n St
ate
Col
lege
Pre
para
tory
Aca
dem
y
Oak
land
Cha
rter
Aca
dem
y
$2,249
$190
Median = 651
Long-Term LeasesCharters that rented from OUSD Prop 39 Leases{
$ PER PUPIL SPENT ON RENT/LEASE BY CHARTER SCHOOL
FIGURE 21 The amount that charter schools spend on rent varies, but those who rent from OUSD spend significantly less than others 26
26. Expenses included here as rent may be debt service for a purchased facility for one participating charter. The inclusion of this expense in this section for this school does not change the implications for the sector overall.

37
Implications for Oakland: Potential Actions and Further AnalysesAs we’ve seen above, spending differences across district and charter schools appear in many ways. Several opportunities exist to spend resources more effectively to increase access to high-quality schools across Oakland.
• Rethink how the city allocates space for charter schools and how it charges them, given the large differences in charter rent costs across schools, particularly between charters that rent from OUSD and those that do not
• Create a district portfolio that serves Oakland’s students better and more cost effectively: increase school space utilization to reduce overhead per pupil costs that will permit expanded services and increase student access to high-quality programming options (e.g., Pathway options).
• Create service sharing opportunities across charter schools and between district and charter sectors to maximize spending efficiency while maintaining/improving service quality
• Identify opportunities to increase operating flexibilities in district-run schools in areas such as length of school day
ConclusionThe goal of this project was to establish a fact base to help make informed decisions for Oakland’s children. This study does not answer all the questions that the community undoubtedly has about its schools—but it is the necessary first step in moving Oakland towards having an equitable system of schools. Using these facts, we hope that the Oakland community will be empowered to make decisions that lead to all students, regardless of background, having access to a high-quality education.

38
Appendix 1 Glossary of Terms
• Spending Categories:
o Leadership & Business Services–total resources spent on leadership of schools and the school district, as well as on providing the business infrastructure needed to run the district and support schools
o Operations and Maintenance (O&M)–total resources spent on providing operational support to schools and the school district
• LCFF–refers to the “Local Control Funding Formula”, the finance policy that determines how much funding each public school system in California receives. For school districts and charter schools, the LCFF provides base, supplemental, and concentration grants based on student enrollment and need.
• SELPA–stands for Special Education Local Plan Area. SELPAs are made up of school districts and county offices of education within particular geographic areas. SELPAs are the organizations that receive revenue from the state earmarked for special education and that provide special education programs, services, and/or revenues for students requiring special education services within a defined region.
• Students in special education self-contained/special day classes–Students served in the regular (general education) classroom for less than 50% of the day
Appendix 2 The Charter School Sample32 out of the 37 Oakland charter schools serving students during the 2014-2015 school year participated in this study, representing 88% of students in Oakland charter schools.
ALL APPENDICES

39
The charter sample is representative of the student demographics of the entire charter sector in terms of student demographics, with similar levels of socioeconomically disadvantaged students and English learners (Data on special education was not available for non-participating charter schools).
While this study did not deeply explore issues related to race, it is important to acknowledge the role that race plays in how students experience their education. The chart below shows that the participating charter schools’ racial demographics were similar to those of the charter sector overall in Oakland.

40
Appendix 3 Differences in racial composition There were significant differences in racial composition between sectors and across both charter and district schools. The charts below show the percent of students of each race, sorted in ascending order by percent of African-American students, for charter schools and district-run schools. The dotted lines show the average percent of African-American students in each sector. Each bar represents one school.

41
These graphs show the same data, but sorted so that the percent of Latino students sits on the bottom of the chart. Each bar represents one school.
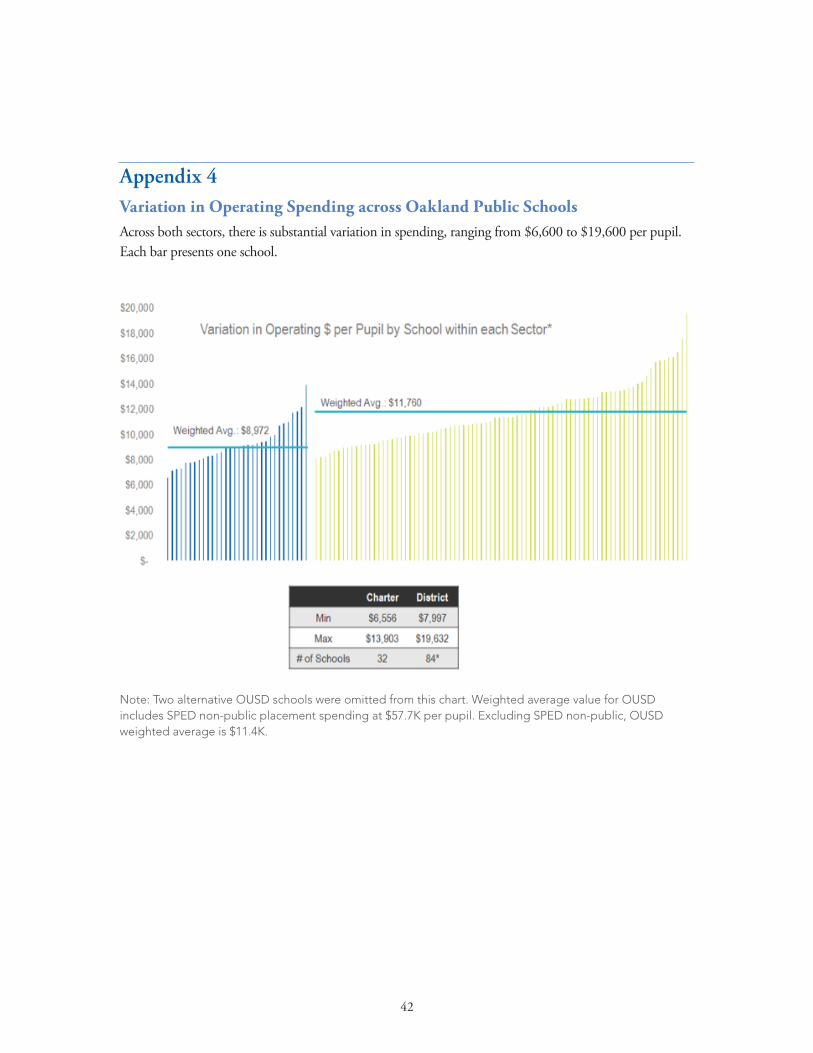
42
Appendix 4Variation in Operating Spending across Oakland Public SchoolsAcross both sectors, there is substantial variation in spending, ranging from $6,600 to $19,600 per pupil. Each bar presents one school.
Note: Two alternative OUSD schools were omitted from this chart. Weighted average value for OUSD includes SPED non-public placement spending at $57.7K per pupil. Excluding SPED non-public, OUSD weighted average is $11.4K.
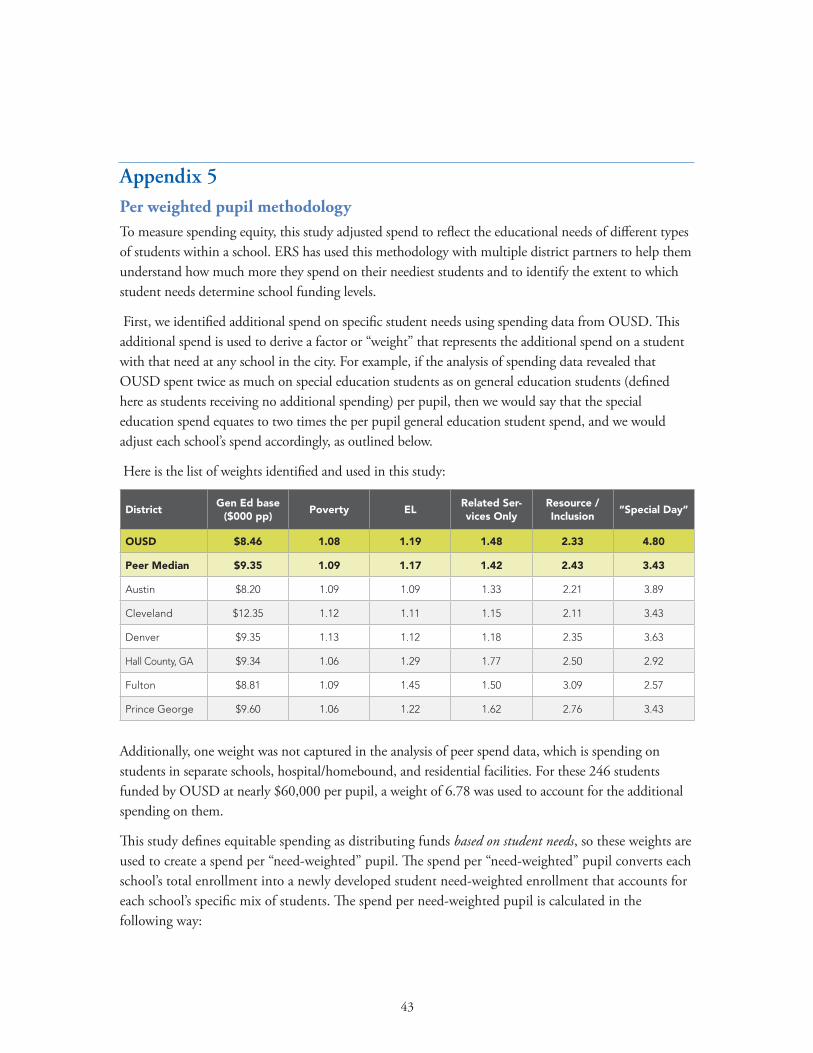
43
Appendix 5Per weighted pupil methodology To measure spending equity, this study adjusted spend to reflect the educational needs of different types of students within a school. ERS has used this methodology with multiple district partners to help them understand how much more they spend on their neediest students and to identify the extent to which student needs determine school funding levels.
First, we identified additional spend on specific student needs using spending data from OUSD. This additional spend is used to derive a factor or “weight” that represents the additional spend on a student with that need at any school in the city. For example, if the analysis of spending data revealed that OUSD spent twice as much on special education students as on general education students (defined here as students receiving no additional spending) per pupil, then we would say that the special education spend equates to two times the per pupil general education student spend, and we would adjust each school’s spend accordingly, as outlined below.
Here is the list of weights identified and used in this study:
DistrictGen Ed base
($000 pp)Poverty EL
Related Ser-vices Only
Resource / Inclusion
“Special Day”
OUSD $8.46 1.08 1.19 1.48 2.33 4.80
Peer Median $9.35 1.09 1.17 1.42 2.43 3.43
Austin $8.20 1.09 1.09 1.33 2.21 3.89
Cleveland $12.35 1.12 1.11 1.15 2.11 3.43
Denver $9.35 1.13 1.12 1.18 2.35 3.63
Hall County, GA $9.34 1.06 1.29 1.77 2.50 2.92
Fulton $8.81 1.09 1.45 1.50 3.09 2.57
Prince George $9.60 1.06 1.22 1.62 2.76 3.43
Additionally, one weight was not captured in the analysis of peer spend data, which is spending on students in separate schools, hospital/homebound, and residential facilities. For these 246 students funded by OUSD at nearly $60,000 per pupil, a weight of 6.78 was used to account for the additional spending on them.
This study defines equitable spending as distributing funds based on student needs, so these weights are used to create a spend per “need-weighted” pupil. The spend per “need-weighted” pupil converts each school’s total enrollment into a newly developed student need-weighted enrollment that accounts for each school’s specific mix of students. The spend per need-weighted pupil is calculated in the following way:

44
• Multiply the actual enrollment of specific student sub-populations at a given school that receive additional spending by the identified additional spend on each (ie: their enrollment times the “need weights” from the table above, including “weights” for general education students and a base amount for all students)
• Sum the need-weighted enrollment of all schools across the city and divide by the total actual enrollment citywide prior to the adjustment (ie: simple count of students) to obtain a “gross-up factor.” This factor represents the city’s increase in weighted enrollment due to student needs
• Divide the need-weighted enrollment at each school by this gross-up factor to obtain the school’s relative need-weighted enrollment. This is done to preserve the total enrollment citywide but allows for comparing the relative need of one school vs another
• Divide total spend per school by the need-weighted enrollment to obtain need-adjusted spend per pupil, or as ERS calls it, “spend per weighted pupil.” This metric reflects spending per pupil by school accounting for student needs
Please note that due to data limitations on charter school expenditures, this study uses weights based solely on OUSD spending data. We recognize that charter school spending patterns are not the same as OUSD or as other charter schools—for this reason, the study also verified the magnitude of OUSD’s student weights compared to other large, urban districts. Only one weight is significantly different from urban peers, the “special day” weight. Changing the special day weight to that of the median urban peer increases the difference between charter and district need-adjusted spend by $450 per pupil, or 4%.
Given that OUSD reflects important Oakland context not captured by peer districts, the study opted to use OUSD’s student weights. It is also important to note that this adjustment is based on spending, not revenue data. An analysis of need-adjusted revenue is separate and would require further investigation.

45
Education Resource Strategies | 480 Pleasant Street, Suite C–200 | Watertown, MA 02472 | Phone: 617.607.8000
ERS is a non-profit organization dedicated to helping urban school systems organize talent, time, and money to create great schools at scale. For more information, see ERStrategies.org.
© 2017 Education Resource Strategies. All rights reserved.