student profiles fall 2011 - alamo colleges district...st. philip's college ethnicity, gender,...
TRANSCRIPT

STUDENT PROFILES FALL 2011
INSTITUTIONAL PLANNING, RESEARCH & EFFECTIVENESS
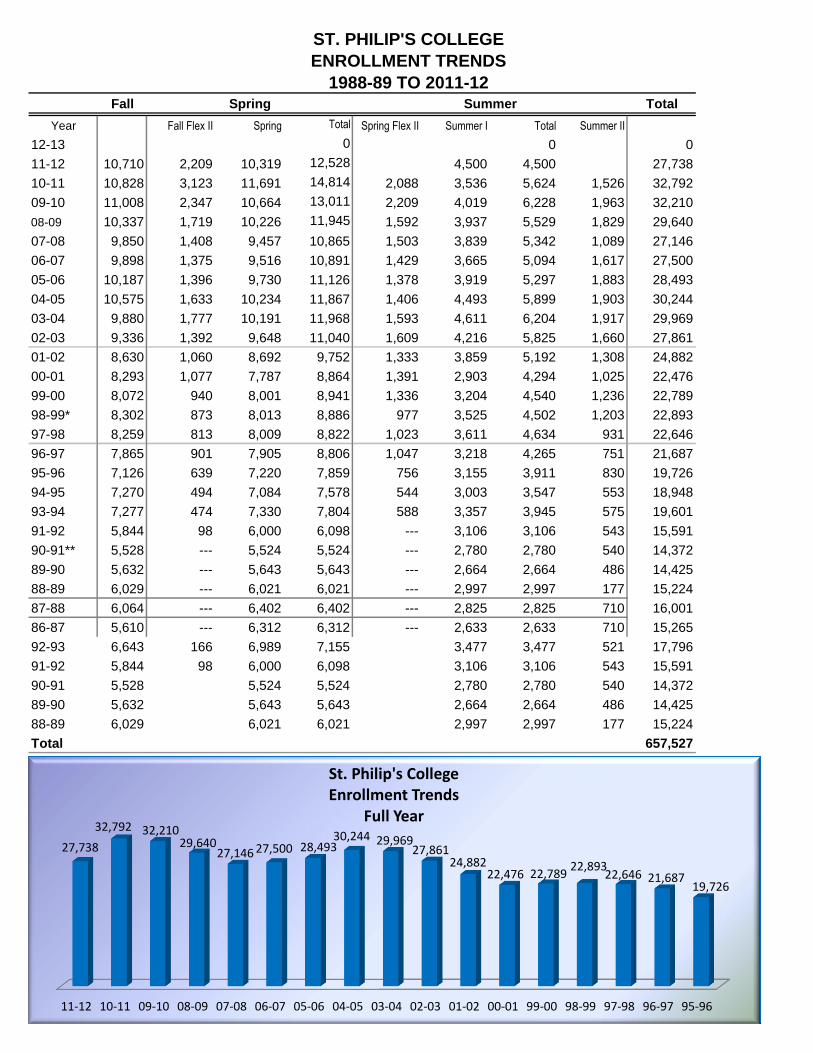
ST. PHILIP'S COLLEGE
ENROLLMENT TRENDS
1988-89 TO 2011-12Fall Total
Year Fall Flex II Spring Total Spring Flex II Summer I Total Summer II
12-13 0 0 0
11-12 10,710 2,209 10,319 12,528 4,500 4,500 27,738
10-11 10,828 3,123 11,691 14,814 2,088 3,536 5,624 1,526 32,792
09-10 11,008 2,347 10,664 13,011 2,209 4,019 6,228 1,963 32,210
08-09 10,337 1,719 10,226 11,945 1,592 3,937 5,529 1,829 29,640
07-08 9,850 1,408 9,457 10,865 1,503 3,839 5,342 1,089 27,146
06-07 9,898 1,375 9,516 10,891 1,429 3,665 5,094 1,617 27,500
05-06 10,187 1,396 9,730 11,126 1,378 3,919 5,297 1,883 28,493
04-05 10,575 1,633 10,234 11,867 1,406 4,493 5,899 1,903 30,244
03-04 9,880 1,777 10,191 11,968 1,593 4,611 6,204 1,917 29,969
02-03 9,336 1,392 9,648 11,040 1,609 4,216 5,825 1,660 27,861
01-02 8,630 1,060 8,692 9,752 1,333 3,859 5,192 1,308 24,882
00-01 8,293 1,077 7,787 8,864 1,391 2,903 4,294 1,025 22,476
99-00 8,072 940 8,001 8,941 1,336 3,204 4,540 1,236 22,789
98-99* 8,302 873 8,013 8,886 977 3,525 4,502 1,203 22,893
97-98 8,259 813 8,009 8,822 1,023 3,611 4,634 931 22,646
96-97 7,865 901 7,905 8,806 1,047 3,218 4,265 751 21,687
95-96 7,126 639 7,220 7,859 756 3,155 3,911 830 19,726
94-95 7,270 494 7,084 7,578 544 3,003 3,547 553 18,948
93-94 7,277 474 7,330 7,804 588 3,357 3,945 575 19,601
91-92 5,844 98 6,000 6,098 --- 3,106 3,106 543 15,591
90-91** 5,528 --- 5,524 5,524 --- 2,780 2,780 540 14,372
89-90 5,632 --- 5,643 5,643 --- 2,664 2,664 486 14,425
88-89 6,029 --- 6,021 6,021 --- 2,997 2,997 177 15,224
87-88 6,064 --- 6,402 6,402 --- 2,825 2,825 710 16,001
86-87 5,610 --- 6,312 6,312 --- 2,633 2,633 710 15,265
92-93 6,643 166 6,989 7,155 3,477 3,477 521 17,796
91-92 5,844 98 6,000 6,098 3,106 3,106 543 15,591
90-91 5,528 5,524 5,524 2,780 2,780 540 14,372
89-90 5,632 5,643 5,643 2,664 2,664 486 14,425
88-89 6,029 6,021 6,021 2,997 2,997 177 15,224
Total 657,527
Spring Summer
11-12 10-11 09-10 08-09 07-08 06-07 05-06 04-05 03-04 02-03 01-02 00-01 99-00 98-99 97-98 96-97 95-96
27,738
32,792 32,210 29,640
27,146 27,500 28,493 30,244 29,969
27,861 24,882
22,476 22,789 22,893
22,646 21,687 19,726
St. Philip's College Enrollment Trends
Full Year

ST. PHILIP'S COLLEGE
ETHNICITY, GENDER, AND AGE TRENDS
Year Black White Hispanic Other Total
2003 1,696 2,889 5,060 235 9,880
2004 1,837 3,280 5,201 257 10,575
2005 1,640 3,264 4,967 316 10,187
2006 1,628 3,272 4,708 291 9,899
2007 1,596 3,334 4,658 264 9,852
2008 1,675 3,428 4,935 281 10,319
2009 1,709 3,947 5,025 327 11,008
2010 1,538 4,598 3,840 852 10,828
2011 1,451 3,529 5,317 413 10,710
Year Black White Hispanic Other
2003 17% 29% 51% 2%
2004 17% 31% 49% 2%
2005 16% 32% 49% 3%
2006 16% 33% 48% 3%
2007 16% 34% 47% 3%
2008 16% 34% 48% 3%
2009 16% 36% 46% 3%
2010 14% 32% 48% 7%
2011 13% 33% 50% 4%2003
2004
2005
2006
2007
2008
2009
2010
2011
17%
17%
16%
16%
16%
16%
16%
14%
13%
29%
31%
32%
33%
34%
34%
36%
32%
33%
51%
49%
49%
48%
47%
48%
46%
48%
50%
2%
2%
3%
3%
3%
3%
3%
7%
4%
Ethnicity Enrollment Percentage Fall 2003-2011 Other Hispanic White Black
2003 2004 2005 2006 2007 2008 2009 2010 2011
1,696 1,837 1,640 1,628 1,596 1,675 1,709 1,538 1,451
2,889 3,280 3,264 3,272 3,334 3,428 3,947
4,598
3,529
5,060 5,201 4,967 4,708 4,658 4,935 5,025
3,840
5,317
235 257 316 291 264 281 327 852
413
9,880 10,575 10,187 9,899 9,852
10,319 11,008 10,828 10,710
Ethnicity Enrollment Trends Fall 2005-2011 Black White Hispanic Other Total

ST. PHILIP'S COLLEGE
ETHNICITY, GENDER, AND AGE TRENDS
Year Male Female
2003 4,372 5,508
2004 4,470 6,105
2005 4,312 5,875
2006 4,150 5,749
2007 4,185 5,667
2008 4,453 5,884
2009 4,858 6,150
2010 4,747 6,081
2011 4,658 6,052
Years Male Female
1996 46% 54%
1997 45% 55%
1998 46% 54%
1999 44% 56%
2000 44% 46%
2001 44% 56%
2002 44% 56%
2003 44% 56%
2004 42% 58%
2005 42% 58%
2006 42% 58%
2007 42% 58%
2008 43% 57%
2009 44% 56%
2010 44% 56%
2011 43% 57%
2003 2004 2005 2006 2007 2008 2009 2010 2011
4,372 4,470 4,312 4,150 4,185 4,453
4,858 4,747 4,658
5,508 6,105 5,875 5,749 5,667 5,884
6,150 6,081 6,052
Gender Enrollment Trends Fall 2003-2011 Male Female
1996 1997 1998 1999 2000 2001 2002 2003 2004 2005 2006 2007 2008 2009 2010 2011
46% 45% 46% 44% 44% 44% 44% 44% 42% 42% 42% 42% 43% 44% 44% 43%
54% 55% 54% 56%
46%
56% 56% 56% 58% 58% 58% 58% 57% 56% 56% 57%
Gender Enrollment Percentage Fall 1996-2011
Male Female

ST. PHILIP'S COLLEGE
ETHNICITY, GENDER, AND AGE TRENDS
Age Female Male
18 or less 1,643 1,480
19-20 755 635
21-22 565 394
23-24 442 297
25-26 386 263
27-28 344 243
29-30 295 215
31-34 469 326
35-39 422 299
40-49 500 348
50+ 231 158
Age Female Male
18 or less 27% 32%
19-20 12% 14%
21-22 9% 8%
23-24 7% 6%
25-26 6% 6%
27-28 6% 5%
29-30 5% 5%
31-34 8% 7%
35-39 7% 6%
40-49 8% 7%
50+ 4% 3%
18 or less
19-20 21-22 23-24 25-26 27-28 29-30 31-34 35-39 40-49 50+
1,643
755 565
442 386 344 295 469 422 500
231
1,480
635
394 297 263 243 215
326 299 348 158
Age & Gender Enrollment Fall 2011 Female Male
18 or less
19-20 21-22 23-24 25-26 27-28 29-30 31-34 35-39 40-49 50+
27%
12% 9%
7% 6% 6% 5% 8% 7% 8%
4%
32%
14%
8% 6% 6% 5% 5%
7% 6% 7%
3%
Age Enrollment Percentage Fall 2011 Female Male

ST. PHILIP'S COLLEGE
ETHNICITY, GENDER, AND AGE TRENDS
AGE
Values 18 or less 19-20 21-22 23-24 25-26
2003 1,092 1,768 1,296 934 698
2004 1,080 1,831 1,397 999 818
2005 1,200 1,713 1,352 979 809
2006 1,300 1,634 1,224 909 806
2007 1,582 1,722 1,155 881 743
2008 2,271 1,627 1,136 832 730
2009 2,504 1,666 1,174 846 744
2010 2,373 1,531 1,127 765 726
2011 3,123 1,390 959 739 649
-
2,000
4,000
6,000
8,000
2003 2004 2005 2006 2007 2008 2009 2010 2011
Age Trends Fall 2003-2011
18 or less 19-20 21-22 23-24 25-26

ST. PHILIP'S COLLEGE TOP 10 FEEDER HIGH SCHOOLS ZIP CODES
78223
78210
78109
78244
78130
78233
78155
78247
78218
78245
482
462
415
377
329
316
307
288
281
272
2011 Top 10 Zip Codes
78223
78210
78244
78109
78155
78130
78233
78218
78220
78247
476
471
409
386
338
308
305
264
252
250
2010 Top 10 Zip Codes
Highlands
Wheatley/Brackenridge
Wagner
Judson
East Central
Harlandale
Roosevelt
Sam Houston
Madison
John Jay
81
69
54
34
33
33
32
28
24
21
2011 Top 10 Feeder High Schools
Brack…
Burba…
East …
Harla…
Highla…
Judson
Madis…
Roose…
South…
Wagner
43
19
38
25
57
23
29
23
20
40
2010 Top Fedder High Schools

ST. PHILIP'S COLLEGE
RETENTION TRENDS
Retention Trends
Years Fall to Fall
2003 41%
2004 43%
2005 42%
2006 41%
2007 48%
2008 46%
2009 46%
2010 38%
2011 39%
Retention Trends
Years Fall to Spring
2003 68%
2004 67%2005 65%
2006 65%
2007 73%
2008 71%
2009 71%
2010 61%
2011 68%
Retention Trends
Years Within Semester
2003 93%
2004 92%
2005 93%
2006 95%
2007 98%
2008 95%
2009 95%
2010 93%
2011 91%
2003 2004 2005 2006 2007 2008 2009 2010 2011
41% 43% 42% 41%
48% 46% 46%
38% 39%
Fall to Fall Retention
2003 2004 2005 2006 2007 2008 2009 2010 2011
68% 67%
65% 65%
73% 71% 71%
61%
68%
Fall to Spring Retention
2003 2004 2005 2006 2007 2008 2009 2010 2011
93% 92%
93%
95%
98%
95% 95%
93%
91%
Within Semester Retention