studies of the niantic river, connecticut with special reference to the bay scallop, aequipecten...
TRANSCRIPT

Studies of the Niantic River, Connecticut with Special Reference to the Bay Scallop,Aequipecten irradiansAuthor(s): Nelson MarshallSource: Limnology and Oceanography, Vol. 5, No. 1 (Jan., 1960), pp. 86-105Published by: American Society of Limnology and OceanographyStable URL: http://www.jstor.org/stable/2832612 .
Accessed: 24/06/2014 07:51
Your use of the JSTOR archive indicates your acceptance of the Terms & Conditions of Use, available at .http://www.jstor.org/page/info/about/policies/terms.jsp
.JSTOR is a not-for-profit service that helps scholars, researchers, and students discover, use, and build upon a wide range ofcontent in a trusted digital archive. We use information technology and tools to increase productivity and facilitate new formsof scholarship. For more information about JSTOR, please contact [email protected].
.
American Society of Limnology and Oceanography is collaborating with JSTOR to digitize, preserve andextend access to Limnology and Oceanography.
http://www.jstor.org
This content downloaded from 195.34.78.245 on Tue, 24 Jun 2014 07:51:15 AMAll use subject to JSTOR Terms and Conditions

STUDIES OF THE NIANTIC RIVER, CONNECTICUT WITH SPECIAL REFERENCE TO THE BAY SCALLOP,
AEQUIPECTEN IRRADIANS' Nelson Marshall
Narragansett Marine Laboratory, University of Rhode Island, Kingston, Rhode Island
ABSTRACT
The Niantic River is a shallow estuary with a tidal prism equal to half the mean low water volume of the basin, and with a twelve-hour freshwater inflow of less than 3% of the tidal prism. The tidal waters mix offshore with the waters of eastern Long Island Sound, rich in plankton and nutrients. The estuary functions as an ecological concentrating system as the dense and varied populations of grazers consuming the food of these tidal waters benefit from the resources of offshore mixing in addition to the production endemic to the estuary.
The disappearance of the eelgrass, Zostera marina, with the epidemic of the early 1930's permitted better circulation near the river bottom. Apparently this was advantageous to the bay scallop, which thereafter became the predominant sessile grazer with a production calculated at 2.2g C/m2/yr. Anchorage previously offered by eelgrass for the early setting stages of scallops was subsequently available through the abundance of small branching algae.
The brief life history of a bay scallop is outlined on its shell as the surface laid down in each successive year appears rougher or more "weathered" than that formed the year before. By following this differentiation of shell surface, annual rings were determined with more certainty than in earlier studies. Though the time of year when the differentiation of shell surface commences may vary with populations and even with year classes, it is probably due to a common cause, seasonal change in growth rate being most likely. The life history interpreted from shells from Indian middens was essentially the same as observed for living scallops.
The scallops of the Niantic River spawn from mid-June through July. The young of a given year reach maturity and are the chief brood stock of the succeeding spawning season. Mortality rates for all sizes are high during all seasons and few individuals survive to the time of second spawning.
The estuaries in which the bay scallop occurs have the following hydrographic features: the ratio of tidal volume to river flow is high, thus the salinity remains high; the basin is relatively shallow, with a resulting high ratio of tidal volume to the volume at low water; the circulation is such as to retain the planktonic scallop larvae in sufficient numbers for reseeding and to provide an adequate supply of planktonic food, perhaps in part supplied by offshore waters.
INTRODUCTION
Prior to the 1930's, the Niantic River in Connecticut supported a small little-noticed population of the bay scallop, Aequipecten irradians. In the thirties as the eelgrass, Zostera, disappeared scallops rapidly in- creased in number and gave rise to a sig- nificant local fishery which has persisted to this date. Occasional high yields from small parent populations are common for this species, but continuing high yields after a sudden increase as observed in the Niantic River constitutes an unusual pattern.
'Contribution No. 26 from the Narragansett Marine Laboratory.
The field work for this study was sup- ported by the Waterford-East Lyme Escal- lop Commission. The courtesies extended to me as a visiting investigator at the Bingham Oceanographic Laboratory, Yale University, and the field facilities made available at my parent's residence on the Niantic River were also vital to the study program. Many individuals and groups helped, a few being mentioned where appropriate in the text. Support was received from Alfred Univer- sity and its Research Foundation.
THE NIANTIC RIVER
The Niantic River (Fig. 1) is an estuary draining into Niantic Bay, a bight at the
86
This content downloaded from 195.34.78.245 on Tue, 24 Jun 2014 07:51:15 AMAll use subject to JSTOR Terms and Conditions

BAY SCALLOP OF NIANTIC RIVER 87
a lin
\ 5 xN SCALE I N FEET
0
300 200O 3600
Yn s ! a (JP bPU bar 4 -A
{'- Horse
~~ D K A
S a u nders P t. N. o BOATYARD _;\
CAMP P ?' "
BOATYARDS
N i A N T I C \ NOTES __ _ p jr SO UN DI N GS A RE INH -f o -__ t0 FEET AT MEAN LOW WATER
,,</Sv __ S<#>l 66-FOOT CONTOUR 12- FOOT CONTOUR
NIANTIC BAY ' . 2
FIG. 1. The Niantic River, Connecticut, showing location of stations.
This content downloaded from 195.34.78.245 on Tue, 24 Jun 2014 07:51:15 AMAll use subject to JSTOR Terms and Conditions
88 NELSON MARSHALL
w 0 a~~~~~~
U) t) to to c) U.) Pn ID !Q in) to) U) IU) 0 N CO ) - I N Cr( It O t
0?0 0 ? 0 0 - _ 29
0o 0 0 o 0 0 0 0 O
231 x x 23 : X X X :~~~~~~~~~ S UIRFACE|
0 x x ~~~~ ~ x ?
x X X
10 - ? 0 ? O 0 0 0 0 0 011
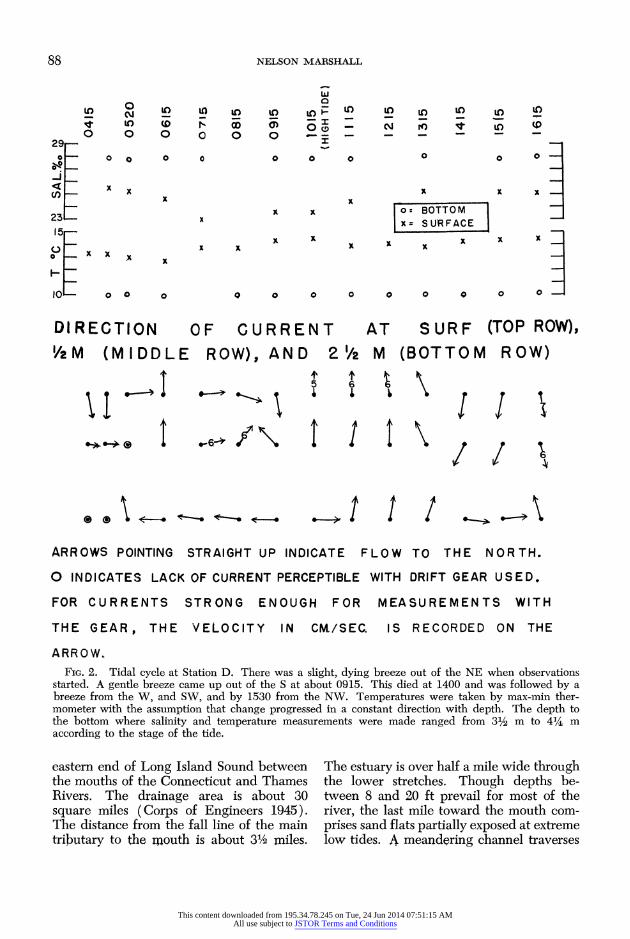
DIRECTION OF CURRENT AT SURF (TOP ROW), /2M (MIDDLE ROW), AND 2 1/2 M (BOTTOM ROW)
t t *; z t
69\ 1 / 6
ARROWS POINTING STRAIGHT UP INDICATE FLOW TO THE NORTH.
O INDICATES LACK OF CURRENT PERCEPTIBLE WITH DRIFT GEAR USED.
FOR CURRENTS STRONG ENOUGH FOR MEASUREMENTS WITH
THE GEAR, THE VELOCITY IN CM./SEC. IS RECORDED ON THE
ARROW. FIG. 2. Tidal cycle at Station D. There was a slight, dying breeze out of the NE when observations
started. A gentle breeze came up out of the S at about 0915. This died at 1400 and was followed by a breeze from the W, and SW, and by 1530 from the NW. Temperatures were taken by max-min ther- mometer with the assumption that change progressed in a constant direction with depth. The depth to the bottom where salinity and temperature measurements were made ranged from 31/2 m to 41/4 m according to the stage of the tide.
eastern end of Long Island Sound between the mouths of the Connecticut and Thames Rivers. The drainage area is about 30 square miles (Corps of Engineers 1945). The distance from the fall line of the main tributary to the mouth is about 31/2 miles.
The estuary is over half a mile wide through the lower stretches. Though depths be- tween 8 and 20 ft prevail for most of the river, the last mile toward the mouth com- prises sand flats partially exposed at extreme low tides. A meandering channel traverses
This content downloaded from 195.34.78.245 on Tue, 24 Jun 2014 07:51:15 AMAll use subject to JSTOR Terms and Conditions

BAY SCALLOP OF NIANTIC RIVER 89
0
0 _* * * . 0~~~~~~~~~~~~~~~~~~~~~~~~~~~~~~~~~~~~~~~~~~~~~~0
_ *0 * . 0
0-
0 0 0 0 -~~~~~~0
o 0 * .@;.
0~~~~~~~~~~~~~~~~~~~~~~~ OL- %*~~~~~~~~CE
PRESE N!
0
0~~~~~~~~~~~~~~~~~~~~~~~~~~~~4
01 _0 0 *40* *@ 0 *oo * *0**** *o 4 0.
o
5 - 15 2 5 1 5 15 2 5 5
' 15 2 -5 5 15 25 I 2'5 5 1-5 25
O N D 4 F M 19 54 1 95 5
0 to) * **0. % 0. 1 .0
* .00 * * 0. 0_ 0 0*
0~~~~~~~~~~~~~~~ 0
0
C )
0
0 10) *~~~~~~~~~~~~~~~~~0
O- _
_ 0 *0 * *.0 O~~~~~~~~~~~~~~~~~~~ . * 0.
00 ~ ~ ~ ~ ~ ~ ~ ~ ~ ~ ~ ~ ~ 0 0 0 * 0 *
5 rI 25 5 15 25 5 si 25 5 15 i5 5 15 25 5 15 25 5 15 25 A M J J A S 0
1 9 5 5 FIG. 3. Annual cycle of temperature and salinity at Saunders Point. At times of flat calm or of ice
cover, appreciable temperature differences were noted as the bulb of the thermometer was raised or lowered a few inches near the surface.
This content downloaded from 195.34.78.245 on Tue, 24 Jun 2014 07:51:15 AMAll use subject to JSTOR Terms and Conditions
90 NELSON MARSHALL
these flats and makes a cut about 130 ft wide through a river-mouth sand bar.
Man's use of the Niantic River has done little to alter these waters. The highway and railroad running along the sand bar and across the inlet may tend to stabilize the river mouth; except for minor shifting of the inlet, the sand bar would probably be much the same under more natural condi- tions. Most of the drainage area is second- growth forest on farm and timber land. There is considerable clearing for houses along the shores. Wastes from these houses pass into individual septic tanks which serve effectively as indicated by a State Depart- ment of Health survey in the summer of 1954. E. coli counts did not exceed 100 per 100 ml, and almost every station received a top sanitary rating. The increasing traffic of pleasure boats with living accommoda- tions may contaminate the river in the future if controls are not adequate.
The area of the Niantic River, plotted from a grid breakdown of the U.S. Coast and Geodetic Survey chart, is 3,196,800 M2.
The mean low water volume of the basin equals 5,287,200 m3. The only available tidal range figure is the mean of 0.8 m given by the U.S.C.G.S. for Millstone Point, about a mile off the river mouth. Observations suggest this is a reasonable working figure applicable most anywhere in the estuary. The tidal prism based on such figures is 2,557,400 m3 or about 50% of the mean low water volume.
In the lower river strong and direct ebb and flood tidal currents were observed (Table 1). The strongest currents were in the inlet where they were maximum in the middle of the ebb and flood phases of the cycle. In the deep waters upriver, tidal cur- rents were slight (Table 1 and Fig. 2) with directions often modified by or subordinate to wind currents. Throughout the river very shallow currents unrelated to the main flow may develop quickly in response to the wind.
Figure 3 presents year around data on surface temperatures and salinities from a mid-river reference station at Saunders Point. Figure 2 and Table 2 give data on the horizontal and vertical gradients in these
TABLE 1. Observed currents in the Niantic River Measurements recorded for the surface were by drift bottle or by current cross floating just below the surface; deeper measurements were by current cross. All were taken from anchored skiff and were either ebb or flood as appropriate to the stage in the tidal cycle, except for two observations at Station F when the current flowed in the opposite direction with the wind. Currents too slow to be measured by this method are entered below as 0.
Current velocity (cm/sec.)
Station No. of observations Max. ML. Average
01 4 at Om 81 48 60.5 A 4atOm 38 5 21.2 B 4atOm 14 0 9.0 C 4atOm 6 0 2.5 D 34 at Om 7 0 1.4
18 at 21/2m 0 0 0 E 5 atOm 0 0 0
3 at 2?/2m 0 0 0 F 6 atOm 5 0 2.2
4 at 21/2m 0 0 0 G 5atOm 6 0 1.2
3at21/2m 0 0 0 H 4 at Om 6 0 1.5
lat21/2m 0 0 0 I 4atOm 6 0 1.5
1 Observations by the U. S. C. G. S. at this station July 29 and 30, 1929 (made available through correspondence with the Acting Director) include the following: Ten foot current pole: strength of flood 67 cm/sec.;
strength of ebb 67 cm/sec. Price current meter at 71/2 feet: strength of flood 106
cm/sec.; strength of ebb 68 cm/sec. Price current meter at 12 feet: strength of flood 104
cm/sec.; strength of ebb 55 cm/sec.
properties, the latter showing distinctly lower temperatures and higher salinities toward the bottom at stations upriver from the flats.
An adequate understanding of the cir- culation of the Niantic River must take into account: (1) the extent to which the tidal waters mix with the residual waters of the basin, (2) the non-tidal circulation due to freshwater inflow, and (3) the degree to which the tidal waters of the estuary retain their identity as they ebb into the Niantic Bay and return to the river.
Over the tidal flats in the lower stretches of the estuary there is a thorough mixing of the water, whereas in the middle and upper reaches of the estuary the vertical gradients just mentioned occur. The incon- clusive data concerning these gradients sug- gest a condition which resists free mixing but lacks the sudden density changes that
This content downloaded from 195.34.78.245 on Tue, 24 Jun 2014 07:51:15 AMAll use subject to JSTOR Terms and Conditions

BAY SCALLOP OF NIANTIC RIVER 91
TABLE 2. Records of temperature and salinity along the length of the Niantic River Temperatures by max-min thermometer. The readings entered for each depth are based on assumption that temperature change progressed in a constant direction with depth. Salinities by Harvey titration method.
March 7, 1955 May 5, 1955
Depth Ebb Flood Flood Ebb May 14, 19551 Station meters
?C Sc C ScoC %0 C %0C
2 0 11.9 28.2 6 9.22 28.7
1 0 12.2 28.1 5 9.22 28.7
0 0 2.6 29.1 2.5 28.9 10.0 27.7 11.1 27.7 14.7 27.3 A 0 3.3 28.5 2.8 28.1 9.9 28.0 11.9 27.8 14.7 27.1 B 0 3.3 27.4 2.9 27.9 11.2 27.2 15.1 26.7 15.6 27.0 C 0 3.3 27.3 2.5 27.7 13.9 26.0 15.7 25.9 15.6 26.8 D 0 4.2 27.2 2.4 18.9 16.6 22.8 16.9 24.7 16.1 26.7
1 15.0 26.9 2 13.6 27.7 3 3.32 3.32 28.9 9.92 27.9 9.62 27.5 12.2 28.13
E 0 2.8 26.2 15.6 18.1 18.3 20.0 15.8 26.6 1 15.6 26.8 2 13.3 27.0 3 3.82 28.1 10.6 27.8 10.02 27.4 12.2 28.0
F 0 3.3 25.8 16.1 14.0 17.5 23.7 17.6 26.2 1 14.6 26.8 2 13.2 27.6 3 11.7 28.0 4 11.1 28.2 5 4.42 28.9 8.92 27.7 9.02 27.7
G 0 2.2 15.4 16.4 7.7 17.8 23.5 17.4 24.4 1 15.5 25.9 2 12.8 27.6 3 11.8 28.0 4 11.2 27.8 5 4.4? 29.1 8.92 27.7 9.22 27.5 11.1 28.2
H 0 16.7 10.6 18.82 21.4 17.2 23.5 1 15.6 25.5 2 12.3 26.7 14.2 27.3 3 9.92 27.6
I 0 17.2 11.2 19.6 9.9 18.3 20.6
1 Stations 1 and 2 on ebb; 0 at slack; others on flood. 2 These samples were taken just off the bottom a half meter or less from the depth indicated. 3 Original salinity sample was broken and this is a substitute sample taken on the following flood.
would isolate deeper waters from those of the surface.
The non-tidal circulation due to fresh- water inflow must be weak. Stream flow data are not available for the Niantic tribu- taries; however, for the similar neighboring watersheds Great Brook, the East Branch of Eightmile River, and the Menunketesuck River the average is 1.82 cfs per square
mile2 (U.S. Geological Survey 1954). Ap- plying this figure to the Niantic tributaries, the freshwater inflow is estimated at 54.6 cfs or 67,000 m3 during a tidal cycle. Such a tributary flow is less than 3% of the tidal prism.
Ketchum (1951) has provided a method 2 Measured at Poquonock Bridge, - near North
Lyme, and near Clinton, respectively.
This content downloaded from 195.34.78.245 on Tue, 24 Jun 2014 07:51:15 AMAll use subject to JSTOR Terms and Conditions

92 NELSON MARSHALL
30
xo x
x~~~~
0 x~ 0
20~~~~~~~
o~~~~~ XX 20 x
o0 - x) OBSERVED 0 -X x CALCULATED
z
10 x
I I I I
1111111111I 111111111
l li I i lllll I Iilt tl l I
2 3 4
NAUTICAL MILES FROM FALL LINE
FIG. 4. Observed salinities in the Niantic River and those calculated by the method of Ketchum (1951).
for calculating the distribution of salinities within an estuary using measurements of the basin on U.S. Coast and Geodetic Sur- vey charts plus two factors for which esti- mates are provided in this paper-the tidal range of 0.8 and the tributary discharge of 54.6 cfs. Figure 4 compares the calcu- lated with the observed salinities. Since the curves match, the estimates of river flow and tidal range seem substantiated; furthermore, since these calculations do not allow for river stratification, the view that the deeper waters are seldom isolated is supported.
The degree to which the tidal waters re- tain their identity off the mouth of the river can only be discussed hypothetically. These waters ebb into Niantic Bay which appears to be a partially effective containing basin (some of the basin outline is shown in Fig. 1). Thus it is probable that the waters which ebb out of the estuary, though un-
bounded offshore and subject to dispersal and exchange with Long Island Sound wa- ters, retain partial identity as a water mass flowing into and out of the river.
The sediments of the river, sampled every few hundred yards with a scoop, exhibit a simple relationship to hydrographic fea- tures. The deeper areas with little current have an accumulation of very fine and soft muds. Over the shallow flats and in the scoured channels downriver, sediments are of firm mixed sand and mud. The intertidal bottoms and the shallows near shore are also firm, with the sand content generally highest where wave and current action is greatest. Pebbles and small rocks are abun- dant in the sand along the shores. Almost everywhere the banks of the river are slight- ly elevated, and about one-fifth of the shore- line is of rock exposure.
Prior to the wasting disease which killed
This content downloaded from 195.34.78.245 on Tue, 24 Jun 2014 07:51:15 AMAll use subject to JSTOR Terms and Conditions

BAY SCALLOP OF NIANTIC RIVER 93
40 L I C)
0) U- 0
w - 0)- r 30 LO) U)~~~~~~~~~~~~~~~~~~~~~~~~~~1 0
m 4
o) I I () 20 N\
- LOL Q ('1~~~~~~~~~~~~~~~~~~~~CjO)0)2
z < -O (OD < F- I0LO L
D ~~~~~~~00 0) LO UD
Io 0 )C) 0) 0 I
SCALLOPING SEASON- NIANTIC RIVER FiG. 5. Annual scallop harvest in the Niantic River according to permit sales.
off the eelgrass, Zostera marina, in the early 1930's, the river was so choked by the blades of this seaweed that neither rowing nor outboard travel was possible in the shallows at low tide.3 The disease effected nearly complete destruction of Zostera by 1933, though after a few years the eelgrass began to return (see Cottam and Addy 1947, and Stevens et al. 1950 for summaries and refer- ences). Now at mid-summer some rather thick stands of Zostera are to be found in the Niantic River, particularly in a band about 600 yards wide extending across the river off the mouth of Smith Cove. Such stands, in the belt just described and else- where in shallow waters, do not reach the density of former growths; furthermore, the recovery seems very unstable, with large patches dying off from time to time. Several authors have mentioned recovery of the eelgrass along the coast, but in such reports the pattern is also inconsistent and suggests instability (Stevens et al. 1950).
3 These are my own recollections from boyhood, substantiated by the comments of others who recall this condition.
On some bottom areas kelps were found, and along the shores there were occasional stands of Ulva or of rockweeds; however small branching red algae made up the bulk of the vegetation and were abundant almost everywhere except on bottoms swept clean by scouring currents.
HISTORY OF THE SCALLOP IN THE NIANTIC RIVER
There is little doubt that scallops are native to the Niantic River, for old-timers of the area tell of getting at least a few scallops as far back as they remember, and scallop shells are abundant in Indian mid- dens in the vicinity.
In an earlier paper (Marshall 1947), I at- tempted to show that the local scallop popu- lation had been sparse and had suddenly increased to an abundance which supported a new fishery after the eelgrass disappeared. Doubts raised from the recollections of others as to just when the fishery developed prompted me to check the accounts of the early fishery in the archives of the New London Day. Write-ups of the fall of 1934
This content downloaded from 195.34.78.245 on Tue, 24 Jun 2014 07:51:15 AMAll use subject to JSTOR Terms and Conditions

94 NELSON MARSHALL
and in early 1935 emphasized the develop- ing fishery. The new crop was being re- moved very rapidly by relatively few people, and there was mounting pressure to estab- lish new controls to save and share the re- source. Consistent with these accounts and the dates thereof is the legislation of 1935 establishing the Waterford-East Lyme Es- callop Commission. Thus the association in time between the development of the scallop fishery and the disappearance of eelgrass in the early 1930's is well documented.
Figure 5 represents the scallop harvest by seasons. These totals are from the records of permits sold.4 The permits limited the day's take according to the fee paid, with the maximum daily limit per person being three bushels. An analysis of permits for the 1954-55 scallop season showed that about two-thirds of the take was by men who fished for recreation or as a very incidental commercial effort. Well over half the take was in the first 'two months, October and November, of the six-month season. The take was primarily from the shallows down- river. Scallops are abundant elsewhere in the estuary and do well in the deeper water, though restrictions against the towing of gear has made it difficult to fish much beyond the shallows.
GROWTH AND LIFE SPAN OF BAY SCALLOP POPULATIONS
Of the length-frequency data gathered, those included in Figure 6 are the most rep- resentative. They portray a succession of samples taken from the middle of the river off Saunders Point where there was very little fishing.
Several procedures apply to these and all other samples of living scallops referred to in this study: (1) They were gathered with nets fine enough to collect the smallest scal- lops present. (2) Nets were towed, pushed and pulled, or handled in any manner that
4 For years prior to 1952-53 it was necessary to estimate permit sales from cash received and any petty cash taken from receipts would make such estimates lower than actual sales. While some people do not take the full measure of it in permits, it is assumed that this is offset by the heaped bushels collected by others.
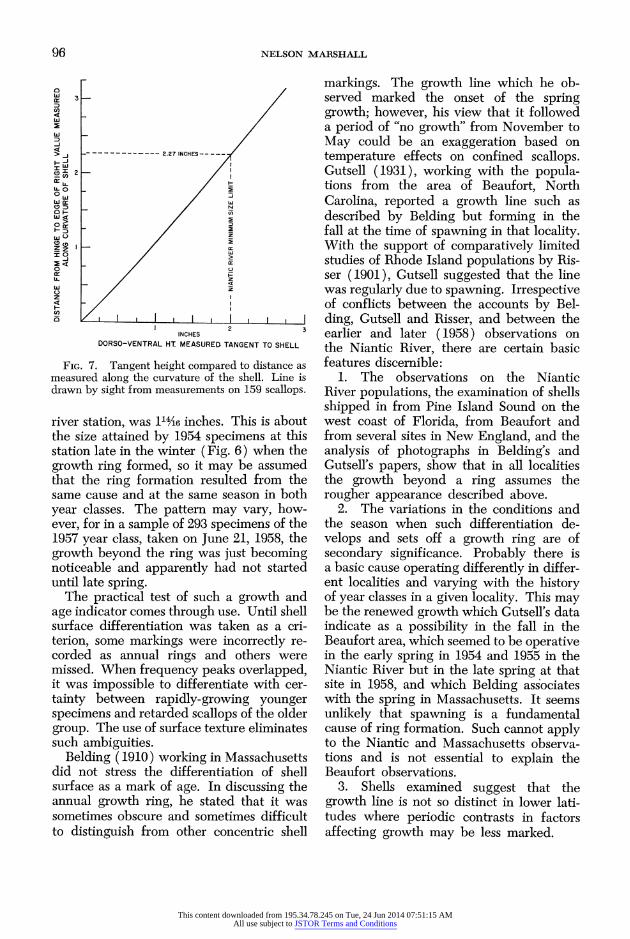
would expedite getting scallops. (3) There was no culling of samples, although an arbi- trary unselected portion of a collection was sometimes used. (4) The size measurement used is the distance from the hinge to the far edge of the right valve as measured dor- so-ventrally along the curvature of the shell. Other studies of scallops (notably Belding 1910 and Gutsell 1931) have dealt primarily with dorso-ventral height along a straight line tangential to the curvature of either valve. This is also the measurement com- monly used for fishery regulations. The measurement along the curvature applied herein has the advantage of including size differences associated with thickness. When a flexible steel tape is used, quick and ac- curate measurements are possible and read- ings to shell markings such as growth rings can be taken directly from such a tape. For any given scallop the tangent measurement cannot be converted to that along the cur- vature, or vice versa; however, Figure 7 can be used for making conversions when com- paring groups in which individual and con- dition differences average out.
The peak on the left in Figure 6, called the first peak hereafter, is clearly the 1954 age group, since there is no group of lesser size and since observations on reproduction and summer growth (reported below) leave no doubt that in the fall the young of a given year will approximate this size in November. Following the distribution graphs through the winter into spring and summer, the growth of this 1954 group is seen. Since the second peak, the one to the right, fades out in late spring and early summer, the graph suggests that this too is a single year class, that of 1953, affected by heavy mortalities by the end of its second year.
Figure 6 also provides a basis for inter- preting a shell formation effect known as the growth ring, and supports the conclu- sion that the peaks of size-frequency repre- sent age classes. Early shell growth, as observed for the 1954 year class in the fall collections, had a surface lustre which at its best appeared somewhat like a coat of var- nish. Early in the spring these scallops developed a distinctly rougher surface at the periphery of their shells. As such coarser
This content downloaded from 195.34.78.245 on Tue, 24 Jun 2014 07:51:15 AMAll use subject to JSTOR Terms and Conditions

BAY SCALLOP OF NIANTIC RIVER 95
40-4 Sample included additional
11/15/54 Sample included 236 5/18/55 specimens of 1954 30 specimens fo 19546 30-year-class not year-class not 9
20 measured 20rmeasur-d not
30 F dd23'6165 10 10
--A A 1/2 1 11/2 2 21/2 3 1/2 1 1 1/2 2 21/2 3 Sample included 425 2 Sample included 6 66 30 specimens of 1954 2/28/55 30 specimens of 1954
year-class not year-class not
20 -measured 20 -measured
1/2 1 11/2 1/2 3 1
2 3
> 30 ~ Sample included 450 Sam30 pl7n/ld/5e5 spcmesof15 2/ 20/ 55 j specimens of 19547/65
Dspecimens of 1954
Z year-class _ year-class not
30 l/2 1 11/2 2 21/2 3 1/2 1 11/2 2 21/2 3
30 -Sample included 122 4/ 189/55 ICE
specimens of 1954 Z _year-class not 20
measured Y lo _ a? s9 as mesue on dagn otesel 1/2 1 11/2 21/2 3 /i2 11/2 2 2 3
30 Sample included 122 4/18/55 N C H E S specimens of
1954A,Dsgaeth2inhdmtr 20 -year-class notADsnae th 2ichdmtr measured ~
10 as measured on a tangent to the shell.
___ ___ ___ ___ ___ ___ ___ ___ ___ ___ __
This is the Niantic
River minim um 1/2 1 ~~1 1/2 212 3 size limit.
DISTANCE FROM HINGE TO EDGE OF RIGHT VALVE AS MEASURED ALONG CURVATURE
FIG. 6. Size-frequency distributions from sampling station in the middle of the Niantic River off Saunders Point.
shell was laid down (and this was first noted in the March 19 samples) a ring could be seen where the growth of the first winter had ended and that of the spring and the second summer had commenced. Following these criteria in the older group, the second peak, one finds a third differentiation of rougher appearance. This did not form a band sufficient to show a clear growth ring
except on the few scallops that survived for an appreciable growth into their third sum- mer. To the practiced eye the difference in the shell surface makes it possible to distin- guish between annual growth rings and numerous other concentric rings on the shell.
The distance to the first growth ring on the 1953 year class, as determined from 144 second-year scallops collected from the mid-
This content downloaded from 195.34.78.245 on Tue, 24 Jun 2014 07:51:15 AMAll use subject to JSTOR Terms and Conditions
96 NELSON MARSHALL
w
w
-J
3 - 2.27 INCHES-
I w (9 I- 2
wo ?z LL 0 10 w
w 0 a
DSSOVNTA H/ MESRDTNETTZ HL
I O_ /
FIG. 7. Tangent height compared to distance as measured along the curvature of the shell. Line is drawn by sight from measurements on 159 scallops.
river station, was 114,46 inches. This is about the size attained by 1954 specimens at this station late in the winter (Fig. 6) when the growth ring formed, so it may be assumed that the ring formation resulted from the same cause and at the same season in both year classes. The pattern may vary, how- ever, for in a sample of 293 specimens of the 1957 year class, taken on June 21, 1958, the growth beyond the ring was just becoming noticeable and apparently had not started until late spring.
The practical test of such a growth and age indicator comes through use. Until shell surface differentiation was taken as a cri- terion, some markings were incorrectly re- corded as annual rings and others were missed. When frequency peaks overlapped, it was impossible to differentiate with cer- tainty between rapidly-growing younger specimens and retarded scallops of the older group. The use of surface texture eliminates such ambiguities.
Belding ( 1910 ) working in Massachusetts did not stress the differentiation of shell surface as a mark of age. In discussing the annual growth ring, he stated that it was sometimes obscure and sometimes difficult to distinguish from other concentric shell
markings. The growth line which he ob- served marked the onset of the spring growth; however, his view that it followed a period of "no growth" from November to May could be an exaggeration based on temperature effects on confined scallops. Gutsell (1931), working with the popula- tions from the area of Beaufort, North Carolina, reported a growth line such as described by Belding but forming in the fall at the time of spawning in that locality. With the support of comparatively limited studies of Rhode Island populations by Ris- ser (1901), Gutsell suggested that the line was regularly due to spawning. Irrespective of conflicts between the accounts by Bel- ding, Gutsell and Risser, and between the earlier and later (1958) observations on the Niantic River, there are certain basic features discernible:
1. The observations on the Niantic River populations, the examination of shells shipped in from Pine Island Sound on the west coast of Florida, from Beaufort and from several sites in New England, and the analysis of photographs in Belding's and Gutsell's papers, show that in all localities the growth beyond a ring assumes the rougher appearance described above.
2. The variations in the conditions and the season when such differentiation de- velops and sets off a growth ring are of secondary significance. Probably there is a basic cause operating differently in differ- ent localities and varying with the history of year classes in a given locality. This may be the renewed growth which Gutsell's data indicate as a possibility in the fall in the Beaufort area, which seemed to be operative in the early spring in 1954 and 1955 in the Niantic River but in the late spring at that site in 1958, and which Belding associates with the spring in Massachusetts. It seems unlikely that spawning is a fundamental cause of ring formation. Such cannot apply to the Niantic and Massachusetts observa- tions and is not essential to explain the Beaufort observations.
3. Shells examined suggest that the growth line is not so distinct in lower lati- tudes where periodic contrasts in factors affecting growth may be less marked.
This content downloaded from 195.34.78.245 on Tue, 24 Jun 2014 07:51:15 AMAll use subject to JSTOR Terms and Conditions

BAY SCALLOP OF NIANTIC RIVER 97
100
FLATS NEAR STATION B (Q) 8 (0)
~ STOCK 122 FROM 1954 YR CLASS (I) (O) STOCK 91 FROM 1953 YR. CLASS (1)
(0) 50 o
z (I) 0 (0) 0
O F r KEz TO GRPHS: ? (6(0)*
O _ ( NUMBE STARFSH PREENT (2
>O(0) (0) ( () (0) 0 (0) (
0 * w o
c/) 0 *I m c 0 X. 100
o _ 8 .SHALLOW WATER AT SAUNDERS PT. < F STOCK 162 FROM 1954 YR CLASS (20) o S 54 FROM 1953 YR. CLASS w (31)
- ? (I12)(27)*(62) 0 0 ~~~~~KEY TO GRAPHS: C,
U- 0 50 01954 YR. CLASS (7
70 )1953 YR. CLASS 0 ~~~NUMBER STARFISH PRESENT (28
0 (18) o
(12) .~~~~~(5 .1 0
DEC. JAN. fEB. MA. ARL MA0UE JL
ILl (0) ~ ~ 9) (8) (9
Q- tOO 0 -
0 G FT. OF WATER OFF SAUNDERS PT. n o sa (38) 0 (35)
SOK 118 FROM 1954 YR CLASS (6) SOK 97 FROM 1953 YR. CLASS 0 (6) V) 0 (20)
o 2 (49) then until 0 (41) o~ 50 (50)
(31) o (112) (27)
0
(44) (70)
DEC. JAN. FEB. MAR. APRIL MAY JUNE JULY FIG. 8. Mortalities observed in caged scallops. The numbers of starfish invading the traps and
removed at each observation date are given. The first oyster drills appeared in the cages on the May 19 and 20 observation dates with a total of 21 found and removed from the cage at Saunders Point from then until July 4, a total of 86 from the cage on the flats, and none in the deep water cage.
As stated in discussing Figure 6, few scal- lops appear to live beyond two years. Dur- ing 1954 and 1955 a total of 4,143 specimens were examined from the Niantic River. Only nine of these showed two growth rings and eight of these were survivors of the 1953 year class in a sample taken from the mid-river station on July 16, 1955. Though
it was reported by fishermen from Duxbury Bay, Massachusetts, that third year scallops were abundant in catches there during the 1954-55 season, a sample obtained had less than 4% with two rings. Belding (1910) also commented that relatively few scallops pass a two-year limit. He elaborated on a period of physical decline setting in after
This content downloaded from 195.34.78.245 on Tue, 24 Jun 2014 07:51:15 AMAll use subject to JSTOR Terms and Conditions

98 NELSON MARSHALL
18 months. Gutsell (1931) declined to indi- cate a natural life span, since in the area of his study almost the entire population of adults had been removed by fishing by the time they were 20 months old. He stated, "It is not even clear that there is any general mortality following the market season and preceding a second spawning .
Anticipating that a specific life limit would be indicated by high mortalities in the spring, I not only looked in the field for signs of decline but kept specimens of the 1953 and 1954 year classes under observa- tion in cages. Admittedly, data on caged specimens (Fig. 8) are unreliable, for, with the water circulation cut down, the scallops did not grow well, and, in the cages off Saunders Point, predation from starfish was intense and probably exacted a heavier toll on the younger than on the older specimens. However, the mortalities of the young were everywhere heavy; even on the flats, where starfish predation was at a minimum, they died off as fast as the older specimens. In field observations I failed to observe any condition identifiable as a period of old-age mortality.
In the face of existing observations, sug- gestions that scallops might survive in large numbers into the third year must depend largely on the assumption that fishery in- tensities now prevent this. To have this effect, fishing mortality would need to be far more complete than the usual partial mortalities which diminish but do not elim- inate older specimens in a population. The argument that there would be a significant survival into the third year with less inten- sive fishing is also countered by Figure 6, which represents collections away from the fishery area and shows a year-class mortality four to five months after the fishing season had closed.
Observations on shells from Indian mid- dens in southeastern Connecticut have a bearing on the question of natural versus fishing mortalities, assuming that fishing pressure by Indians was at least different, if not considerably less than that of today. The shells obtained and analyed were from the following sites:
Manakaway site, Greenwich Point: col- lector Robert C. Suggs; 109 specimens.
South of U.S. Route 1 along west shore of Menunketesuck River, Westbrook: collec- tors Lyent W. Russell and N. Marshall; 233 specimens.
Millstone Point, Waterford, adjacent to highway underpass: collector Eva L. But- ler; 37 specimens.
Morgan's Landing, Clinton: collectors Frank Glynn and N. Marshall; 16 specimens.
Saunders Point, Niantic, back of Adiron- dack log cabin: collector N. Marshall; 5 specimens.
Tubb's field, Niantic: collector Richard J. Porter; 4 specimens.
Neck Fields off Neck Road, Clinton: col- lector Frank Glynn; 6 specimens.
Heckler's site, Westbrook: collector Frank Glynn; 3 specimens.
From every site there was one or more scallops that showed second-year growth but none of the shells had surface features indicative of third-year growth. Though skewed by limited and selected sampling, the size-frequency distributions indicated year classes in the size range of those cur- rently taken in the Niantic River. Two col- lections were large enough to permit plot- ting readable length-frequency graphs. For the Manakaway site the second-year scal- lops ranged from 115A6 to 3 inches with a peak and median at 23/8 inches, whereas the first-year scallops, only seventeen in num- ber, overlapped this curve with a range from 17/8 to 2%,46 inches and a median at 21/8 inches. For the Menunketesuck site, the col- lection was almost entirely of first-year specimens. These ranged from 13/8 to 27/16
inches with a median at 17/8 inches.5 From Menunketesuck the two shells that had second-year growth and were sufficiently intact for full measurement were 27/8 and 3 inches. Obviously, when the Indians were fishing first-year scallops (a practice illegal today and commercially impractical be- cause of the small return for the shucking
5 Such data from the Manakaway and Menunke- tesuck sites, when compared to present length-fre- quency data as in Figure 6, suggest that the Indians were fishing these first year scallops in the winter.
This content downloaded from 195.34.78.245 on Tue, 24 Jun 2014 07:51:15 AMAll use subject to JSTOR Terms and Conditions

BAY SCALLOP OF NIANTIC RIVER 99
TABLE 3. Summary of K for one-year-old scallops collected from the Niantic River between Nov. 4 and Dec. 12, 1954
Current char- Number Size range Mean Standard acteristic of
Sampling area measured inches K deviation sampling areal
Mid-River off Saunders Point 40 25/16-23/4 25.2 1.76 weak Horse Point 31 21/8-2/8 25.2 2.43 weak West shore near Station G 46 2-31A6 26.1 2.75 weak Near shore at Saunders Point 25 2?/16-215/16 26.9 2.03 weak Sand bar near Station F 28 2-215/16 27.9 2.60 intermediate2 Channel between Stations B and C 22 216-27/8 28.5 3.07 strong Flats toward west shore near Station B 70 2-31? 28.6 2.52 strong Flats toward east shore near Station C 29 2-31/8 28.8 2.40 strong
I Current interpretations based on observations in section titled "Niantic River." 2 Classifying this as an area of intermediate current, in the midst of generally slack surrounding waters, is based on
familiarity with the local condition and the physiographic features of the sand bar area.
effort) they sought the larger ones, and the size frequencies are skewed accordingly. Unless the Indians had some peculiar rea- sons to place the shells of older scallops elsewhere, a midden such as that of the Menunketesuck indicates that, at least for certain times and places, older age groups were a comparative failure. Possibly they were sometimes fished out in the first year, but this implies a harvesting intensity not generally associated with Indian times. Rather, one would expect that the Indian fishing effort was comparatively light, af- fording a greater opportunity for specimens to survive more than two years if such were natural.
In summary, all evidence suggests that the natural expectancy of life of the scallop in these areas is two years or slightly less. The evidence also indicates heavy mortal- ities throughout life and suggests that popu- lations may show some variation in life span.
According to Belding (1910) and Gutsell (1931), rate of growth is positively influ- enced by the rate of the prevailing currents. Several observations on the Niantic River give support to this interpretation. As com- mented above, scallops did not fare well in the river when it was choked with eelgrass with little chance for circulation near the bottom. A population of unusually large seed (median size 17/8 inches as early as Nov. 8, 1954) was found about 200 yards in from the mouth of Smith Cove in an area where tidal currents are especially strong. Experienced fishermen show a preference
for working where currents are strong, sim- ply because larger specimens are found there. The favorable effect of currents is also suggested by a preliminary comparison of muscle diameter against scallop height and the use of this as a criterion of condition. For this comparison undertaken in the fall of 1954, the muscle of the scallop was cut in half and the maximum diameter was measured. A factor K was then calculated from the relationship K-=
max. diam. of muscle x 100 distance as measured along curvature
of right valve6 Table 3 gives the average value of K for samples of scallops from different locations in the river. Specimens of less than two inches were not used in compiling this table. The higher mean values for K are found in areas characterized by strong currents, and the lower values in areas of weak currents.
It must be recognized, however, that many factors in addition to current are operative in the areas compared, and that specific cause and effect relationships can- not be deduced.
As to effects of environmental factors other than current on growth, little can be said. Within the environmental limits of areas in which scallops occur, observers have not detected favorable factors other than cur-
6 This is the size measurement regularly used in the present study.
This content downloaded from 195.34.78.245 on Tue, 24 Jun 2014 07:51:15 AMAll use subject to JSTOR Terms and Conditions

100 NELSON MARSHALL
rent, even though the scallop occurs to depths as great as 60 ft according to Belding (1910). Seasonal variations in growth are quite simple in the northern range with the rate somewhat greater in the warm months. Figure 6 shows a slight differentiation by seasons, and Belding (1910) mentions very striking seasonal effects, though his results based on scallops in pens could be ex- aggerated.
SPAWNING AND SETTING
Reproductive organs were approaching spawning condition in both 1954 and 1953 year-class specimens taken from mid-river, May 18, 1955. Ripe gonads were common in both year classes when the same location was sampled on June 16 and July 16. No adequate summer sampling was done after July 16.
The time and effectiveness of spawning were observed through the use of surfaces on which scallop larvae might set after their planktonic larval life, which, according to Belding (1910), lasts about 10-12 days. For this, two types of cultch were prepared. One consisted of three-inch frayed lengths of manila rope that had never been treated with toxins and had been seasoned by pre- vious immersion in salt water. The other consisted of groups of ten oyster shells strung on wire with half of the shells in each group facing upward and the alternate shells facing downward. Cultch of each type was suspended in the upper meter of water at three stations (B, D, and G of Fig. 1) along the length of the river. At the deeper stations, D and G, another set of cultch was suspended within one meter of the bottom. The cultch was replaced every four days.
Microscopic examination showed no signs of set on the rope units. The shells caught good sets on their upper sides, irrespective of whether these were the smooth inner surfaces or the rough outer surfaces. The shell surfaces oriented downward rarely showed any set whatsoever. This is in contrast to observations on Atlantic coast oysters which, although lacking such a marked preference, are in general more abundant toward the under surface of cultch
provided (Nelson 1952). For each group of cultch, a count of the set is given for two shells which had their smooth surfaces pointing upwards (Table 4).
Counts show that in its early setting stages, the scallop thrives only in the upper waters. This may be because the planktonic stages are somewhat restricted to upper levels of these partially stratified waters. The data also suggest better setting toward the middle and upper reaches of the river. The gonad observations and setting history together indicate intensive spawning from mid-June well into July, a period within the mid-June to mid-August season set by Bel- ding (1910) to cover both early and late spawning areas in Massachusetts. With the spawning period thus delimited to weeks when the two-year-olds are fading out, the spawning role of the first-year scallops be- comes obvious. The fall spawning indicated by Gutsell (1931) for the Beaufort area has little bearing on these observations except to indicate the existence of regional differences.
In natural setting the scallops attached in quantities to most anything, including the frayed manila rope which had not worked effectively for the counts. It was evident that the small branching algae, ob- served to be very abundant throughout the river, were heavily laden with attached scallops. In this connection it is noteworthy that fishermen of the Niantic River refer to such algae as scallop grass. Though the role of vegetation in the ecology of scallops is not clearly established, it seems likely that the algae might have served adequately as a substitute for Zostera if the loss of the latter had created a need for suitable anchor- age surface for the set.
PREDATORS AND ADVERSE TEMPERATURES
At the present we have only superficial knowledge of scallop predators in the Ni- antic River. Predators noted during this study were the starfish (Asterias vulgaris), the drill (Urosalpinx cinereus), and the green crab (Carcinedes maenas).
The three cages (Fig. 8) placed on the bottom for checking mortality rates of large and small scallops collected starfish and in
This content downloaded from 195.34.78.245 on Tue, 24 Jun 2014 07:51:15 AMAll use subject to JSTOR Terms and Conditions
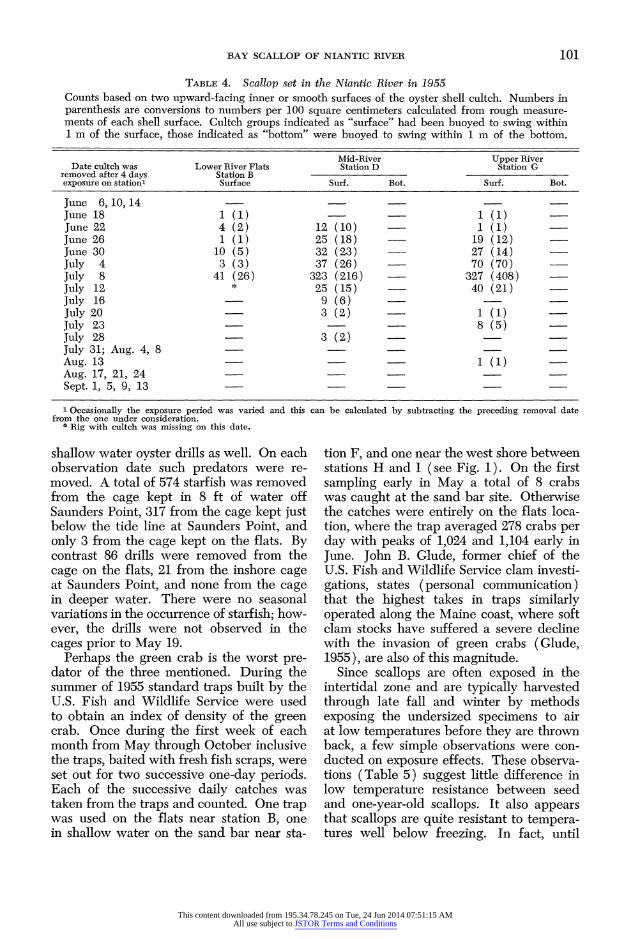
BAY SCALLOP OF NIANTIC RIVER 101
TABLE 4. Scallop set in the Niantic River in 1955 Counts based on two upward-facing inner or smooth surfaces of the oyster shell cultch. Numbers in parenthesis are conversions to numbers per 100 square centimeters calculated from rough measure- ments of each shell surface. Cultch groups indicated as "surface" had been buoyed to swing within 1 m of the surface, those indicated as "bottom" were buoyed to swing within 1 m of the bottom.
Mid-River Upper River Date cultch was Lower River Flats Station D Station G
removed after 4 days Station B exposure on stationl Surface Surf. Bot. Surf. Bot.
June 6, 10, 14 June 18 1 (1) 1 (1) June 22 4 (2) 12 (10) 1 (1) June 26 1 (1) 25 (18) 19 (12) June 30 10 (5) 32 (23) - 27 (14) July 4 3 (3) 37 (26) 70 (70) July 8 41 (26) 323 (216) 327 (408) July 12 * 25 (15) - 40 (21) July 16 9 (6) July 20 3 (2) - 1 (1) July 23 8 (5) July 28 3 (2) July 31; Aug. 4, 8 Aug. 13 1 (1) Aug. 17, 21, 24 Sept. 1, 5, 9, 13
1 Occasionally the exposure period was varied and this can be calculated by subtracting the preceding removal date from the one under consideration.
* Rig with cultch was missing on this date.
shallow water oyster drills as well. On each observation date such predators were re- moved. A total of 574 starfish was removed from the cage kept in 8 ft of water off Saunders Point, 317 from the cage kept just below the tide line at Saunders Point, and only 3 from the cage kept on the flats. By contrast 86 drills were removed from the cage on the flats, 21 from the inshore cage at Saunders Point, and none from the cage in deeper water. There were no seasonal variations in the occurrence of starfish; how- ever, the drills were not observed in the cages prior to May 19.
Perhaps the green crab is the worst pre- dator of the three mentioned. During the summer of 1955 standard traps built by the U.S. Fish and Wildlife Service were used to obtain an index of density of the green crab. Once during the first week of each month from May through October inclusive the traps, baited with fresh fish scraps, were set out for two successive one-day periods. Each of the successive daily catches was taken from the traps and counted. One trap was used on the flats near station B, one in shallow water on the sand bar near sta-
tion F, and one near the west shore between stations H and I (see Fig. 1). On the first sampling early in May a total of 8 crabs was caught at the sand bar site. Otherwise the catches were entirely on the flats loca- tion, where the trap averaged 278 crabs per day with peaks of 1,024 and 1,104 early in June. John B. Glude, former chief of the U.S. Fish and Wildlife Service clam investi- gations, states (personal communication) that the highest takes in traps similarly operated along the Maine coast, where soft clam stocks have suffered a severe decline with the invasion of green crabs (Glude, 1955), are also of this magnitude.
Since scallops are often exposed in the intertidal zone and are typically harvested through late fall and winter by methods exposing the undersized specimens to air at low temperatures before they are thrown back, a few simple observations were con- ducted on exposure effects. These observa- tions (Table 5) suggest little difference in low temperature resistance between seed and one-year-old scallops. It also appears that scallops are quite resistant to tempera- tures well below freezing. In fact, until
This content downloaded from 195.34.78.245 on Tue, 24 Jun 2014 07:51:15 AMAll use subject to JSTOR Terms and Conditions
102 NELSON MARSHALL
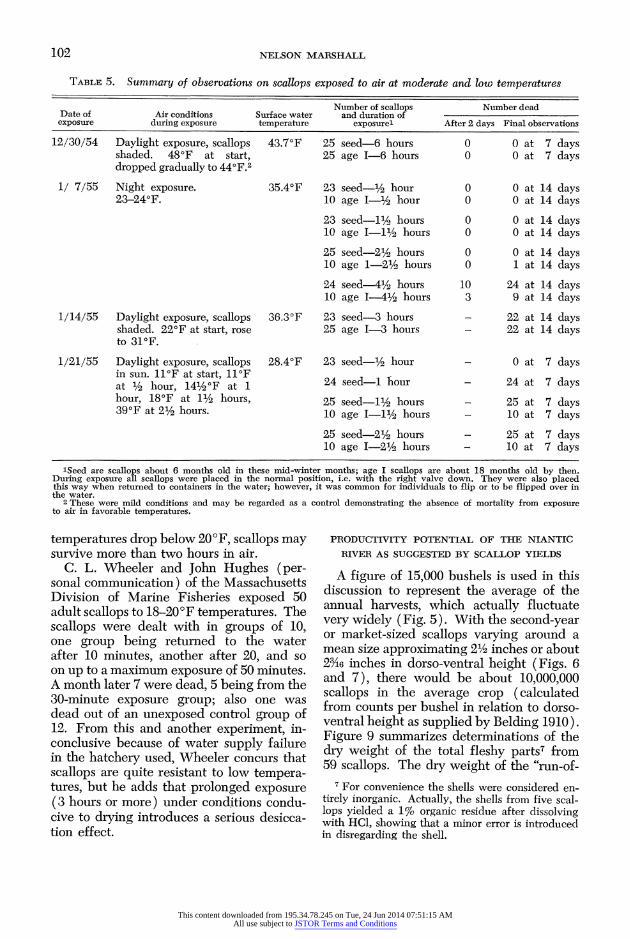
TABLE 5. Summary of observations on scallops exposed to air at moderate and low temperatures
Number of scallops Number dead Date of Air conditions Surface water and duration of exposure during exposure temperature exposurel After 2 days Final observations
12/30/54 Daylight exposure, scallops 43.7?F 25 seed-6 hours 0 0 at 7 days shaded. 48?F at start, 25 age 1-6 hours 0 0 at 7 days dropped gradually to 440F.2
1/ 7/55 Night exposure. 35.40F 23 seed-1/2 hour 0 0 at 14 days 23-240F. 10 age I-1/2 hour 0 0 at 14 days
23 seed-11/vq hours 0 0 at 14 days 10 age I-1,/2 hours 0 0 at 14 days
25 seed-21/2 hours 0 0 at 14 days 10 age 1-21/e hours 0 1 at 14 days
24 seed-41/2 hours 10 24 at 14 days 10 age 1 41/2 hours 3 9 at 14 days
1/14/55 Daylight exposure, scallops 36.30F 23 seed-3 hours - 22 at 14 days shaded. 22?F at start, rose 25 age 1-3 hours - 22 at 14 days to 310F.
1/21/55 Daylight exposure, scallops 28.40F 23 seed-1/2 hour - 0 at 7 days in sun. 1o1F at start, 1F 24 seed-I hour - 24 at 7 days at ?/' hour, 141/20F at 1 hour, 18?F at 11/2 hours, 25 seed-11/e hours - 25 at 7 days 390F at 21/2 hours. 10 age I-11/2 hours - 10 at 7 days
25 seed-21/? hours - 25 at 7 days 10 age I-21/v hours - 10 at 7 days
lSeed are scallops about 6 months old in these mid-winter months; age I scallops are about 18 months old by then. During exposure all scallops were placed in the normal position, i.e. with the right valve down. They were also placed this way when returned to containers in the water; however, it was common for individuals to flip or to be flipped over in the water.
2 These were mild conditions and may be regarded as a control demonstrating the absence of mortality from exposure to air in favorable temperatures.
temperatures drop below 20?F, scallops may survive more than two hours in air.
C. L. Wheeler and John Hughes (per- sonal communication) of the Massachusetts Division of Marine Fisheries exposed 50 adult scallops to 18-20'F temperatures. The scallops were dealt with in groups of 10, one group being returned to the water after 10 minutes, another after 20, and so on up to a maximum exposure Qf 50 minutes. A month later 7 were dead, 5 being from the 30-minute exposure group; also one was dead out of an unexposed control group of 12. From this and another experiment, in- conclusive because of water supply failure in the hatchery used, Wheeler concurs that scallops are quite resistant to low tempera- tures, but he adds that prolonged exposure (3 hours or more) under conditions condu- cive to drying introduces a serious desicca- tion effect.
PRODUCTIVITY POTENTIAL OF THE NIANTIC RIVER AS SUGGESTED BY SCALLOP YIELDS
A figure of 15,000 bushels is used in this discussion to represent the average of the annual harvests, which actually fluctuate very widely (Fig. 5). With the second-year or market-sized scallops varying around a mean size approximating 21/2 inches or about 23A6 inches in dorso-ventral height (Figs. 6 and 7), there would be about 10,000,000 scallops in the average crop (calculated from counts per bushel in relation to dorso- ventral height as supplied by Belding 1910). Figure 9 summarizes determinations of the dry weight of the total fleshy parts7 from 59 scallops. The dry weight of the "run-of-
7 For convenience the shells were considered en- tirely inorganic. Actually, the shells from five scal- lops yielded a 1% organic residue after dissolving with HC1, showing that a minor error is introduced in disregarding the shell.
This content downloaded from 195.34.78.245 on Tue, 24 Jun 2014 07:51:15 AMAll use subject to JSTOR Terms and Conditions

BAY SCALLOP OF NIANTIC RIVER 103
2.0
(3 z
1.0 8
C} - ~~~~~~~~~~~~~12/ 12y
_ /~~~~~~~~~~~12
I I 1 I I I I II I I I 1 1 I I I I I I I 0 10 2.0 3.0
DIST. FROM HINGE TO EDGE OF RIGHT VALUE MEASURED ALONG CURVATURE OF SHELL
FIG. 9. Dry weight of scallop flesh in relation to scallop size. Several scallops of about the same size were grouped, their sizes were measured and averaged, and the dry weight was measured for each group and divided by the number of specimens. Numbers involved in such groupings are given next to the circles which indicate the size and weight averages.
the-crop" scallop is taken to be 1.5 grams. Thus the harvest represents 15,000,000 grams in dry weight. Considering 7% of this to be ash (Atwater 1892) and assuming that half of the organic matter is carbon, the scallop crop represents 7,000,000 grams of carbon. From the 3,196,800 m2 basin of the Niantic River this is a yield of 2.2 gC/ m2/year. On the basis of these calculations a large crop of 40,000 bushels would yield 5.9 gC/m2/year.
The annual harvest of scallops from Ni- antic River amounts to 300 lb/acre/year when calculated from wet weights. This is very high for an animal population, es- pecially for one which is not the sole crop of a given area. A few fish produce such large crops, but this is under carefully managed conditions in small ponds without competing populations and with fertilizers added (Swingle and Smith 1941). It can be compared to the landings from Georges Bank which seldom exceed 30 lb/acre/year (Clarke 1946). Yields in beef cattle, which of course are bred as highly efficient feeders for growth without competition on grazing land, run around 150 lb/acre/year accord- ing to Graham (1944). Unlike the scallop
data, the latter figures include skeletal structures.
More impressive than the scallop yields alone are the implications as to the total animal production of the Niantic River. The scallop harvest may represent far less than half the annual river production in scallops, for regulations permit nothing more effi- cient than hand netting from a drifting skiff, and this is not very effective in deeper water. The catch of other species utilized by man (clams, quahogs, oysters, blue crabs, and available fishes) must be taken into ac- count also with the due recognition that the crop inevitably exceeds the take. Finally many unexploited species must contribute a major fraction of the total biota.
The key to the river's abundance probably lies in the utilization of the basic production of near-shore waters in addition to that which is endemic to the river. As discussed earlier, the mixing residual and tidal waters of the Niantic River may be thought of as a mass of water which is more or less pumped in and out with each tide. Such a water mass, by tending to retain its iden- tity, may develop an abundance of plankton, since gains due to reproduction will not be greatly offset by dispersal (see Ketchum 1954). Furthermore the mixing that does take place in and beyond Niantic Bay is with the waters of eastern Long Island Sound which are inherentlv rich in nutrients and plankton (Riley 1956). Finally the tidal water moving in and out of the Niantic River is probably not subject to such heavy graz- ing offshore as in the river. This estuary, with its broad shallow areas and tidal cir- culation, causes large volumes of water to be directly exposed to expanses ideally suited for sedentary grazing populations.
The potential effectiveness of the grazing population of the river is suggested by figures provided by Chipman and Hopkins (1954) on the volume of water pumped by scallops. Applying their pumping rate fig- ures for large and small scallops to an estimated population of 20,000,000 adults (twice the figure given above for the actual crop) and three times as many seed, one finds that the scallops alone could pump through their mantle cavities 588 x 104/m3
This content downloaded from 195.34.78.245 on Tue, 24 Jun 2014 07:51:15 AMAll use subject to JSTOR Terms and Conditions

104 NELSON MARSHALL
in 12 hrs or about twice the tidal prism of 256 x 104/m3.
The Niantic River can thus be considered as an effective concentrating system, utiliz- ing production from nearshore waters as well as from within the estuary. Hulburt (1956a) has said, "Greater productivity within embayments than in the ocean may result in three ways: by enhanced conver- sion of inorganic nutrients, by contributions of nutrients from land drainage, and by ac- cumulation of nutrients." To this should be added: by efficient grazing on the plank- ton of the tidal prism. The concentration action of estuaries is worthy of continued study.
A HYDROGRAPHIC CONCEPT OF THE BAY
SCALLOP HABITAT
In addition to currents (shown above to be favorable for scallops), suitable bottom and water quality and a substrate for attach- ment of set, certain other characteristics can be defined for an estuary that is favorable for scallops. These are:
1. That the ratio of tidal volume to river flow is high, thus the salinity remains rather high.
2. That the basin is relatively shallow, with a resulting high ratio of tidal volume to the volume of the estuary at low water.
3. That the circulation is such as to re- tain the planktonic scallop larvae in suffi- cient numbers for reseeding and to provide an adequate supply of phytoplankton food, perhaps in part drawn from offshore waters or fertilized by nutrients from offshore.
It will be recognized that these are fea- tures of the Niantic River, particularly after the eelgrass had died off and permitted better circulation adjacent to the bottom (Marshall 1947). From my review of the hydrography of North Carolina sounds (Marshall 1951), I consider that these fea- tures prevail for the scallop habitats of the Beaufort area. Intense study by various workers (Barlow 1955 and 1956, Hulburt 1956a and 1956b, and Ketchum 1954) show that Great Pond, a representative Cape Cod scallop habitat, conforms to such definition. I have endeavored to check this description further through inquiries directed to other
workers representing fourteen marine lab- oratory groups from Massachusetts through Texas and thus covering the range of this species. From information available to date, I have yet to learn of a habitat which regu- larly supports an abundance of scallops but lacks the first two hydrographic features listed. Obviously the third condition, stipu- lating a sufficient food source and conditions for reseeding, must also be satisfied, even if on a minimum basis and by means of com- plex hydrographic features that are yet to be understood. Though Great Pond seems like a small replica of the Niantic River, its tidal waters must be rapidly dispersed by longshore currents as they ebb into Vine- yard Sound. This circulation pattern tends to disperse plankton from the lower reaches (Ketchum 1954 and Barlow 1955), yet some- how the minimum scallop food and reseed- ing is provided. Hulburt (1956b) has shown that some of the hydrographic features of Great Pond and similar embayments are conducive to an accumulation of plankton- producing nutrients. Ayers (1956) has shown for the clam, Mya arenaria, there is always the possibility that the reseeding of areas is by other than the local populations. Explanations of this sort may prove sig- nificant in offsetting the apparently adverse dispersal factors of such habitats.
The coastwide inquiry indicated that some areas seem to meet the stipulated hydrographic features yet lack scallops. Noteworthy in this respect are some of the Georgia sounds, and several sites in the Chesapeake Bay area and along the coasts of Virginia, Maryland, and Delaware. For some sites, and I can speak with greatest certainty for sites along the eastern shore of Virginia, scallops were abundant until the Zostera epidemic, which undoubtedly improved current conditions near the bot- tom but may have created a shifting, un- settled bottom condition unfavorable to scallops.
REFERENCES
ATWATER, W. 0. 1892. The chemical composi- tion and nutritive values of food fishes and aquatic invertebrates. Rept. Commissioner U. S. Commission of Fish and Fisheries for 1888, pp. 679-868.
This content downloaded from 195.34.78.245 on Tue, 24 Jun 2014 07:51:15 AMAll use subject to JSTOR Terms and Conditions
BAY SCALLOP OF NIANTIC ]RIVER 105
AYERS, J. C. 1956. Population dynamics of the marine clam, Mya arenaria. Limnol. Ocean- ogr., 1: 26-34.
BARLOW, J. P. 1955. Physical and biological processes determining the distribution of zoo- plankton in a tidal estuary. Biol. Bull., 109: 211-225.
1956. Effect of wind on salinity distri- bution in an estuary. J. Mar. Res., 15: 193-203.
BELDING, D. L. 1910. A report upon the scallop fishery of Massachusetts. The Commonwealth of Massachusetts, Boston. 150 pp.
CHIPMAN, W. A., AND J. G. HOPKINS. 1954. Water filtration by the bay scallop, Pecten irradians, as observed with the use of radio- active plankton. Biol. Bull., 107: 80-91.
CLARKE, G. L. 1946. Dynamics of production in a marine area. Ecol. Monogr., 16: 321-335.
CORPS OF ENGINEERS, U. S. ARMY. 1945. Niantic harbor and River, Connecticut Review Report. Mimeo., 15 pp.
COTTAM, C., AND C. E. ADDY. 1947. Present eelgrass conditions and problems on the Atlan- tic coast of North America. Proc. Twelfth N. A. Wildlife Conference, pp. 387-398.
GLUDE, J. B. 1955. The effects of temperature and predators on the abundance of the soft- shell clam, Mya arenaria, in New England. Trans. Amer. Fish. Soc., 84: 13-26.
GRAHAM, E. H. 1944. Natural principles of land use. Oxford University Press, London. 274 pp.
GUTSELL, J. S. 1931. Natural history of the bay scallop. Bull. U.S. Bur. Fish., 45: 569-632.
HULBURT, E. M. 1956a. The phytoplankton of Great Pond, Massachusetts. Biol. Bull., 110: 157-168.
. 1956b. Distribution of phosphorous in Great Pond, Massachusetts. J. Mar. Res., 15: 181-192.
KETCHUM, B. H. 1951. The exchanges of fresh and salt waters in tidal estuaries. J. Mar Res., 10: 18-38.
1954. Relation between circulation and planktonic populations in estuaries. Ecology, 35: 191-200.
MARSHALL, N. 1947. An abundance of bay scallops in the absence of eelgrass. Ecology, 28: 321-322.
. 1951. Hydrography of North Carolina marine waters. Part I, pp. 1-76. In Survey of Marine Fisheries of North Carolina. Uni- versity of North Carolina Press, Chapel Hill. 555 pp.
NELSON, T. C. 1952. Some observations on the migrations and setting of oyster larvae. Na- tional Shellfisheries Association, 1952 Pro- ceedings, pp. 99-107.
RILEY, G. A. 1956. Oceanography of Long Island Sound, 1952-1954. IX. Production and utilization of organic matter. Bull. Bingham Oceanog. Coll., 15: 324-344.
RISSER, J. 1901. Habits and life history of the scallop (Pecten irradians ). Thirty-first Ann. Rept. Comm. Inland Fish., State of Rhode Island and Providence Plantations, pp. 47-55.
STEVENS, N. E., H. R. ELLIS, AND R. B. STEVENS. Wasting and recovery of Zostera marina on the Atlantic coast of the United States. Plant Disease Reporter, 34: 357-362.
SWINGLE, H. S., AND E. V. SMITH. 1941. The management of ponds for the production of game and pan fish. pp. 218-226. In Sym- posium on Hydrobiology, University Wiscon- sin Press, Madison, Wisconsin.
U. S. GEOLOGICAL SURVEY. 1954. Compilation of records of surface waters of the United States through September 1950. Geological Surv. Water-Supply Paper 1301: 1-380.
This content downloaded from 195.34.78.245 on Tue, 24 Jun 2014 07:51:15 AMAll use subject to JSTOR Terms and Conditions