study of a possible link between drowning and near ... of a possible link between drowning and...
TRANSCRIPT

Study of a Possible Link between Drowning and Near-Drowning
Events and Surf Conditions in South Texas
A Report Submitted to Sea Grant Texas
Philippe E. Tissot
Texas A&M University-Corpus Christi
Division of Nearshore Research
College of Science and Technology
6300 Ocean Drive
Corpus Christi, TX 78412
September 6, 2005

FINAL DRAFT FOR REVIEW 9/6/2005 2 / 56
Executive Summary
The main focus of this work is to explore a possible link between incidents in the surf zone and
general atmospheric and oceanic conditions affecting the beaches of South Texas. Of particular
interest is a possible link between such incidents and the occurrence of rip currents. The study
area includes the Gulf of Mexico coastline from Port O’Connor to the Mexican border with an
emphasis on the highly attended beaches in the vicinity of Corpus Christi and South Padre
Island.
Study data: The study is based on data obtained from local agencies, from entities monitoring
atmospheric and oceanic conditions and based on data specifically collected for the study. The
data sets include (i) records of drowning, near-drowning and swimmer in distress obtained from
the Nueces County Beach Services Division and the Cameron County Park Ranger Division, (ii)
past atmospheric and oceanic conditions from monitoring platform and buoys obtained
electronically from the National Data Buoy Center (NDBC) and the Texas Coastal Ocean
Observation Network (TCOON) (iii) a questionnaire designed and administered as part of the
study to gather information on the occurrence, frequency and intensity of rip currents in the study
area. Atmospheric conditions were evaluated through past wind and barometric measurements
(C-MAN station of Port Aransas, TCOON stations of Bob Hall Pier and South Padre Island
Coast Guard Station) while offshore wave climate was evaluated through significant wave height
and direction at the NDBC 42020 buoy and the DNR RTNS station. The rip current
questionnaires were collected through E-mail and direct interviews from surfers, windsurfers and
fisherman. Only questionnaires from respondents visiting the beach at least 20 times per year
and having done so for at least 5 years were retained for the study. The Nueces County data
includes 166 incidents from 1983 to 2001, the Cameron County 76 incidents from 2000 to 2004
and a total of 14 questionnaires satisfied the study criteria. Press articles and web accounts were
also used as complementary materials. The available and gathered data is believed by the author
to be appropriate for a general assessment and several specific recommendations. As is often the
case the study also recommends gathering additional information and in particular to monitor
more specifically surf zone conditions and the onset of rip currents and to collect more
systematically information for surf zone incidents.
The following observations, conclusions and recommendations are based on the analysis of the
collected data.
On the Occurrence of Rip Currents in South Texas: Assessment of the occurrence of rip
currents is based on responses to the study questionnaires complemented by press articles and
web accounts. The questionnaire respondents reported that mild rip currents take place daily on
the South Texas coast while strong and dangerous rip currents are observed mostly correlated
with the passage of tropical storms and hurricanes, strong frontal passages and high winds and/or
high surf. Accounts of strong rip currents were overwhelmingly associated with the presence of
structures, piers, jetties, seawalls, natural passes (26 out of 29). The presence of rip currents near
structures is not a surprised as wave diffraction and changes in bathymetry around the structures
are known to favor rip currents. Several rescues of swimmers in distress were associated with
rip currents likely facilitated by the presence of these structures. Structures were also reported
to lead to more complex currents then straight outward going rip currents such as a loop current
taking place between the jetties and the pier at Port Aransas. The correlation between

FINAL DRAFT FOR REVIEW 9/6/2005 3 / 56
observations of strong rip currents and the presence of structures in this study should however
not lead to the conclusion that strong rip currents do not take place away from structures. In this
study both questionnaire respondents and the general beach going population visit
locations/parks which usually include structures such as piers and jetties (Port Aransas, Mustang
Island State Park, Bob Hall Pier, Isla Blanca Park, etc.). Observations are therefore naturally
biased towards surf zone conditions affected by the presence of structures. Nevertheless the
presence of structures on most highly attended beaches of South Texas should be taken into
account for the outreach message, for rip current monitoring, for the design and improvements of
rip current indexes and for preparedness for rescue efforts.
On Rip Current Outreach, Monitoring and Rescues: Based on the rip current observations the
author recommends when possible to increase the focus of the rip current outreach message for
South Texas on the presence of structures and particularly jetties and piers. The majority of the
most frequented beaches (including Port Aransas, Bob Hall Pier, Isla Blanca) include such
structures. While NOAA and USLA brochures present excellent information on rip currents and
the influence of structures is often mentioned the message could be further focused on structures
for South Texas. The author also recommends studying the possibility of monitoring currents
near the surf zone from the end of these existing piers. Due to the break in the bathymetry
created by the piers in an otherwise featureless coast such locations are likely where rip currents
first initiate. Two of the piers are already instrumented and provide real-time information.
Although such measurements are still only part of research projects, even imperfect information
could lead to real-time rip current warnings and better data to study the onset of rip currents in
the South Texas context. When swimmers are caught in a strong rip current they often have
difficulties reacting appropriately and saving themselves. Several accounts of rescues by life
guards and surfers are highlighted in the study. The interaction between the long shore currents
and rip currents and the reported presence of loop currents between structures may also disorient
swimmers and make the situations even more dangerous on some of the South Texas beaches.
Life guards are not present on at least one of the most frequented beaches of South Texas, Isla
Blanca Park. Reasons cited for the absence of life guards are in part the cost of the service but
also liability concerns. It is recommended that the relevant local agencies overseeing highly
frequented beaches be contacted and be helped to initiate a lifeguard program.
On the Impact of Oceanic and Atmospheric Conditions on Surf Zone Incidents, Drownings
and Near Drownings: Atmospheric and general oceanic conditions were obtained for most
drowning near drowning and swimmer in distress cases. The average conditions during these
incidents were compared with the overall average conditions during the same period. The 166
recorded cases for Nueces County took place between April and September while the 76
recorded cases for Cameron County took place year round. For Nueces County, the comparison
yielded the following results for some of the main variables (average during incidents vs. general
average): Average Significant Wave Height at NDBC 42020 Buoy (1.30 +/- 0.68 m vs. 1.13 +/-
0.54 m), 24-hr barometric pressure absolute difference (1.6 +/- 1.5 mb vs. 1.9 +/- 1.9 mb),
average wind speed during the day (12 hrs) (15.9 +/- 5.7 mph vs. 14.8 +/- 5.6 mph), average
wind speed during the past 24 hrs (14.2 +/- 4.4 mph vs. 14.1 +/- 5.5 mph) and daily water level
range (0.53 +/- 0.17 m vs. 0.49 m +/- 0.17 m). The results for the same variable for the
Cameron County data set were the following: Average Significant Wave Height at NDBC
42020 Buoy (1.34 +/- 0.61 m vs. 1.32 +/- 0.65 m), 24-hr barometric pressure absolute difference
(2.1 +/- 2.2 mb vs. 2.9 +/- 2.9 mb), average wind speed during the day (12 hrs) (11.5 +/- 5.1 mph

FINAL DRAFT FOR REVIEW 9/6/2005 4 / 56
vs. 11.4 +/- 5.5 mph), average wind speed during the past 24 hrs (10.8 +/- 4.5 mph vs. 10.4 +/-
5.0 mph) and water level range (0.42 +/- 0.16 m vs. 0.41 m +/- 0.16 m). Based on this
comparison overall average conditions at the time of the incidents are not significantly different
than the general conditions along the South Texas coast. This observation by no means indicates
that rip currents or other surf zone events associated with oceanic and atmospheric conditions are
not a danger along the South Texas coast. Possible explanations for the lack of a meaningful
correlation are that strong rip currents or other dangerous surf zone conditions develop during
average South Texas surf conditions or that other factors are statistically more important than
surf zone conditions for this region. Direct measurements of surf zone conditions could have
possibly alter somewhat the comparison but most of the forcings influencing surf zone
conditions are already included and none of the variables available are showing substantial
differences. Other possible factors influencing surf zone incidents include other surf zone and
behavioral factors. A potential surf zone hazard developing regularly along the South Texas
coast is the presence of strong along shore currents. The South Texas coast is one of the
windiest locations in the lower 48 states with dominant south easterly winds blowing in the
general direction of a low lying coastline made of barrier islands leading to frequent strong along
shore currents. These currents coupled with a fast changing bathymetry in the bar system could
be an important factor for surf zone incidents not identified by unusual atmospheric or oceanic
conditions. Among behavioral factors independent of surf zone conditions consumptions of
alcoholic beverages is a leading candidate. Other studies and local life guards have mentioned
alcohol as a likely important factor. This information is presently not collected. A more
systematic collection of information on victims of surf zone incidents would be very helpful in
identifying the major threats and focusing outreach efforts. If alcohol is indeed a significant
factor, outreach efforts should target this factor specifically.
On the Impact of Tropical Storms and Hurricanes on Surf Zone Incidents, Drownings and
Near Drownings: A correlation between recorded incidents and the presence of tropical storms
and hurricanes in the Gulf of Mexico was explored as well. For Nueces County 7 out of 166
incidents were correlated with the presence of a hurricane (4) or a tropical storm (3). For the 76
recorded Cameron County incidents 8 took place while a tropical storm (6) or a hurricane (2)
was in the Gulf waters. The numbers are small for Nueces County and a little higher, about
10%, for Cameron County. Although incidents do take place during storms the author does not
recommend additional warnings as the public is already warned by the local National Weather
Service Offices, Television and radio stations. Also the aforementioned incidents were
correlated only with the presence of the storms in the Gulf of Mexico but the South Texas coast
was not necessarily significantly affected. For example for only one of the 8 Cameron County
such incidents were the wave heights above 1.5 m.
On additional studies of the occurrence and intensity of rip currents and their impact on surf
zone incidents in South Texas: Some of the main results of the study are the confirmation of the
existence of strong and dangerous rip currents along South Texas beaches and the absence of a
strong correlation between atmospheric and oceanic conditions and surf zone incidents. While
such findings are not mutually exclusive further research could help determine the respective
influence of surf zone conditions, including rip currents and along shore currents, and other
possible factors such as alcoholic consumption. However to perform further research more
information on the victims, surf conditions and factors such as possible alcoholic consumptions
need to be available. A good portion of this information is already being collected by the Nueces

FINAL DRAFT FOR REVIEW 9/6/2005 5 / 56
County Beach Services Division but to the author’s knowledge most of this data is not collected
for other beaches. Encouraging and coordinating the collection of systematic and complete data
sets for surf zone incidents would be essential for more in-depth studies. Measuring directly surf
zone conditions would also provide essential information to determine the cause of drownings,
near drownings and swimmer in distress incidents. Such measurements could also help initiate
real-time rip current monitoring strategies and help with the continuing development of rip
current index.

FINAL DRAFT FOR REVIEW 9/6/2005 6 / 56
Table of Contents
Executive Summary
1. Introduction
2. Study Scope and Objectives
3. Rip Currents
4. Preponderance of Rip Currents on the South Texas Coast
5. Assessment of Surf Conditions during Drowning and Near-Drowning Events
6. Specific Cases of Drowning and Near-Drowning Events
7. Drowning and Near-Drowning Events
8. Possible Correlation between Drowning and Near-Drowning Events and
Surf Conditions
9. Conclusions and Recommendations
10. Acknowledgements
11. References
Appendix 1: Scanned copy of NOAA & USLA “RIP CURRENTS! BREAK THE GRIP OF
THE RIP” brochure
Appendix 2: US Coast Guard Information and Recommendations Regarding Rip currents
Appendix 3: US Coast Guard Recommendations for Beach and Ocean Safety
Appendix 4: Texas Sea Grant and National Weather Service “Rip Currents” Placard
Appendix 5: Rip Current Survey
Appendix 6: Aerial Photography of the Southern Portion of the Texas Coast with Locations of
Structures.
Appendix 7: List of Tropical Storms and Hurricanes in the Gulf of Mexico during Study Years
(1983-June 2005)
Appendix 8: Agencies Contacted to Obtain Surf Drowning and Swimming Incidents
Information
Appendix 9: Atmospheric and Surf Conditions During Nueces County Surf Incidents
Appendix 10: Atmospheric and Surf Conditions During Cameron County Surf Incidents

FINAL DRAFT FOR REVIEW 9/6/2005 7 / 56
1. Introduction
A stay at the beach is an opportunity for recreation, sports, sometimes just relaxation and often
includes swimming and playing in the surf. Such activities can include risks depending on the
surf conditions and the behavior of the individual. In South Texas, the Nueces County Beach
Services division recorded 123 drownings and 40 near drownings on the county’s beaches during
the combined periods of 1983-1995 and 2001 [1]. While other accidents take place on the
beaches or related facilities such as parking lots and bath houses, drowning and near drowning
incidents are unique to the beach setting. Risks of drowning are often linked to surf conditions
and overall meteorological conditions. Dangerous surf conditions include large waves, strong
along shore currents and rip currents. Rip currents form when water piled against the shore
begins to return to deeper water forming strong seaward currents [2]. Rip currents vary in
strength and occur at all surf beaches lasting from a few minutes to a few hours. More
permanent rip currents are associated with groins and jetties. Rip current can surprise swimmers
and are thought to be responsible for a number of drowning and near drowning events. NOAA
and the United States Lifesaving Association (USLA) formed a Rip current Task Force and
recently summarized rip current fatality statistics
(http://www.ocean.udel.edu/ripcurrents/Safety/). The taskforce found that 80% of the rescues
effected by ocean lifeguards involved saving those caught in rip currents Furthermore over the
past 10 years it was found that for weather- and ocean-related fatality, the number of rip current
deaths in the US ranked second at about 100 per year, ahead of deaths from floods, tornadoes,
lightning, and hurricanes (http://www.ocean.udel.edu/ripcurrents/index.html).
While completely eliminating accidents in the surf is not a realistic objective exploring and
characterizing links between past drowning or near drowning events, and meteorological settings
and surf conditions could guide further efforts to minimize the risk of such incidents. The goal
of this study was to gather information on past swimmer in distress, near drowning and drowning
incidents, explore the related atmospheric and water conditions and assess their possible link to
rip currents. Of particular interest in the report is the South Texas setting and if particularities of
the South Texas beaches impact the safety of swimmers. It is hoped that beach managers,
including state, county and municipal agencies that own and operate public beaches in Texas,
will benefit from this information. In the last section of this study a series of recommendations
are made to further improve the safety of our beaches and to extend efforts to better track surf
incidents and their causes in South Texas. Based on this study’s results and the related
discussions, a second phase of the project will focus on targeted outreach efforts and possibly the
optimization and implementation of a system forecasting the potential of dangerous surf
conditions. The study results have been and will continue to be discussed with the Corpus
Christi and Brownsville National Weather Services, the local beach managers, and Sea Grant
Texas. The overall project design is presented in figure 1 with tasks 1 and 2 being the focus of
this study and this report.

FINAL DRAFT FOR REVIEW 9/6/2005 8 / 56
Figure 1. General plan of action for the study of a possible link between meteorological settings,
surf conditions and past drowning and near drowning events in South Texas. The present study
focused on tasks 1 and 2.
1a. Collect Information
on past drowning and
near drowning events
2. Study possible correlations
between incidents and surf
and meteorological conditions
3.1 Design and implement focused
outreach/education efforts
If correlations
are found
1b. Collect Information
on the occurrence and
location of rip currents
3.2 Design and implement a
warning strategy for the occurrence
of dangerous surf conditions

FINAL DRAFT FOR REVIEW 9/6/2005 9 / 56
2. Study Scope and Objectives
The main goal of the study was to determine if a relationship exists between meteorological
settings, surf conditions and past drowning and near drowning events in the study area, the South
Texas coast Port O’Connor to Boca Chica Island at the Mexican border, i.e. from Calhoun to
county to Cameron county (see Figure 2). The specific objectives of the study were initially the
following:
• Assemble a detailed database of drowning and near drowning events which took place
along the South Texas Coast during the past 20 years
• Associate to each drowning and near drowning event available information on the
meteorological setting and surf conditions
• Determine if there is a correlation between meteorological settings, surf conditions and
past drowning and near drowning events
• Determine if there is a correlation between other factors such as ages, ethnicities, home
zip codes and other characteristics of the victims and the drowning or near drowning
events
• When possible specifically determine if rip currents, strong along shore currents or other
clearly identifiable surf condition such as large waves were involved and the
meteorological setting and surf conditions related to the occurrence of the particular surf
condition
• Present and discuss the results with study participants including the Corpus Christi
National Weather Service office staff and local beach managers
• If a good correlation is found between drowning and near drowning events and
meteorological conditions propose with the other study participants focused outreach
efforts and a general warning strategy for the occurrence of dangerous surf conditions
based on forecasted meteorological conditions
As the study evolved additional tasks were added such as distributing and questionnaire on the
occurrence of and identifying structures and passes along the South Texas Coast. The upcoming
sections report on the result of the study starting with a brief description of rip currents as the
present literature describes them.

FINAL DRAFT FOR REVIEW 9/6/2005 10 / 56
3. Rip Currents
3.1 Definition of Rip Currents:
Rip currents form when water piled against the shore begins to return to deeper water forming
strong seaward currents [2]. The characteristics of a rip current are illustrated in Figure 3. The
most dangerous part of the rip current is the narrow and fast current also called the neck where
the water is moving seaward across the breaker zone. Speeds within the current may be fast
enough to pull swimmers away from the beach very quickly. It is not unrealistic for rip currents
to exceed 4 or 5 knots (faster than an Olympic swimmer) and have widths that range from 10 to
30 yards [3]. Other characteristics of a rip current are the alongshore currents feeding the rip
current and the rip head where the current broadens and weakens. Rip currents form as waves
break over the sandbar and water becomes trapped in the zone between the beach and the bar
system. As the pressure builds, water seeks the path of least resistance which is typically a break
in the sand is acted upon by gravity which seeks the path of least resistance, which is typically a
break between two sandbars. Rip currents vary in strength and can occur at all surf beaches.
These currents can last from a few minutes to a few hours.
USLA encourages the exclusive use of the correct term “rip currents” as the use of other terms
may confuse people and negatively impact public education efforts [4]. Other incorrect terms
sometimes used include "rip tides" or "undertows." These are misnomers as rip currents are not
directly related with tides and they do not pull people under.
Research suggests that there are several types of rip currents Rip currents. Four categories of rip
currents can be identified and are described on the National Weather Service Office of
Wilmington North Carolina Rip Currents website [3].
Type 1 or Fixed rip occurs along beaches where there are no man-made structures. Typically,
there is an area where the water is deeper than the surrounding water. They are found in one
general location most times and are strongly influenced by surf conditions, as well as the shape
of the coast and sandbar structure. A good place to find this type of rip is along an intermediate
point of a cut (cusp) between two points along the beach.
Type 2 rip or FLASH rip is a short duration current, which is enhanced by heavy surf. This is
especially true when large swells from distant hurricanes increase the amount of wave energy
and wave volume dispersed onto the beaches. Flash rip currents are extremely unpredictable,
because of the temporary conditions they produce, as well as variable locations they set up.
Type 3 rip or Permanent rip is defined as a stationary seaward current that is focused on
structures, thus persist almost year round. Structures such as jetties, groins, or large drainage
outflows will aid the formation of permanent rip currents. This type of rip current can change in
magnitude given surf/swell conditions. Fishing piers are additional structures which focus rip
currents. In this case, the rip is found aligned along and under the pier.

FINAL DRAFT FOR REVIEW 9/6/2005 11 / 56
Figure 2. Map of Texas Coastal Counties (from the Texas Genearal Land Office website at: ).
Figure 3. Characteristics of a typical rip current [5]

FINAL DRAFT FOR REVIEW 9/6/2005 12 / 56
Type 4 rip or Traveling rip can appear to move down the beach aided by the prevailing wave
direction. It has been documented that a strong and persistent swell begins the traveling rip
process. Swells impacting one portion of the beach will temporarily enhance the rips there;
however, once the swells become focused on another area the initial rips weaken while new rips
strengthen in the new area. This type of rip current is strongest when the swell periods are very
defined, allowing for an apparent propagation down the beach as additional sets interact with the
coast.
The US Cost Guards further introduces rip currents and gives the following advice for swimmers
trapped in the currents (http://www.uscg.mil/mlclant/kdiv/Beach).
“Rip currents are the most threatening natural hazard along our coast. They pull victims away
from the beach. The United States Lifesaving Association has found that 80% of the rescues
effected by ocean lifeguards involve saving those caught in rip currents. A rip current is a
seaward moving current that circulates water back to sea after it is pushed ashore by waves. Each
wave accumulates water on shore creating seaward pressure. This pressure is released in an area
with the least amount of resistance, which is usually the deepest point along the ocean floor. Rip
currents also exist in areas where the strength of the waves is weakened by objects such as rock
jetties, piers, natural reefs, and even large groups of bathers. Rip currents often look like muddy
rivers flowing away from shore.
Rip currents are sometimes mistakenly called "rip tides" or "undertows." These are misnomers.
Rip currents are not directly associated with tides and they do not pull people under.
Try to avoid swimming where rip currents are present, but if you become caught in a one, swim
parallel to the shore until the pull stops and then swim back to shore. If you are unable to return
to the beach, tread water and wave for lifeguard assistance. Stay at least 100 feet away from piers
and jetties. Rip currents often exist along the side of fixed objects in the water.
Be aware of ocean conditions. Lifeguards are trained to identify potential hazards. Ask a
lifeguard about the conditions before entering the water.”
Further advice on beach safety including website texts, a NOAA-USLA brochure and a Sea
Grant – National Weather Service placard can be found in Appendices 1-4. Additionally
NOAA's National Weather Service and National Sea Grant Program, in partnership with the
USLA, are working together to raise awareness about the dangers of rip currents. As part of this
collaboration research is conducted to develop and improve the ability to predict the occurrence
and strength of rip currents. Recent results and more detailed information on rip currents can be
obtained from the general National Weather Service Rip Current Safety website at
http://www.ripcurrents.noaa.gov/ and for recent research results at “Rip Current Science”
(http://www.ripcurrents.noaa.gov/science.shtml”.
Finally for a number of beaches along the US coasts many National Weather Service offices
issue a daily rip current outlook as part of their Surf Zone Forecast. A three-tiered structure of
low, moderate, high is used to describe the rip current risk. This outlook is communicated to
lifeguards, emergency personnel. Table 1 below describes more specifically the three types of
outlooks. For South Texas such outlook is already offered by the Brownsville office and is
considered by the Corpus Christi Office.

FINAL DRAFT FOR REVIEW 9/6/2005 13 / 56
Table 1. Rip Current Outlooks use the following, three-tiered set of qualifiers used by the
National Weather Service to inform visitors of the likelihood of and danger associated with rip
currents.
Low Risk of rip currents. Wind and/or wave conditions are not expected to support the development of rip currents; however, rip currents can sometimes occur, especially in the vicinity of groins, jetties, and piers. Know how to swim and heed the advice of lifeguards.
Moderate Risk of rip currents. Wind and/or wave conditions support stronger or more frequent rip currents. Only experienced surf swimmers should enter the water.
High Risk of rip currents. Wind and/or wave conditions support dangerous rip currents. Rip currents are life-threatening to anyone entering the surf.

FINAL DRAFT FOR REVIEW 9/6/2005 14 / 56
4 Rip Current Assessment for the South Texas Coast
While the occurrence of rip currents along the South Texas coast was not in question detailed
information regarding their frequency and intensity was not found in the existing literature. This
is likely a consequence of the difficulty to perform actual measurements as placing instruments
in the rip is not an easy task and both rip currents and rip current morphology often migrate.
Accounts of attempts to measure rip currents in the field can be found on the NOAA “Rip
Current Science” web site (http://www.ripcurrents.noaa.gov/science.shtml). In any case such
experiments have not been attempted for the South Texas coast at least to the author’s
knowledge. To better establish the preponderance and intensity of rip currents this study relied
on observations. These observations were collected through a questionnaire (see appendix 5)
designed for the study and distributed to persons with considerable experience with the South
Texas Coast. Surfers, Windsurfers, Fishermen and professionals working and/or studying the
coast were identified as the groups most likely to have observed rip currents. The questionnaire
was E-mailed to the associations’ respective listservs. Additional surveys were collected by
interviewing directly individuals during various visits to the beach and during the 2005 Velocity
Games at McGee Beach in Corpus Christi. Early during the questionnaire collection it became
clear that respondents could be divided into two groups: (1) persons visiting the beach only
occasionally or having enjoyed the local beaches for 3 years or less and (2) persons having
enjoyed the beaches for 3 years or more and visit the beach on average at least 20 times per year.
In the first group some respondents had not witnessed rip currents while others had. In the
second group all respondents had witnessed several rip currents. As the goal of the study was
not to measure the general awareness of rip currents but to establish as reliably as possible
evidence of their occurrence, strength, location and general associated conditions only answers
from the second group were further collected and analyzed. Incomplete answers or answers with
anecdotic evidence but without full answers to the questionnaire were discounted as well. While
these criteria considerably restricted the potential respondent population it helped insure the
relevancy and improved the consistency of the answers. A larger survey of rip current awareness
in the South Texas population including occasional visitors would be useful but was beyond the
scope of this study.
4.1 Analysis of General Answers to the Study Rip Current Questionnaire:
A total of 14 questionnaires fit the criteria selected above. The respondents have enjoyed the
beach for a period of 3 to 50 years with an average and median experience of 25 years. The
frequency of their yearly visits to the beach ranged from 10 to 25 to 250 visits with an average of
88 trips per year and a median of 65 per year. Respondents’ activities at the beach were as
expected mostly surfing, fishing and windsurfing (the targeted groups). Several respondents (8)
enjoyed more then one activity. The breakdown of the respondents by activity is presented in
table 2.
All respondents visited the beach year round except for one of the respondents visiting the beach
from March to November. As acknowledged by the participants to the survey their preferred
activity may have influenced their answers. For example surfers will visit the beach typically
during good surf conditions (waist high surf and above) including tropical storms while
fisherman will typically avoid conditions such as high surf and tropical storms. Windsurfers will

FINAL DRAFT FOR REVIEW 9/6/2005 15 / 56
visit the beach when wind speeds are around or above 20 miles per hour while surfers will often
avoid windy conditions. Another potential bias comes from the location of the observations.
Table 2. Repartition of questionnaire respondents by activity and by the locations they visit on a
regular basis (individual respondents can have more than 1 activity and typically visit more than
one location).
Activity at the Beach
Number of
Questionnaire
Respondents
Beach Location
Visited
Number of
Questionnaire
Respondents
Surfing 9 Padre Island National
Seashore 5
Fishing 7 Horace Caldwell
Pier/Balli Park 8
Windsurfing 4 J.P. Luby Park 2
Studying/Documenting 2 Sea Wall 2
Other 2 Fish Pass/Mustang
Island State Park 4
Port Aransas/Horace
Caldwell Pier 8
Other 3
Fisherman and individuals walking, studying or documenting beach processes typically stay
close to shore while surfers and windsurfers enjoy their sport in deeper waters. Surfers and
windsurfers were also found to enjoy their sports near structures with reasons expressed being
the surf and currents (influenced by the proximity of the structures) and the convenience of easy
parking. Fishermen were in majority visiting Padre Island National Seashore for their pastime.
The impact of these inherent biases should however be mitigated by the fact that respondents
from distribution of the respondents, the overlap in the surf conditions for the different activities,
and by the fact that several respondents enjoyed dual activities with 3 respondents being both
surfers and fishermen and 3 different respondents being both surfers and windsurfers.
All of the selected respondents had witnessed rip currents. The observed yearly frequency varied
greatly depending on the respondents from every visit to the beach to only 2-3 per year. This
difference in the answers depended mostly on the main beach activity of the respondent and the
type of rip current intended by the respondent (the type of rip current intended could be
identified by other answers to the questionnaire). Most fishermen considered rip currents as a
daily occurrence. They also label rip currents as “outsucks” and try to identify their locations as
they are a good place to fish. One of the respondents stated that he went along the beach during
dead calm conditions and no surf to identify the locations of small rip currents and often sees
several rip currents 40 to 50 ft away from each other. Surfers typically estimated the number of
significant rip current instances from 2 to 10 per year but several surfers pointed out that small

FINAL DRAFT FOR REVIEW 9/6/2005 16 / 56
rip currents are virtually always present near structures. These small rip currents regularly found
on the side of jetties or piers are also called “elevators” by surfers and help them paddle through
the near shore surf. For the rest of this study we will assume that small rip currents can be
frequently observed along the South Texas coast with more intense rip currents taking place less
frequently. The study will further focus on the more intense and therefore more dangerous type
of rip currents.
These larger types of rip currents were mostly quoted by surfers and windsurfers and mostly but
not exclusively took place near structures. When combining the respondents’ answers strong rip
currents were observed near every structure, pier, jetty, groin, or sea wall of the study area. This
bias towards structures for large rip currents could indicate that indeed these structures are the
predominant location for strong rip currents but could also be due to the regular presence of
observers at these locations during conditions favoring the onset of strong rip currents. Surfers
and windsurfers generally practice their sport near structures during high wind or high surf
conditions and therefore will be able to report such events if they occur. Observations from the
rest of the coast will are more difficult to gather during such conditions due to the lack of
observers. Among the locations prone to large rip currents the Port Aransas area, Horace
Caldwell Pier, the Port Aransas Ship Channel Jetties and the area in between the pier and the
jetties was quoted by 10 of the 11 respondents visiting this location as prone to strong rip
currents. 7 out of 10 respondents visiting Bob Hall Pier and 3 out of 4 respondents visiting Fish
Pass Jetties witnessed strong rip currents there. Examples of strong rip currents away from
structure were not mentioned frequently but included the area in front of Road Access 4 just
north of Bob Hall Pier and the northern portion of North Padre Island Seashore. Specific
example of strong rip currents will be discussed in the next section. Based on these answers it is
concluded that strong rip currents take place relatively frequently around structures and that rip
current awareness efforts should include specifically these locations. However given the
relatively small number of respondents and the potential bias due to the activities of the
respondents one cannot be conclude that strong rip currents take place less frequently away from
structures.
As for the factors influencing the occurrence and the strength of rip currents the respondents
identified: wind, surf conditions, tidal range and tidal stage, as well as the presence of storms,
frontal passages, tropical storms and hurricanes. These factors are most of the ones used by
National Weather Service coastal offices issuing Rip Current Outlook statements as described
above (http://www.ripcurrents.noaa.gov/forecasts.shtml). The tidal cycle was also recently
quoted as a factor correlated with the frequency rip current related rescues in central Florida [6].
While generally the likelihood and strength of rip currents was reported to be increased by the
abovementioned factors a fisherman respondent also made the observation that strong alongshore
winds in excess of 30 mph will break the rip currents near the shore. “The high velocity wind
over a rather short period of time will destroy the "holes" and very shallow, extended bars that
are present at rips. The littoral drift/long shore current builds up speed and rips all the temporary
sand structure away until moderate conditions return. When moderate conditions return the
holes, extended bars and rip currents will return as mandated by the existing conditions. They
will continue to change daily as conditions change”. This comment will be included as part of a
further discussion on the likely influence of the strong alongshore winds in South Texas in the
onset and development of rip currents.

FINAL DRAFT FOR REVIEW 9/6/2005 17 / 56
4.2 Observed Cases of Dangerous Rip Currents by Questionnaire Respondents:
The second part of the questionnaire focused on obtaining information on specific events of
observed strong rip currents, mostly in the Coastal Bend region. The occurrence of strong rip
currents on South Padre Island beaches will be treated in the next subsection. The table below
gives an abbreviated account of these incidences of strong rip currents; more details can be read
in appendix 5. The answers to this part of the questionnaire can be used to identify locations
where strong rip currents can take place but should not be used to make conclusions as to the
predominant location of rip currents. The accounts of strong rip currents below took place in
large majority near structures, 26 out of 29 (piers, sea walls and jetties). Furthermore structures
are the locations where large numbers of people enjoy the beach. The combination of strong rip
current observations and beach attendance should lead to targeted outreach efforts around these
structures. Answers to the questionnaires should however not be used to state that rip currents
predominantly take place around structures. This study’s observations of strong rip currents
were made mostly by surfers and windsurfers and therefore these observations will necessarily
come in majority from beach locations around structures. There are only a few accounts of
strong rip currents away from structures. They were observed to be associated with unusual
beach features, j-hooks, washouts, pinches, and in front of access roads to the beaches.
Based on the questionnaire the following factors were identified as favoring the onset of strong
rip currents:
• Hurricanes, tropical storms, strong frontal passages
• The presence of structures nearby but also up to 50 yards away from the structure
• Waist high or above surf
• Strong and prolonged south and southeasterly winds
• Strong west or northwest winds
• Features in the beach
Finally several respondents described more complex circulation patterns at Port Aransas between
Horace Caldwell Pier and the Ship Channel jetties. A respondent observed during three
occasions that the current was not just moving seaward but forming a loop between the pier and
the jetty with the seaward arm closest to the jetty (see Figure 4). This respondent participated to
the rescue of 5 high school age persons who were caught in this circulation. In this case one of
the arms of the rotation was close to the beach where the swimmers were first caught before
being pushed seaward by the leg of the rotation closest to jetty. In this example the pattern of the
rip current was not straight forward and the advice to just swim parallel to the beach may not
have saved the young people. Only the presence of surfers and windsurfers likely saved the lives
of these young people. Also if other swimmers had tried to help they would have likely been
entrained by the rip themselves. Other cases of strong currents between the pier and south jetty
of Port Aransas were reported with the current near the beach moving both North-South and
South North depending on the general conditions. For such cases it seems difficult to advise
anything else then having trained lifeguards familiar with the location to help prevent as
systematically as possible tragic endings to such incidents.

Table 3. Accounts of specific rip currents observed. The comments were extracted from the original questionnaires with minimal
editing restricted to abbreviations and occasional typos. For further details see the full questionnaires in appendix 5.
Rip Current Cases
Date if known
Location Strength (1-3)
Special event?
Surf conditions
Other information
Port Aransas Area Rip Currents
1 Spring 2002 Port A close to pier 2 No special event of any kind, total surprise
Waist to shoulder high surf
This was a very unusual rip because there was no apparent reason for the rip to occur. It was a lateral current running from South to North at a very fast rate of speed. I personally was caught up in it while I was paddling in toward the shore after a long surf session. The current was approx. 15 yards wide and it carried me about 200 yards.
2 Sept.2004 Port A, Broad Area between Port A Pier and South Jetty
3 Category 4 Hurricane Ivan was in the Gulf
very large hurricane Ivan surf in 10 ft size range
This rip was mostly due to the water rushing toward the face of very large waves that were advancing toward the shore. It was a current that was pulling directly straight out from the beach with only a slight sideways drift.
3 Nov. 27, 2004 Port A, Very large area between Port A Pier and
South Jetty
3 Strong west to Northwest wind almost straight
offshore after a north frontal passage
shoulder high surf
This was one of the strongest rip currents that I have ever experienced in the 42 years that I have been surfing. The whole area between the Port A. Pier and the South Jetty in Port A. had a very strong rip pulling straight out from the beach. I believe that it is what many Texan locals call an Undertow. Sitting on a surfboard it was almost impossible to sit in one area without being pulled out to sea.

FINAL DRAFT FOR REVIEW 9/6/2005 19 / 56
Another surfer and myself had to rescue two young and inexperienced surfers who were being swept out to sea by the strong rip.
4 most every memorial day and labor day in PortA for the past years (small rip currents)
Port Aransas but not close to structures
1 no 3’ seas On the smaller ones you can usually see the sandy water heading out.
In the two larger ones I really only saw a cut in the bar where no waves would break. I was standing in many of the smaller ones fishing chest deep and would see the water going out and also step down in the cut. It was easy to get out of it.
5 - Port Aransas, next to Jetty 3 Prolonged SE wind
overhead
6 - In between pier and jetty at Port Aransas, closer to shore
~ 100ft
3 TS Mast High (> 4 m)
2 HS guys and 3 girls all in good shape rescued. Some dragged back to shore using windsurfer 2 by a longboarder
7 - Port Aransas, end of pier 2 TS Mast High (> 4 m)
8 Summer Port A Pier, beyond the pier, 80 yards pass the pier
2.5 Overhead
9 - Port Aransas, Eddy around the T at both piers
2 General windy
conditions
Not so much a matter of waves but a matter of current
10 Year round but less in summer except during TS
Horace Caldwell Pier - down current side of Pier.
Decreased slope of seafloor as compared to BHP may
cause weaker rips
1 Storms, frontal
passages, high winds
as little as waist high waves
11 Bigger waves, bigger rip
Port Aransas, pier, jetty but also open water, during storm swell, strong rip on either died
2 for pier Tropical storm and hurricanes
Shoulder high and larger waves
Witnessed lady being rescued after she nearly drowned after getting caught in the pier rip on a moderate

FINAL DRAFT FOR REVIEW 9/6/2005 20 / 56
of pier and very strong rip adjacent to jetty. Mild
currents up and down the beach.
for strong rip currents
day
12 ? Port A Jetty, strong currents flowing north along the beach and then out at the jetty.
3 In hurricane swell, the rip adjacent to the jetty can be several hundred feet wide and difficult to deal with even on a surfboard.
Second hand account of surfers being swept out at the jetty
Bob Hall Pier and Nearby Rip Currents
13 Year round but less in the summer except during TS
Bob Hall Pier - always on the down current side from the pier, also about 50 yards away from the pier
2 Storms, frontal
passages, high winds
as little as waist high waves
14 - Between BHP and access rd 4 close to parking
3 TS – High tide
Big surf, > 6’
15 - Bob Hall Pier 3 After many days of 20-25
mph
5’-6’ waves
16 - Bob Hall Pier, front of entrance road (maybe a little
deeper waters there)
2 Prolonged SE wind
Waist to shoulder
17 - Bob Hall Pier Eddy around the T at both piers
2 General windy
conditions
Not so much a matter of waves but a matter of current
Fish Pass Jetties Rip Currents
18 Year round but less in summer except during TS
Fish Pass - along side jetties 2 Storms, frontal
passages, high winds
as little as waist high waves

FINAL DRAFT FOR REVIEW 9/6/2005 21 / 56
19 Nov. 20 & 21, 2004
Fish Pass, Noth side of north Jetty
2 A strong south wind blowing prior to a north frontal passage.
chest to head high surf
A moderate rip moving from South to North but very consistent for two days.
20 Most days with normal tidal movement
Fish pass jetty, south side of the south jetty
- no Strong rip on the south side of the south jetty. You can watch the water start moving & watch the rip form.
Corpus Sea Christi Wall Rip Currents
21 Year round but less in summer except during TS
Seawall - intermittent rips along seaway about every 50 yards and a few favored locations
2 Storms, frontal
passages, high winds
as little as waist high waves
22 After H Brett during the strong west winds
Corpus Christi Sea Wall 3 Hurricane + West wind
shoulder high decreasing to waist high as wind increased
Rip Currents Observed at Other Locations
23 All times of the year
Bob Hall Pier, Port A, Surfside, Galveston usually abutting a structure unless strong sideshore where it might be pulled away from pier or regular location
2 Sizeable waves, i.e. storm, swell, sustained wind over time
Waist high and above
Swimmers generally should not swim 30-40 feet of piers and jetties
24 ? Open Beach 2 Beach rips are a 2 depending on depth, waves, sidshore, currents, etc.
25 Spring during high wind events & fall during high wind events
Corpus - PINS beach, north end of the park, Rips usually associated with unusual beach features, j-hooks, washouts, pinches
Many 1's, several 2's a few 3's
Front passage or approaching low pressure system
above average wind/wave conditions

FINAL DRAFT FOR REVIEW 9/6/2005 22 / 56
26 Summer and spring a couple larger rips 2002-2003
Padre Island National Seashore
1 no 2’-3’ seas
27 Several Surf Side beach jetties 3 TS Most storms with East swell
Observed surfers washing up on jetty or carried to end
28 Several Galveston Flagship Pier 2 TS SW swells
29 Several Galveston Groins 2 TS Most storms

Figure 4. Schematic of the circulation observed during at least three rip current cases and drawn
during one of the interviews.
Finally one of the respondents who rescued a number of swimmers and novice boogie boarders
on the Pacific coast commented that the severity of the Rips in South Texas was considerably
weaker. This comment will be placed into the context of the analysis. The fact that the seas are
smaller in the summers when most visitors attend the beach probably also helps keep the number
of rip current associated incidents down.
4.3 Specific Cases of Dangerous Rip Currents on South Texas Beaches:
While the questionnaire focused on the beaches of the Coastal Bend in Nueces and Kleberg
County and somewhat in San Patricio county (St Joseph Island beaches) it did not extend further
south to the beaches of South Padre Island (Cameron county), Kenedy and Willacy counties or
further North to the beaches of Refugio and Calhoun counties . For most of these counties beach
access is difficult and the number of visits to beach is considerably smaller than for Nueces and
Kleberg counties except of course of Cameron County and South Padre Island. For these other
counties it is hypothesized that the general causes for the onset and strengthening of rip currents
will be the similar to the coastal bend. It is also expected that local particularities of the beaches
including structures and bathymetry will play an important role in the conditions necessary for
the onset of rip currents and possibly more complicated current patterns. For South Padre Island,
an indirect evidence of the presence of rip currents comes from the warnings on most websites
related to South Padre Island beaches. Spadre.com (http://www.spadre.com/) website states that
Rip currents are common on all South Padre Island Beaches and has a full section on rip
currents. The section of their websites includes the following information:
Port Aransas
South Jetty
Beach
Horace Caldwell
Pier

FINAL DRAFT FOR REVIEW 9/6/2005 24 / 56
BEACH and OCEAN SAFETY INFORMATION
For Visitors to South Padre Island
Before you jump into the waves, take a few minutes to read this important water safety information and discuss it with your family and friends.
Beachgoers need to be aware of the surf conditions and related currents. The waves you've come here to enjoy are irresistibly beautiful and enjoyable, yet powerful and dangerous and must be respected, even on the days when the surf is relatively calm. There are NO LIFEGUARDS AT SOUTH PADRE ISLAND, swim at your own risk.You are on your own once you leave the safety of the beach.The U.S. Coast Guard may respond to a call for a swimmer in distress if they are able, but they are not adequately trained or equipped for swimmer rescue in the surf, they are only going to come recover your body. Our local EMS, FD, Park Rangers and Police are also not equipped or trained for swimmer rescue. You are simply on your own once you leave the safety of the beach, the safety of you and your family is your responsibility. Many rescues are performed by local surfers, and were recognized in 2003 by Cameron County for the many rescues performed with a proclamation of "Surf's Up Week". Taking simple precautions like wearing a lifejacket can easily avert a tragedy.
Figure 5. South Padre Island Spadre.com (http://www.spadre.com/) giving advice, warnings and
information about rip currents about Rip currents.
The website also warns about the potential for rip currents to take place along the jetties and
states that no one should swim near the jetties (see Figure 6).
The Cameron County Park System website (http://www.co.cameron.tx.us/parks/safety.html) also
has warnings and links to further information on rip currents and the Brownsville office of the .
National Weather Service office issues surf zone forecasts for the beaches of South Padre Island
and Boca Chica (http://www.srh.noaa.gov/data/BRO/SRFBRO).
4.4 Importance of Long Shore Currents in South Texas Beaches:
An important message given by several respondents, fisherman, surfers and windsurfers was the
importance of long shore currents. These currents are generally created by strong consistent
winds, often south or southeasterly, sometimes northerly during frontal passages. These strong
currents can make it difficult to walk in the surf and can cause a person to loose his/her balance.
The problem is compounded by the bar structure and the surf. A person standing at the top of a
bar can be just a few feet from losing ground. It is easy to imagine a person loosing balance and
being dragged into deeper waters in between the bars especially younger beach goers or persons
affected by hours in the sun or alcohol consumption. The long shore current is a danger in itself,
especially if combined with high surf. Also a person may be transported laterally at first but
could be pulled seawards if a rip current is reached. Such cases were reported for the Port

FINAL DRAFT FOR REVIEW 9/6/2005 25 / 56
The Jetties
If the rocks are wet from waves, DO NOT walk any further!
Jetties - Located at the southern tip of the island in
Isla Blanca Park, the jetties are not designed for
public access, although it is allowed. Never swim
near the jetty. Many people have been swept off
the rocks and injured or swept out to sea in the
strong rip next to the jetty while attempting to walk
out the jetty during high surf. The granite boulders
are barnacle encrusted and urchin infested. Always
bring some type of flotation device to be used for
rescue in case someone falls into the surf. There is a
strong rip current located next to the jetty. This rip
current is the strongest and most dangerous on the
entire Texas coast, and on big days it can suck you
out to the end of the jetty into the "pit" where the
biggest waves will break, and likely wash you back
onto the rocks. If you get caught in the rip, simply
remain calm and swim or paddle to the side away
from the jetty and the surf will push you back
towards shore. Do not hesitate to call for assistance.
Figure 6. South Padre Island Spadre.com (http://www.spadre.com/) website specific warning
about safety around the jetty including the presence of strong rip currents.
Aransas area between the pier and the jetty (see analysis of questionnaire answers). This risk is
also highlighted on the South Padre island website spadre.com
(http://www.spadre.com/watersafety.htm): “Longshore Currents are simply the current that
moves along the beach, usually in the direction that the wind is blowing or the waves are
breaking. You will notice the longshore current as you enter the water, causing you to drift along
the beach. These currents can run as fast as 3mph. Not a hazard for swimmers, unless there is a
north wind, the longshore current will sweep you towards the jetty where it will become a rip
current sucking out to sea”.
The dangers directly or indirectly created by strong long shore currents may be more serious in
South Texas than in other parts of the country because of the strong long shore winds. Corpus
Christi and Brownsville are among the windiest cities in the United States with annual average
wind speeds of 12 mph and 11 mph respectively [7]. The average wind speed on the coast is
even higher, particularly during the months of May and June when the attendance to the beaches
is high. Average monthly wind speeds in knots are illustrated in Figure 7 for Horace Coldwell
Pier at Port Aransas. Furthermore the predominant wind direction during the spring and summer
is southeasterly are mostly along shore creating the strong long shore currents. Alerting
swimmers to the potential danger associated with long shore currents and not just rip currents
will be one of the recommendations of this report.

FINAL DRAFT FOR REVIEW 9/6/2005 26 / 56
Figure 7. Average monthly wind speeds (knots) at Port Aransas Horace Coldwell Pier (graphic
from National Data Buoy Center PTAT2 station website)

FINAL DRAFT FOR REVIEW 9/6/2005 27 / 56
5. Assessment of Surf Conditions for the South Texas Coast
Ideal measurements to assess historical surf conditions would include wave climate and current
measurements in the surf zone at several locations. Unfortunately such measurements do not
exist except possibly for experiments very limited in time and therefore not relevant for this
study. It was therefore only possible to assess surf conditions indirectly. Ocean and atmospheric
variables influencing surf conditions and the onset and strength of rip currents were identified
previously from observations and literature review including wave climate, currents, winds,
water level range and tidal stage. The list of organizations maintaining relevant monitoring
stations is presented if section 5.1. Since tropical storms and hurricanes were identified as often
related to the presence of strong rip currents, a list of all the named storms that crossed the Gulf
of Mexico is presented in section 5.2 and appendix 7 for the study years, i.e. 1983-2005.
5.1 Availability of Atmospheric and Water Conditions for the South Texas Region
Three organizations have been maintaining platforms and/or buoys measuring several of these
Table 4. Monitoring stations selected for the study with data type and availability.
Station Title
Location Website Relevant
Parameters Measured
Data Availability
TCOON BHP
Bob Hall Pier
27° 34.9' N, 97° 13.0' W
http://lighthouse.tamucc.edu/overview/014
Water Levels, Winds & BP
1990 – Present (Water Levels)
1995 – Present (Winds)
DNR RTNS Offshore
Offshore from Port Aransas Ship Channel 27° 45.4' N, 96° 58.9' W
http://lighthouse.tamucc.edu/overview/100
Winds and Waves
Data available starting spring 2002 – Present (with gaps) (Winds, Currents, Waves)
TCOON SPICGS
South Padre Island Coast Guard Station
26° 4.4' N, 97° 10.0' W
http://lighthouse.tamucc.edu/overview/051
Water Levels, Winds & BP
1993 – Present (Water Levels)
1994 – Present (Winds)
NOS-PTISAB
Port Isabelle (South Laguna Madres)
26° 3.7' N, 97° 12.9' W
http://lighthouse.tamucc.edu/overview/018
Water Levels, Winds & BP
1990 – Present (Water Levels)
2000 – Present (Winds)
C-MAN PTAT2
Horace Caldwell Pier (Port Aransas)
27.83 N 97.05 W
http://www.ndbc.noaa.gov/station_page.php?station=PTAT2
Water Levels, Winds & BP
1984 – Present (Winds & BP)
2000 – Present (Water Levels)
NDBC 42020
Moored buoy 50 NM offshore of Corpus Christi
26.94 N 96.70 W
http://www.ndbc.noaa.gov/station_page.php?station=42020
Wind & Wave 1990 - Present (Wind) 1996 – Present (Wave)
TABS-J Moored buoy
26.19 N 97.05 W
http://resolute.gerg.tamu.edu/Tglo/J/
Currents and winds
FINAL DRAFT FOR REVIEW 9/6/2005 28 / 56
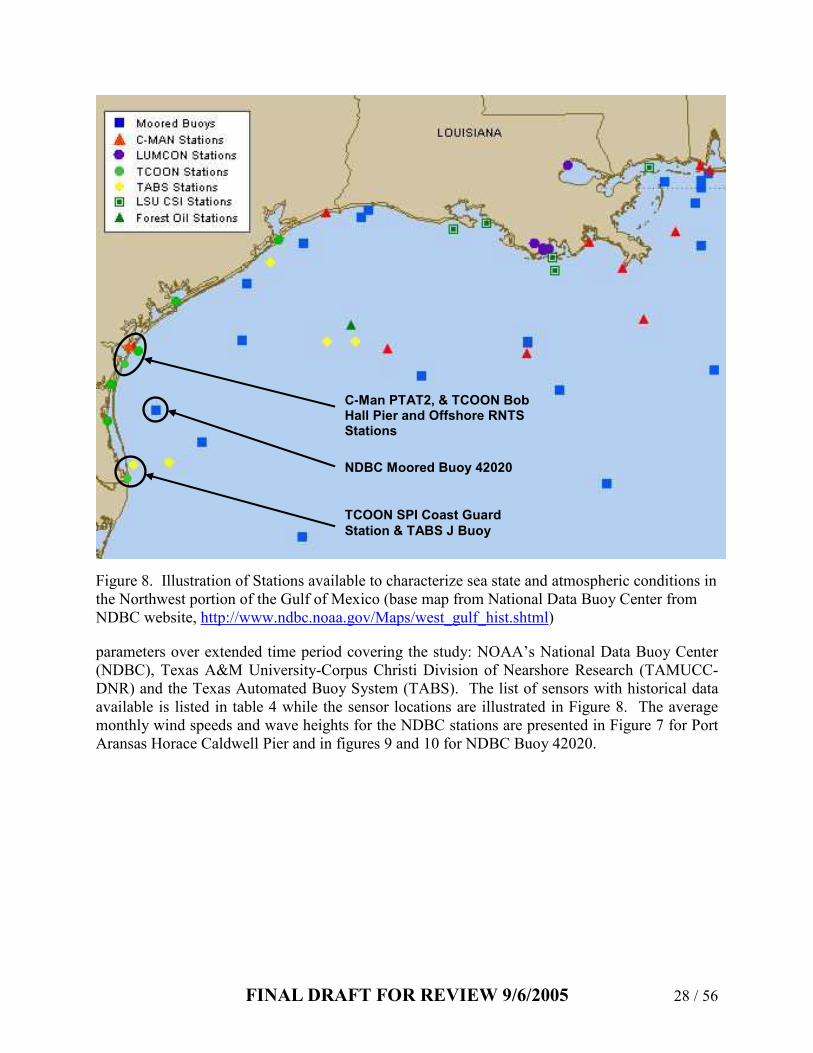
Figure 8. Illustration of Stations available to characterize sea state and atmospheric conditions in
the Northwest portion of the Gulf of Mexico (base map from National Data Buoy Center from
NDBC website, http://www.ndbc.noaa.gov/Maps/west_gulf_hist.shtml)
parameters over extended time period covering the study: NOAA’s National Data Buoy Center
(NDBC), Texas A&M University-Corpus Christi Division of Nearshore Research (TAMUCC-
DNR) and the Texas Automated Buoy System (TABS). The list of sensors with historical data
available is listed in table 4 while the sensor locations are illustrated in Figure 8. The average
monthly wind speeds and wave heights for the NDBC stations are presented in Figure 7 for Port
Aransas Horace Caldwell Pier and in figures 9 and 10 for NDBC Buoy 42020.
NDBC Moored Buoy 42020
TCOON SPI Coast Guard
Station & TABS J Buoy
C-Man PTAT2, & TCOON Bob Hall Pier and Offshore RNTS Stations

FINAL DRAFT FOR REVIEW 9/6/2005 29 / 56
Figure 9. Average monthly wind speeds (knots) at NDBC 42020 Buoy (graphic from National
Data Buoy Center 42020 station website)
Figure 10. Average monthly significant wave heights (meters) at NDBC 42020 Buoy (graphic
from National Data Buoy Center 42020 station website)

FINAL DRAFT FOR REVIEW 9/6/2005 30 / 56
5.2 Tropical Storms and Hurricanes Having Affected the Texas Coast (1983-2005):
A hurricane or a tropical storm does not need to land or pass in the vicinity of the Texas coast to
create considerable surf. 2005 Tropical storm Arlene was a relatively small storm moving
rapidly through the eastern portion of the Gulf of Mexico and landing on Friday June 10th in the
Florida Panhandle. The storm however created significant surf along the coasts of Texas as is
illustrated in the picture below taken on Sunday morning June 12th from the T-head of Bob Hall
Pier. That morning surfers could also be observed paddling along the south side of the pier to
reach the larger waves likely taking advantage of a rip current. The heavy surf made it difficult
to confirm visually the presence of a rip current although the texture and smaller size of the
waves as well as the seaward motion of the foam were all consistent with the presence of a rip
current. To account for the possible impact of tropical storms and hurricanes, a list of all such
storms passing through the Gulf of Mexico was made for the study period (1983-June 2005).
The list was compiled by studying the storm tracks archived by the National Weather Service
National Hurricane Center NHC/TPC Archive of Past Hurricane Seasons. The list is included in
appendix 7 and includes the life time of the storm as a named storm, the maximum category
reached by the storm, its date and location of landfall in the Gulf of Mexico and other types of
information such as maximum wind speed and other comments. The existence of a storm is
correlated in the next section with the drowning and near drowning incidents. The period of
storm influence on the Texas Beaches is difficult to estimate precisely. In the TS Arlene
example the Surf conditions were mainly affected during June 12th, 2 days after landfall and not
in the period prior or after landfall.
(a) (b)
Figure 11 (a) Track of June 2005 Tropical Strom Arlene with landfall on Friday June 10th in the
Florida Panhandle [Weather.com 2005] (b) picture of the surf from Bob Hall Pier the morning of
Sunday June 12th.

6. Specific Cases of Drowning and Near-Drowning Events
This portion of the study links atmospheric and water conditions with two rip current cases
identified during the rip current survey (see section 5) and 3 cases of drowning and near
drowning reported by the local press as being possibly linked with rip currents for the Coastal
Bend as well as one recent case of a number of swimmers saved by surfers from a strong rip
current at South Padre Island’s Isla Blanca park.
(i) Observed Strong Rip Current at Port Aransas on November 27, 2004: This rip current was
identified with the specific date as part of the rip current survey by a very experienced surfer.
His description of the event was the following: “This was one of the strongest rip currents that I have ever experienced in the 42 years that I have been surfing. The whole area between the Port A. Pier and the South Jetty in Port A. had a very strong rip pulling straight out from the beach. I believe that it is what many Texan locals call an Undertow. Sitting on a surfboard it was almost impossible to sit in one area without being pulled out to sea. Another surfer and myself had to rescue two young and inexperienced
surfers who were being swept out to sea by the strong rip.” The current was associated with a Strong
west to Northwest wind almost straight offshore after a north frontal passage and shoulder high
surf. The strength of this rip current was identified as a danger to all swimmers. Figure 12
confirms this statement and also shows a particularly large water level range of 0.8 m and a
receding tide besides the strong winds around 25 mph and the large waves at 3 m in the early
morning at NSBC Buoy 42020.
(ii) Observed Strong Rip Current at Mustang Island Fish Pass Jetties on November 20 & 21,
2004: This rip current was identified as well in the rip current survey with the specific date by an
experienced surfer. The rip current was observed Fish Pass, Noth side of north Jetty and
described as “a moderate rip moving from South to North but very consistent for two days”. The current
was identified as strong enough to place in danger all but the strongest swimmers. It was
associated with a strong south wind blowing prior to a north frontal passage and chest to head
high surf. The conditions are illustrated as well in Figure 12. The large waves could have been a
factor in the onset of this rip event. The water level range is rather small for that event.
(iii) J.P Lubby Surf Park Drowning of June 9, 2001: This event was recorded by the Corpus
Christi Caller Times. The journal account of the incident was the following: “Offshore winds grow
stronger, so can the strength of an undertow, the frightening currents, which have been blamed in the drowning of a Driscoll Children's Hospital nurse on the undertow off the beach at J.P. Luby Surf Park. King, a trained lifeguard, wasn't stronger than the current. "I was under for at least five to ten seconds," said King, a Kingsville resident attending the sand sculpture competition that weekend. Conventional wisdom dictates that if a person is caught in an undertow, he should swim at an angle toward shore. Predicting when and where undertows, rip currents, and long shore currents will occur isn't easy. King said she could feel the current earlier that day in knee-deep water. When she briefly went under while rescuing Farias, she didn't panic. "I just swam until I found air," she said. An undertow is created when waves crash onto the shore and water below the surface rushes back out out to sea. If the winds are particularly high, the current heading offshore can be stronger and drag someone out more quickly. Most of the time, the undertow will catch a person before the wave crests and drag them under the surface,
said Kevin Haddox, head lifeguard on the county's Padre Island beaches.” The event’s associated
conditions are presented in Figure 14 and show winds around 19 mph, a wave height at NDBC
Buoy of about 1m and a receding tide with a water level range of about 0.5 m.

FINAL DRAFT FOR REVIEW 9/6/2005 32 / 56
Conditions During and Before November 20, 21 and 27 2005
Observed Rip Currents
-1
-0.5
0
0.5
1
1.5
0 24 48 72 96 120 144 168 192 216 240 264 288 312 336 360 384 408 432 456 480 504
Time [Hours since November 11 Midnight]
Water Level [m
]
0
5
10
15
20
25
30
35
40
45
50
Wind Speed [mph]
Water Level
Tidal Forecast
Wind Speed
Nov
10
November
27
Nov
15
Nov
20
Nov
25
Nov
30
November
20 & 21
Conditions at NDBC 420020 Buoy During the November 20, 21, & 27
Observed Rip Currents
-0.5
0
0.5
1
1.5
2
2.5
3
3.5
4
4.5
0 24 48 72 96 120 144 168 192 216 240 264 288 312 336 360 384 408 432 456 480 504
Time [Hours since November 10 Midnight]
Significant Wave Height [m
]
0
5
10
15
20
25
30
35
40
45
50
Wind Speed [mph]
Significant Wave Height
Wind Speed
Nov
10
November
27
Nov
15
Nov
20
Nov
25
Nov
30
November
20 & 21
Figure 12 (a) and (b). Conditions at nearby Bob Hall Pier (a) and NDBC 42020 Buoy before and
during the November 20-21 rip current event and the November 27 rip current event.

FINAL DRAFT FOR REVIEW 9/6/2005 33 / 56
(iv) Bob Hall Pier Incident of May 31,2003: This near drowning incident was reported by the
Corpus Christi Caller Times as well. The account was the following: “Lifeguards in Padre Island say the water was rough out in the gulf because of Tropical Storm Grace and that may be a reason a man nearly drowned on Saturday. The near drowning happened just south of Bob Hall Pier a little after one o'clock. "To me, after talking to him, it seemed like there was probably alcohol involved, seemed like he had alcohol in his system, he probably doesn't know how long he's been out there," said Henry Sepulveda," C.C.P.D. senior officer. The officer added that the rescuing surfers more than likely saved the man’s life. Life guards recommend you help protect yourself by not swimming alone and not drinking
too much alcohol.” Figure 15 shows medium waves (1 m) and winds (15 mph) with a receding
tide and a water level range just above 0.5 m.
(v) Port Aransas Drowning of May 31, 2004, 6:15pm: This incident was recorded by the local
TV station KRISTV and recorded on their website [transcript from KRISTV.com, June 2, 2004]: “On Monday night May 31, 2004 around 6:15 PM a 42-year old man from Victoria, TX, was swimming with his girlfriend when he suddenly disappeared. He was barely alive when he was pulled ashore, and died a short time later. The incident happened between the Port Aransas Horace Caldwell Pier and the Jetties, just north of Avenue G in Port Aransas. The incident happened after the lifeguards had gone home for the day. As part of the incident report Police said that alcohol could have been a factor. Statement from Bob Parke of Port Aransas EMS as part of report on a drowning that took place in Port Aransas on May 31, 2004: "being out along, being out too far, not a real strong swimmer, the use of
alcohol, and too much sun down on the beach can complicate matters" says Parke.” The conditions
during the incident presented in Figure 16 show large waves and a receding tide.
(vi) South Padre Island Incident of June 5, 2005: This incident was reported on the website
“South Padre Island Texas Live Surf Cam, Beach & Surf Report” at
(http://www.spadre.com/surfcam.htm): “Congrats to Frank and several other surfers who rescued nearly a dozen kids yesterday at Isla Blanca, several were heard screaming for their lives. The rip currents were strong in the afternoon with the big surf and outgoing tide. Isla Blanca is the most popular swimming area on the Island and has thousands of swimmers (and probably most are non-swimmers) each weekend, and if it weren't for the surfers there would be a tragic amount of drownings, yesterday included. You may or may not know that there are no lifeguards anywhere on South Padre Island, but also there is no swimmer rescue unit with EMS if you call 911. As a parent of 2 small children that really concerns me. We are asking for your ideas, suggestions, input to take to the City and County. The big reasons there are no lifeguards is funding (?) and liability (?). Lifeguards save lives, period.
Thanks for your response.” An aerial photograph of Isla Blanca park from the same website is
presented in Figure 13 while the conditions during the incident are illustrated in Figure 17. Note
the receding tide and the large water level range.
Figure 13. Photo of the southern portion of South
Padre Island with the Isla Blanca Park and the South
Padre Island Jetties. Aerial Photography from the
http://www.spadre.com/images/parkarial.jpg

FINAL DRAFT FOR REVIEW 9/6/2005 34 / 56
Conditions During and Before June 9th 2001 Incident
-1
-0.8
-0.6
-0.4
-0.2
0
0.2
0.4
0.6
0.8
1
0 12 24 36 48 60 72 84 96 108 120 132 144 156 168 180 192 204 216 228 240
Time [Hours since June 1 Midnight]
Water Level [m
]
0
5
10
15
20
25
30
35
40
45
50
Wind Speed [mph]
Water Level
Tidal Forecast
Wind Speed
June 1
June
9
June 3 June 5 June 7 June 9
Conditions at NDBC 420020 Buoy During and Before the June 9th
2001 Incident
-0.5
0
0.5
1
1.5
2
2.5
3
0 12 24 36 48 60 72 84 96 108 120 132 144 156 168 180 192 204 216 228 240
Time [Hours since June 1 Midnight]
Significant Wave Height [m
]
0
5
10
15
20
25
30
35
40
45
50
Wind Speed [mph]
Significant Wave Height
Wind Speed
June 1
June
9
June 3 June 5 June 7 June 9
Figure 14 (a) and (b). Conditions at Bob Hall Pier (a) and NDBC 42020 Buoy before and during
the June 9th 2001 incident.

FINAL DRAFT FOR REVIEW 9/6/2005 35 / 56
Conditions at Bob Hall Pier During and Before May 31 2003 Incident
-1
-0.8
-0.6
-0.4
-0.2
0
0.2
0.4
0.6
0.8
1
0 12 24 36 48 60 72 84 96 108 120 132 144 156 168 180 192 204 216
Time [Hours since May 24 Midnight]
Water Level [m
]
0
5
10
15
20
25
30
35
40
45
50
55
60
65
Wind Speed [mph]
Water Level
Tidal Forecast
Wind Speed
May 24 May 26 May 28 May 30 June 1
May 31, shortly after 1:00
PM Incident
Conditions at NDBC 420020 Buoy Before and During May 31, 2003
Incident
-0.50
0.00
0.50
1.00
1.50
2.00
0 12 24 36 48 60 72 84 96 108 120 132 144 156 168 180 192 204 216
Time [Hours since May 24 Midnight]
Significant Wave Height [m
]
0
5
10
15
20
25
30
35
40
45
50
Wind Speed [mph]
Significant Wave Height
Wind Speed
May 24
May 31, shortly after 1:00
PM Incident
May 26 May 28 May 30 June 1
Figure 15 (a) and (b). Conditions at Bob Hall Pier (a) and NDBC 42020 Buoy before and during
the May 31st 2003 incident.

FINAL DRAFT FOR REVIEW 9/6/2005 36 / 56
Conditions at Bob Hall Pier During and Before May 31 2004 Incident
-1
-0.8
-0.6
-0.4
-0.2
0
0.2
0.4
0.6
0.8
1
0 12 24 36 48 60 72 84 96 108 120 132 144 156 168 180 192 204 216
Time [Hours since May 24 Midnight]
Water Level [m
]
0
5
10
15
20
25
30
35
40
45
50
55
60
65
Wind Speed [mph]
Water Level
Tidal Forecast
Wind Speed
May 24 May 26 May 28 May 30 June 1
May 31, 6:15 PM Incident
Conditions at NDBC 420020 Buoy Before and During May 31, 2004
Incident
-0.5
0.0
0.5
1.0
1.5
2.0
2.5
3.0
3.5
0 12 24 36 48 60 72 84 96 108 120 132 144 156 168 180 192 204 216
Time [Hours since May 24 Midnight]
Significant Wave Height [m
]
0
5
10
15
20
25
30
35
40
45
50
Wind Speed [mph]
Significant Wave Height
Wind Speed
May 24
May 31, 6:15 PM Incident
May 26 May 28 May 30 June 1
Figure 16 (a) and (b). Conditions at Bob Hall Pier (a) and NDBC 42020 Buoy before and during
the May 31st 2004 incident.

FINAL DRAFT FOR REVIEW 9/6/2005 37 / 56
Conditions During and Before June 5, 2005 Incident
at DNR-TCOON SPI Coast Guard Station
-0.5
-0.3
-0.1
0.1
0.3
0.5
0.7
0 24 48 72 96 120 144 168 192
Time [Hours since May 30 Midnight]
Water Level [m
]
0.00
5.00
10.00
15.00
20.00
25.00
30.00
35.00
40.00
45.00
50.00
Wind Speed [mph]
Water Level
Tidal Forecast
Wind Speed
June 5May 30 June 1 June 3
Afternoon of June 5
Conditions During and Before June 5, 2005 Incident
at DNR-TCOON RTNS Platform
-0.50 m
-0.30 m
-0.10 m
0.10 m
0.30 m
0.50 m
0.70 m
0.90 m
1.10 m
1.30 m
0 24 48 72 96 120 144 168 192
Time [Hours since May 30 Midnight]
Significant Wave Height [m
]
0.0 mph
5.0 mph
10.0 mph
15.0 mph
20.0 mph
25.0 mph
30.0 mph
35.0 mph
40.0 mph
45.0 mph
50.0 mph
Wind Speed [mph]
Significant Wave Height
Wind Speed
June 5May 30 June 1 June 3
Afternoon of June 5
Figure 17 (a) and (b). Conditions at the DNR South Padre Island Coast Guard station (a) and at
the DNR RTNS platform before and during the June 5th 2005 incident.

FINAL DRAFT FOR REVIEW 9/6/2005 38 / 56
Finally it should be reminded that the danger related to surf conditions is relative to the
experience of the swimmers/surfers. One of the largest surf conditions in surfers’ memory
occurred during the passage in the Gulf of Mexico of Hurricane Ivan. As illustrated in Figure 18
large numbers of surfers took advantage of the surf yet to our knowledge no fatalities occurred.
The atmospheric and oceanic conditions during the passage of Hurricane Ivan are illustrated in
Figure 19 which can be used as a benchmark for large events. Note the receding tides and the
large water level ranges during the early mornings of September 18 and 19 which should have
been conducive to rip currents. The very large waves of September 15 and 16 were obviously
conductive to rip currents as well.
Figure 18 a & b: Surfers at Bob Hall Pier, near Corpus Christi, Texas on September 16, 2004
enjoying the surf created by the passage of Hurricane Ivan in the Gulf of Mexico.
(vii) Conditions Conducive to Rip Currents: A comparison of the conditions during the 6
incidents yields that wave heights were all at or above 1 meter, and that wind speeds at the sites
were all in the 10 mph to 20 mph range. As was presented in section 5 these are average
conditions and could not be used by themselves as a significant discriminator. Wave heights and
wind speeds will still be kept as possible indicators for the larger case studies tackled in section
7. Of special interest is that 5 of the 6 incidents took place during a receding tide with 4 out of 6
incidents taking place on a day with a substantial water level range for the region i.e. 0.5 m or
larger. Although the number of events is too small to draw any conclusions the water level range
and the tidal stage will be added as potential discriminating factors in the broader study of
section 7. If confirmed by a more extensive study such dependence would not be surprising as
Sonu [8] and Brander and Short [9] previously observed that rip current velocities intensify
during low tides. They stated as a possible cause the combined effects of a smaller cross-
sectional area for the rip current channel and more net water being pumped over the bar by wave
transport.

FINAL DRAFT FOR REVIEW 9/6/2005 39 / 56
Conditions at Bob Hall Pier During te September 2004 Passage of
Hurricane Ivan
-0.8
-0.6
-0.4
-0.2
0
0.2
0.4
0.6
0.8
1
0 24 48 72 96 120 144 168 192 216 240 264 288 312 336 360
Time [Hours since September 5 Midnight]
Water Level [m
]
0
5
10
15
20
25
30
35
40
45
50
55
60
65
Wind Speed [mph]
Water Level
Tidal Forecast
Wind Speed
Sept
5
Sept
7
Sept
9
Sept
11
Sept
13
Sept
15
Sept
17
Sept
19
Conditions at NDBC 420020 Buoy During the September 2004
Passage of Hurricane Ivan
-2.0
-1.0
0.0
1.0
2.0
3.0
4.0
5.0
6.0
0 24 48 72 96 120 144 168 192 216 240 264 288 312 336 360
Time [Hours since September 5 Midnight]
Significant Wave Height [m
]
0
5
10
15
20
25
30
35
40
45
50
Wind Speed [mph]
Significant Wave Height
Wind Speed
Sept
5
Sept
7
Sept
9
Sept
11
Sept
13
Sept
15
Sept
17
Sept
19
Figure 19 (a) and (b). Conditions at Bob Hall Pier (a) and NDBC 42020 Buoy before and during
the September 2004 passage of hurricane Ivan.

FINAL DRAFT FOR REVIEW 9/6/2005 40 / 56
7. Drowning and Near-Drowning Events
Gathering data on drowning and near drowning events proved a more difficult task. Appendix 8
lists the agencies contacted to obtain such records. Individuals in local agencies proved most
helpful and provided critical data for this study. The data sets obtained are a 1983-2001 record
provided by the Nueces County Beach Services Division [1] and a 2000-2004 record provided by
the Cameron County Park Ranger Division [10].
7.1 Nueces County Beach Services division data set
From 1983 to 2001, with a gap between 1996 and 2000, the Nueces County Beach Service
recorded 126 drownings and 44 near drownings for a total of 166 incidents. Of the 150 victims
whose sex was identified 93 were male and 57 female. Among the victims for whom race was
identified 100 victims were white, 41 hispanic and 3 black. The monthly yearly and monthly
breakdowns are presented in Figure 20. The graphs highlight very high drowning numbers in
1984 and 1985. However the raw reporting figures show on several occasions same-day
drownings with identical or very similar victim profiles (race, age, sex, location of drowning).
By assuming that such listings are due to multiple reporting of the same event, the number of
incidents can be reduced from 166 to 140 with 103 drownings and 37 near drownings. Of the 26
identified likely duplicates, 11 are in 1984 and 5 in 1985 reducing somewhat the number of
incidents for these peak years. Also a large number of incidents, 20, were reported for one day,
August 19 1984. The 20 incidents took place between 13:06 and 14:15 and included 10
drowning and 10 near drownings. Of these reports, 2 appear to be duplicates (same age, race,
location, time of incident) and two other reported incidents have no additional information and
could be duplicates as well. The other 16 reports have all distinguishing features. Other reports
are questionable such as the reporting from June 16th to July 5
th on four different days of the
drowning of a 2 year old white female but given the different dates of the incidents such
incidents were kept in the listing.
If these likely duplicates were removed none of the categories would be disproportionably
impacted. Given that this removal would not affect significantly the analysis, these events are
kept although the likely duplicates are identified in the complete event listing presented in
Appendix 9. The reader should still keep in mind that the total number of victims is likely 15%
or more lower than the reported figures. Also the reader should keep in mind that the total
number of incidents is somewhat secondary for this study as its main focus is exploring a
possible link between the incidents and the surf and atmospheric conditions.
When looking at the unmodified listing of events, the age breakdown of the victims is presented
in Figure 20. The two largest groups are children under 12 and the 18-30 years old groups. The
children’s group should unfortunately not be surprising as it includes toddlers not in swimming
age yet and even when they know how to swim they are they are the least experienced groups.
The 18-30 age group is a little more surprising as this group should include the strongest
swimmers. For the 56 members of this group, 38 were males and 18 females. The fact that 18-
30 year old males are disproportionably the victims of drowning and near drowning incidents
will be kept in mind for the overall analysis of this data set. The analysis of the age breakdown
of the victims should be further analyzed in light of beach attendance statistics however the
author has not been able to find such data set at the time of the report. The seasonality of the

FINAL DRAFT FOR REVIEW 9/6/2005 41 / 56
incidents is presented in figure 20. Most of the incidents take place from May to August which
is not surprising as these months are the vacation months, the warmest months and overall the
time of the year associated with a trip to the breach.
Nueces County Yearly Distribution
of Incidents
0
10
20
30
40
50
60
1983
1985
1987
1989
1991
1993
1995
1997
1999
2001
Number of Incidents
Nueces County Monthly Distribution of
Drownings and Near Drownings (1984-
2001)
0
10
20
30
40
50
Apr May Jun Jul Aug Sep
Number of Incidents
Age Distribution of Victims for
Nueces County Incidents
0
10
20
30
40
50
60
<12 13-17 18-30 31-50 >50
Age
Number of Incident
Figure 20. Graphical illustration of statistical information from the Nueces County data set.
The surf and atmospheric conditions were assessed through data from the Horace Caldwell Pier
Port Aransas C-Man station for winds and barometric pressure and starting March 8, 1994, the
NDBC Buoy 42020 for wave height and wind starting May 24th, 1990, and the Bob Hall Pier,
DNR-TCOON station for wind, atmospheric pressure and tidal forecasts starting August 1990.
As the reported events were all took place during the months of April to September the other
months (October to March) were not included. Also no incidents were recorded from 1996
through 2000. The monthly average significant wave height distribution from 1990 to 2001 was
shown previously in figure 10. There are no substantial differences in the average significant
wave height distribution when excluding years 1996 though 2000. The average wave height for
the full years (excluding 1996-2000) is 1.33 m while the average significant wave height for the
study months is 1.12 m.
The average monthly wind speed distribution at Horace Caldwell Pier was presented in section 5.
Similarly to the average significant wave height, the average 24 hour change in barometric
pressure, the 24 hour change in absolute barometric pressure, the average wind speed and the
average wind speed during the day are all computed for the years of the study and the months of

FINAL DRAFT FOR REVIEW 9/6/2005 42 / 56
April to September. A comparison between the overall average conditions and the average
conditions during incidents is presented in Table 5.
Table 5. Comparison of average atmospheric conditions and wave climate with conditions during
the incidents. When multiple drowning or near drowning took place at a given time, only one
incident was accounted for the averaging of the conditions. The full table is presented in
Appendix 9.
Coastal Parameters Averages for Incidents
Overall Averages for
Study Years (April to
September)
Average Significant Wave Height at
NDBC 42020 Buoy (starting May
1990)
1.30 m +/- 0.68 m 1.13 m +/- 0.54 m
24 hour barometric pressure
difference at PTAT2 (starting March
1984)
0.0 mb +/- 2.1 mb 0.0 mb +/- 2.7 mb
24 hour absolute barometric pressure
difference PTAT2 (starting March
1984)
1.6 mb +/- 1.5 mb 1.9 mb +/- 1.9 mb
Wind Speed during day of incident
(12 hours) at PTAT2 (starting March
1984)
15.9 mph +/- 5.7 mph 14.8 mph +/- 5.6 mph
Wind Speed during 24 hours
preceding incident at PTAT2 (starting
March 1984)
14.2 mph +/- 4.4 mph 14.1 mph +/- 5.5 mph
Water level difference at time of
incident at BHP (starting Aug 1990) 0.06 m +/- 0.25 m 0.02 m +/- 0.35 m
Absolute water level difference at
time of incident at BHP (starting Aug
1990)
0.15 m +/- 0.20 m 0.08 m +/- 0.30 m
Water level range (starting Aug 1990) 0.53 m +/- 0.17 m 0.49 m +/- 0.17 m
Although a few of the parameters are a little higher during the incidents such as average wind
speed, water level difference and wave height, these differences are small compared to the
variability of the data set. Overall the average conditions during incidents appear very similar to
the overall average conditions for the same time period.

FINAL DRAFT FOR REVIEW 9/6/2005 43 / 56
7.2 Cameron data set i.e. Record of Swimmers in distress, drownings and near-drownings for
South Padre Island:
Information regarding South Padre Island beaches was obtained from the Cameron County Park
Ranger Division (the author gratefully appreciates the time spent gathering the data). The data
was compiled by going over the emergency calls received by the Cameron County Park Ranger
Division isolating calls for Swimmers in distress, near drownings, and drownings. A total of
were 76 incidents were identified between April 2001 and September 2004. Of the total 76 calls,
67 were for swimmers in distress, 4 were for near drownings, 4 for actual drownings and an
additional call was related to a possible drowning. The yearly and monthly breakdowns are
presented in figure 21. It was not possible to obtain further information on the age and other
such information associated with the victims.
Incidents Yearly Breakdown
for Cameron County
0
10
20
30
40
50
2001 2002 2003 2004
Number of Incidents
Incidents Monthly Breakdown
for Cameron County (2001-2004)
024681012141618
January
February
March
April
May
June
July
August
September
October
November
December
Number of Incidents
Figure 21. Graphical illustration of statistical information from the Cameron County data set.
The majority of the incidents took place in Isla Blanca Park (55) and near Beach Access Road 5
(17). Other locations where incidents were reported are Beach Access Road 2 (1) and 6 (1), next
to the Jetties (1) and ½ mile north of Beach Access Road 5. The locations of the incidents are
not surprising as Isla Blanca Park and Beach Access Road 5 are popular locations. Additional
information was provided through an open records request made on February 28, 2005. The
information was faxed on March 1, 2005. From 1994 to February 2005 there were six reported
drownings and 16 reported possible drownings along the Gulf of Mexico within the South Padre
Island Police Departments jurisdiction.
A comparison between average conditions and conditions during the events is presented in Table
6. The average wave height and standard deviation during the events were 1.34 m +/- 0.61 m.
The overall average wave height and standard deviation for the 2001-2004 period were 1.32 m
+/- 0.65 m. The 24 hour barometric pressure difference and absolute barometric pressure
differences with standard deviations were -0.1 mb +/- 3.0 mb and 2.1 mb +/- 2.2 mb for the
incidents. For the overall 4 year data set the 24 hour barometric pressure difference and absolute
barometric pressure differences with standard deviations were 0.0 mb +/- 4.1 mb and 2.9 mb +/-
2.9 mb. To identify the presence of outliers, the data for both wave height and pressure
differences were also plotted in histogram format in figure 22.

FINAL DRAFT FOR REVIEW 9/6/2005 44 / 56
Table 6. Comparison of overall conditions and average conditions during incidents.
Coastal Parameters During Incidents For Overall Data set
4 years (2001-2004)
Average Significant Wave
Height at NDBC 42020 Buoy 1.34 m +/- 0.61 m 1.32 m +/- 0.65 m
24 hour barometric pressure
difference at SPICG -0.1 mb +/- 3.0 mb 0.0 mb +/- 4.1 mb
24 hour absolute barometric
pressure difference SPICG 2.1 mb +/- 2.2 mb 2.9 mb +/- 2.9 mb
Wind Speed during day of
incident (12 hours) at SPICG 11.5 mph +/- 5.1 mph 11.4 mph +/- 5.5 mph
Wind Speed during 24 hours
preceding incident at SPICG 10.8 mph +/- 4.5 mph 10.4 mph +/- 5.0 mph
Water level difference at time
of incident at SPICG 0.075 m +/- 0.101 m 0.017 m +/- 0.133 m
Absolute water level
difference at time of incident
at SPICG
0.100 m +/- 0.076 m 0.102 m +/- 0.087 m
Water level range 0.42 m +/- 0.16 m 0.41 m +/- 0.16 m
A possible correlation with GOM presence of tropical storms and hurricanes was also
considered. 6 cases of swimmers in distress out of 67 correlated with a tropical storm or a
hurricane in the GOM. Cases in August 4th and August 5
th 2001 took place when Tropical Storm
Barry was in the GOM (Aug 2-7), the September 2nd 2002 case correlated with Tropical Storm
Edouard (Sept 1-6), September 15 2002 correlated with Tropical Storms Hanna and Isidore,
August 15, 2004 with Hurricane Charley and September 15, 2004 with Hurricane Ivan. There
were no recorded drowning or near drowning cases associated with the presence of a tropical
storms or hurricanes only swimmer in distress calls. While about 10% of the incidents took place
when a tropical storm or a hurricane was in the Gulf of Mexico several of these incidents might
not have been significantly affected by the storms as they were relatively far from the Texas
Coast and wave heights for most of these cases were below average. While leading to dangerous
surf conditions overall the presence of large storms in the Gulf of Mexico is not believed to be a
significant factor in the number of incidents likely because the beach going population already
avoids swimming in such conditions.

FINAL DRAFT FOR REVIEW 9/6/2005 45 / 56
NDBC 42020 Wave Height
Distribution for Incidents
0
5
10
15
20
0.00
0.50
1.00
1.50
2.00
2.50
3.00
3.75
4.25
4.75
Wave Height [m]
Number of
Incidents
SPI Coast Guard Water Level
Difference
0
5
10
15
20
-0.30
-0.20
-0.10
0.00
0.10
0.20
0.30
0.40
0.50
0.60
Water Level Difference [m]
Number of
Incidents
(a) (b)
SPI Coast Guard Average Wind
Speed During Incident Day
0
5
10
15
20
0 4 8 12 16 20 24 28
Average Wind Speed (12hrs) [mph]
Number of
Incidents
SPI Coast Guard 24 Hour
Atmospheric Pressure Difference
051015202530
-16.00
-12.00
-8.00
-4.000.00
4.00
8.00
12.00
16.00
24 Hour Atmospheric Pressure
Difference [mb]
Number of
Incidents
(c) (d)
Figure 22 (a) to (d). Distributions of the South Padre Island Incidents by Wave Height (a),
Water Level Difference (b), Average Wind Speed (c) and 24-hour atmospheric pressure
difference (d).
Finally the water level range during the incidents was computed by subtracting the maximum
and minimum water levels during the 24 hour period surrounding the incidents. An average
water level range distribution for the full study period (2001-2004) was created by computing the
24 hour water level range every 11 hours. Water level ranges were used instead of the tidal
range distribution as all along the coast of Texas tide tables do not meet the NOS requirement
that a water level prediction model lead to a Central Frequency of 15 cm of at least 90%. The
average water level distribution was also scaled before being compared to the incident
distribution. A comparison between the two distributions presented in figure x shows that the
incident distribution is somewhat skewed towards days with higher water level ranges. If the
incidents had followed the yearly distribution, 6 less incidents would have taken place for daily
water level ranges of 0.45 m and above. While this is likely not statistically significant, 25 of the
32 incidents taking place when the water level range was over 0.45 m took place when the tide
was receding. For incidents taking during days with water level ranges smaller than 0.45 m only
17 out of 39 incidents took place when the tide was receding. The timing within the water level

FINAL DRAFT FOR REVIEW 9/6/2005 46 / 56
cycle was estimated visually. Note that only one of the 4 recorded drownings took place during
a receding tide while 3 out 4 near drowning incidents took place as the tide was going out.
0.00
0.05
0.10
0.15
0.20
0.25
0.30
0.35
0.40
0.45
0.50
0.55
0.60
0.65
0.70
0.75
0.80
0.85
0
2
4
6
8
10
12
14
Frequency of Water Level Ranges
Water Level Range [m]
SPICG 24 Hour Water Level Range Distribution for Incidents
Compared with Average Water Level Range Distribution for 2001-
2004
Water Level RangeDistribution for Incidents
Scaled Average WaterLevel Range Distribution
Figure 23. Distribution of the South Padre Island Incidents by water level range the day of the
incident as compared to a scaled distribution for the study period. The red oval emphasizes a the
larger proportion of events associated with a tidal rage of 0.45 m and above as compared to the
scaled water level range distribution.

FINAL DRAFT FOR REVIEW 9/6/2005 47 / 56
8. Possible Correlation between Drowning and Near-Drowning Events and
Surf Conditions
Given that this topic is the primary goal of the study this issue is addressed below individually.
Most of the information has already been presented in section 7 and this section reinforces the
studies finding by compiling the relevant information presented in section 7 and gathered during
the study. The main tool to study this possible correlation is the comparison of average
conditions during incidents with the overall average conditions during the same period. Direct
measurements from the surf zone would be more accurate however they do not exist. Never the
less rip currents and dangerous surf zone conditions are usually closely correlated with offshore
wave climate, high winds, large water level ranges, and storm and frontal passages. All these
conditions are captured by the measurements selected for this study and should correlate well
with surf zone conditions. For Nueces County, the overall comparison is displayed in Table 5 of
the previous section. The comparison yields the following results for some of the main variables
(averages during incidents vs. general averages): Average Significant Wave Height at NDBC
42020 Buoy (1.30 +/- 0.68 m vs. 1.13 +/- 0.54 m), 24-hr barometric pressure absolute difference
(1.6 +/- 1.5 mb vs. 1.9 +/- 1.9 mb), average wind speed during the day (12 hrs) (15.9 +/- 5.7 mph
vs. 14.8 +/- 5.6 mph), average wind speed during the past 24 hrs (14.2 +/- 4.4 mph vs. 14.1 +/-
5.5 mph) and water level range (0.53 +/- 0.17 m vs. 0.49 m +/- 0.17 m). The results for the
Cameron County data set are presented in Table 6 of the previous section and are the following
for the same variables: Average Significant Wave Height at NDBC 42020 Buoy (1.34 +/- 0.61
m vs. 1.32 +/- 0.65 m), 24-hr barometric pressure absolute difference (2.1 +/- 2.2 mb vs. 2.9 +/-
2.9 mb), average wind speed during the day (12 hrs) (11.5 +/- 5.1 mph vs. 11.4 +/- 5.5 mph),
average wind speed during the past 24 hrs (10.8 +/- 4.5 mph vs. 10.4 +/- 5.0 mph) and water
level range (0.42 +/- 0.16 m vs. 0.41 m +/- 0.16 m). Based on these comparisons the average
conditions at the time of the incidents are not significantly different than the general conditions.
This observation by no means indicates that rip currents or other surf zone events associated with
oceanic and atmospheric conditions are not a danger along the South Texas coast. Either strong
rip currents or other dangerous surf zone conditions develop during average South Texas surf
conditions or other factors are statistically more important than surf zone conditions for this
region. A potential surf zone hazard developing regularly along the South Texas coast is the
presence of strong along shore currents. The South Texas coast is one of the windiest locations
in the lower 48 states with the dominant South Easterly winds in the general direction of a low
lying coastline which is part of a series of barrier islands. These strong along shore currents
coupled with a fast changing bathymetry in the bar system could be an important factor for surf
zone incidents not identified by unusual atmospheric or oceanic conditions. Other factors could
be mostly independent of surf zone conditions such as alcoholic consumption. Other studies and
local life guards have mentioned alcohol as a likely important factor and this issue will be further
addressed in the next section. To further evaluate the importance of atmospheric and oceanic
conditions in surf zone incidents the data should be divided based on factors such as age of the
victims and conditions of accidents. This further analysis is beyond the scope of this study and
might be difficult given that such information is not available for the Cameron County data set
and would reduce the number of relevant cases for the Nueces County data set.
A correlation between recorded incidents and the presence of tropical storms and hurricanes in
the Gulf of Mexico was explored as well. For Nueces County 7 out of 166 incidents were

FINAL DRAFT FOR REVIEW 9/6/2005 48 / 56
correlated with the presence of a hurricane (4) or a tropical storm (3). For the 76 recorded
Cameron County 8 incidents took place while a tropical storm (6) or a hurricane (2) was in the
Gulf waters. The numbers are small for Nueces County and a little higher, about 10% for
Cameron County. Although incidents do take place during storms the author does not
recommend additional warnings as the public is already warned by the local National Weather
Service Offices, Television and radio stations. Also the incidents were correlated only with the
presence of the storms in the Gulf of Mexico but the South Texas coast was not necessarily
significantly affected. For example the wave height was above 1.5 m for only one of the 8
Cameron County incidents. While leading to dangerous surf conditions the presence of large
storms in the Gulf of Mexico does not appear to be a significant factor in the number of
incidents. This is likely in large part because the beach going population already avoids
swimming in such conditions.

FINAL DRAFT FOR REVIEW 9/6/2005 49 / 56
9. Conclusions and Recommendations
The conclusions and recommendations below are based on the analysis of two data sets reporting
drowning, near drowning and swimmer in distress in Nueces and Cameron County, the
associated atmospheric and water conditions at nearby platform and buoys, the responses to this
study’s rip current questionnaire, and other information collected for this study such as set of
drowning and near drowning accounts from the local press. As one of the recommendations will
specifically address additional and more consistent data sets collected across South Texas would
be desirable. The recommendations below will be worded as tentative for the cases when the
author feels that the data sets were too small to conclude more definitely.
(i) On the Occurrence of Rip Currents on South Texas Beaches:
Similarly to the rest of the countries’ beaches rip currents are frequently observed in South Texas
all along the coast. Rip currents were reported to be a virtual permanent presence near piers and
jetties. Most of the observed rip currents were deemed mild and not a threat to swimmers by the
study questionnaire respondents. Observations of strong rip currents were also reported and
were mostly but not exclusively linked to extreme events such as Tropical Storms, Hurricanes
and strong Frontal passages. Most of the reported strong rip currents were observed near
structures, piers, jetties, and the Corpus Christi Sea Wall. The presence of rip currents near
structures is not a surprised as wave diffraction and changes in bathymetry around the structures
are known to favor rip currents. While the number of observations is too small to state that most
dangerous rip currents take place near structures this information can be combined with beach
attendance to guide outreach and prevention efforts (see next recommendation). The regular
morphology of the South Texas Beaches along the barrier islands could also explain a
preponderance of strong rip currents near structures and other disruptions such as natural outlets.
A possible correlation was observed between incidents and receding tides during periods with
large water level ranges. The number of observations is too small to further comment on the
importance of this factor. However this factor is sometimes included in rip current index
computations and it is a recommendation of this report to be included in the development of local
rip current indexes.
(ii) Recommendations regarding outreach efforts for the prevention of rip current related
incidents:
In South Texas popular beach locations are in vast majority located near a structure: Port
Aransas Beach (includes Horace Caldwell Pier and delimited by the Corpus Christi Ship Channel
south jetty), Mustang Island State Park (includes the Fish Pass Jetties), the Corpus Christi Sea
Wall, Packery Channel, Padre Bally Park (includes Bob Hall Pier) and Isla Blanca Park
(delimited by the Brownsville Ship Channel North Jetty). Beach goers gather near these
structures because of easy and direct beach access, with asphalt roads and parking lots, and the
presence of facilities such as restrooms or shops at the pier entrances. This combination of
preferred beach attendance and occasional strong rip currents make these the best locations for
outreach efforts. NOAA informative placards (see appendix 4) could be placed on the roads at
the entrance of these parks and on either sides of the structures. Presently only signs stating that
no one should swim on either sides of the piers are posted. The NOAA Sea Grant postings on
either sides of structures would be a significant improvement. Additionally the “Break the Grip

FINAL DRAFT FOR REVIEW 9/6/2005 50 / 56
of the Rip” pamphlets could be made available at pier shops, park offices and the entrance
booths of the parks.
Since in South Texas a high risk of rip current incident is associated with the presence of a pier
or a jetty, one of the sections of the NOAA Sea Grant poster could be modified to graphically
show more clearly a pier or a jetty and a rip current along its side. Also the “Tell Tale Signs of
Rip Currents” or visual clues listed on the placard are usually not evident on South Texas
Beaches due to the rough surf and frequent high along shore winds and currents associated with
rip currents. The placard message could be adjusted to emphasize the occurrence of rip current
near structures and not include some of the visual clues that are not helpful in South Texas.
Structures such as piers and jetties can lead not only to straight seaward rip currents but also to
current loops such as between the south jetty and the pier of Port Aransas. Trained life guards
familiar with the location seem to be the best measure to minimize the risk of incidents in such
cases as well as for general beach safety. Not all the beaches in the study area have lifeguards
including all the beaches of South Padre Island and in particular Isla Blanca Park. This park is
one of the most popular beaches along the coast and is adjacent to the Brownsville Ship Channel
north jetty. The absence of life guards has been stated as due to a potential liability issue.
Helping the local authorities deal with the potential liability issues and establish a lifeguard
program during at least part of the year would improve beach safety on the beaches of South
Padre Island. Several websites addressing rip current awareness (i.e.
http://www.brevardcounty.us/fire_rescue/olg_swimsafe.cfm) advise beach goers to speak with
on-duty lifeguards about rip currents and all other water conditions expected for the day when
arriving at the beach. This could be also emphasized on a modified placard if lifeguards are
indeed present on most South beaches.
(iii) Possible link between Rip Currents and Drowning, Near Drowning and Swimmer in
Distress on South Texas Beaches:
While occasional strong and life threatening rip currents do take place along the South Texas
coast, the analysis of the compiled instances of swimmer in distress, drowning and near-
drowning incidents, fails to find a significant link between these incidents and unusual
atmospheric and surf conditions conducive to strong rip currents. In other words while rip
currents do take place and are dangerous they may not play a significant role in most swimmer in
distress, drowning and near-drowning incidents. Since strong rip current do take place and
several examples of related incidents including recent ones were quoted in this study the rip
current outreach message and prevention measures should continue to be improved and
increased. However to have a statistical impact on the number of incidents the overall beach
safety message should be broader and include not only rip current awareness but also other likely
factors quoted in this study and reemphasized as part of recommendation (v). Also the author
wishes that more data was available and more time could be spent on the analysis. The
conclusion that rip currents are unlikely to be a factor for the majority of incidents is somewhat
in contrast with many other locations (see USLA statistics at
http://www.usla.org/Statistics/public.asp for example) although USLA statistics record rescue
attempts by lifeguards and the present study focused on reports of incidents. To facilitate future
research efforts and improve upon this report conclusions it is recommended to better measure
and report the occurrence of rip currents and systematize and centralize the gathering of
swimmer in distress, drowning and near-drowning incident reports (see recommendation v).

FINAL DRAFT FOR REVIEW 9/6/2005 51 / 56
(iv) Recommendation for rip current monitoring and forecasting:
Two of the locations where rip currents are regularly observed are Horace Caldwell Pier and Bob
Hall Pier. Both piers are instrumented, Bob Hall Pier by a TCOON station and Horace Caldwell
Pier by a NDBC station. Winds and water levels as well as other atmospheric parameters are
already measured at both sites. It is recommended to consider adding equipment for the
monitoring and study of rip currents. This would allow for a detailed study of rip currents in
South Texas and the further development of rip current indexes taking into account the specific
conditions of the South Texas Beaches. The National Weather Service is already issuing Rip
Current Outlook products in several locations including Brownsville (South Padre Island)
(http://www.ripcurrents.noaa.gov/forecasts.shtml). The additional data and studies would help
the local National Weather Service Offices (Corpus Christi and Brownsville) in their evaluation
of surf conditions and issuance of their rip current outlook. The rip current index could be
broadcasted in real time on the web and at the entrance of the piers (atmospheric conditions as
measured by the TCOON station are already displayed in real time at the entrance of Bob Hall
Pier). Advance warning of likely rip currents could also be used to determine staffing levels for
lifeguards as well as the usual warnings to the beach going public.
The monitoring of the rip currents would however not be straightforward. Simple current meters
would no be appropriate as the exact location of the rip currents near the piers varies depending
on conditions. Solutions could include placing two Side Looking Acoustic Doppler Profilers
(SL-ADPs) at mid-depth on the outside pilings supporting the T-Head portions of the Piers. The
beams of the current profilers would be directed towards the beach to intercept rip currents
located near either side of the pier. NOAA PORTS has been using SL-ADPs for other
applications as part of its PORTS systems in San Diego, Alaska, and the Delaware Bay [11]. Of
more direct relevance to this application Smith and Largier [12] used a sector-scanning acoustic
Doppler sonar mounted on the end of Scripps pier. The instruments provided a continuous
estimate of radial velocities and were aimed toward the surf zone. The Doppler sonar
measurement volume was a wedge with an arc of 45º, a radius of 200 to 400 m. The
measurements resolution was 3-4 m resolution and averaged over 30 seconds. The acoustic
scatterers were most likely bubbles from the breaking processes, which limited the
measurements to the region outside the surf zone. Well-defined rip currents were observed from
the surfzone seaward.
Adding wave gauges would also be beneficial as the wave climate is one of the most important
factors in the development of a quantitative rip current index [6]. Wave gauges would also be
beneficial to surfers who frequently visit these locations. A proposal to install a wave gauge at
Bob Hall Pier was recently submitted by the Division of Nearshore Research [13] to the Texas
Coastal Management Program. The installation of such instrumentation at the location of the
TCOON Bob Hall Pier Station and/or NDBC Port Aransas station would provide cost-effectively
an important additional measurement for the monitoring and study of rip currents and ultimately
for the development of local rip current indexes and advisories. Alternatively or in addition but
likely at a higher cost instrumentation could also be mounted on the side of the jetties at Port
Aransas, Packery Channel, Port Mansfield. As there are no piers on the beaches of South Padre
Island such instrumentation would have to be mounted on the jetties of the ship channel.

FINAL DRAFT FOR REVIEW 9/6/2005 52 / 56
(v) Recommendations regarding prevention of Drowning, Near Drowning and Swimmer in
Distress Incidents:
As part of the study two other factors then rip currents were identified as likely causes for
drowning, near drowning and swimmer in distress incidents:
- The presence of strong along shore currents coupled with the South Texas Bar structure.
- The consumption of alcoholic beverages before swimming or walking in the surf.
The along shore currents are likely to be a factor in some of the drowning and near drowning
events in particular for the 51 out 153 recorded Nueces county incidents involving victims
younger then age 12. The consumption of alcoholic beverages before going in the surf, possibly
coupled with the alongshore currents and the bar structure is likely a factor for some of the 56
Nueces County incidents for the 18-30 year old age group. This later assumption is made based
on comments from lifeguards and the fact that although this group should be composed of the
strongest swimmers it is the group with largest numbers of victims. Outreach messages should
include being watchful for strong along shore currents and to not consume excessive alcoholic
beverages before entering the water (not just swimming). It is also recommended that more data
sets include information on drowning, near drowning and swimmer in distress incidents for the
coast of Texas be consolidated and analyzed to confirm these observations and possibly
complement them with other factors.
Given that rip currents are unlikely to be the cause for a majority of the surf fatalities in South
Texas, outreach messages should include these other possible causes and be composed to ensure
that the public does not get the impression that South Texas beaches are relatively safe to swim
when rip currents are not present. In the study’s author it would be beneficial to have a general
outreach message that regroups rip currents, with along shore currents, heavy surf and the
consumption of alcoholic beverages. This general information would be on top of the already
excellent specific information available for rip currents.
(vi) Recommendations regarding further studies of rip currents and Drowning, Near
Drowning and Swimmer in Distress on South Texas Beaches:
Some of the main results of the study are the confirmation of the existence of strong and
dangerous rip currents along South Texas beaches and the absence of a strong correlation
between atmospheric and oceanic conditions and surf zone incidents. While such findings are
not mutually exclusive further research could help determine the respective influence of surf
zone conditions, including rip currents and along shore currents, and other possible factors such
as alcoholic consumption. However to perform further research more information on the
victims, surf conditions and factors such as possible alcoholic consumptions need to be available.
The need and possible strategies to measure surf conditions has been addressed in the previous
recommendation. The information on the victim and the incidents conditions are at least as
important and are more a question of coordination than cost. A good portion of this information
is already being collected by the Nueces County Beach Services Division but to the author’s
knowledge most of this data is not collected for other beaches. Encouraging and coordinating
the collection of systematic and complete data sets for surf zone incidents would be essential for
more in-depth studies. The data for the full Texas coast could be regularly compiled by one of
the state or other agencies such as Sea Grant or the Texas Coastal Management program. Such
data would also allow separating incidents by cause and isolating the portion of the incidents

FINAL DRAFT FOR REVIEW 9/6/2005 53 / 56
linked to surf zone conditions. This would allow for better assessment of the importance of rip
currents and surf conditions and the development of better quantitative rip current indexes.
When coordinating the collection of this information a good starting point would the data
presently collected by the Nueces County Beach Services Division and/or the format
recommended by the United States Lifeguard Association. Information regarding alcohol
consumption, and the possible influence of the along shore current needs to be included in the
collected data.

FINAL DRAFT FOR REVIEW 9/6/2005 54 / 56
10. Acknowledgments
The support of Texas Sea Grant for this study is greatly acknowledged. The Corpus Christi
Weather Forecasting Office, the Nueces County Beach Services division, and the Cameron
County Park Ranger Division are gratefully acknowledged for their assistance in providing data
on surf incidents and valuable feedback for this study. Without their data and their willingness
to share it this study would not have been possible. Many thanks to a number of individuals who
have contributed to provide important information for the study such as answering the rip current
questionnaires and discussing the overall scope of the study. Thank you as well to Michael
Willingham, Sara Ussery and John Adams from the TAMUCC Division of Nearshore Research
whose help in finding information was invaluable.

FINAL DRAFT FOR REVIEW 9/6/2005 55 / 56
11. References
[1] “Drowning and Near Drowning Incident in Nueces County 1983-2001” Data obtained by
John Metz of the Corpus Christi Weather Forecast Office and Chris Lawrence from the
Nueces County Beach Services division, October 2003.
[2] “Rip Currents”, a pamphlet from the National Weather Service, Southern region
Headquarters, Fort Worth, Texas.
[3] NWS Wilmington, NC Office, Rip Currents Website, on the web at
http://www.erh.noaa.gov/ilm/beach/rip/index.shtml.
[4] United States Lifesafing Association Website, “Rip Current Glossary of Terms”,
http://www.usla.org/ripcurrents/glossary.asp.
[5] P.D. Kumar “Beach Processes and Sedimentation”, second edition, Prentice-Hall Inc.,
Upper Saddle River, New Jersey 07458, 1998.
[6] Jason Engle, James MacMahan, Robert J. Thieke, Daniel M Hanes and Robert G Dean
“Formulation of a Rip Current Predictive Index Using Rescue Data” Proc. National Conf.
on Beach Preservation Technology, FSBPA, Biloxi, MS, January 23-25, 2002.
[7] National Data Climatic Center “Climatic Wind Data for the United States” National
Climatic Data Center, 151 Patton Avenue, Room 120, Asheville, NC 28801-5001,
November 1998, on the web at:
http://nndc.noaa.gov/?http://ols.nndc.noaa.gov/plolstore/plsql/olstore.prodspecific?prodnu
m=C00518-PUB-A0001.
[8] C. J. Sonu, “Field observations of nearshore circulation and meandering currents” Journal
of Geophysical Research, Vol. 77, pp. 3232-3247, 1972.
[9] R.W. Brander, and A. D. Short., “Morphodynamics of a large-scale rip current system at
Muriwai Beach, New Zealand”, Marine Geology, vol. 165, pp. 27-39, 2000.
[10] “Records of Phone Calls to Cameron County Park Ranger Division Indicating Swimmer in
Distress, Drownings and Near Drownings, 2001-2004” Data synthesized by Lieutenant
Arnold Flores of the Cameron County Park Ranger Division specifically for this study.
[11] Sontek “SonTek/YSI Side-Looking Doppler Sonar Sold to U.S. Ocean Agency”,
SonTek/YSI press release, October 2002, http://www.sontek.com/news/2002/noaa-sl-
adp.htm.
[12] J. A. Smith and J. L. Largier, “Observations of Nearshore Circulation: Rip Currents”,
Journal Geophysical Research, vol. 100, pp. 10967-10975, 1995.
[13] J. Adams, “Wave Climate Monitoring at Bob Hall Pier”, proposal to the Texas General
Land Office Coastal Management Program, Funding Cycle #11, 2005.

FINAL DRAFT FOR REVIEW 9/6/2005 56 / 56
Other Useful References:
Sea Grant, University of Delaware “A Cumulative Bibliography of Rip Current Related
References”, on the web at http://www.ripcurrents.noaa.gov/resources/rip_references3-
04.pdf (document was difficult to download due to a graphic on the page)
D. Bowman, D. Arad, D. S. Rosen, E. Kit, R. Goldbery and A. Slavicz, “Flow characteristics
along the rip current system under low-energy conditions”, Marine Geology, Volume 82,
Issues 3-4, August 1988, Pages 149-167.
D. Bowman, D. S. Rosen, E. Kit, D. Arad and A. Slavicz “Flow characteristics at the rip current
neck under low energy conditions”, Marine Geology, Volume 79, Issues 1-2, February
1988, Pages 41-54.
J.E. Fletcher, R.A. Kaiser and R.J. Steele, “Perceptions of Beach Safety: A Comparison of Beach
Users and Managers”, Coastal Management, Vol. 17, pp. 349-359, 1989.
M.C. Haller, R.A. Dalrymple and I.A. Svendsen, “Experimental Modeling of a Rip Current
System”, Proceedings of the Third International Symposium on Ocean Wave Measurement
and Analysis, Virginia Beach, VA, Nov. 3-7 1997.
J.M. McCloy and J.A. Dodson, account of the April 16-18 conference “Guidelines for
Establishing Open-Water Recreational Beach Standards”, Center for Marine Training and
Safety, Coastal Zone Laboratory, Texas A&M University at Galveston, Galveston, Texas,
1981.
G. D. Robin Davidson-Arnott and Robert A. McDonald, “Nearshore water motion and mean
flows in a multiple parallel bar system”, Marine Geology, Volume 86, Issue 4, April 1989,
Pages 321-338.
Ed Thornton, “Rip Currents: A Field Experiment and Numerical Model” found as part of the
NWS Rip Current Safety Website
(http://www.oc.nps.navy.mil/%7Ethornton/ripex/ripex.htm), Nearshore Processes Lab,
Oceanography Dept, 327 Spanagel Hall , Naval Postgraduate School, Monterey, CA 93943