study of basic environmental performance indicators of a
TRANSCRIPT
Study of basic environmental performance indicators of a coal mining enterprise
Vladimir Mikhailov1*, Tatyana Galanina1, Svetlana Bugrova1, Yana Mikhailova1, and
Evdokiya Kulpina1
1T.F. Gorbachev Kuzbass State Technical University, Department of Production Management,
650000 Kemerovo, 28 Vesennyaya st., the Russian Federation
Abstract. Current processes of environmental law enforcement require the
use of innovative approaches to the problem of environmental
management. In this regard, an adequate choice of the environmental
performance indicators of an enterprise and the technique for their analysis,
aimed at developing efficient, environmentally friendly management
decisions, is of great importance. The technique for calculating the
environmental and eco-economic performance indicators of a coal mining
enterprise, including using the weighted average hazard class of pollutants
or production and consumption waste is discussed in the article. Various
options for the application of this approach, which is of practical
importance for reducing the labor intensity of management decision-
making by industrial enterprises, are considered.
Introduction
One of the main functions of environmental management at an enterprise is the analysis of
cost effectiveness of environmental activities. The analysis of environmental performance
indicators of enterprises, especially in coal mining [1-3], is the most important component
of the environmental management system at the macro and micro levels [4, 5].
The purpose of the analysis of environmental performance indicators of enterprises is to
form an information basis for making decisions in the field of environmental management,
focused on improving the environmental protection activities of an enterprise and
increasing the efficiency of the use of natural resources.
To assess the balance between production activities and environmental protection at an
enterprise, the most informative indicators (capable of providing a complete analysis in
terms of temporal relationships and relationships within the “environment-production”
system) should be selected, since the quality of the source information largely depends on
the quality of environmental management models.
*Corresponding author: [email protected]
https://doi.org/10.1051/e3sconf /202131504005E3S Web of Conferences 315, 04005 (2021)
VIth International Innovative Mining Symposium
© The Authors, published by EDP Sciences. This is an open access article distributed under the terms of the CreativeCommons Attribution License 4.0 (http://creativecommons.org/licenses/by/4.0/).
Results and Discussion
Improving environmental protection at the present stage of economic development
consists in the efficient management of eco-economic systems of various levels [6-11],
which requires the use of eco-economic indicators providing maximum information content
with minimum labor intensity of their calculation.
At the same time, it is important to keep an accurate record of the mass of pollutants,
which can be expressed not only by the sum of the actual values, but also by the reduced
mass, which makes it possible to determine the toxicity of each ingredient to obtain a
mono-pollutant. Many eco-economic indicators, such as economic damage from negative
impact on the environment and its derivatives [12, 13] are calculated on the basis of a
mono-pollutant.
When solving most of eco-economic problems, the problem of taking into account the
hazard class of pollutants arises, which is especially important for large industrial
enterprises with highly diversified negative impact.
The calculation of the weighted average hazard class of a pollutant [12, 13], determined
by the actual or reduced weight of a pollutant, is proposed in this paper. The reduced mass
of a pollutant allows determining the toxicity of individual ingredients through the indicator
of relative hazard as the reciprocal of the maximum allowable concentration - formula (1).
total
n
i
ii
WAM
HCM
HC=
= 1 , (1)
where WAHC – weighted average hazard class of pollutants; i – type of pollutant; n
– total amount of pollutants; iHC – hazard class of the i-th pollutant;
totalM – total reduced
weight of pollutants, conv. t.
=
=n
i
itotal MM1
, (2)
where i
M – reduced mass of the i-th pollutant, conv. t, which is calculated by the
formula (3):
iiiAmM = , (3)
where mi – actual mass of the i-th pollutant, t; Ai – indicator of the relative hazard of the
i-th pollutant, conv. t/t, which is calculated by the formula (4):
i
iRI
A1
= , (4)
where iRI – regulatory indicator of the i-th pollutant, mg/m3. The daily average
maximum allowable concentration of the i-th pollutant (MACDi), the one-time maximum
allowable concentration of the i-th pollutant (MACOTi) or the approximate safe level of
exposure to the i-th pollutant (ASLEi) can be used as a regulatory indicators.
Table 1 shows the results of calculating the reduced mass of pollution by the JSC
Chernigovets enterprise on the basis of official data. Codes of pollutants are shown in
brackets.
Table 1 shows that the enterprise emits pollutants of III and IV hazard classes into the
air. Nitrogen dioxide (III hazard class), inorganic dust with SiO2 content up to 20% (IV
hazard class), carbon monoxide (IV hazard class) and inorganic dust with SiO2 content
from 20 to 70% (IV hazard class) have the largest actual mass. Based on the data from the
Table, and in accordance with formulas (1) - (4), the calculation of the weighted average
https://doi.org/10.1051/e3sconf /202131504005E3S Web of Conferences 315, 04005 (2021)
VIth International Innovative Mining Symposium
2

hazard class of pollutants emitted by the JSC Chernigovets enterprise into the air, which is
equal to III.
337.39.28433
410600.7317833.2=
+=WAHC
Table 1. The results of calculating the reduced mass of the main air pollutants by the JSC
Chernigovets enterprise
Pollutant Code mi, t/y Regulatory indicator, mg/m3 Ai,
conv.
t/t
Мi,
conv.
t/t Indicator Value
Iron oxide 0123 1.020 MACDi 0.04 25 25.5
Nitrogen dioxide 0301 2851.996 MACOTi 0.2 5 14260
Nitrogen oxide 0304 464.428 MACOTi 0.4 2.5 1161.1
Carbon (soot) 0328 225.186 MACOTi 0.15 6.67 1502
Sulfur dioxide 0330 321.196 MACOTi 0.5 2 642.4
A mixture of C1 -
C5 saturated
hydrocarbons
0415 56.83 ASLEi 50 0.02 1.1
A mixture of C6 -
C10 saturated
hydrocarbons
0416 32.680 ASLEi 30 0.03 1
Kerosene 2732 389.236 ASLEi 1.2 0.83 240.1
III hazard class total 17833.2
Carbon monoxide 0337 1724.286 MACOTi 5 0.2 344.9
Methylbenzene
(Toluene)
0621 1.064 MACOTi 0.6 1.67 1.8
A mixture of C12 -
C19 saturated
hydrocarbons
2754 10.836 MACOTi 1 1 10.8
Inorganic dust: 70-
20% of SiO2
2908 1444.583 MACOTi 0.3 3.33 4810.5
Inorganic dust: up
to 20% of SiO2
2909 1739.373 MACOTi 0.5 2 3478.7
Wood dust 2936 3.405 ASLEi 0.5 2 6.8
Coal ash 3714 70.128 ASLEi 0.3 3.33 233.5
Coal dust 3749 171.365 ASLEi 0.1 10 1713.7
IV hazard class total 10600.7
TOTAL 28433.9
Economic damage from negative impact on the air (EDa) is calculated by the formula
(5):
,аESаindаа МCCED =
(5)
where а Equation.3
– specific economic damage from air pollution by one
conventional ton of harmful substances, 47,5 RUB/conv. t;ESаC
Equation.3 – the coefficient
of the environmental situation for the air (for the Kemerovo region, as for an industrialized
https://doi.org/10.1051/e3sconf /202131504005E3S Web of Conferences 315, 04005 (2021)
VIth International Innovative Mining Symposium
3
region, is 1.44);а Equation.3
– reduced mass of the annual emission of harmful
substances into the air, conv. t/y.аМ
Equation.3 is calculated by the formula 6:
,AmМi
а
а
iа
n
1iаа =
=
(6)
where i
аm – actual mass of the i-th air pollutant, t; iа – type of air pollutant; nа – total
amount of air pollutants; i
аA – indicator of the relative hazard of the i-th pollutant (conv.
t/t), which is determined by the formula 4.
For this calculation, the daily average maximum allowable concentration, and in its
absence, the one-time maximum allowable concentration or an approximate safe level of
exposure, is used as a priority regulatory indicators.
BthousandRUEDа 47.21009.2843344.108.15.47 ==
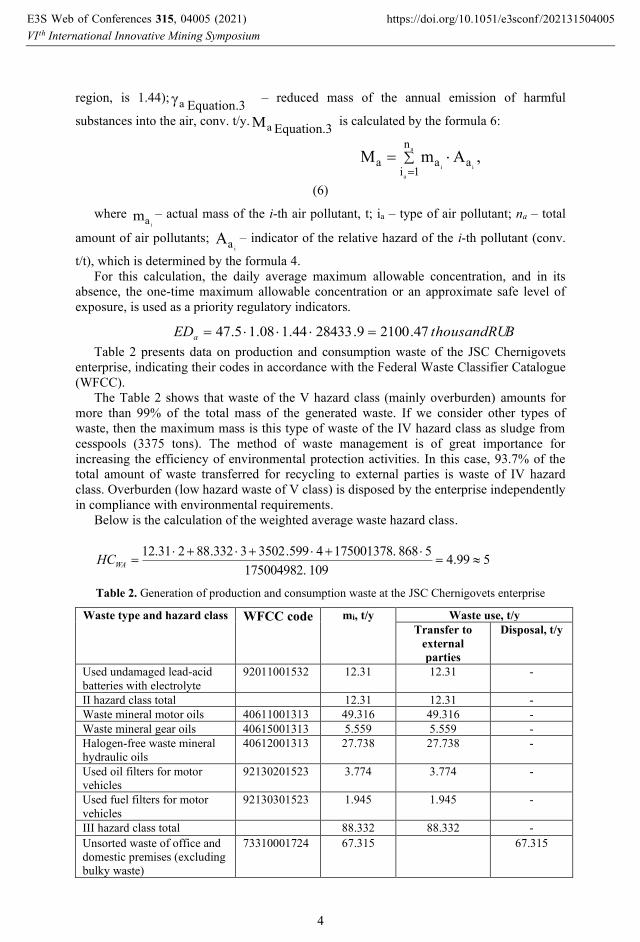
Table 2 presents data on production and consumption waste of the JSC Chernigovets
enterprise, indicating their codes in accordance with the Federal Waste Classifier Catalogue
(WFCC).
The Table 2 shows that waste of the V hazard class (mainly overburden) amounts for
more than 99% of the total mass of the generated waste. If we consider other types of
waste, then the maximum mass is this type of waste of the IV hazard class as sludge from
cesspools (3375 tons). The method of waste management is of great importance for
increasing the efficiency of environmental protection activities. In this case, 93.7% of the
total amount of waste transferred for recycling to external parties is waste of IV hazard
class. Overburden (low hazard waste of V class) is disposed by the enterprise independently
in compliance with environmental requirements.
Below is the calculation of the weighted average waste hazard class.
599.4109175004982.
5868175001378.4599.35023.33288212.31=
+++=WAHC
Table 2. Generation of production and consumption waste at the JSC Chernigovets enterprise
Waste type and hazard class WFCC code
mi, t/y Waste use, t/y
Transfer to
external
parties
Disposal, t/y
Used undamaged lead-acid
batteries with electrolyte
92011001532 12.31 12.31 -
II hazard class total 12.31 12.31 -
Waste mineral motor oils 40611001313 49.316 49.316 -
Waste mineral gear oils 40615001313 5.559 5.559 -
Halogen-free waste mineral
hydraulic oils
40612001313 27.738 27.738 -
Used oil filters for motor
vehicles 92130201523 3.774 3.774 -
Used fuel filters for motor
vehicles 92130301523 1.945 1.945 -
III hazard class total 88.332 88.332 -
Unsorted waste of office and
domestic premises (excluding
bulky waste)
73310001724 67.315 67.315
https://doi.org/10.1051/e3sconf /202131504005E3S Web of Conferences 315, 04005 (2021)
VIth International Innovative Mining Symposium
4

Waste tires 92111001504
56.648 56.648 -
Used air filters for motor
vehicles
92130101524 3.636 3.636 -
Waste from cesspools 73210001304 3375 3375 -
IV hazard class total 3502.599 3435.284 67.315
Mechanical sludge from open
pit water treatment in coal
mining
21128111395 128.868 128.868 -
Low hazard overburden mix 20019099395 175001250 - 127570250
V hazard class total 175001378.868 128.868 127570250
TOTAL 175004982.109 3664.794 127570317.315
Accounting for waste transferred to external parties organizations is of great importance
in the analysis of eco-economic indicators. Weighted average hazard class of waste
transferred to third parties:
43664.794
5128.8684284.34353.33288212.31=
+++=waHC
The economic damage from the disposal of production and consumption waste,
differentiated by hazard classes (EDWASTE), can be calculated by the formula 7:
,51
_=
=WASTEХn
j
wastejESпindELjPWASTE mCCRED (7)
where 5 – five-fold multiplier; ELjPR _
– the rate of payment within the established limits
for the disposal of production and consumption waste of the j-th hazard class, RUB/t;
nWASTE – number of waste hazard classes (differentiated from 1 to 5);ЭСпК – the coefficient
of the environmental situation for the soil (differentiated by region and for the Kemerovo
region is 1.2); wastejm – actual mass of waste of the j-th hazard class, t.
Table 3 shows the results of calculating the economic damage from the negative impact
on the soil of production and consumption waste of the JSC Chernigovets enterprise
Table 3. The results of calculating the economic damage from the negative impact on the
soil of production and consumption waste of the JSC Chernigovets enterprise
Waste hazard class Mwastej, t/y RPELj,
RUB/t
Economic damage
thousand
RUB
%
II 12.31 1990.2 158.76 0.01
III 88.332 1327 759.56 0.06
IV 3502.599 663.2 15052.55 1.19
V 175001378.868 1.1 1247409.83 98.74
Total 1263380.70 100.00
The table 3 shows that during the operation of a coal mining enterprise, the maximum
share in the total value of the economic damage caused is occupied by waste of V hazard
class - 98.74%, which is about 1.25 billion rubles.
The main idea of using this regulatory method modification is that the entire mass of
pollution is considered in excess of limits, for which a five-fold multiplier is applied.
https://doi.org/10.1051/e3sconf /202131504005E3S Web of Conferences 315, 04005 (2021)
VIth International Innovative Mining Symposium
5

Conclusion
Analysis of the environmental performance indicators of a coal mining enterprise using the
technique for calculating the weighted average hazard class of pollutants based on the
actual or reduced mass or production and consumption waste is of practical importance
when conducting the following studies:
• calculation of economic damage from negative impact on the environment and other
eco-economic indicators;
• determination of the hazard class of an enterprise, including for the purpose of
exemption from pollution charges;
• calculating the level of penalties for violation of environmental legislation and
excessive negative impact;
• identification of environmental "bottlenecks" of an enterprise to plan the priority
environmental protection measures;
• substantiation of the effectiveness of the use of one-time and current environmental
costs;
• solving other eco-economic problems.
References
1. P. Kosinskiy, V. Merkuriev and A. Medvedev, E3S Web of Conf., 134 03009 (2019)
2. P. Kosinskiy, A. Kharitonov, E. Wolfson and R. Takhtaeva, E3S Web of Conf., 174
04009 (2020)
3. Yu. A. Manakov, A. N. Kupriyanov and A. I. Kopytov, Ugol, 9, 89 (2018)
4. V. M. Tumin, A. G. Koryakov and E. P. Nikiforova, World Appied Sciences Journal
25(6), 945 (2013)
5. V. M. Tumin and A. G. Koryakov Middle East Journal of Scientific Research 17(9),
1350 (2013)
6. T. Tyuleneva, E3S Web of Conf., 21 04009 (2017)
7. T. Tyuleneva, E3S Web of Conf., 174 04019 (2020)
8. V. M. Zolotukhin, V. A. Gogolin, M. Yu. Yazevich, M. I. Baumgarten and
A. V. Dyagileva, IOP Conf. Series: Earth and Env. Sci., 50, 012027 (2017)
9. V. Zolotukhin, N. Zolotukhina, M. Yazevich, A. Rodionov and M. Kozyreva, E3S
Web of Conf., 21 04008 (2017)
10. I. Kolechkina, I. Verchagina, E. Eltsova and M. Petrova, E3S Web of Conf., 134,
02004 (2019)
11. A. Islamgaleyev, C. Karibdzhanov and M. Petrova, Journal of Security and
Sustainability Issues, 10(1), 165 (2020)
12. V. Mikhailov, V. Karasev and G. Mikhailov, E3S Web of Conf., 41, 02015 (2018)
13. T. V. Kiseleva, V. G. Mikhailov and G. S. Mikhailov, IOP Conf. Series: Earth and
Env. Sci., 84, 012044 (2017)
14. Y. V. Ryumina, Economy of Region Issues, 12(4), 1113 (2016)
15. T. Y. Anopchenko, O. I. Gorbaneva, E. I. Lazareva, A. D. Murzin and
G. A. Ougolnitsky, Advances in systems science and applications, 18(4), 136 (2018)
https://doi.org/10.1051/e3sconf /202131504005E3S Web of Conferences 315, 04005 (2021)
VIth International Innovative Mining Symposium
6