study of disinfectant penetration in a drinking water
TRANSCRIPT

Study of Disinfectant Penetration in a Drinking Water Storage Tank Sediment Using Microelectrodes
Hong Liu, David G. Wahman, and Jonathan G. Pressman
November 15, 2016
National Risk Management Research Laboratory U.S. Environmental Protection Agency
Cincinnati, Ohio, United States
2016 Water Quality Technology Conference

Nitrification in Drinking Water Storage Tank Sediment
Water Storage Tanks Accumulate Sediment Over Time and Provide a Good Habitat for Bacteria Growth
2/14/2018 2016 Water Quality Technology Conference 2
Ammonia Nitrite AOB
Nitrate NOB
- Chloramine decay - Naturally occurring - Organic N

Research Motivation
Sediment accumulation causes water quality degradation issues:
Harbor biological growth
(nitrification) & Pathogens
Increase disinfectant decay
Nitrite & Nitrate
Disinfectant penetration within water storage sediments is largely uncharacterized
2/14/2018 2016 Water Quality Technology Conference 3
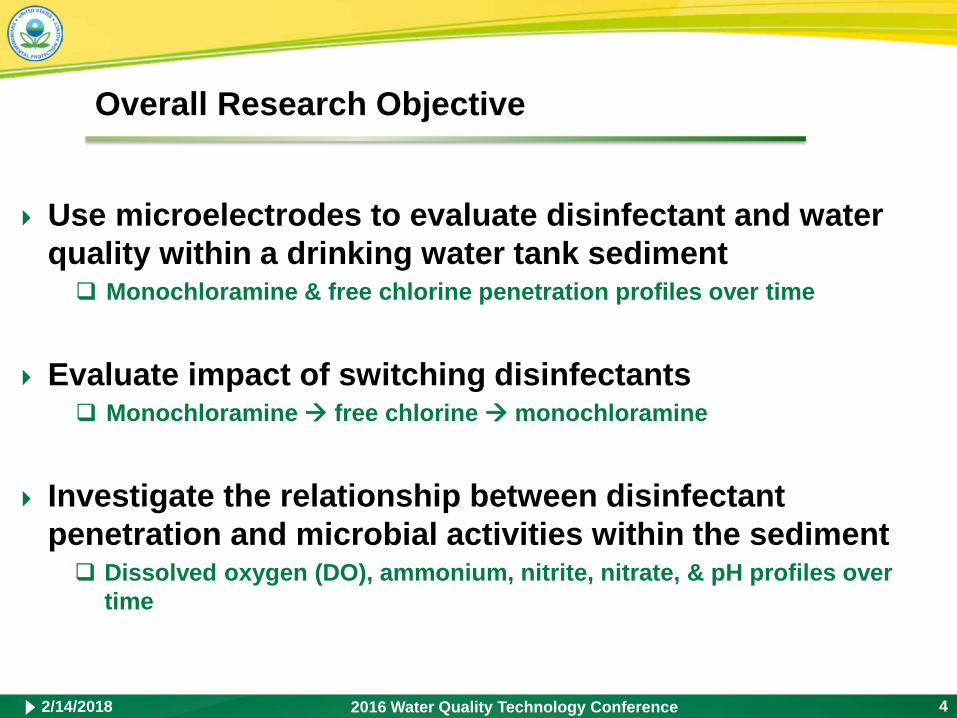
Overall Research Objective
Use microelectrodes to evaluate disinfectant and water quality within a drinking water tank sediment Monochloramine & free chlorine penetration profiles over time
Evaluate impact of switching disinfectants Monochloramine free chlorine monochloramine
Investigate the relationship between disinfectant penetration and microbial activities within the sediment Dissolved oxygen (DO), ammonium, nitrite, nitrate, & pH profiles over
time
2/14/2018 2016 Water Quality Technology Conference 4

Research Approach – Microelectrode Fabrication
Microelectrodes used in this research: Amperometric type:
- Dissolved oxygen (DO), monochloramine, free chlorine, and nitrite
Potentiometric type: - pH, ammonium, and nitrate
Monochloramine & Free Chlorine Microelectrodes
2/14/2018 2016 Water Quality Technology Conference 5
Gold wire for monochloramine Platinum wire for free chlorine
Combined O2 Microelectrode
Cited From Lu, R and Yu, T. 2002
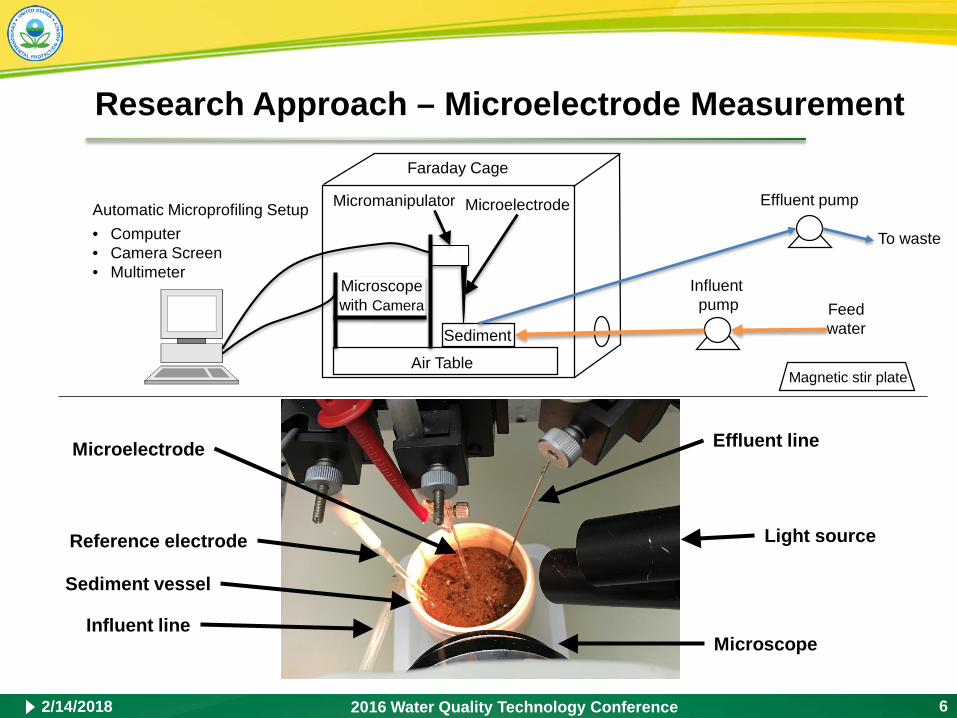
Research Approach – Microelectrode Measurement
Faraday Cage
Microscope with Camera
Micromanipulator
Sediment
Influent pump Feed
water
Microelectrode
Air Table
Effluent pump Automatic Microprofiling Setup • Computer To waste • Camera Screen • Multimeter
Magnetic stir plate
Effluent line Microelectrode
Light source Reference electrode
Sediment vessel
Influent line Microscope
2/14/2018 2016 Water Quality Technology Conference 6
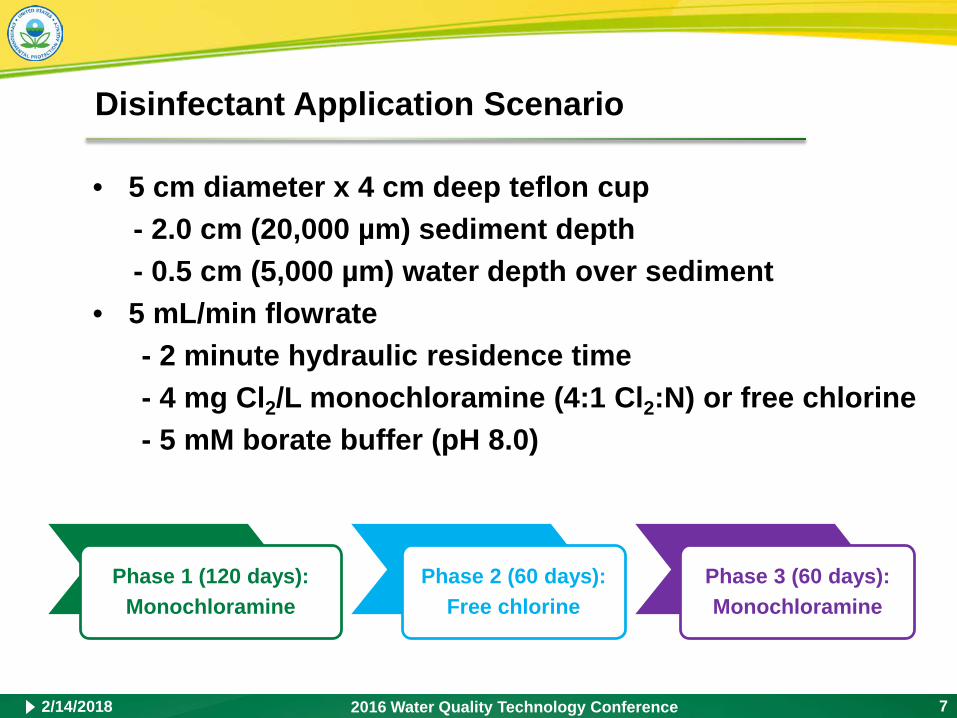
Disinfectant Application Scenario
• 5 cm diameter x 4 cm deep teflon cup - 2.0 cm (20,000 µm) sediment depth - 0.5 cm (5,000 µm) water depth over sediment
• 5 mL/min flowrate - 2 minute hydraulic residence time - 4 mg Cl2/L monochloramine (4:1 Cl2:N) or free chlorine - 5 mM borate buffer (pH 8.0)
Phase 1 (120 days): Monochloramine
Phase 2 (60 days): Free chlorine
Phase 3 (60 days): Monochloramine
2/14/2018 2016 Water Quality Technology Conference 7

Phase 1 Monochloramine - Monochloramine Profiles
Interface between bulk water and sediment
5
4
5 hours 6 days 3 34 days 76 days 119 days 2
1
0
-5000 -2500 0 2500 5000 7500 10000 12500 15000
Mon
ochl
oram
ine
(mg
Cl 2
/L)
2/14/2018 2016 Water Quality Technology Conference 8
Distance (µm) 2• After approximately 5 hours, a 2 mg Cl /L monochloramine concentration reached
the sediment’s surface, but after 119 days, the 2 mg Cl2/L monochloramine concentration only reached to a depth of 3,200 µm.
• No monochloramine was measurable at sediment depths greater than 6,200 µm.

Phase 1 Monochloramine – Dissolved Oxygen Profiles
10
8
6
4
6 days 34 days 76 days 120 days
2
0
-5000 -2500 0 2500 5000 7500 10000 12500 15000
Dis
solv
ed O
xyge
n (m
g/L)
Distance (µm) • DO progressed inward during the 120 day period. • 4 mg/L of DO reached 5,000 µm below interface after day 120 with 52% of the bulk DO consumed. • No DO was measurable at sediment depths greater than 12,500 µm. 2/14/2018 2016 Water Quality Technology Conference 9
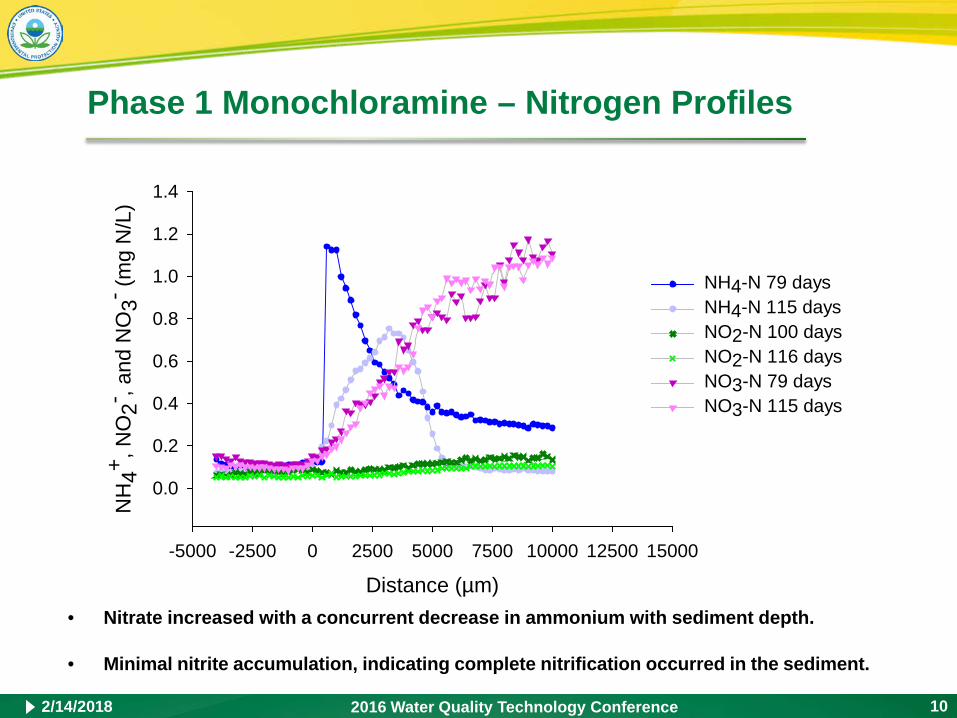
Phase 1 Monochloramine – Nitrogen Profiles N
H4+ , N
O2- , a
nd N
O3- (m
g N
/L)
2/14/2018 2016 Water Quality Technology Conference 10
1.4
1.2
1.0
0.8
0.6
0.4
0.2
0.0
-5000 -2500 0 2500 5000 7500 10000 12500 15000
NH4-N 79 days NH4-N 115 days NO2-N 100 days NO2-N 116 days NO3-N 79 days NO3-N 115 days
Distance (µm) • Nitrate increased with a concurrent decrease in ammonium with sediment depth.
• Minimal nitrite accumulation, indicating complete nitrification occurred in the sediment.

Phase 1 Monochloramine – Final Profile Summary
9 2.0
8
-5000 -2500 0 2500 5000 7500 10000 12500
Monochloramine Dissolved Oxygen pH Ammonium Nitrite Nitrate
Amm
oniu
m, N
itrite
, and
Nitr
ate
(mg
N/L
)
1.6 7
6
5
4
1.2
0.8 3
2 0.4 1
0 0.0
• Start of DO consumption corresponded with monochloramine decrease.
• Complete nitrification oxygen consumption corresponds.
• DO consumption continued after ammonia removal heterotrophic activity.
DO
(mg/
L), M
onoc
hlor
amin
e (m
g C
l 2 //L
), an
d pH
Distance (µm)
2/14/2018 2016 Water Quality Technology Conference 11
Phase 2 Free Chlorine – Free Chlorine Profiles
-5000 -2500 0 2500 5000
5 hours 28 days 60 days
5
4
3
2
1
0 Free
chl
orin
e (m
g C
l 2/L
)
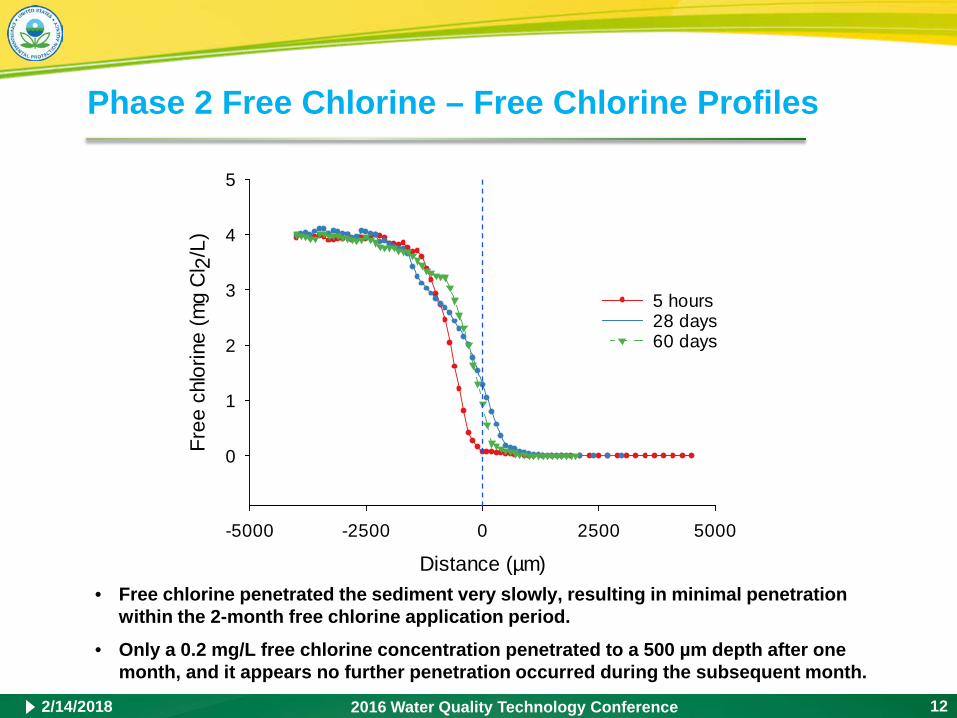
Distance (µm) • Free chlorine penetrated the sediment very slowly, resulting in minimal penetration
within the 2-month free chlorine application period. • Only a 0.2 mg/L free chlorine concentration penetrated to a 500 µm depth after one
month, and it appears no further penetration occurred during the subsequent month.
2/14/2018 2016 Water Quality Technology Conference 12

Phase 2 Free Chlorine – Dissolved Oxygen Profiles
10 DO kept penetrating during free chlorine
8 burn period
6 7 days 26 days 62 days 4
DO profile at day 120 2 monochloramine
disinfection 0
-5000 -2500 0 2500 5000 7500 10000 12500 15000
Dis
solv
ed O
xyge
n (m
g/L)
2/14/2018 2016 Water Quality Technology Conference 13
Distance (µm) • As compared to the 4 mg/L DO at a 5,000 µm depth after 120 days of
monochloramine application, 4 mg/L of dissolved oxygen penetrated to a 6,800 µm depth after 62 days of free chlorine application.
• No DO was measurable at sediment depths greater than 13,500 µm.

Phase 2 Free Chlorine – Nitrogen Profiles
1.2
1.0 NH4-N 5 days
0.8 NH4-N 25 days NH4-N 59 days
0.6 NO2-N 25 days NO2-N 60 days
0.4 NO3-N 5 days NO3-N 25 days
0.2 NO3-N 59 days
0.0
-5000 -2500 0 2500 5000 7500 10000 12500 15000
NH
4+ , NO
2- , and
NO
3- (mg
N/L
)
Distance (µm)
• Ammonium and nitrate nitrogen continuously decreased over 60 days of free chlorine exposure.
2/14/2018 2016 Water Quality Technology Conference 14

Phase 2 Free Chlorine – Final Profile Summary
DO
(mg/
L), F
ree
chlo
rine
(mg
Cl 2/
L),
and
pH
9 1
8 Free Chlorine Dissolved Oxygen pH Ammonium Nitrite Nitrate
-5000 -2500 0 2500 5000 7500 10000 12500
0.8
0.6
0.4
7
6
5
4
3
2 0.2 1
0 0 Amm
oniu
m, N
itrite
, and
Nitr
ate
(mg
N/L
)
Distance (µm) • After a 2-month free chlorine application, both ammonium and nitrate decreased to
some extent, but the DO consumption and the continued presence of ammonium and nitrate indicated that there was still microbial activity within the sediment.
• A decrease in pH from 8 to 7.7 was seen.
2/14/2018 2016 Water Quality Technology Conference 15

Phase 3 Monochloramine - Monochloramine Profiles
0
1
2
3
4
5
9 days 22 days 43 days 55 days
-5000 -2500 0 2500 5000 7500 10000 12500 15000
) L/l 2
C g
m(e n
ami
lor
hoc
onM
Distance (µm)
• A 2 mg Cl2/L monochloramine reached to a similar depth (2,800 µm) as in Phase 1 (3,200 µm). • Monochloramine appears to penetrate further (7,500 µm) than was seen in Phase 1 (6,200 µm).
2/14/2018 2016 Water Quality Technology Conference 16
Phase 3 Monochloramine – Dissolved Oxygen Profiles
0
2
4
6
8
10
8 days 42 days 55 days
Red line represents DO profile at day 62 free chlorine application
-5000 -2500 0 2500 5000 7500 10000 12500 15000
)Lg/
m(n
geyxO
d evlossiD
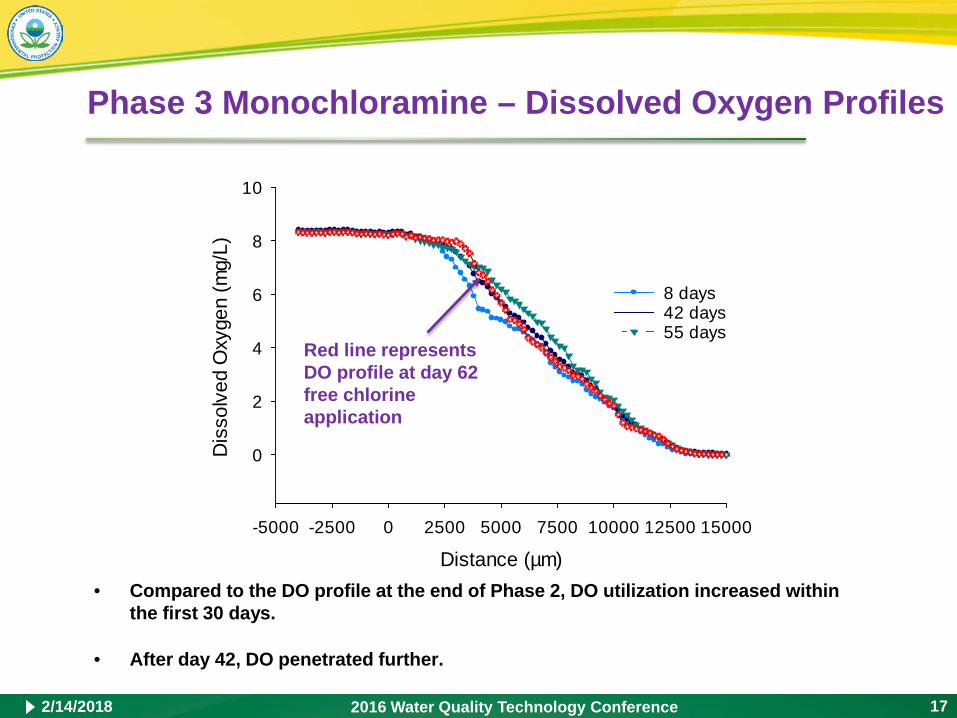
Distance (µm) • Compared to the DO profile at the end of Phase 2, DO utilization increased within
the first 30 days.
• After day 42, DO penetrated further.
2/14/2018 2016 Water Quality Technology Conference 17
15000
Phase 3 Monochloramine – Nitrogen Profiles
NH4-N 8 days NH4-N 56 days NO2-N 11 days NO2-N 56 days NO3-N 8 days NO3-N 56 days
1.0
0.8
0.6
0.4
0.2
0.0 -5000 -2500 0 2500 5000 7500 10000 12500
NH
4+ , NO
2- , and
NO
3- (mg
N/L
)
Distance (µm)
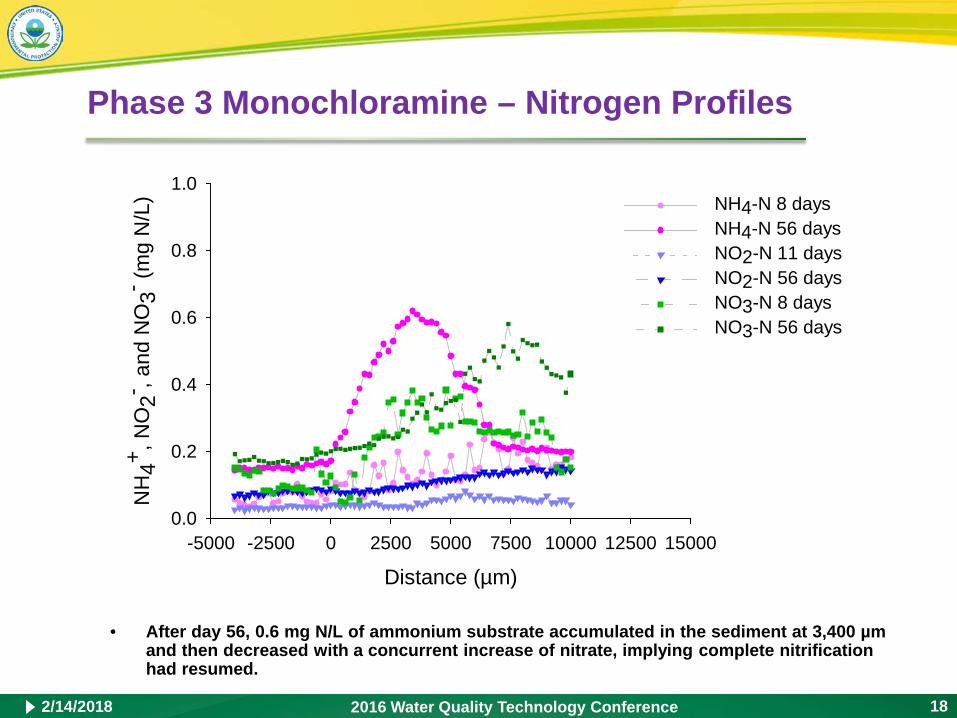
• After day 56, 0.6 mg N/L of ammonium substrate accumulated in the sediment at 3,400 µmand then decreased with a concurrent increase of nitrate, implying complete nitrification had resumed.
2/14/2018 2016 Water Quality Technology Conference 18

Phase 3 Monochloramine – Final Profile Summary
9
8
7
6
5
4
3
2
1
0
1
0.8
0.6
0.4
0.2
-5000 -2500 0 2500 5000 7500 10000 12500
Monochloramine Dissolved Oxygen pH Ammonium Nitrite Nitrate
Amm
oniu
m, N
itrite
, and
Nitr
ate
(mg
N/L
)
DO
(mg/
L), M
onoc
hlor
amin
e (m
g C
l 2//L
), an
d pH
0
Distance (µm)
• Once switched back to monochloramine, ammonium substrate was brought into the sediment and nitrification resumed.
• The return to chloramination following a free chlorination period led to subsequent nitrification within a short period of time.
2/14/2018 2016 Water Quality Technology Conference 19

Conclusions
Microelectrodes were a useful tool for determining chemical variability within
a drinking water storage tank sediment.
Even with extended periods where the maximum regulatory allowed
chloramine residual was maintained in the bulk water, complete
monochloramine penetration was not obtained into the sediment and
biological activity remained.
Free chlorine progressed inward into the sediment very slowly, resulting in
minimal penetration within a 2-month free chlorine application period and
microbial activity remained.
Nitrification resumed upon a switch back to monochloramine.
Findings support periodic cleaning of sediments from water storage tanks.
2/14/2018 2016 Water Quality Technology Conference 20
Acknowledgements
This research was supported by the U.S. Environmental Protection Agency (U.S.EPA). The U.S. Environmental Protection Agency, through its Office of Research and Development, funded and managed, or partially funded and collaborated in, the research described herein. It has been subjected to the Agency’s peer and administrative review and has been approved for external publication. Any opinions expressed are those of the author(s) and do not necessarily reflect the views of the Agency, therefore, no official endorsement should be inferred. Any mention of trade names or commercial products does not constitute endorsement or recommendation for use.
2/14/2018 2016 Water Quality Technology Conference 21