study of temperature effects on activated sludge floc...
TRANSCRIPT

te
Study of temperature effects on activated sludge floc stability Master’s Thesis in the International Master’s Programme Applied Environmental Measurement Techniques RASHED IBRAHIM MANASSRA Civil and Environmental Engineering Water Environment Technology CHALMERS UNIVERSITY OF TECHNOLOGY Göteborg, Sweden 2006 Master’s thesis 2006:6

1
Study of temperature effects on activated sludge floc stability
Master thesis in Applied Environmental Measurement
Techniques By
Rashed Ibrahim Manassra under super vision of
Dr. Britt-Marie Wilén
Chalmers University of Technology Department of civil and environmental Engineering Water Environment Technology Göteborg, Sweden 2006 Master’s Thesis 2006:6

2
Acknowledgements
I would like to warmly thank my project supervisor Dr. Britt-Marie Wilén, at the department of Civil and Environmental Engineering/ Water Environment Technology at Chalmers University of Technology, for the time she has devoted to me, for her numerous sensible advise, for her endless source of help and support and for making sure my project went well. I also would like to thank the examiner of the thesis Professor Greg Morrison, Director of Master degree Programme of Applied Environmental Measurement Techniques, head of Water Environment Technology department, for his assistance and taking time to read the thesis. I also would like to extend my thanks to all my teachers at Chalmers University for their assistance and guidance during my study. I am also thankful for the members at the Rya Wastewater Treatment Plant in Göteborg and Jesper and Mona at Chalmers laboratory for their help and kind treatment during my work.
Dedication I would like to dedicate this work to my parents, brothers, Gassan and Ismail, and all my sisters for their endless encouragement and support they have given. The thought of affection and loving memories made me able to undertake the hectic and challenging task of master thesis.
To all my relatives, cousins and Friends I dedicate this work

3
Abstract Temperature is an important parameter in biological wastewater treatment because the effects it has on the microbial growth and activity. The influence of either decreasing the temperature (5°C, 10°C and 15°C) or increasing it to a moderate high temperature( 30°C) on the degree of deflocculation of the activated sludge flocs was studied. The activated sludge flocs were exposed to controlled shear conditions in two parallel lab scale batch reactors in short term experiments (0-3 h) under aerobic and anaerobic conditions. Floc disintegration was measured as turbidity in the supernatant after centrifugation. The composition of the turbidity was analyzed in terms of total and dissolved biopolymers (carbohydrate, protein and humic substances). The results show that, when activated sludge acclimatized to a temperature of about 20ºC was exposed to different low temperatures (5ºC, 10ºC and 15ºC) under aerobic conditions, the flocs deflocculated significantly more compared to at 20ºC. However, when the same experiments were carried out under anaerobic conditions, it was found that the activated sludge flocs deflocculated more at 20ºC than at 5ºC, 10ºC and 15ºC. The concentration of total biopolymers measured in terms of protein, carbohydrate and humic substances followed the turbidity development and was higher at 5ºC, 10ºC and 15ºC than at 20ºC under aerobic conditions, while it was higher at 20ºC than at 5ºC, 10ºC and 15ºC under anaerobic conditions. Higher concentrations were found for all total organic fractions under anaerobic conditions. The dissolved biopolymers were released more at 20°C than at 5°C, 10°C and 15°C under aerobic conditions. The concentrations of dissolved polymers were also higher at 30°C than at 20°C. The dissolved biopolymers followed the turbidity curve for anaerobic conditions and they were always higher at 20°C than at 5°C, 10°C and 15°C. The concentrations of Na in the supernatant were rather similar under aerobic and anaerobic conditions. The concentration of K were slightly higher under anaerobic conditions than under aerobic conditions. Under aerobic conditions there was a slight increase in concentration and there was a trend towards higher concentrations at higher temperatures. The increased in concentration was particularly high at 30ºC. Similar observations were made for anaerobic conditions.Very low concentrations of Fe were found in the supernatant at aerobic conditions, whereas slightly higher concentrations were observed for anaerobic conditions. It was observed that, the concentration of Ca, Mg and in some cases Fe ions decreased with the time of the experiments in both test reactors and reference reactors under both aerobic and anaerobic conditions.

4
Abstract ............................................................................................................... 3 1.0. Chapter One: Literature review ................................................................ 7 1.1. Introduction ......................................................................................................................... 7 1.2. Aim of the thesis (objectives).............................................................................................. 8 2.0. Chapter two: Literature review................................................................. 9 2.1. Wastewater composition ..................................................................................................... 9 2.2. Wastewater treatment .......................................................................................................... 9 2.3. The activated sludge process............................................................................................. 10 2.4. Composition of the activated sludge flocs ........................................................................ 11 2.5. The organisms in biological treatment plants ................................................................... 12 2.6. Extracellular polymeric substances (ESP) ........................................................................ 13 2.7. Factors affecting deflocculation and suspended solids in effluents .................................. 13
2.7.1 Temperature ............................................................................................................ 13 2.7.2. Ion effect ................................................................................................................ 13 2.7.3. Shear forces ............................................................................................................ 14 2.7.4. Anaerobic conditions.............................................................................................. 14
3.0. Chapter three: Experimental work (Materials and Methods) ............. 15 3.1. Activated sludge samples .................................................................................................. 15 3.2. Experimental set up........................................................................................................... 15 3.3. Analytical methods for biopolymers measurements (composition of turbidity and sludge).................................................................................................................................................. 16 3.4. Preparation of samples for Ions measurement by using ICP-MS ..................................... 17 3.5. Test and control experiments ............................................................................................ 17 4.0. Chapter four: Results and Discussion..................................................... 19 4.1. Deflocculation under aerobic and anaerobic conditions at different temperature ............ 19 4.2. Composition of the eroded fractions ................................................................................. 21 4.2.2. Dissolved eroded biopolymers ....................................................................................... 27 4.3. Results of the control experiments .................................................................................... 33 4.4. Eroded (released) ions into the supernatant ...................................................................... 34 5.0. Chapter five: Conclusion.......................................................................... 45 6.0. Chapter six: References ............................................................................ 47 Appendices ........................................................................................................ 49 Appendix (I): the analytical methods used for measurement of carbohydrates, protein and humic substances...................................................................................................................... 49 Appendix (II): The concentration of total biopolymers (average concentration of the duplicate experiments) in the total sludge (mg/g MLSS) ........................................................................ 52 Appendix (III): The ratio between the total biopolymers in the total sludge........................... 52 Appendix (IV):The average concentration of total and dissolved biopolymers (mg/g MLSS) and the absorbance/ MLSS values, in the supernatant for the experiments performed under aerobic conditions .................................................................................................................... 53 Appendix (V): The average concentration of total and dissolved biopolymers (mg/g MLSS) and the absorbance/ MLSS values, in the supernatant for the experiments performed under aerobic conditions .................................................................................................................... 55 Appendix (VI): The ratio between the biopolymers in the supernatant after 2hr in the reference and test reactors under both aerobic and anaerobic conditions ................................ 57 Appendix (VII): Values of dissolved oxygen, pH and conductivity at the end of each experiment................................................................................................................................ 58

5
Appendix (VIII): Average concentration of ions (mg/g MLSS) in the total sludge ................ 58 Appendix (IX): The concentration of ions (mg/L) in the supernatant of the duplicated experiments performed under aerobic conditions .................................................................... 59 Appendix (X): The concentration of ions (mg/l) in the supernatant of the duplicated experiments performed under anaerobic conditions ................................................................ 60 Appendix (XI): The average concentration of ions (mg/L) in the supernatant of experiments performed under aerobic conditions......................................................................................... 63 Appendix (XII): The average concentration of ions (mg/l) in the supernatant of experiments performed under anaerobic conditions..................................................................................... 64

6

7
1.0. Chapter One: Literature review 1.1. Introduction
Removal of organic matter and nutrients such as phosphorus and nitrogen from sewage is the main concern of the wastewater treatment. If too much untreated sewage or other organic matter is added to any water body such as lakes, streams or sea, the levels of dissolved oxygen will drop to levels too low to support sensitive species of aquatic biota and other aquatic life. Generally, wastewater is treated physically, by separating coarse and floating solids, chemically, by adding precipitants for phosphorus removal, and biologically by means of the activated sludge process. In this process the microorganisms metabolize and transform organic and inorganic substances into environmentally acceptable forms, and they proliferate and grow as flocs. The activated sludge must be settled and separated from the treated water before it is discharged into any receiving water body. The effectiveness of settling of activated sludge from the treated mixed liquor is mainly dependent on the ability of the activated sludge to form flocs. Two processes are important for the successful operation of a biological wastewater treatment plant, the transformation of dissolved and particulate wastewater components into biomass and solid liquid separation by sedimentation.
The efficiency of solid liquid separation in the activated sludge process is determined by the capacity of sludge biomass to remain flocculated and to settle and compact fast. When the activated sludge flocculates poorly, the level of suspended solids in the effluent increases, and it is often associated with weak floc structures. Deflocculation (erosion of small particles from the flocs) and poor bioaggregation can be the result of transient operating conditions and environmental stresses such as shift in temperature, toxic compounds, metals, dissolved oxygen concentration, pH, ionic strength, shift in substrate loading and nutrient characteristics or concentration.
The temperature is very important in biological wastewater treatment systems because the effects it has on the microbial growth. While most microorganisms are able to exist over a broad temperature range, there is usually an optimum temperature at which each species grows best. In treatment plants, a slow adaptation occurs due to seasonal changes in temperature. However, sudden changes in temperature affect the microbial activity which might affect processes like flocculation due to changed surface properties of the microbial cells. Wastewater treatment plants based on the activated sludge process are subject to transient operating conditions. The hydraulic loading varies significantly due to diurnal variations and to inflow and infiltration of storm water due to rain events. At different flows, the composition of the wastewater varies due to dilution with stormwater or varying load of domestic wastewater. When the flow changes, the composition and characteristics of the wastewater change as well. This has impact on the biological processes in the plant, such as changed concentration of carbon source for the denitrification but it has also impact on the physical properties of the particles in the activated sludge due to for instance changed ionic strength and temperature. It has been observed that the effluent turbidity often increases when the temperature in the wastewater decreases as a result of rain events. The temperature also has a seasonal variation where the wastewater temperature in Sweden varies from approximately 8°C in the winter to 21°C in the summer (Wilén et al., 2005). It was observed that the suspended solids concentration in the effluent is higher during the winter. Also during

8
rain events, the temperature in the water decreased and an immediate increase in turbidity could also often be observed. It was speculated that this could be due to a decreased microbial activity, which in previous research has been found to affect the floc stability (Wilén et al. 2000). 1.2. Aim of the thesis (objectives) The purpose of this thesis was to study the effect of temperature on the stability of activated sludge flocs when a controlled shear rate was applied under aerobic and anaerobic conditions. The composition of the released floc matter was also to be investigated and quantified in terms of total and dissolved biopolymers (protein, humic substances and carbohydrates), and cations such as, Mg2+, Ca2+, K+, Na+ and Fe3+ into the solution under aerobic and/or anaerobic conditions.

9
2.0. Chapter two: Literature review 2.1. Wastewater composition Wastewater is produced from industries, municipalities, and storm water; it varies significantly in both composition and quantity with time. The composition of domestic wastewater varies due to variations in the discharged amounts of substances and dilution with storm water. Wastewater components can be divided into three main groups; physical, chemical and biological. Physical pollutants are categorized as, solids, colour, odour, and conductivity, each of these categories might have chemical or biological sources and it can be removed by chemical or biological methods. Chemical pollutants can be organic or inorganic; the organic pollutants are more biodegradable and they can be categorized according to the rate of biodegradation into three categories; (1) readily biodegradable compounds which have low molecular weight and can be immediately metabolised by bacteria like, methanol, ethanol, volatile fatty acids, monosaccharides and lower amino acids; (2) slowly biodegradable compounds which can be hydrolysed by extracellular enzymes before they can be entered into the cell; and (3) Unbiodegradable compounds, which remain in the effluent after passing through the biological treatment process, and they can be dissolved or adsorbed to the flocs. Chemical pollutants can be found in settable, floatable, suspended or dissolved solids. Biological pollutants are cellular in nature and have a combination of organic and inorganic constituents. The discharge of organic pollutants causes oxygen depletion in the receiving waterbody, and discharge of nutrients such as phosphorous and nitrogen causes excess growth of algae that produce toxins and causes oxygen depletion in the receiving water (eutrophication). 2.2. Wastewater treatment In the wastewater treatment plant the contaminants are reduced to a certain allowable concentration. The basic principle of the wastewater treatment plant is to convert dissolved compounds into solids, which can be removed from the treated water. The treatment process is generally passing through series of stages as follows (Figure A). Primary treatment is a physical process to separate coarse and floating solids, gravels and grasses during the passage of wastewater through a bar screen, generally followed by primary settling in tanks allowing larger particles to settle. The settled particles receive further treatment as sludge, the remaining wastewater flows into the next stage. Secondary treatment is based on biological and/or chemical processes which are used to remove organic matter and nutrients such as nitrogen and phosphorous. Organic matter can be removed by metabolic activities of microorganisms. Nitrogen is mainly removed biologically whereas phosphorus can be removed biologically and by chemical precipitation. Bioreactors are mostly compartmentalized to provide three environmental zones suitable for the growth of certain species of microorganisms. The three zones are: the anaerobic zone, which has no dissolved oxygen, the anoxic zone, which has no dissolved oxygen but has nitrate and/or nitrite; and the aerobic zone, which has dissolved oxygen. In biological treatment the bacteria grow either suspended in aggregates, which are known as activated sludge flocs, or in biofilms. The most common method is the activated sludge process, which is based on suspended growth of bacteria.

10
Tertiary treatment is a physicochemical process to further reduce the inorganic nutrients such as nitrogen and phosphorous, suspended particles, and disease causing organisms from the effluent. It can include filtration, precipitation and chlorination.
Figure A: Schematic view of a conventional wastewater treatment plant 2.3. The activated sludge process The activated sludge process is a biological method for wastewater treatment that is performed by a variable and mixed community of microorganisms. The carbonaceous organic matter in the wastewater provides an energy source for the production of new cells for a mixed population of microorganisms. The microbes convert carbon into cell tissue and oxidize the organic matter into carbon dioxide and water. In addition, microorganisms may exist in activated sludge that obtains energy by oxidizing ammonia nitrogen to nitrate nitrogen in the process known as nitrification. This process takes place if the solids retention time (SRT) of the sludge is long enough for these slow growing microorganisms to exist. The presence of anoxic zones are necessary for denitrifying bacteria to exist, i.e. the ones that convert nitrate or nitrite to nitrogen gas which is the last step in the biological nitrogen removal. Flocs are formed spontaneously when wastewater is aerated, and when the aeration is stopped the flocs starts to settle, and the supernatant can be discharged and the flocs can be reused to treat a new portion of wastewater (figure B). The ability of bacteria to form flocs that has a density higher than water enables separation of the sludge from the treated water, something which is used in the secondary settlers which is often the last treatment step in activated sludge plants. The success of the activated-sludge process depends on establishing a mixed community of microorganisms that will aggregate and adhere in a process known as bioflocculation. Different types of activated sludge solids separations problems occur, such as bulking sludge due to the excessive proliferation of filamentous bacteria, foaming due to growth of certain microorganisms and poor flocculation properties of the microorganisms. These problems often indicate an imbalance in the biological component of the process. In the ideal and healthy biological treatment system, filamentous organisms grow in low to moderate number within a floc (a large aggregate of floc-forming bacteria) and give it strength.

11
Figure B: Schematic view of the activated sludge process 2.4. Composition of the activated sludge flocs Activated sludge flocs are complexes of different living microorganisms (mainly bacteria), dead cells, undigested large organic fragments trapped in the flocs, and an inorganic fraction (Eikelboon and Buijsen, 1981) (figure C and D). The flocs contain approximately 30-40% inorganic matter and 60- 70% organic matter, of which the extracellular polymeric substances (EPS) compose about 50-60%. The organic fraction of the sludge contains approximately 50% protein, 20-30% humic substances, and 10-30% carbohydrate and the other organic fraction can be uronic acid and nucleic acid (Nielsen and Keiding, 1998). Protein and polysaccharide account for 75-89% of the EPS composition (Tsuneda et al., 2003).
Figure C: Activated sludge flocs images (taken by light microscope, 10x).

12
Figure D: Schematic drawing of the of the activated sludge floc. 2.5. The organisms in biological treatment plants A very diversified group of organisms are involved in the biological processes in treatment plants (Eikelboon and Buijsen, 1981). Not all organisms are identified, so it is only possible to list which species are present. Bacteria constitute the majority of the microorganisms present in activated sludge. Bacteria that require organic compounds for their supply of carbon and energy (heterotrophic bacteria) predominate; whereas bacteria that use inorganic compounds for cell growth (autotrophic bacteria) occur in proportion to concentrations of carbon and nitrogen. Both aerobic and anaerobic bacteria may exist in the activated sludge, but the preponderance of species is facultative, able to live in either the presence of or lack of dissolved oxygen. The main task of the bacteria is to degrade the dissolved organic matter and they contribute to the degradation of suspended organic matter through the production of extracellular enzymes (exoenzymes). Fungi are also constituent of activated sludge. These multicultural organisms metabolise organic compounds and can successfully compete with bacteria under certain environmental conditions in a mixed culture. Rotifers, and protozoans are also residents of activated sludge. The latter microorganisms are represented largely by ciliated species, but flagellated protozoans and amoebae may also be present. Protozoans graze on bacteria, fungi, algae and suspended organic matter and fulfil an important role for the secondary settling of the wastewater, they also serve as indicators of the activated sludge condition, and ciliated species are instrumental in removing Escherichia coli from sewage. Additionally, viruses of human origin may be found in raw sewage influent, but a large percentage appears to be removed by the activated sludge process.

13
2.6. Extracellular polymeric substances (ESP) Extracellular polymeric substances (EPS) or exopolymers are construction materials of microbial aggregates in activated sludge flocs or biofilms. EPS are different classes of macromolecules such as polysaccharides, proteins, nucleic acids, phospholipids and other polymeric compounds which fill and form the spaces between the microbial cells in the activated sludge flocs (Garnier et al., 2005), and they contain various functional groups including carboxyl, amino and phosphate groups (Tsuneda et al., 2003). The EPS keep the organisms together in a three-dimensional gel like hydrated matrix by week physicochemical interactions such as electrostatic, hydrophobic, Van der Waals and hydrogen interactions (Garnier et al., 2005). The exact function of the EPS is not completely explained and clarified because of its extremely heterogeneous nature (Tsuneda et al., 2003). The physicochemical properties of EPS enable them to play an important role in sludge flocculation and settling properties (Garnier et al., 2005), and they play a significant role in formation and function of microbial aggregates, including adhesion phenomena, matrix structure formation and microbial physicochemical process (Tsuneda et al., 2003). It has been suggested that polysaccharides play a major role in flocculation due to their negatively charged groups that are bridged by divalent cations. In many studies, proteins are found to be the main component within the sludge with a 4-5-protein-to-polysaccharide ratio and it has been found that they play a role in floc formation. The role of protein for the floc formation is explained by hydrophobic interactions and polyvalent cation bridge, both enhancing the stability of biopolymers network. EPS play an important role in the structure and water retention of activated sludge and biofilms (Neyens et al., 2003). 2.7. Factors affecting deflocculation and suspended solids in effluents 2.7.1 Temperature It has been found that sludge deflocculation increases and the flocculation physicochemical properties deteriorate under temperature shift from 30ºC – 45ºC (Morgan-Sagastume and Allen, 2005). They found that, up-shifts in temperature from 35ºC to 45ºC had three major effects; an increase in effluent soluble chemical oxygen demand (SCOD) and effluent suspended solids (ESS) concentrations and deterioration of the sludge settling characteristics such as poorer sludge compressibility and settleability, high sludge volume index (SVI) and settleability (low zone settling velocity) by promoting filament proliferation. They also found that, the temperature shifts and periodic temperature oscillation (31.5ºC - 40ºC) causes a more negatively charged sludge, a shift in filamentous organism population and a reduction in protozoan/metazoan concentration and diversity (Morgan-Sagastume and Allen, 2003). It has also been found that decreased microbial activity caused by a temperature reduction leads to increased deflocculation of activated sludge (Wilén et al., 2000). 2.7.2. Ion effect Previous studies show that the ion strength has a major effect on flocculation and deflocculation of activated sludge flocs. It has been found that the floc structure stability and sludge settleability increase by addition of divalent cations (Ca2+and Mg2+) to the sludge and it was explained that those cations play an important role in improving bioflocculation by cationic bridges. More compact flocs and stronger floc structure were obtained by magnesium enrichment (Morgan-Sagastume and Allen, 2005), and the addition of potassium (0.1 g/l)

14
created a noticeable improvement of sludge settleability and lead to the inhibition of microfloc formation (Muller, et al., 2002). Settling and dewatering properties have been found to be improved through the addition of calcium and magnesium, and a considerable improvement in the floc density was observed through the addition of magnesium, whereas high concentrations of sodium ions and low concentration of divalent cations in the influent of wastewater treatment plant were observed in the sludge of poor settling and dewatering properties (Murthy et al., 1999). Iron has also been found to affect floc stability. Reduction of Fe (III) to Fe (II) can take place under anaerobic conditions (Wilén et al., 2000). It has been found that Fe (III), which is produced as a result of oxidation of Fe (II), has a minor role in reflocculation and improvement of flocculation properties (Wilen et al., 2004). However, removing Fe (III) from the sludge matrix by adding sulphide results in strong deflocculation. This phenomenon was explained due to either lack of aerobic microbial activity or due to change in the local physicochemical conditions mediated by anaerobic microbial activity (Wilen et al., 2000). Furthermore, iron should be linked to the flocculation in a similar way as calcium and magnesium and therefore Fe(III) should form stronger bridges to the EPS than Fe(II). 2.7.3. Shear forces Hydrodynamic shear exists in all biological wastewater treatment systems as a result of aeration and mechanical mixing. It plays a very important role in the formation of aerobic granules (Liu and Tay, 2002), where weak hydrodynamic shear did not lead to the formation of aerobic granules while higher shear lead to formation of more compact, rounder smaller and stronger aerobic granules (Garnier et al., 2005). A similar effect on aggregate characteristics is probably also seen for activated sludge flocs. The hydrodynamic shear is also important in microbial attachment and self-immobilization processes; mild shear provides a favourable condition for attachment of the microbial cells (Liu and Tay, 2002) as well as mild shear (400-600 rpm) results in larger floc size and lower sludge volume index (SVI)(Liu et al., 2005). The increase in shear rate, leads to floc breakage as either erosion or fragmentation (Jarvis et al., 2005). The sludge production rate decreases with the increasing shear rate while the exopolysaccharide production of the microbial cells increase with shear rate (Liu and Tay, 2002). 2.7.4. Anaerobic conditions Previous studies have shown that the activated sludge deflocculates when it is exposed to anaerobic conditions (Wilen et al., 2000). It was explained as growth of anaerobic or facultative anaerobic bacteria between the flocs or dying of aerobic organisms in the flocs. The inhibition of the eucariotic population or an inhibition of extracellular polymer production results in an increase in deflocculation and turbidity under anaerobic conditions. Besides, the hydrolysis of organics in the EPS matrix, which takes place under anaerobic conditions, may lead to degradation of the floc matrix. Biological reduction of Fe (III) by microorganisms under anaerobic conditions is another important cause for deflocculation (Nielsen et al., 1996).

15
3.0. Chapter three: Experimental work (Materials and Methods) 3.1. Activated sludge samples The activated sludge was taken from the Rya wastewater treatment plant (WWTP) in Göteborg, Sweden. The Rya WWTP, serving about 750 000 pe, is an activated sludge treatment plant designed for biological nitrogen removal utilizing pre-denitrification and post-nitrification in a trickling filter (Balmér et al., 1998). Phosphorus is removed by chemical precipitation by ferrous sulphate (FeSO4). The plant is operated at a low solids retention time (SRT), 2-4 days. The flow to the plant varies considerably from 175,000 to 1,425,000 m3/d with an average daily flow of about 350,000 m3/d). The sludge samples were brought immediately to the laboratory, located at the WWTP, after sampling and the experiments were carried out directly thereafter. 3.2. Experimental set up The activated sludge was thickened twice to get higher turbidity in the supernatant during the shear test and to obtain a clear difference during the deflocculation of the activated sludge flocs. Three-litre reactors filled up with 2 litre of sludge were used in the experimental study, 132 mm in diameter with 4 baffles (14 mm wide) to maintain a homogenous shearing of the activated sludge (Figure E). A pitch bladed paddle (∅ 45 mm, projected area 15.27 cm2) was placed 1.5 cm from the bottom of the reactor, and an electronic mixer was controlling its speed. The stirring speed was fixed at 700 rpm to create a G-value of 1700 s-1 during the whole experimental period. The reactors were sealed with covers to avoid oxygen coming in from the surface. Air was bubbled into the reactors to obtain aerobic conditions, while compressed nitrogen was bubbled to obtain anaerobic conditions. Each experiment, under either aerobic or an aerobic conditions, was carried out in duplicate. Aliquots were taken with a syringe from the reactors and centrifuged in a centrifuge tube at 2100 rpm for 2 minutes to leave only single bacteria and small floc fragments in the supernatant. The turbidity was measured as the absorbance of the supernatant at 650 nm with a spectrophotometer. The experiments were performed in two parallel reactors; the first one was used as a test reactor, which was exposed to different low temperatures (5°C, 10°C and 15°C) and a moderate high temperature (30°C). The other reactor was operated as a reference reactor at ambient temperature (20°C). The target temperature of the activated sludge in the test reactor was obtained by placing the reactor in a temperature controlled water bath. A U-shaped steel pipe was inserted into the reactor and water from the water bath was pumped through to speed up the transmission of the heat or cold from the water bath to the activated sludge inside the reactor. The reactors were run for 3 hours including two phases: Start up phase: during this phase, the sludge was stirred at low speed, 100 rpm, with bubbling of air under aerobic conditions and nitrogen gas under anaerobic conditions, for one hour to obtain the target temperature. Testing phase: after obtaining the target temperature the stirring speed was increased to 700 rpm and 10 samples were taken during regular intervals for 2 hours; 10 minutes interval between the first seven samples and 20 minutes between each of the three last samples.

16
Figure E: Schematic view of the test activated sludge reactor (3 litre reactor filled up with 2 litres of sludge). The reference reactor is identical to the test reactor, but without heat regulator. Turbidity measurements and filtration The turbidity was measured on the spectrophotometer as the absorbance at 650 nm after 2 minutes of centrifugation at 2100 rpm. After removing the residual solids by centrifugation, half of the supernatant was filtered through 0.45-µm filters to analyse the dissolved biopolymers (protein, humic substances and carbohydrate), whereas the rest was left without filtration to analyse the total biopolymers. Both filtrated and unfiltrated samples were frozen immediately to avoid the biological degradation of biopolymers. Dissolved oxygen, conductivity and pH measurements Dissolved oxygen concentration was measured to make sure that the oxygen was present during the aerobic period and absent during the anaerobic period at the end of each experiment. Conductivity and pH were measured at the end of each experiment. 3.3. Analytical methods for biopolymers measurements (composition of turbidity and sludge) The frozen supernatant was defrosted and analysed for biopolymers (carbohydrates, proteins and humic substances) as dissolved and total fractions. The total sludge were defrosted, homogenized, by using the ultrasonic devise (2 minutes for each sample with range between 60-100W), and measured for total carbohydrates, protein and humic substances (total sludge was diluted 20 times for measuring protein and humus and 10 times for measuring carbohydrates). Carbohydrates were determined by using the anthrone method, with glucose standard as described by (Frølund et al., 1996). Protein and humic substances were determined by a modified Lowry method (Frølund et al., 1996). All samples were measured in duplicate.

17
3.4. Preparation of samples for Ions measurement by using ICP-MS Sludge samples The cations in the total sludge and filtrated supernatant were measured as follows: The sludge samples were homogenized and diluted 25 times. Concentrated HNO3 (0.8 ml) and milliQ water (7.2 ml) were added to 2 ml homogenised sludge in a glass test tub. The sludge was then digested at 120°C for 2 hours by using HACH method. The samples were filtered through 0.45 µm filters. The samples were then diluted 100 times (9.9 ml milliQ water was added to 100µl from the filtered samples) and 100µL of 0.1mg/l internal standard (Rh) and 100µL of concentrated nitric acid (69%) were added. The ions measured by using ICP-MS. Total iron in the total sludge was analysed by ICP_MS and by Ferrozine/Hepes method. Filtrated supernatant samples The filtrated supernatant samples were prepared without digestion as follows: 100µl supernatant sample, 100µl internal standard (0.1mg/L Rh) and 100µl concentrated nitric acid were mixed in a test tube, then 9.7ml milliQ water was added. 3.5. Test and control experiments Shear Test Deflocculation at different shear intensities (300rpm, 500 rpm, 700 rpm and 900 rpm) and two different temperatures (20°C and 10°C) were investigated under aerobic conditions for 1 hour before the experiments were curried out, to select the suitable stirring level which gives a stable development in turbidity. Control tests Three control experiments were performed in order to help in the interpretation of some results. The control experiments were: 1) Sodium azide addition (NaN3) Sodium azide, an inhibitor which stops the microbial activity, was added as described below to assess the relative effect on the physical sludge properties, mainly viscosity, of the drop in temperature from 20 to 5°C. The reference reactor and the test reactors were run at room temperature 20°C and 5°C, respectively. A mixture of 2 g NaN3 dissolved in 25 ml milliQ water was added to each reactor. Both reactors were aerated for 1 hour at low stirring speed of 100 rpm, and then the shear speed increased to 700 rpm for 2 hours and samples were taken during regular intervals and centrifuged as described earlier. 2) Deflocculation under aerobic and anaerobic conditions at the same temperature (5°C) Two reactors were run at 5°C and 700 rpm; the first was run under aerobic conditions and the other under anaerobic conditions, for 2 hours after the ending of the start up phase. This experiment was carried out in order to check out the effect of aerobic and anaerobic conditions on the degree of deflocculation when the biological activity was negligible. 3) pH control test Four different shear experiments were carried out at different pH (7, 7.5, 8 and 8.5) to assess its impact on deflocculation of the activated sludge. It was observed that the activated sludge deflocculated more under anaerobic conditions than under aerobic conditions, at the same time as it was observed that the pH increased more at the end of the anaerobic experiment

18
than under aerobic conditions. Activated sludge flocs reactors were run at room temperature (20°C) and stirring speed of 700 rpm, for 2 hours after the start up phase. The pH was adjusted during the test phase (2 hours) by using 0.5M HCl and 0.5M NaOH.

19
4.0. Chapter four: Results and Discussion The effects of either decreasing the temperature (5ºC, 10ºC and 15ºC) or increasing it to a moderate high temperature (30ºC), on the degree of deflocculation of the activated sludge were investigated in short-term experiments (2 hours) under both aerobic and anaerobic conditions. The results from the different tests are summarized in the following paragraphs. 4.1. Deflocculation under aerobic and anaerobic conditions at different temperature When activated sludge acclimatized to a temperature of about 20ºC was exposed to different low temperatures (5ºC, 10ºC and 15ºC) under aerobic conditions, the flocs deflocculated significantly more compared to at 20ºC (Figure 1a, c, e). When the same experiments were carried out under anaerobic conditions, it was found that the activated sludge flocs deflocculated more at 20ºC than at 5ºC, 10ºC and 15ºC (Figure1b, d, f). The difference in deflocculation development between all tested low temperatures (5ºC, 10ºC and 15ºC) and the reference reactor operated at 20ºC was much higher under anaerobic conditions than under aerobic conditions. This indicates that anaerobic conditions have a relatively larger effect on the floc stability than exposure to low temperatures. Since the experiments were carried out on different days, the deflocculation curves cannot be directly compared since the sludge floc structure could have been different. However, the degree of deflocculation was always higher for the anaerobic conditions. For anaerobic conditions it was found that the difference in deflocculation development started to occur after about one hour of shear whereas for the aerobic conditions a difference was observed right from the beginning of the shearing, and this difference became higher after two hours under anaerobic conditions. This result indicates that there is some lag phase before the anaerobic microbial activity is started. The results show that even a minor decrease in temperature leads to an increased deflocculation. The standard deviation was very small for most duplicated experiments carried out under both aerobic and anaerobic conditions. A slight increase in standard deviation was observed when the activated sludge flocs were exposed to 5°C under both aerobic and anaerobic conditions.

20
Deflocculation under aerobic conditions at 5oC
00.0050.01
0.0150.02
0.0250.03
0.0350.04
0 50 100 150
Time(min)
ABS
/ MLS
S
20ºC
5ºC
Deflocculation under anaerobic conitions at 5ºC
00.010.020.030.040.050.060.070.080.090.1
0 50 100 150Time (min)
ABS
/ MLS
S
20ºC
5ºC
a) b)
Deflocculation under aerobic conditions at 10oC
0
0.005
0.01
0.015
0.02
0.025
0.03
0 50 100 150
Time (min)
ABS
/ MLS
S
20ºC
10ºC
Deflocculation under anaerobic conitions at 10ºC
00.010.020.030.040.050.060.070.080.090.1
0 50 100 150Time (min)
ABS
/ MLS
S
20ºC
10ºC
c) d)
Deflocculation under aerobic conditions at 15oC
0
0.005
0.01
0.015
0.02
0.025
0.03
0 50 100 150
Time (min)
ABS
/ MLS
S
20ºC
15ºC
Deflocculation under anaerobic conitions at 15ºC
00.010.020.030.040.050.060.070.080.090.1
0 50 100 150Time (min)
ABS
/ MLS
S 20ºC
15ºC
e) f)
Deflocculation under aerobic conditions at 30oC
00.0050.01
0.0150.02
0.0250.03
0.035
0 50 100 150
Time(minute)
ABS
/ MLS
S
20ºC
30ºC
Deflocculation under anaerobic conitions at 30ºC
0
0.02
0.04
0.06
0.08
0.1
0.12
0.14
0 50 100 150Time (min)
ABS
/ MLS
S 20ºC
30ºC
g) h)

21
Figure 1 Deflocculation under aerobic and anaerobic conditions under different temperatures (a) aerobic conditions and 5 °C; (b) anaerobic conditions and 5°C; (c) aerobic conditions and 10°C; (d) anaerobic conditions and 10°C; (e) aerobic conditions and 15°C; (f) anaerobic conditions and 15°C; (g) aerobic conditions and 30°C; and (h) anaerobic conditions and 30°C. The results show that the differences in the absorbance/mixed liquor suspended solid (absorbance at 750nm/MLSS) between the test reactor and reference reactor under aerobic conditions were rather similar for activated sludge exposed to 5°C and to 30°C (Figure 2a, 1g), so it could be concluded that low temperature (5°C) and a moderate high temperature (30°C) have similar effects on deflocculation under aerobic conditions. However, the differences were significantly higher at 30°C than at 5°C under anaerobic conditions (Figure 2b). This indicates that the sludge flocs deflocculate slightly more at 5°C than at a moderate high temperature (30°C) and ambient temperature (20°C) under aerobic conditions, while the sludge flocs deflocculated substantially more at high temperature (30°C) than at 5°C and other low temperature (10°C and 15°C) under anaerobic conditions. The differences between the reference and test reactors showed that the sludge flocs deflocculated more at ambient temperature (20°C) than at all low temperatures under anaerobic conditions. The difference in absorbance values between the test and reference reactor increased with decreasing temperature under aerobic conditions. On the contrary, for the experiments carried out at anaerobic conditions, the difference in turbidity was negative which means that the flocs deflocculated less at decreased temperatures (Figure 2b). At increased temperature (30°C) the difference was positive showing an increased deflocculation at higher temperatures.
Differences between test reactor and reference reactors of the aerobic
0
0.002
0.004
0.006
0.008
0.01
0 50 100 150
Time(min)
diff
eren
ces(
AB
S./M
LS
5°C
10°C
15°C
30°C
Differences between test reactor and reference reactors of the anaerobic
-0.04
-0.02
0
0.02
0.04
0 50 100 150
Time(min)
diff
eren
ces(
AB
S./M
LSS)
5ºC
10ºC
15ºC
30ºC
a) b)
Figure 2: Differences in absorbance at 650 nm/mixed liquor suspended solid (MLSS) between the test reactor and reference reactor under (a) aerobic condition; and (b) anaerobic conditions. 4.2. Composition of the eroded fractions 4.2.1. Total eroded biopolymers The analysis of the supernatant during the deflocculation of the activated sludge flocs at the different low temperatures (5ºC, 10ºC and 15ºC) showed that the concentration of total biopolymers (i.e. the total composition of the supernatant which includes the dissolved fraction) has the same trend as the turbidity under both aerobic conditions and anaerobic conditions. The concentration of the total biopolymers, protein, carbohydrates and humic substances, were higher at 5ºC, 10ºC and 15ºC than at 20ºC under aerobic conditions, while their concentration were higher at 20ºC than at 5ºC, 10ºC and 15ºC under anaerobic

22
conditions. Higher concentration values were found for all total fractions under anaerobic conditions. It was observed in the sludge that was exposed to different low temperatures (5ºC, 10ºC and 15ºC) under aerobic conditions, that the difference in concentration of humic substances (Figure 4a, c, e) and carbohydrates between the test reactor and the reference reactor (Figure 5a, c, e) was relatively small. For the anaerobic conditions, there was a larger difference in the total concentration between test reactor and reference reactor for all biopolymers. However, there was a larger difference in concentration of protein and humic substances at the different low temperatures (5ºC, 10ºC and 15ºC). It was found that the concentration of particulate biopolymers present in the supernatant during the deflocculation at a high temperature (30ºC) corresponded well to the turbidity under both aerobic and anaerobic conditions. The concentrations for all particulate biopolymers were higher at 30ºC under anaerobic conditions than under aerobic conditions. Furthermore, the concentrations of biopolymers were higher under both aerobic and anaerobic conditions at high temperature (30ºC) than at the three different low temperatures. At high temperature the biopolymer concentration showed the same trend under both aerobic and anaerobic conditions, i.e. the sludge deflocculated more at 30ºC than at 20ºC (figures 3g,h, 4g,h, 5g,h). A slight difference in the development of the concentration of humic substances was observed under aerobic conditions at 30ºC (figure 4g), whereas a significantly higher difference was found for the protein and carbohydrates (Figures 3g and 5g). The relative concentration of the total fractions was higher under anaerobic conditions at 30°C than at 5°C, 10°C and 15°C. The standard deviation of the concentrations of total biopolymers of the two duplicated experiments was very small under both aerobic and anaerobic conditions at 10, 15 and 20°C and at 30°C, whereas it was a bit larger at 5°C under both aerobic and anaerobic conditions. The highest differences in concentrations were found for 30°C for both aerobic and anaerobic conditions.

23
Total protein conc. at 5ºC compared with the reference,under aerobic conditions
0
12
34
5
67
89
10
0 50 100 150
Time (min)
Prot
ien
conc
. (m
g/g
MLS
S) 20ºC
5ºC
Total protein conc. at 5ºC compared w ith the reference,under anaerobic conditions
02468
101214161820
0 50 100 150Time (min)
Prot
ien
conc
. (m
g/g
MLS
S)
20ºC
5ºC
a) b)
Total protein conc. at 10ºC compared w ith the reference,under aerobic conditions
012345678
0 50 100 150Time (min)
Prot
ien
conc
. (m
g/g
MLS
S)
20ºC
10ºC
Total protein conc. at 10ºC compared w ith the reference,under anaerobic conditions
02468
101214161820
0 50 100 150Time (min)
Prot
ien
conc
. (m
g/g
MLS
S)
20ºC
10ºC
c) d)
Total protein conc. at 15ºC compared w ith the reference,under aerobic conditions
0123456789
0 50 100 150Time(min)
Prot
ien
conc
. (m
g/g
MLS
S)
20ºC
15ºC
Total protein conc.at 15ºC compared w ith the reference,under anaerobic conditions
0
5
10
15
20
25
30
0 50 100 150Time(min)
Prot
ien
conc
. (m
g/g
MLS
S))
20ºC
15ºC
e) f)
Total protein conc. at 30ºC compared with the reference,under aerobic conditions
0
2
4
6
8
10
0 50 100 150
Time(min)
Prot
ien
conc
. (m
g/g
MLS
S)
20ºC
30ºC
Total protein conc. at 30ºCcompared w ith the reference,under anaerobic conditions
0
5
10
15
20
25
30
0 50 100 150Time(min)
Prot
ien
conc
. (m
g/g
MLS
S)
20ºC
30ºC
g) h) Figure 3 Concentration of total protein in the organic fraction of the supernatant (a) aerobic conditions and 5 °C; (b) anaerobic conditions and 5°C; (c) aerobic conditions and 10°C; (d) anaerobic conditions and 10°C; (e) aerobic conditions and 15°C; (f) anaerobic conditions and 15°C; (g) aerobic conditions and 30°C; and (h) anaerobic conditions and 30°C.

24
Total Humus conc. At 5ºC compared with the reference,ander aerobic conditions
00.5
11.5
22.5
33.5
44.5
0 50 100 150Time (min)
Hum
us c
onc.
(mg/
g M
LSS)
20ºC
5ºC
Total Humus conc. at 5ºC compared w ith the reference,ander anaerobic conditions
02468
101214
0 50 100 150
Time (min)
Hum
us c
onc.
(mg/
l)
20ºC
5ºC
a) b)
Total Humus conc. At 10ºC compared with the reference,ander aerobic conditions
0
1
2
3
4
5
0 50 100 150Time (min
Hum
us c
onc.
(mg/
g M
LSS)
20ºC
10ºC
Total Humus conc. at 10ºC compared with the reference,ander anaerobic conditions
0
2
4
6
8
10
12
14
0 50 100 150Time (min)
Hum
us c
onc.
(mg/
l)
20ºC
10ºC
c) d)
Total Humus conc. At 15ºC compared with the reference,ander aerobic conditions
0
1
2
3
4
5
0 50 100 150
Time (min)
Hum
us c
onc.
(mg/
g M
LSS)
20ºC
15ºC
Total Humus conc. at 15ºC compared with the reference,ander anaerobic conditions
02468
10121416
0 50 100 150
Time (min)
Hum
us c
onc.
(mg/
l)
20ºC
15ºC
e) f)
Total Humus conc. At 30ºC compared with the reference,ander aerobic conditions
0
1
2
3
4
5
6
0 50 100 150
Time (min)
Hum
us c
onc.
(mg/
g M
LSS)
20ºC
30ºC
Total Humus conc. at 30ºCcompared with the reference,ander anaerobic conditions
0
5
10
15
20
25
0 50 100 150Time (min)
Hum
us c
onc.
(mg/
l) 20ºC
30ºC
g) h) Figure 4 Concentration of total humic substances in the organic fraction of the supernatant (a) aerobic conditions and 5 °C; (b) anaerobic conditions and 5°C; (c) aerobic conditions and 10°C; (d) anaerobic conditions and 10°C; (e) aerobic conditions and 15°C; (f) anaerobic conditions and 15°C; (g) aerobic conditions and 30°C; and (h) anaerobic conditions and 30°C.

25
Total carbohydrate concentration at 5ºC compared with the reference,under aerobic conditions
0
0.5
1
1.5
2
2.5
3
0 50 100 150
Time (min)
Car
bohy
drat
e co
nc. (
mg/
g M
LSS)
20ºC
5ºC
Total carbohydrate conc. at 5ºC compared with the reference,ander anaerobic conditions
0
1
2
3
4
5
6
0 50 100 150
Time (min)
Car
bohy
drat
e co
nc. (
mg/
g M
LSS) 20ºC
5ºC
a) b)
Total carbohydrate concentration at 10ºC compared w ith the reference,under aerobic conditions
0
0.5
1
1.5
2
2.5
3
0 50 100 150Time (min)
Car
bohy
drat
e co
nc. (
mg/
gM
LSS)
20ºC
10ºC
Total carbohydrate conc. at 10ºC compared w ith the reference,ander anaerobic conditions
0
1
2
3
4
5
6
0 50 100 150Time (min)
Car
bohy
drat
e co
nc. (
mg/
gM
LSS) 20ºC
10ºC
c) d)
Total carbohydrate concentration at 15ºC compared with the reference,under aerobic conditions
00.5
11.5
22.5
33.5
0 50 100 150
Time (min)
Car
bohy
drat
e co
nc. (
mg/
gM
LSS)
20ºC
15ºC
Total carbohydrate conc. at 15ºC compared w ith the reference,ander anaerobic conditions
0
1
2
3
4
5
6
7
0 50 100 150Time (min)
Car
bohy
drat
e co
nc. (
mg/
gM
LSS)
20ºC
15ºC
e) f)
Total carbohydrate concentration at30ºC compared with the reference,under aerobic conditions
00.5
11.5
22.5
33.5
4
0 50 100 150
Time (min)
Car
bohy
drat
e co
nc.
(mg/
g M
LSS) 20ºC
30ºC
Total carbohydrate conc. at30ºC compared with the reference,ander anaerobic conditions
012345678
0 50 100 150Time (min)
Car
bohy
drat
e co
nc. (
mg/
gM
LSS)
20ºC
30ºC
g) h) Figure 5 concentration of total carbohydrates in the organic fraction of the supernatant (a) aerobic conditions and 5 °C; (b) anaerobic conditions and 5°C; (c) aerobic conditions and 10°C; (d) anaerobic conditions and 10°C; (e) aerobic conditions and 15°C; (f) anaerobic conditions and 15°C; (g) aerobic conditions and 30°C; and (h) anaerobic conditions and 30°C.

26
The calculations of the ratio between the different fractions protein:humic substances: carbohydrate in the eroded total biopolymers in the supernatant are summarized in Table 1. It can be seen that there was relatively more total protein in the supernatant under both aerobic and anaerobic conditions at all the examined low and high temperatures. The was relatively more proteins and humic substances in the supernatant at low temperatures (5ºC and 10ºC) than at high temperature (30ºC), whereas the opposite were observed under anaerobic conditions. The ratios between the protein, carbohydrates and humic substances were roughly the same under aerobic and anaerobic conditions at 5ºC. The particles deflocculated under anaerobic conditions at 10ºC, 15ºC and 30ºC contain relatively more protein and humic substances than particles deflocculated under aerobic conditions at the same temperatures. More protein and humic substances were released under aerobic conditions at 5ºC than at 30ºC, while the opposite was observed under anaerobic conditions. When looking at the protein:humic substances:carbohydrate ratio for the total sludge, it contained relatively more protein and less humic substances. The ratio of the total humic substances released into the supernatant under aerobic conditions was close to ratios of the humic substances in the total sludge at all temperatures. The ratios of the total protein released into the supernatant under both aerobic and anaerobic conditions were lower than its ratios in the total sludge. Table 1 Ratio between the total eroded biopolymers in the supernatant after 2 hours under both aerobic and anaerobic conditions at different temperatures. Ratio under aerobic conditions Ratio under anaerobic conditions
Temperature Total Protein
Total Humus
Total Carbohydrate
Total Protein
Total Humus
Total Carbohydrate
5ºC 3.3481 1.4634 1 3.1019 1.5725 1 10ºC 2.9013 1.5676 1 3.2324 1.9446 1 15ºC 2.6438 1.3192 1 4.0612 2.1605 1 20°C 2.7457 1.5209 1 3.6409 2.2484 1 30ºC 2.5451 1.2426 1 3.7634 2.6455 1 Table 2 Ratio of the total biopolymers in the total sludge Ratio under aerobic conditions Ratio under anaerobic conditions
Temperature Total Protein
Total Humus
Total Carbohydrate
Total Protein
Total Humus
Total Carbohydrate
5ºC 4.1105 1.4684 1 4.5633 1.4509 1 10ºC 4.1921 1.4563 1 4.3204 1.3155 1 15ºC 5.1029 1.1459 1 3.9777 1.3615 1 30ºC 4.8671 1.6487 1 5.8675 1.2572 1 The concentration of the compounds protein, humic substances and carbohydrate were well correlated to the turbidity that is seen as high values of the regression coefficient r2 (Figure 6). When looking at the correlations for the different compounds it can be seen that the correlation for the lowest temperature (5°C) deviated from the other temperatures, especially for experiments carried out at aerobic conditions; the turbidities were relatively higher for the different concentrations compared to at higher temperatures. For the anaerobic conditions, similar but smaller differences were observed for protein and humic substances. These results indicate that the different compounds are released differently at different temperatures.

27
Total protein concentration at different temperatures under aerobic conditions
compared with turbidity
y = 0.0042x(5°C)R2 = 0.9118
y = 0.0033x(15°C)R2 = 0.9269
y = 0.0032x(30°C)R2 = 0.946
y = 0.0031x(10°C)R2 = 0.8956
0
0.01
0.02
0.03
0.04
0 2 4 6 8 10
total protein concentration(mg/g)
Turb
idity
/g M
LSS
5°C10°C
15°C30°C
Total protein concentration at different temperatures under anaerobic conditions
compared w ith turbidity
y = 0.0041x(5°C)R2 = 0.9548
y = 0.0036x(10°C)R2 = 0.8194
y = 0.003x(15°C)R2 = 0.8213
y = 0.0042x(30°C)R2 = 0.9068
00.020.040.060.080.1
0.120.14
0 10 20 30
Total protein concentration(mg/g)
Turb
idity
/g M
LSS
5°C10°C15°C30°C
a) b)
Total humus concentration at different temperatures under aerobic conditions
compared with turbidity
y = 0.0087x(5°C)R2 = 0.8037
y = 0.0057x(10°C)R2 = 0.6638
y = 0.0057x(15°C)R2 = 0.5933
y = 0.0056x(30°C)R2 = 0.55940
0.01
0.02
0.03
0.04
0 1 2 3 4 5
Total humus concentration(mg/g)
Turb
idity
/g M
LSS
5°C10°C15°C30°C
Total humus concentration at different temperatures under anaerobic conditions
compared w ith turbidity
y = 0.0088x(5°C)R2 = 0.8786
y = 0.0066x(10°C)R2 = 0.834
y = 0.0058x(15°C)R2 = 0.8672
y = 0.0066x(30°C)R2 = 0.9432
0
0.05
0.1
0.15
0 5 10 15 20 25
Total humus concentration(mg/g)
Turb
idity
/g M
LSS
5°C10°C15°C30°C
c) d)
Total carbohydrates concentration at different temperatures under aerobic conditions
compared with turbidity
y = 0.0145x(5°C)R2 = 0.9069
y = 0.0088x(10°C)R2 = 0.5431 y = 0.0083x(15°C)
R2 = 0.664y = 0.0082x(5°C)
R2 = 0.9020
0.01
0.02
0.03
0.04
0 1 2 3 4
Total carbohydrate concentration(mg/g)
Turb
idity
/g M
LSS
5°C10°C15°C30°C
Total carbohydrates concentration at different temperatures under anaerobic conditions
compared with turbidity
y = 0.0138x(5°C)R2 = 0.9464
y = 0.0122x(10°C)R2 = 0.8824
y = 0.0124x(15°C)R2 = 0.8125
y = 0.0161x(30°C)R2 = 0.8926
0
0.05
0.1
0.15
0 2 4 6 8
Total carbohydrates concentration(mg/g
Turb
idity
/g M
LSS
5°C
10°C
15°C
30°C
e) f) Figure 6 Correlation between total biopolymer fraction and turbidity under aerobic and anaerobic conditions (a) total protein under aerobic conditions; (b) total protein under anaerobic conditions; (c) total humic substances under aerobic conditions; (d) total humic substances under anaerobic conditions; (e) total carbohydrate under aerobic conditions; (f) total carbohydrate under anaerobic conditions. 4.2.2. Dissolved eroded biopolymers It was observed that the dissolved biopolymers (protein, humic substances and carbohydrates) were released more at 20°C than at 5°C, 10°C and 15°C under aerobic conditions (figure 7a,c, e, 8a,c, e, 9a,c, e). This could be interpreted as the dissolved fractions were more firmly bound to the flocs than the particulate fractions at lower temperatures. The concentrations of dissolved polymers were also higher at 30°C than at 20°C. The reason to why the concentrations of biopolymers were higher in the reference reactor operated at 20°C could be that the polymers dissolve better at higher temperatures due to a lower viscosity. The difference in concentration development was lesser for dissolved protein than for dissolved humic substances and carbohydrates at 5ºC, 10°C and 15°C under aerobic conditions (figure

28
7a, 8a and 9a). The dissolved biopolymers followed the turbidity curve for anaerobic conditions and they were always higher at 20°C than at 5°C, 10°C and 15°C (figures 10b,d,f). No such correlation was observed for aerobic conditions (10a,c,e). The concentration also increased relatively more under anaerobic conditions than under aerobic conditions. The concentration of dissolved biopolymers did not change much under aerobic conditions at low temperatures; they only increased slightly with shearing time, and it was observed that the concentrations were much higher under anaerobic conditions than under aerobic conditions from starting point until terminating the experiments. This indicates that the anaerobic processes occurring gives rise to a weaker floc structure and hence a higher release of polymers to the bulk phase. The results show that the concentration of dissolved biopolymers has the same trend as the turbidity under both aerobic and anaerobic conditions at high temperature (30ºC). The concentrations were substantially higher under anaerobic conditions than under aerobic conditions. Furthermore, the concentration of the dissolved fractions were higher at 30°C than at low temperature (5°C, 10°C and 15°C) and ambient temperature (20ºC). The difference in the development of dissolved protein, humic substances and carbohydrate concentration between test and reference reactors was higher under anaerobic conditions than under aerobic conditions. The concentration of dissolved protein and humic substances remained approximately constant during the whole experimental period under aerobic conditions at high temperature (30ºC) in a similar way as at low temperature, while there was a noticeable increase in the concentration of dissolved carbohydrate (figure 9g). The standard deviation of the concentrations of dissolved biopolymers of the two duplicated experiments was very small under both aerobic and anaerobic conditions. It was, however, obviously larger at 5ºC under both aerobic and anaerobic conditions.
Dissolved Protein concentration at 5ºC compared with the reference,under aerobic conditions
00.20.40.60.8
11.21.41.6
0 50 100 150
Time (min)
Prot
ein
conc
. (m
g/g
MLS
S)
20ºC
5ºC
Dissolved protein conc. at 5oC compared with the reference,under anaerobic conditions
0
0.5
1
1.5
2
2.5
3
3.5
0 50 100 150Time (min)
Prot
ein
conc
. (m
g/g
MLS
S)
20ºC
5ºC
a) b)
Dissolved Protein concentration at 10ºC compared w ith the reference,under aerobic conditions
00.20.40.60.8
11.21.41.6
0 50 100 150
Time (min)
Prot
ein
conc
. (m
g/g
MLS
S)
20ºC
10ºC
Dissolved protein conc. at 10oC compared w ith the reference,under anaerobic conditions
00.20.40.60.8
11.21.41.61.8
0 50 100 150Time (min)
Prot
ein
conc
. (m
g/g
MLS
S))
20ºC
10ºC
c) d)

29
Dissolved Protein concentration at 15ºC compared w ith the reference,under aerobic conditions
0
0.5
1
1.5
2
0 50 100 150
Time(min)
Prot
ein
conc
. (m
g/g
MLS
S
20ºC
15ºC
Dissolved protein conc. at 15oC compared w ith the reference,under anaerobic conditions
0
0.5
1
1.5
2
2.5
0 50 100 150Time(min)
Prot
ein
conc
. (m
g/g
MLS
S)
20ºC
15ºC
e) f)
Dissolved Protein concentration at 30ºC compared w ith the reference,under aerobic conditions
0
0.5
1
1.5
2
0 50 100 150
Time(min)
Prot
ein
conc
. (m
g/g
MLS
S
20ºC
30ºC
Dissolved protein conc. at 30oC compared w ith the reference,under anaerobic conditions
0
1
2
3
4
5
6
7
0 50 100 150Time(min)
Prot
ein
conc
. (m
g/g
MLS
S)
20ºC
30ºC
g) h) Figure 7 Concentration of dissolved protein in the organic fraction of the supernatant (a) aerobic conditions and 5 °C; (b) anaerobic conditions and 5°C; (c) aerobic conditions and 10°C; (d) anaerobic conditions and 10°C; (e) aerobic conditions and 15°C; (f) anaerobic conditions and 15°C; (g) aerobic conditions and 30°C; and (h) anaerobic conditions and 30°C.
Dissolved humus conc. at 5ºC compared w ith the reference,under aerobic conditions
0
0.5
1
1.5
2
2.5
0 50 100 150
Time (min)
Hum
us c
onc.
(mg/
g M
LSS)
20ºC
5ºC
Dissolved Humus conc. at 5ºC compared with the reference,ander anaerobic conditions
0
1
2
3
4
5
6
7
0 50 100 150Time (min
Hum
us c
onc.
(mg/
g M
LSS)
20ºC
5ºC
a) b)
Dissolved Humus conc. at 10ºC compared w ith the reference,ander anaerobic conditions
0
1
2
3
4
5
6
0 50 100 150Time (min
Hum
us c
onc.
(mg/
g M
LSS)
20ºC
10ºC
Dissolved humus conc. at 10ºC compared with the reference,under aerobic conditions
0
0.5
1
1.5
2
2.5
3
0 50 100 150
Time (min)
Hum
us c
onc.
(mg/
g M
LSS)
20ºC
10ºC
c) d)

30
Dissolved humus conc. at 15ºC compared w ith the reference,under aerobic conditions
0
0.5
1
1.5
2
2.5
0 50 100 150
Time (min)
Hum
us c
onc.
(mg/
g M
LSS)
20ºC
15ºC
Dissolved Humus conc. at 15ºC compared with the reference,ander anaerobic conditions
0
1
2
3
4
5
6
7
0 50 100 150Time (min
Hum
us c
onc.
(mg/
g M
LSS)
20ºC
15ºC
e) f)
Dissolved humus conc. at 30ºC compared w ith the reference,under aerobic conditions
0
0.5
1
1.5
2
2.5
3
0 50 100 150
Time (min)
Hum
us c
onc.
(mg/
g M
LSS)
20ºC
30ºC
Dissolved Humus conc. at 30ºC compared with the reference,ander anaerobic conditions
0
2
4
6
8
10
12
0 50 100 150Time (min)
Hum
us c
onc.
(mg/
g M
LSS)
20ºC
30ºC
g) h) Figure 8: Concentration of dissolved humic substances in the organic fraction of the supernatant (a) aerobic conditions and 5 °C; (b) anaerobic conditions and 5°C; (c) aerobic conditions and 10°C; (d) anaerobic conditions and 10°C; (e) aerobic conditions and 15°C; (f) anaerobic conditions and 15°C; (g) aerobic conditions and 30°C; and (h) anaerobic conditions and 30°C.
Dissolved carbohydrate conc. at 5ºC compared with the reference,under aerobic conditions
00.20.40.60.8
11.21.4
0 50 100 150
Time (min)
Car
bohy
drat
e co
nc. (
mg/
gM
LSS) 20ºC
5ºC
Dissolved carbohydrate conc. at 5ºC compared w ith the reference,ander anaerobic conditions
0
0.5
1
1.5
2
2.5
3
0 50 100 150Time (min)
Car
bohy
drat
e co
nc. (
mg/
gM
LSS)
20ºC
5ºC
a) b)
Dissolved carbohydrate conc. at 10ºC compared w ith the reference,under aerobic conditions
00.20.40.60.8
11.21.41.6
0 50 100 150
Time (min)
Car
bohy
drat
e co
nc. (
mg/
gM
LSS)
20ºC
10ºC
Dissolved carbohydrate conc. at 10ºC compared w ith the reference,ander anaerobic conditions
0
0.20.4
0.6
0.8
11.2
1.4
0 50 100 150
Time (min)
Car
bohy
drat
e co
nc. (
mg/
gM
LSS)
20ºC
10ºC
c) d)

31
Dissolved carbohydrate conc. at 15ºC compared with the reference,under aerobic conditions
00.20.40.60.8
11.21.4
0 50 100 150
Time (min)
Car
bohy
drat
e co
nc. (
mg/
g M
LSS)
20ºC
15ºC'
Dissolved Humus conc. at 15ºC compared with the reference,ander anaerobic conditions
0
1
2
3
4
5
6
7
0 50 100 150Time (min
Hum
us c
onc.
(mg/
g M
LSS)
20ºC
15ºC
e) f)
Dissolved carbohydrate conc. at 30ºC compared with the reference,under aerobic conditions
0
0.5
1
1.5
2
0 50 100 150
Time (min)
Car
bohy
drat
e co
nc. (
mg/
gM
LSS) 20ºC
30ºC
Dissolved carbohydrate conc. at30ºC compared w ith the reference,ander anaerobic conditions
0
0.5
1
1.5
2
2.5
3
0 50 100 150Time (min)
Car
bohy
drat
e co
nc. (
mg/
gM
LSS)
20ºC
30ºC
g) h) Figure 9 Concentration of dissolved carbohydrate in the organic fraction of the supernatant (a) aerobic conditions and 5 °C; (b) anaerobic conditions and 5°C; (c) aerobic conditions and 10°C; (d) anaerobic conditions and 10°C; (e) aerobic conditions and 15°C; (f) anaerobic conditions and 15°C; (g) aerobic conditions and 30°C; and (h) anaerobic conditions and 30°C. The calculations of the ratio between the dissolved biopolymers protein:humic substances:carbohydrate shows that the dissolved humic substances were released more than the dissolved protein under both aerobic and anaerobic conditions at all low and high temperatures (Table 3), in spite of the higher ratio of protein in the total sludge (Table 2). The ratio of protein was a little bit lower than 1 at 5ºC, 10ºC and 30ºC under aerobic conditions and at 5ºC under anaerobic conditions. Slight differences in the ratio of the dissolved biopolymers were observed at 30ºC, 20ºC (ambient), and 15ºC under aerobic conditions, whereas significant differences were observed under anaerobic conditions especially at the high temperature. The ratio between the protein, carbohydrates and humic substances were more or less the same under aerobic conditions at 30ºC, while the ratio of dissolved humic substances were twice the concentration of protein, and 4.5 times higher than carbohydrate (Table 3). The ratios of dissolved protein eroded into the supernatant under both aerobic and anaerobic conditions were much less than the ratios of the total biopolymers in the sludge.

32
Table 3: Ratio between the dissolved biopolymers in the supernatant after 2 hours under both aerobic and anaerobic conditions at different temperatures.
Ratio under aerobic conditions Ratio under anaerobic conditions
Temperature Dissolved Protein
Dissolved Humus
Dissolved Carbohydrate
Dissolved Protein
Dissolved Humus
Dissolved Carbohydrate
5ºC 0.9495 1.7683 1 0.9126 2.3849 1 10ºC 0.6106 2.4146 1 1.1477 2.6927 1 15ºC 1.1964 1.3376 1 1.0491 3.6289 1 20ºC 0.9557 1.7309 1 1.1138 1.7189 1 30ºC 0.9224 0.9429 1 2.1986 4.5834 1
Table 4: Ratio of the total biopolymers in the total sludge. Ratio under aerobic conditions Ratio under anaerobic conditions
Temperature Total Protein
Total Humus
Total Carbohydrate
Total Protein
Total Humus
Total Carbohydrate
5ºC 4.1105 1.4684 1 4.5633 1.4509 1 10ºC 4.1921 1.4563 1 4.3204 1.3155 1 15ºC 5.1029 1.1459 1 3.9777 1.3615 1 30ºC 4.8671 1.6487 1 5.8675 1.2572 1 The concentrations of the dissolved biopolymers were less well correlated to the turbidity when the activated sludge deflocculated under aerobic conditions, which is seen as low values of the regression coefficient r2 (Figure10). The correlations were generally much better during anaerobic (Figure 10a,d,f) compared to under aerobic conditions (Figure 10a,c, e) indicating a higher degree of release of dissolved fractions under anaerobic conditions. The results indicate that the different dissolved compounds are released differently at different temperatures under both aerobic and anaerobic conditions.
Dissolved protein concentration at different temperatures under aerobic conditions
compared with turbidityy = 0.0277x(5°C)
R2 = 0.0656
y = 0.0171x(10°C)R2 = -0.6768
y = 0.0131x(15°C)R2 = 0.0354
y = 0.015x(30°C)R2 = 0.09240
0.01
0.02
0.03
0.04
0 0.5 1 1.5 2
Dissolved protein concentration(mg/g)
Turb
idity
/g M
LSS
5°C10°C15°C30°C
Dissolved protein concentration at different temperatures under anaerobic conditions
compared with turbidity
y = 0.0405x(5°C)R2 = 0.6982
y = 0.0352x(10°C)R2 = 0.4064
y = 0.0274x(15°C)R2 = 0.3452
y = 0.029x(30°C)R2 = 0.878
0
0.05
0.1
0.15
0.2
0 2 4 6
Dissolved protein concentration(mg/g)
Turb
idity
/g M
LSS
5°C10°C15°C30°C
a) b)
Dissolved humus concentration at different temperatures under aerobic conditions
compared with turbidity
y = 0.0157x(5°C)R2 = 0.2194
y = 0.0094x(10°C)R2 = 0.4977
y = 0.0117x(15°C)R2 = 0.1244
y = 0.0143x(30°C)R2 = -0.49920
0.01
0.02
0.03
0.04
0 0.5 1 1.5 2 2.5
Dissolved humus concentration(mg/g)
Turb
idity
/g M
LSS
5°C
10°C
15°C
30°C
Dissolved humus concentration at different temperatures under anaerobic conditions
compared with turbidityy = 0.0151x(5°C)
R2 = 0.4344y = 0.0164x(10°C)
R2 = 0.4084y = 0.0109x(15°C)
R2 = 0.6406
y = 0.0106x(30°C)R2 = 0.7902
00.020.040.060.080.1
0.120.14
0 5 10 15
Dissolved humus concentration(mg/g)
Turb
idity
/g M
LSS
5°C10°C15°C30°C
c) d)
33
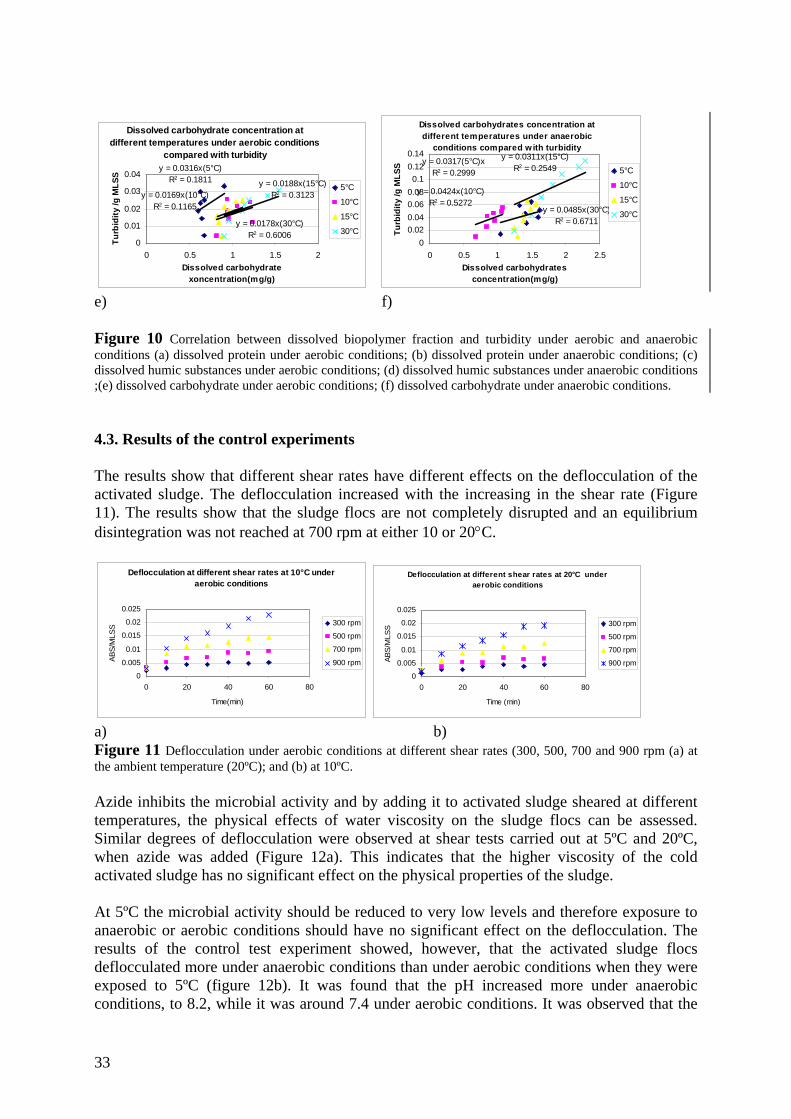
Dissolved carbohydrate concentration at
different temperatures under aerobic conditions compared with turbidity
y = 0.0316x(5°C)R2 = 0.1811
y = 0.0169x(10°C)R2 = 0.1165
y = 0.0188x(15°C)R2 = 0.3123
y = 0.0178x(30°C)R2 = 0.6006
0
0.01
0.02
0.03
0.04
0 0.5 1 1.5 2Dissolved carbohydrate
xoncentration(mg/g)
Turb
idity
/g M
LSS
5°C
10°C
15°C
30°C
Dissolved carbohydrates concentration at different temperatures under anaerobic
conditions compared w ith turbidityy = 0.0317(5°C)x
R2 = 0.2999
y = 0.0424x(10°C)R2 = 0.5272
y = 0.0311x(15°C)R2 = 0.2549
y = 0.0485x(30°C)R2 = 0.6711
00.020.040.060.080.1
0.120.14
0 0.5 1 1.5 2 2.5Dissolved carbohydrates
concentration(mg/g)
Turb
idity
/g M
LSS 5°C
10°C
15°C
30°C
e) f) Figure 10 Correlation between dissolved biopolymer fraction and turbidity under aerobic and anaerobic conditions (a) dissolved protein under aerobic conditions; (b) dissolved protein under anaerobic conditions; (c) dissolved humic substances under aerobic conditions; (d) dissolved humic substances under anaerobic conditions ;(e) dissolved carbohydrate under aerobic conditions; (f) dissolved carbohydrate under anaerobic conditions. 4.3. Results of the control experiments The results show that different shear rates have different effects on the deflocculation of the activated sludge. The deflocculation increased with the increasing in the shear rate (Figure 11). The results show that the sludge flocs are not completely disrupted and an equilibrium disintegration was not reached at 700 rpm at either 10 or 20°C.
Deflocculation at different shear rates at 10°C under aerobic conditions
0
0.005
0.01
0.015
0.02
0.025
0 20 40 60 80
Time(min)
ABS/
MLS
S 300 rpm
500 rpm
700 rpm
900 rpm
Deflocculation at different shear rates at 20°C under aerobic conditions
0
0.005
0.01
0.015
0.02
0.025
0 20 40 60 80
Time (min)
ABS/
MLS
S 300 rpm
500 rpm
700 rpm
900 rpm
a) b) Figure 11 Deflocculation under aerobic conditions at different shear rates (300, 500, 700 and 900 rpm (a) at the ambient temperature (20ºC); and (b) at 10ºC. Azide inhibits the microbial activity and by adding it to activated sludge sheared at different temperatures, the physical effects of water viscosity on the sludge flocs can be assessed. Similar degrees of deflocculation were observed at shear tests carried out at 5ºC and 20ºC, when azide was added (Figure 12a). This indicates that the higher viscosity of the cold activated sludge has no significant effect on the physical properties of the sludge. At 5ºC the microbial activity should be reduced to very low levels and therefore exposure to anaerobic or aerobic conditions should have no significant effect on the deflocculation. The results of the control test experiment showed, however, that the activated sludge flocs deflocculated more under anaerobic conditions than under aerobic conditions when they were exposed to 5ºC (figure 12b). It was found that the pH increased more under anaerobic conditions, to 8.2, while it was around 7.4 under aerobic conditions. It was observed that the

34
deflocculation rate of the activated sludge flocs increased with increasing pH in the control experiment (Figure 12c). At pH 7-7.5 the difference in turbidity development was very small. A slight increase was observed at pH 8 whereas at pH 8.5 it increased to high values. This could affect the interpretation of the reasons behind the increase in deflocculation and the biopolymers concentration under anaerobic conditions, since pH rose more under the anaerobic conditions than under the aerobic conditions; the changes in pH could have significant effects on floc stability and microbial activities. When looking at the data from the anaerobic conditions the pH increased beyond 7.5 up to 8.3. However, the pH was similar for the reference and test reactors in each experiment and therefore the results reflect effects of temperature. However, a comparison between the deflocculation under aerobic and anaerobic conditions is not possible due to the pH differences.
Deflocculation under aerobic conditions when azide was added
00.020.040.060.080.1
0.12
0 50 100 150
Time(min)
ABS
/MLS
S 20°C
5°C
Deflocculation under aerobic and anaerobic conditions at 5°C
00.020.040.060.080.1
0.12
0 50 100 150
Time(min)
AB
S/M
LSS
5°C aerobic
5°C anaerobic
a) b)
00.010.020.030.040.050.060.070.08
0 50 100 150
Time(min)
AB
S/M
LSS pH=7
pH=7.5
pH=8
pH=8.5
c) Figure 12: Deflocculation under (a) aerobic conditions with azide addition (b) aerobic and anaerobic conditions at 5ºC (c) exposure to different pH and aerobic conditions. 4.4. Eroded (released) ions into the supernatant Since iron salts were added to the sludge it contained large amounts of Fe, on an average 130 mg/gMLSS. The sludge contained the following concentrations of the other ions: 26 mg Na, 24 mg K, 13 mg Al, 12 mg Ca and 4.5 mg Mg per g MLSS. Before shearing had started the supernatant contained relatively high concentrations of Na compared to K which were of similar concentrations in the sludge. This indicates that Na binds weakly to the floc matrix or that it was present in the wastewater. The supernatant also contained relatively large concentrations of both Ca and Mg. On the other hand the supernatant contained very low concentrations of Fe whereas the concentrations of aluminium were slightly higher.

35
It was observed that the concentration of the different ions changed throughout the experiment in different ways. The concentration of Na was high in the water already at the start of the experiment. The concentration in the supernatant remained the same or increased slightly under aerobic conditions whereas it remained fairly unchanged under anaerobic conditions (figure 13). The concentrations were rather similar under aerobic and anaerobic conditions. The concentration of K was slightly higher under anaerobic conditions than under aerobic conditions (figure 16 a,c,e,g). Under aerobic conditions there was a slight increase in concentration and there was a trend towards higher concentrations at higher temperatures. The increased in concentration was particularly high at 30ºC. Similar observations were made for anaerobic conditions (figure 16 b,d,f,h). The concentrations of Mg were similar under aerobic and anaerobic conditions (figure 14). There was a slight decrease in the concentration under both aerobic and anaerobic conditions. Under aerobic conditions there was a tendency towards higher concentrations in the supernatant at lower temperatures (figure 14 a,c,e,g). No such trend was found for anaerobic conditions (figure 14 b,d,f,h). The concentration of Mg in the supernatant was higher than the concentration of Ca and it was in a similar range under both aerobic and anaerobic conditions (figure 17). Just as for Mg, the concentration of Ca decreased during the shearing. For aerobic conditions there was no large difference in concentration between the different temperatures (figure 17 a,c,e,g). Similar observations were observed for anaerobic conditions (figure 17 b,d,f,h). The concentration of Al was low but higher compared to the concentration of Fe (figure 15). The concentrations were also generally higher at higher temperatures, especially under anaerobic conditions. Very low concentrations of Fe were found in the supernatant at aerobic conditions (figure 18 a,c,e,g) whereas slightly higher concentrations were observed for anaerobic conditions (figure 18 b,d,f,h). The concentrations remained relatively constant throughout the experiments under both aerobic and anaerobic conditions. It was observed that, the concentration of Ca, Mg and in some cases Fe ions decreased with the time of the experiments in both test reactors and reference reactors under both aerobic and anaerobic conditions (figure 14, 17 and 18). This could either have been due to binding with the dissolved biopolymers (carbohydrate, protein and humic substances), which showed the same trend or due to a chemical precipitation. Fe ions are strongly bound to the floc matrix and form hydroxide complexes at high pH. The concentration of Ca, Mg and Fe ions decreased more under anaerobic conditions than under aerobic conditions. This could happen as a result of the higher pH values observed under anaerobic conditions and this could have led to a larger precipitation compared to at aerobic conditions. Al and K increased during the time of experiments at all different temperature under both aerobic and anaerobic conditions (figure 15 and 16). As a summary it can be concluded that the concentration of ions released to the supernatant during the deflocculation of activated sludge flocs in both test reactors and reference reactors were higher under anaerobic conditions than under aerobic conditions. The concentrations of those ions were similar in the total sludge for the different experiments.

36
Aerobic conditions
020406080
100120140160180
0 50 100 150
Time(min)
Na
Con
cent
ratio
n(m
g/l)
Na 20ºC (1)Na 5ºC (1)Na 20ºC (2)Na 5ºC (2)
Anaerobic conditions
020406080
100120140160
0 50 100 150
Time(min)
Na
Con
cent
ratio
n(m
g/l)
Na 20ºC (1)Na 5ºC (1)Na 20ºC (2)Na 5ºC (2)
a) b)
Aerobic conditions
140
145
150
155
160
165
0 50 100 150
Time(min)
Na
Con
cent
ratio
n(m
g/l)
Na 20ºC (1)Na 10ºC (1)Na 20ºC (2)Na 10ºC (2)
Anaerobic conditions
0
50
100
150
200
250
300
350
0 50 100 150
Time(min)
Na
Con
cent
ratio
n(m
g/l)
Na 20ºC (1)Na10ºC (1)Na 20ºC (2)Na 10ºC (2)
c) d)
Aerobic conditions
020406080
100120140160180
0 50 100 150
Time(min)
Na
Con
cent
ratio
n(m
g/l)
Na 20ºC (1)Na 15ºC (1)Na 20ºC (2)Na 15ºC (2)
Anaerobic conditions
020406080
100120140160180
0 50 100 150
Time(min)
Na
Con
cent
ratio
n(m
g/l)
Na 20ºC (1)Na15ºC (1)Na 20ºC (2)Na 15ºC (2)
e) f)
Aerobic conditions
160
165
170
175
180
185
190
0 50 100 150
Time(min)
Na
Con
cent
ratio
n(m
g/l)
Na 20ºC (1)Na 30ºC (1)Na 20ºC (2)Na 30ºC (2)
Anaerobic conditions
158160162164166168170172174176
0 50 100 150
Time(min)
Na
Con
cent
ratio
n(m
g/l)
Na 20ºC (1)Na30ºC (1)Na 20ºC (2)Na 30ºC (2)
g) h) Figure 13 Concentration of Na ions, in mg/l, that eroded from activated sludge flocs into the supernatant during the deflocculation at 700 rpm shear strength (a) aerobic conditions and 5 °C; (b) anaerobic conditions and 5°C; (c) aerobic conditions and 10°C; (d) anaerobic conditions and 10°C; (e) aerobic conditions and 15°C; (f) anaerobic conditions and 15°C; (g) aerobic conditions and 30°C; and (h) anaerobic conditions and 30°C.

37
Aerobic conditions
0123456789
10
0 50 100 150
Time(min)
Mg
Con
cent
ratio
n(m
g/l)
Mg 20ºC (1)Mg 5ºC (1)Mg 20ºC (2)Mg 5ºC (2)
Anaerobic conditions
0123456789
10
0 50 100 150
Time(min)
Mg
Con
cent
ratio
n(m
g/l)
Mg 20ºC (1)Mg 5ºC (1)Mg 20ºC (2)Mg 5ºC (2)
a) b)
Aerobic conditions
0123456789
10
0 50 100 150
Time(min)
Mg
Con
cent
ratio
n(m
g/l)
Mg 20ºC (1)Mg 10ºC (1)Mg 20ºC (2)Mg 10ºC (2)
Anaerobic conditions
0
5
10
15
20
25
30
0 50 100 150
Time(min)
Mg
Con
cent
ratio
n(m
g/l)
Mg 20ºC (1)Mg10ºC (1)Mg 20ºC (2)Mg 10ºC (2)
c) d)
Aerobic conditions
0
2
4
6
8
10
12
0 50 100 150
Time(min)
Mg
Con
cent
ratio
n(m
g/l)
Mg 20ºC (1)Mg 15ºC (1)Mg 20ºC (2)Mg 15ºC (2)
Anaerobic conditions
0123456789
10
0 50 100 150
Time(min)
Mg
Con
cent
ratio
n(m
g/l)
Mg 20ºC (1)Mg 15ºC (1)Mg 20ºC (2)Mg 15ºC (2)
e) f)
Aerobic conditions
0
2
4
6
8
10
12
0 50 100 150
Time(min)
Mg
Con
cent
ratio
n(m
g/l)
Mg 20ºC (1)Mg 30ºC (1)Mg 20ºC (2)Mg 30ºC (2)
Anaerobic conditions
0123456789
10
0 50 100 150
Time(min)
Mg
Con
cent
ratio
n(m
g/l)
Mg 20ºC (1)Mg 30ºC (1)Mg 20ºC (2)Mg 30ºC (2)
g) h) Figure 14 Concentration of Mg ions, in mg/l, that eroded from activated sludge flocs into the supernatant during the deflocculation at 700 rpm shear strength (a) aerobic conditions and 5 °C; (b) anaerobic conditions

38
and 5°C; (c) aerobic conditions and 10°C; (d) anaerobic conditions and 10°C; (e) aerobic conditions and 15°C; (f) anaerobic conditions and 15°C; (g) aerobic conditions and 30°C; and (h) anaerobic conditions and 30°C.
Aerobic conditions
0
0.02
0.04
0.06
0.08
0.1
0.12
0 50 100 150
Time(min)
Al C
once
ntra
tion(
mg/
l)
Al 20ºC (1)Al 5ºC (1)Al 20ºC (2)Al 5ºC (2)
Anaerobic conditions
0
0.05
0.1
0.15
0.2
0.25
0 50 100 150
Time(min)
Al C
once
ntra
tion(
mg/
l)
Al 20ºC (1)Al 5ºC (1)Al 20ºC (2)Al 5ºC (2)
a) b)
Aerobic conditions
0
0.02
0.04
0.06
0.08
0.1
0.12
0 50 100 150
Time(min)
Al C
once
ntra
tion(
mg/
l)
Al 20ºC (1)Al 10ºC (1)Al 20ºC (2)Al 10ºC (2)
Anaerobic conditions
00.02
0.040.060.08
0.10.12
0.140.16
0 50 100 150
Time(min)
Al C
once
ntra
tion(
mg/
l)
Al 20ºC (1)Al 10ºC (1)Al 20ºC (2)Al 10ºC (2)
c) d)
Aerobic conditions
0
0.02
0.04
0.06
0.08
0.1
0.12
0.14
0 50 100 150
Time(min)
Al C
once
ntra
tion(
mg/
l)
Al 20ºC (1)Al 15ºC (1)Al 20ºC (2)Al 15ºC (2)
Anaerobic conditions
0
0.05
0.1
0.15
0.2
0.25
0.3
0 50 100 150
Time(min)
Al C
once
ntra
tion(
mg/
l)
Al 20ºC (1)Al 15ºC (1)Al 20ºC (2)Al 15ºC (2)
e) f)

39
Aerobic conditions
00.020.04
0.060.08
0.10.12
0.140.16
0 50 100 150
Time(min)
Al C
once
ntra
tion(
mg/
l)
Al 20ºC (1)Al 30ºC (1)Al 20ºC (2)Al 30ºC (2)
Anaerobic conditions
0
0.1
0.2
0.3
0.4
0.5
0.6
0.7
0 50 100 150
Time(min)
Al C
once
ntra
tion(
mg/
l)
Al 20ºC (1)Al 30ºC (1)Al 20ºC (2)Al 30ºC (2)
g) h) Figure 15 Concentration of Al ions, in mg/l, that eroded from activated sludge flocs into the supernatant during the deflocculation at 700 rpm shear strength (a) aerobic conditions and 5 °C; (b) anaerobic conditions and 5°C; (c) aerobic conditions and 10°C; (d) anaerobic conditions and 10°C; (e) aerobic conditions and 15°C; (f) anaerobic conditions and 15°C; (g) aerobic conditions and 30°C; and (h) anaerobic conditions and 30°C.
Aerobic conditions
0
5
10
15
20
25
0 50 100 150
Time(min)
K C
once
ntra
tion(
mg/
l)
K 20ºC (1)K 5ºC (1)K 20ºC (2)K 5ºC (2)
Anaerobic conditions
0
5
10
15
20
25
30
35
0 50 100 150
Time(min)
K C
once
ntra
tion(
mg/
l)
K 20ºC (1)K 5ºC (1)K 20ºC (2)K 5ºC (2)
a ) b)
Aerobic conditions
17.518
18.519
19.520
20.521
21.522
0 50 100 150
Time(min)
K C
once
ntra
tion(
mg/
l)
K 20ºC (1)K 10ºC (1)K 20ºC (2)K 10ºC (2)
Anaerobic conditions
0
5
10
15
20
25
30
35
0 50 100 150
Time(min)
K C
once
ntra
tion(
mg/
l)
K 20ºC (1)K 10ºC (1)K 20ºC (2)K 10ºC (2)
c) d)

40
Aerobic conditions
0
5
10
15
20
25
0 50 100 150
Time(min)
K C
once
ntra
tion(
mg/
l)
K 20ºC (1)K 15ºC (1)K 20ºC (2)K 15ºC (2)
Anaerobic conditions
0
5
10
15
20
25
30
0 50 100 150
Time(min)
K C
once
ntra
tion(
mg/
l)
K 20ºC (1)K 15ºC (1)K 20ºC (2)K 15ºC (2)
e) f)
Aerobic conditions
20
20.5
21
21.5
22
22.5
23
0 50 100 150
Time(min)
K C
once
ntra
tion(
mg/
l)
K 20ºC (1)K 30ºC (1)K 20ºC (2)K 30ºC (2)
Anaerobic conditions
0
5
10
15
20
25
30
35
0 50 100 150
Time(min)
K C
once
ntra
tion(
mg/
l)K 20ºC (1)K 30ºC (1)K 20ºC (2)K 30ºC (2)
g) h) Figure 16 Concentration of K ions, in mg/l, that eroded from activated sludge flocs into the supernatant during the deflocculation at 700 rpm shear strength (a) aerobic conditions and 5 °C; (b) anaerobic conditions and 5°C; (c) aerobic conditions and 10°C; (d) anaerobic conditions and 10°C; (e) aerobic conditions and 15°C; (f) anaerobic conditions and 15°C; (g) aerobic conditions and 30°C; and (h) anaerobic conditions and 30°C.

41
Aerobic conditions
0
5
10
15
20
25
0 50 100 150
Time(min)
Ca
Con
cent
ratio
n(m
g/l)
Ca 20ºC (1)Ca 5ºC (1)Ca 20ºC (2)Ca 5ºC (2)
Anaerobic conditions
0
5
10
15
20
25
30
0 50 100 150
Time(min)
Ca
Con
cent
ratio
n(m
g/l)
Ca 20ºC (1)Ca 5ºC (1)Ca 20ºC (2)Ca 5ºC (2)
a) b)
Aerobic conditions
0
5
10
15
20
25
0 50 100 150
Time(min)
Ca
Con
cent
ratio
n(m
g/l)
Ca 20ºC (1)Ca 10ºC (1)Ca 20ºC (2)Ca 10ºC (2)
Anaerobic conditions
0
5
10
15
20
25
30
0 50 100 150
Time(min)
Ca
Con
cent
ratio
n(m
g/l)
Ca 20ºC (1)Ca 10ºC (1)Ca 20ºC (2)Ca 10ºC (2)
c) d)
Aerobic conditions
0
5
10
15
20
25
30
0 50 100 150
Time(min)
Ca
Con
cent
ratio
n(m
g/l)
Ca 20ºC (1)Ca 15ºC (1)Ca 20ºC (2)Ca 15ºC (2)
Anaerobic conditions
0
5
10
15
20
25
0 50 100 150
Time(min)
Ca
Con
cent
ratio
n(m
g/l)
Ca 20ºC (1)Ca 15ºC (1)Ca 20ºC (2)Ca 15ºC (2)
e) f)
Aerobic conditions
0
5
10
15
20
25
30
0 50 100 150
Time(min)
Ca
Con
cent
ratio
n(m
g/l)
Ca 20ºC (1)Ca 30ºC (1)Ca 20ºC (2)Ca 30ºC (2)
Anaerobic conditions
0
5
10
15
20
25
0 50 100 150
Time(min)
Ca
Con
cent
ratio
n(m
g/l)
Ca 20ºC (1)Ca 30ºC (1)Ca 20ºC (2)Ca 30ºC (2)
g) h)

42
Figure 17 Concentration of Ca ions, in mg/l, that eroded from activated sludge flocs into the supernatant during the deflocculation at 700 rpm shear strength (a) aerobic conditions and 5 °C; (b) anaerobic conditions and 5°C; (c) aerobic conditions and 10°C; (d) anaerobic conditions and 10°C; (e) aerobic conditions and 15°C; (f) anaerobic conditions and 15°C; (g) aerobic conditions and 30°C; and (h) anaerobic conditions and 30°C.
Aerobic conditions
-0.01
0
0.01
0.02
0.03
0.04
0.05
0.06
0.07
0.08
0 50 100 150
Time(min)
Fe C
once
ntra
tion(
mg/
l)
Fe 20ºC (1)Fe 5ºC (1)Fe 20ºC (2)Fe 5ºC (2)
Anaerobic conditions
0
0.05
0.1
0.15
0.2
0.25
0.3
0.35
0 50 100 150
Time(min)
Fe C
once
ntra
tion(
mg/
l)
Fe 20ºC (1)Fe 5ºC (1)Fe 20ºC (2)Fe 5ºC (2)
a) b)
Aerobic conditions
00.005
0.010.015
0.020.025
0.030.035
0.040.045
0 50 100 150
Time(min)
Fe C
once
ntra
tion(
mg/
l)
Fe 20ºC (1)Fe 10ºC (1)Fe 20ºC (2)Fe 10ºC (2)
Anaerobic conditions
00.020.040.060.08
0.10.120.140.160.18
0.2
0 50 100 150
Time(min)
Fe C
once
ntra
tion(
mg/
l)
Fe 20ºC (1)Fe 10ºC (1)Fe 20ºC (2)Fe 10ºC (2)
c) d)
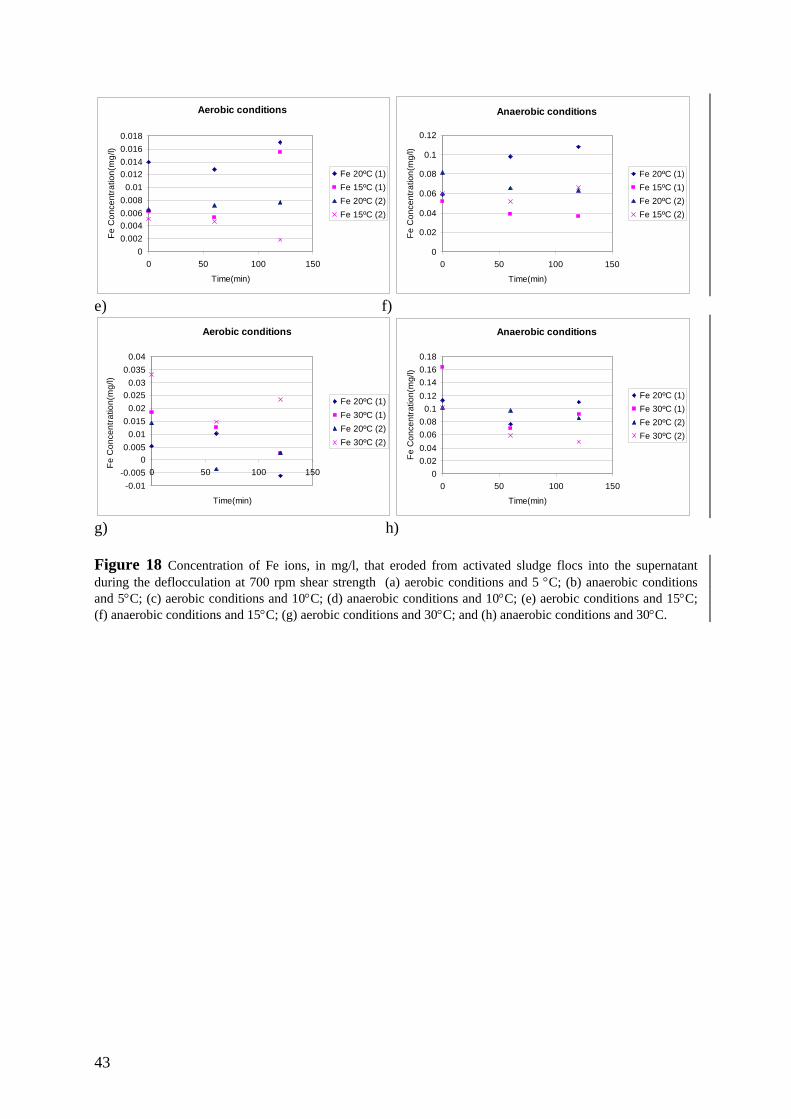
43
Aerobic conditions
00.0020.0040.0060.008
0.010.0120.0140.0160.018
0 50 100 150
Time(min)
Fe C
once
ntra
tion(
mg/
l)
Fe 20ºC (1)Fe 15ºC (1)Fe 20ºC (2)Fe 15ºC (2)
Anaerobic conditions
0
0.02
0.04
0.06
0.08
0.1
0.12
0 50 100 150
Time(min)
Fe C
once
ntra
tion(
mg/
l)
Fe 20ºC (1)Fe 15ºC (1)Fe 20ºC (2)Fe 15ºC (2)
e) f)
Aerobic conditions
-0.01-0.005
00.005
0.010.015
0.020.025
0.030.035
0.04
0 50 100 150
Time(min)
Fe C
once
ntra
tion(
mg/
l)
Fe 20ºC (1)Fe 30ºC (1)Fe 20ºC (2)Fe 30ºC (2)
Anaerobic conditions
00.020.040.060.08
0.10.120.140.160.18
0 50 100 150
Time(min)
Fe C
once
ntra
tion(
mg/
l)Fe 20ºC (1)Fe 30ºC (1)Fe 20ºC (2)Fe 30ºC (2)
g) h)
Figure 18 Concentration of Fe ions, in mg/l, that eroded from activated sludge flocs into the supernatant during the deflocculation at 700 rpm shear strength (a) aerobic conditions and 5 °C; (b) anaerobic conditions and 5°C; (c) aerobic conditions and 10°C; (d) anaerobic conditions and 10°C; (e) aerobic conditions and 15°C; (f) anaerobic conditions and 15°C; (g) aerobic conditions and 30°C; and (h) anaerobic conditions and 30°C.

44
Activated sludge flocs images The flocs include microorganisms, organic and inorganic particles. They are glued together by polymers produced by bacteria. The images showed that the flocs are more open and branched under anaerobic conditions(figure 19c). Pinpoint and less number of dense large microbial colonies were formed and free cells were released at the end of each shear test, it could be due to shearing effects more than temperature effects. a) b) c) d) Figure 19: activated sludge flocs magnified 100 times at ambient temperature 20°C (a) after one hour of shearing at 100 rpm and under aerobic conditions (b) after two hour of shearing at 700 rpm and under aerobic conditions (c) after one hour of shearing at 100 rpm and under anaerobic conditions (d) after two hour of shearing at 700 rpm and under anaerobic conditions.

45
5.0. Chapter five: Conclusion
The activated sludge flocs deflocculated significantly more at different low temperatures (5ºC, 10ºC and 15ºC) compared to at 20ºC under aerobic conditions. On the contrary, it deflocculated more at 20ºC than at 5ºC, 10ºC and 15ºC under anaerobic conditions.
The concentration of the total biopolymers protein, carbohydrate and humic
substances, was higher at 5ºC, 10ºC and 15ºC than at 20ºC under aerobic conditions, while it was higher at 20ºC than at 5ºC, 10ºC and 15ºC under anaerobic conditions (they followed the turbidity curve).
The dissolved biopolymers (protein, carbohydrate and humic substances) were
released more at 20°C than at 5°C, 10°C and 15°C under aerobic conditions. The concentrations of dissolved polymers were also higher at 30°C than at 20°C. Under anaerobic conditions, the concentration of dissolved biopolymers followed the turbidity, i.e. the concentrations were higher at 20 °C and 30 °C than at 5°C, 10°C and 15°C.
The concentrations of Na were rather similar under aerobic and anaerobic conditions.
The concentration of K were slightly higher under anaerobic conditions than under
aerobic conditions .
Very low concentrations of Fe were found in the supernatant at aerobic conditions, whereas slightly higher concentrations were observed for anaerobic conditions
The concentration of Ca, Mg and in some cases Fe ions decreased with time of the
experiment in both test and reference reactors under both aerobic and anaerobic conditions.

46

47
6.0. Chapter six: References Balmér, P., Ekfjorden, L., Lumley, D. and Mattsson, A. (1998). Upgrading for nitrogen removal under severe site restrictions. Water Science and Technology 37, 185-1998. Nielsen P.H., Frølund B. and Keiding K. (1996) changes in exopolymers composition by anaerobic storage of activated sludge. Applied Microbiol. Biotechnology, 44, 823-830. Tsuneda S., Aikawa H., Hayashi H., Yuasa A. and Hirata A. (2003) Extracellular polymeric substances responsible for bacterial adhesion into solid surface, FEMS Microbiology Letters 223, 2287-292. Garnier C., Görner T. and Lartiges B.S., (2005), Characterization of activated sludge exopolymers from various origins: A combined size exclusion chromatography and infrared microscopy study, Water Research, Volume 39, issue 13, pages 3044-3054. Morgan-Sagastume F., and Allen D.G., (2005) Physicochemical properties and stability of activated sludge flocs under temperature up shifts from 30 to 45ºC, Journal of colloid and interface Science, Volume 281, issue 1, 136-145. Morgan-Sagastume F., and Allen D.G. (2003) Effect of temperature transient conditions on aerobic biological treatment of wastewater, Water Research Volume 37, issue 15, pages 3590-3601. Mullar E., Kriebitzsch K., wilderer P.A and Wuertz S., (2002), Community structure of micro and macroflocs in pinpoint sludge and the influence of sludge age and potassium addition on microfloc formation, Water Science and Technology, Volume 46, issue ½, pages 405-412. Murthy S.N., Novak J.T. and Haas R.D (1999) Monitoring cations to predict and improve activated sludge settling properties of industrial wastewaters, Water Science and Technology, Volume 38, issue 3, pages 119-126. Wilen B.M., Keiding K and Nielsen P.H, (2000) Anaerobic deflocculation and aerobic reflocculation of activated sludge, Water Research, Volume 34, issue 16, pages 3933-3942. Wilen B.M., Nielsen P.H., Keiding K. and Nielsen P.H. (2000) Influence of microbial activity on the stability of activated sludge flocs. Colloids and surfaces B: Biointerfaces Volume 18, pages 145-156. Wilen, B.M., Keiding K. Nielsen P.H., (2004) Flocculation of activated sludge flocs by stimulation of the aerobic biological activity, Water Research, Volume 38, issue 18, pages 3909-3919. Jarvis P., Jefferson B., Gregory J. and Parsons S.A. (2005) A review of floc strength and breakage, Water Research, Volume 39, issue 14, pages 3121-3137. Liu Q.S., Liu Y., Tay J.H. and Show K.Y., (2005) Responses of sludge to shear strength, Process Biochemistry, Volume 40, issue 10, pages 3213-3217.
48
Liu Y. and Tay JH. (2002) The essential rule of hydrodynamic shear forces in the formation of biofilms and granular sludge. Water Research, Volume 36, issue 7, pages 1653-1665. Neyens E., Baeyens J. and Baeyens Creemers C. (2003) Alkaline thermal sludge hydrolysis, J Hazard. Mater. 97B, pages 295-314.

49
Appendices Appendix (I): the analytical methods used for measurement of carbohydrates, protein and humic substances (1) Carbohydrates The anthrone method was used for measuring carbohydrates. It is a colorimetric method; the carbohydrates are hydrolysed with concentrated acid and thereafter complex binding with anthrone. The intensity of colour is proportional to the concentration of carbohydrates. The standard curve is prepared according to the following method and modified to give a lower concentration level of 5 ppm. Standard curve A stock solution (1000 ppm) of glucose was made (2ml aliquots were used in each experiment). The stock solution was diluted 10 times to 100ppm. The standard curve then made accordingly: Table: Conc. [ppm] Amount of stock
solution [µl] Water [µl]
0 0 5000 2.5 250 9750 5 250 4750 10 500 4500 25 1000 3000 50 2000 2000
Standard curve of carbohydrate
y = 0.0132xR2 = 0.9999
00.1
0.20.3
0.40.5
0.60.7
0 10 20 30 40 50 60
Conc.(ppm)
AB
S.(6
25 n
m)
standardcurve(carbohydrate)Linear (standardcurve(carbohydra
Figure x: standard curve of carbohydrate Reagent solutions 27.5 ml distilled water is mixed with 472.5 ml concentrated H2SO4; 0.625 g anthrone was added while the solution was still warm. 27.5 ml distilled water was added to 472.5 ml concentrated H2SO4.
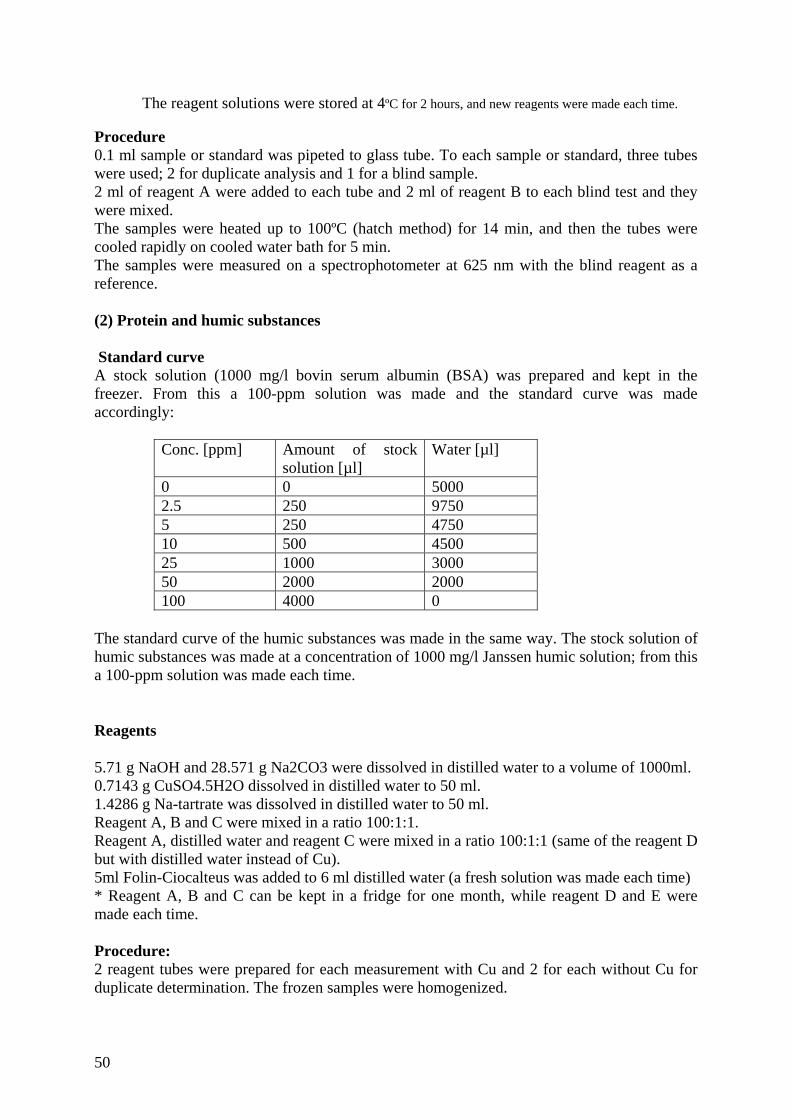
50
The reagent solutions were stored at 4ºC for 2 hours, and new reagents were made each time. Procedure 0.1 ml sample or standard was pipeted to glass tube. To each sample or standard, three tubes were used; 2 for duplicate analysis and 1 for a blind sample. 2 ml of reagent A were added to each tube and 2 ml of reagent B to each blind test and they were mixed. The samples were heated up to 100ºC (hatch method) for 14 min, and then the tubes were cooled rapidly on cooled water bath for 5 min. The samples were measured on a spectrophotometer at 625 nm with the blind reagent as a reference. (2) Protein and humic substances Standard curve A stock solution (1000 mg/l bovin serum albumin (BSA) was prepared and kept in the freezer. From this a 100-ppm solution was made and the standard curve was made accordingly:
The standard curve of the humic substances was made in the same way. The stock solution of humic substances was made at a concentration of 1000 mg/l Janssen humic solution; from this a 100-ppm solution was made each time.
Reagents
5.71 g NaOH and 28.571 g Na2CO3 were dissolved in distilled water to a volume of 1000ml. 0.7143 g CuSO4.5H2O dissolved in distilled water to 50 ml. 1.4286 g Na-tartrate was dissolved in distilled water to 50 ml. Reagent A, B and C were mixed in a ratio 100:1:1. Reagent A, distilled water and reagent C were mixed in a ratio 100:1:1 (same of the reagent D but with distilled water instead of Cu). 5ml Folin-Ciocalteus was added to 6 ml distilled water (a fresh solution was made each time) * Reagent A, B and C can be kept in a fridge for one month, while reagent D and E were made each time. Procedure: 2 reagent tubes were prepared for each measurement with Cu and 2 for each without Cu for duplicate determination. The frozen samples were homogenized.
Conc. [ppm] Amount of stock solution [µl]
Water [µl]
0 0 5000 2.5 250 9750 5 250 4750 10 500 4500 25 1000 3000 50 2000 2000 100 4000 0

51
500 µl Homogenized sample or standard was pipeted to each tube. 700 Ml of reagent D were added to 2 of the four tubes and reagent E to the two others and they were mixed (Humic acid standards were only prepared with reagent E (without Cu)), protein standards were analysed with reagent D and E. The samples were stand for 10 min. 100 µl of reagent F was added. All samples were measured, in the same order as the Reagent F was added, at 750 nm on a spectrophotometer. The zero sample (blind sample with and without Cu) was set to Zero with distilled water as a reference. Reactions: Cu+2 is reduced under complex formation with peptides to Cu+. In an alkaline environment, the peptides bonds are hydrolysed which will further reduce the Cu+2. the Cu+ is thereafter reduced by folin-Ciocalteus-phenol reagent. The reduction gives a blue colour, which can be measured spectrophotometrically at 750. Reduction of other compounds like trypsine, cystin. This means that the obtained colour is dependent on the total protein composition. Therefore, different concentrations of protein will be obtained by different standards of proteins. Humic substances interfere with the protein assay. This can be avoided by doing the following calculations (ABS=absorbance) ABStotal = ABSprotein + ABShumus ABSblind = 0.4 x ABSprotein + ABShumus ABStotal = total absorbance with CuSO4 ABSblind = total absorbance without CuSO4 ABShumus = Absorbance coming from humic substances (calculated) ABSprotein = Absorbance coming from protein (calculated) Calculations: Standard curve for protein was mad by plotting the concentration in ppm against ABStotal and adjusted to pass through (0.0) (Figure x). The concentration was calculated according to: ABSprotein = 1.25 x (ABStotal – ABSblind)
standerd curve of protein (Cu++)
y = 0.0068xR2 = 0.9987
00.10.20.30.40.50.60.70.8
0 20 40 60 80 100 120
Conc. (ppm)
Abs
.(750
nm
)
standerd curve ofprotein
Linear (standerdcurve of protein)
Figure x: standard curve of protein The humic substances standard curve was made with plotting the concentrations in ppm against the ABSblind (Figure x). The concentration of humic substances was calculated according to the following equation.

52
ABShumus = ABStotal – ABSprotein
Standard curve of humus
y = 0.0046xR2 = 0.9984
0
0.1
0.2
0.3
0.4
0.5
0 20 40 60 80 100 120
Conc. ppm
Abs
.(750
nm
)
standerd curve(humus)
Linear (standerdcurve (humus))
Figure x: standard curve of humus Appendix (II): The concentration of total biopolymers (average concentration of the duplicate experiments) in the total sludge (mg/g MLSS) Average concentration (aerobic) Average concentration (anaerobic) TemperatureTotal proteinTotal humusTotal CarbohydrateTotal proteinTotal humus Total Carbohydrate5°C 192.4525 68.74989 46.81994 229.6556 73.01605 50.32695 10°C 149.0046 51.76181 35.54456 258.414 78.6817 59.81313 15°C 265.3499 59.58659 51.99932 241.7429 82.74232 60.77522 30°C 249.824 84.62525 51.33049 316.7242 67.85451 53.98 Appendix (III): The ratio between the total biopolymers in the total sludge Ratio under aerobic conditions Ratio under anaerobic conditions TemperatureTotal proteinTotal humusTotal CarbohydrateTotal protein Total humus Total Carbohydrate5ºC 4.110481 1.468389 1 4.563271 1.450834 1 10ºC 4.19205 1.456251 1 4.320355 1.315459 1 15ºC 5.10295 1.145911 1 3.977655 1.361448 1 30ºC 4.866971 1.648635 1 5.867436 1.257031 1

53
Appendix (IV):The average concentration of total and dissolved biopolymers (mg/g MLSS) and the absorbance/ MLSS values, in the supernatant for the experiments performed under aerobic conditions 20ºC (Reference reactor of 5ºC)
Time (min) Absorbance/MLSS Total Protein
Total Humus
Total Carbohydrate
Dissolved Protein
Dissolved Humus
Dissolved Carbohydrate
0 0.003084 1.853792 1.441034 0.715796 0.727534 1.557002 0.575068 20 0.010416 2.662785 1.889931 1.145854 0.761929 1.771731 0.686263 40 0.013846 3.837161 2.60462 1.504995 0.808771 1.797663 0.945394 60 0.017936 4.997367 2.673145 1.693531 0.833713 1.948737 0.960297 80 0.019447 5.613187 2.995517 1.805209 0.84312 1.984102 0.948118 100 0.021902 5.864745 3.058825 1.97331 0.858655 2.04316 1.079563 120 0.024609 6.4261 3.443736 2.139126 1.061561 1.922734 1.110814 5ºC (Test reactor) Time (min) Absorbance/MLSS T protein T Humus T Carbohydrate D protein D Humus D Carbohydrate0 0.004532 2.372904 1.399183 0.763885 0.789959 1.238909 0.675549 20 0.014193 4.255791 1.973954 0.987186 0.718175 1.464736 0.645661 40 0.018881 4.801102 2.526931 1.09782 0.746205 1.322246 0.598206 60 0.023286 5.074889 2.912688 1.599857 0.836754 1.264804 0.623926 80 0.025364 6.048495 2.743169 1.787151 0.658932 1.300277 0.676829 100 0.029896 6.974113 3.079463 1.982997 0.796183 1.482813 0.630716 120 0.033199 7.564271 3.306149 2.259211 0.861743 1.604831 0.907557 20ºC (Reference reactor of 10ºC) Time (min) Absorbance/MLSS T protein T Humus T Carbohydrate D protein D Humus D Carbohydrate0 0.003602 1.628084 2.281195 0.797445 1.175311 1.883103 0.889336 20 0.009949 3.465362 2.546379 1.377498 1.046631 2.245889 1.003312 40 0.013012 4.342434 2.541299 1.485557 1.170835 2.075364 1.06548 60 0.014384 4.323946 3.168557 1.708493 1.269536 2.26934 1.188086 80 0.01676 6.448231 2.542189 1.879374 1.195511 2.313702 1.191828 100 0.019985 6.105284 3.719839 2.16131 1.108733 2.483138 1.232768 120 0.021477 6.013604 3.939751 2.229993 1.176138 2.0156 1.284215 10ºC (Test reactor) Time (min) Absorbance/MLSS T protein T Humus T Carbohydrate D protein D Humus D Carbohydrate0 0.0041 2.258196 2.251977 1.633383 0.951578 1.601122 0.817099 20 0.012316 4.399386 2.79346 1.71952 1.109561 1.487866 1.237735 40 0.014505 5.179143 2.639819 1.904352 0.984529 1.77561 0.963451 60 0.018887 6.042698 3.135309 1.897724 1.163387 2.0063 0.939345 80 0.021581 6.189778 3.310217 2.111166 0.938489 1.872181 1.053893 100 0.023923 6.983053 3.699697 2.314478 0.83565 2.208248 1.208662 120 0.025689 7.361551 3.977449 2.537284 0.575655 2.276269 0.942728 20ºC (Reference reactor of 15ºC) Time (min) Absorbance/MLSS T protein T Humus T Carbohydrate D protein D Humus D Carbohydrate0 0.002918 2.181539 2.550182 1.245575 1.039265 1.707319 0.791303 20 0.009387 3.850136 2.652794 1.595575 1.377061 1.60797 0.927366 40 0.013109 5.083885 2.660284 1.858755 1.36574 1.817673 1.160063 60 0.016075 4.92853 2.918169 2.115454 1.110998 1.677096 1.090614 80 0.016896 5.995594 3.199221 2.223863 1.258586 1.952687 1.053311 100 0.019042 6.717504 3.348694 2.535078 1.32591 2.125086 1.091128 120 0.021106 7.108398 3.257583 2.630813 1.402495 2.083859 1.122565 15ºC (Test reactor) Time (min) Absorbance/MLSS T protein T Humus T Carbohydrate D protein D Humus D Carbohydrate

54
0 0.003864 2.552931 2.289976 1.600844 1.189644 1.451162 0.877889 20 0.012304 3.773143 2.794549 1.65219 1.393235 1.297023 0.841684 40 0.0159 5.17027 3.038559 2.005884 1.355307 1.379783 0.828606 60 0.018664 5.98453 3.241312 2.162391 1.22551 1.596966 0.948561 80 0.021313 6.345009 3.368044 2.320634 1.588295 1.203564 0.902433 100 0.02417 7.005853 3.541084 2.480962 1.153333 1.923942 1.039719 120 0.025052 7.431275 3.708096 2.81082 1.343257 1.501795 1.12276 20ºC (Reference reactor of 30ºC) Time (min) Absorbance/MLSS T protein T Humus T Carbohydrate D protein D Humus D Carbohydrate0 0.003727 1.847476 2.64985 1.020367 1.010561 2.04883 0.861861 20 0.010157 3.696063 3.296859 1.716668 1.211152 1.848122 0.945086 40 0.014404 4.597257 3.300816 2.029525 1.314989 1.695137 0.974725 60 0.017388 5.419071 3.495378 2.244234 1.377305 1.604056 1.084225 80 0.019787 6.299109 3.591955 2.559441 1.457397 1.430144 1.150547 100 0.020583 6.522819 3.791599 2.570418 1.236668 1.786019 1.129733 120 0.022652 7.017178 3.994268 2.719963 1.402821 1.807558 1.051453 30ºC (Test reactor) Time (min) Absorbance/MLSS T protein T Humus T Carbohydrate D protein D Humus D Carbohydrate0 0.003864 2.370886 2.584644 1.208913 1.24736 1.690029 0.906334 20 0.01298 4.798578 3.558104 1.967847 1.536964 1.392175 0.95992 40 0.01877 6.25507 3.517395 2.376268 1.009381 1.296615 1.119873 60 0.022515 6.390517 3.909877 2.691939 1.328633 1.261059 1.139881 80 0.025069 7.7688 4.051771 2.97326 1.401641 1.132571 1.190334 100 0.028036 8.54164 4.04173 3.255742 1.524501 1.175797 1.407236 120 0.030883 9.134192 4.459834 3.588951 1.418892 1.45036 1.538327

55
Appendix (V): The average concentration of total and dissolved biopolymers (mg/g MLSS) and the absorbance/ MLSS values, in the supernatant for the experiments performed under aerobic conditions 20ºC (Reference reactor of 5ºC)
Time (min) Absorbance/MLSS Total Protein
Total Humus
Total Carbohydrate
Dissolved Protein
Dissolved Humus
Dissolved carbohydrate
0 0.012845 4.859329 3.482894 1.573773 0.973293 2.980618 1.413852 20 0.033154 8.878318 4.74788 2.498282 0.921618 3.635547 1.525126 40 0.045618 10.32702 5.685503 3.240893 1.228246 4.136581 1.464697 60 0.060258 13.07324 7.068985 3.935524 1.09746 5.389741 1.589969 80 0.070467 14.73677 8.38793 4.468699 1.38577 5.626977 1.860196 100 0.085002 15.63949 9.732684 4.958145 2.126676 5.65246 2.02715 120 0.092105 17.7233 11.17033 5.699752 2.718271 5.674047 2.4563 5ºC (Test reactor) Time (min) Absorbance/MLSS T protein T Humus T Carbohydrate D protein D Humus D Carbohydrate0 0.014033 4.920468 3.043831 1.698216 0.830252 2.582919 1.035858 20 0.031283 8.359305 3.878642 2.397901 0.847105 2.764618 1.429432 40 0.040442 9.747275 4.485129 2.823632 1.046484 2.920418 1.595171 60 0.047453 10.94394 4.634357 3.375789 1.250113 2.947625 1.39745 80 0.051714 12.90286 5.605166 3.705989 1.164873 3.005025 1.614429 100 0.05887 14.33707 6.822639 4.130915 1.354433 3.232181 1.324691 120 0.065747 14.69141 7.448032 4.736162 1.363138 3.562383 1.493681 20ºC (Reference reactor of 10ºC) Time (min) Absorbance/MLSS T protein T Humus T Carbohydrate D protein D Humus D Carbohydrate0 0.009562 4.690419 3.764621 1.600151 1.136243 2.302602 0.843195 20 0.023329 8.286487 4.432069 2.210502 1.028345 2.76143 0.979088 40 0.032787 9.804564 5.532904 2.654338 1.258415 2.620457 1.028632 60 0.043383 12.34575 6.511045 3.368248 1.135041 3.325358 1.068323 80 0.05461 14.5154 7.645797 3.837032 1.190254 3.39874 1.164508 100 0.063825 15.77956 9.02414 4.407112 1.099676 4.361101 1.168375 120 0.07697 17.16329 10.8491 5.135613 1.290092 4.440596 1.273579 10ºC (Test reactor) Time (min) Absorbance/MLSS T protein T Humus T Carbohydrate D protein D Humus D Carbohydrate0 0.009464 5.215854 3.509607 1.591828 0.935322 2.084297 0.684115 20 0.02553 9.559691 4.54958 2.610043 1.012869 2.031723 0.83161 40 0.035427 10.6034 5.256579 2.946071 1.006052 2.164698 0.957434 60 0.042376 12.12421 5.799117 3.327942 1.120166 2.391013 0.849147 80 0.046469 13.09648 6.525908 3.730007 1.166677 2.446528 0.935264 100 0.048945 11.9754 7.238013 3.885938 1.193983 2.39994 1.061087 120 0.055017 13.1749 7.926169 4.075889 1.229949 2.885678 1.071673 20ºC (Reference reactor of 15ºC) Time (min) Absorbance/MLSS T protein T Humus T Carbohydrate D protein D Humus D Carbohydrate0 0.009373 4.694956 4.878973 1.504938 1.773231 2.266634 1.078586 20 0.026582 8.552797 8.005378 2.534344 1.4405 2.739409 1.406201 40 0.038755 13.27125 7.288008 3.300653 1.925687 3.051586 1.57622 60 0.050476 14.6152 9.004624 3.901379 1.870051 3.55854 1.624272 80 0.061065 15.82629 10.13975 4.432297 1.828462 4.338524 1.770539 100 0.074002 19.47168 11.73824 5.176348 2.02247 5.214579 1.656802 120 0.084595 22.91282 13.34434 5.289231 1.870088 5.419929 2.026349

56
15ºC (Test reactor) Time (min) Absorbance/MLSS T protein T Humus T Carbohydrate D protein D Humus D Carbohydrate0 0.010268 7.159787 4.275303 2.150231 1.371369 2.959265 1.29374 20 0.02453 11.36259 5.412685 2.745014 1.35758 3.420157 1.24824 40 0.03627 14.09817 6.907047 3.106445 1.496155 3.722366 1.377057 60 0.045044 15.55816 7.654848 3.633981 1.634693 4.024801 1.382995 80 0.054275 17.74673 9.059779 4.199716 1.842454 4.339119 1.48285 100 0.061916 17.11366 10.37803 4.510711 1.953284 4.796964 1.56325 120 0.066035 19.09839 10.16026 4.70263 1.509889 5.222921 1.439277 20ºC (Reference reactor of 30ºC) Time (min) Absorbance/MLSS T protein T Humus T Carbohydrate D protein D Humus D Carbohydrate0 0.012053 5.915846 4.828804 2.194107 1.240459 4.306875 1.086867 20 0.031696 10.50227 6.46757 3.008443 1.572732 4.549497 1.309205 40 0.048269 13.54886 7.518432 3.530952 1.441675 5.409512 1.272794 60 0.060949 15.83052 9.339427 4.158233 1.385656 6.109075 1.400004 80 0.077854 18.86697 10.85798 4.809961 2.060007 6.708477 1.581375 100 0.088504 19.44089 12.64798 5.150071 2.344981 7.219766 1.592983 120 0.099616 21.90695 13.89685 5.794703 2.463524 7.638147 1.714048 30ºC (Test reactor) Time (min) Absorbance/MLSS T protein T Humus T Carbohydrate D protein D Humus D Carbohydrate0 0.019478 7.918795 5.90168 2.658114 1.473751 4.985869 1.242074 20 0.044252 14.0812 7.840875 3.74894 1.356788 6.125357 1.501503 40 0.072925 19.93114 10.52171 5.075992 2.166534 7.513049 1.63531 60 0.091977 24.2158 12.37071 5.668127 3.014905 8.59286 1.80462 80 0.108881 24.4539 16.19488 6.481798 3.386301 9.414328 1.949128 100 0.119094 26.00097 17.89603 6.975167 3.741389 10.4477 2.19831 120 0.129093 27.7654 19.51831 7.377771 5.031407 10.4888 2.288428
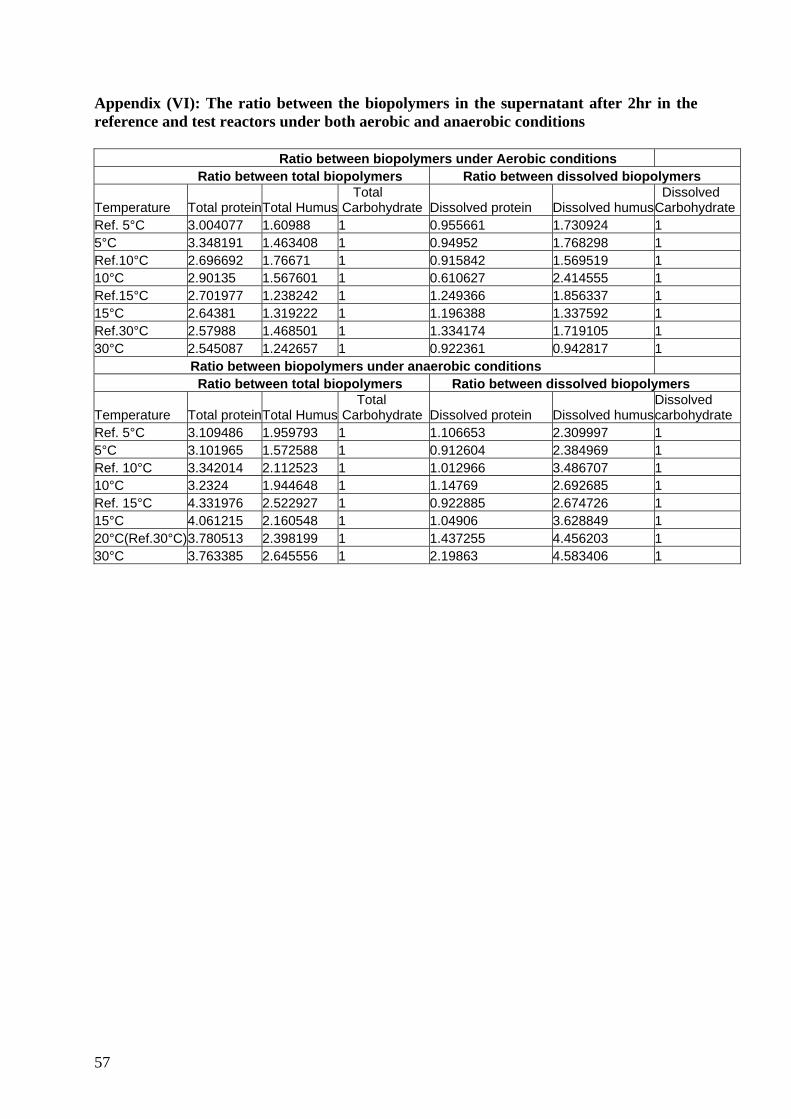
57
Appendix (VI): The ratio between the biopolymers in the supernatant after 2hr in the reference and test reactors under both aerobic and anaerobic conditions Ratio between biopolymers under Aerobic conditions Ratio between total biopolymers Ratio between dissolved biopolymers
Temperature Total protein Total Humus Total Carbohydrate Dissolved protein Dissolved humus
Dissolved Carbohydrate
Ref. 5°C 3.004077 1.60988 1 0.955661 1.730924 1 5°C 3.348191 1.463408 1 0.94952 1.768298 1 Ref.10°C 2.696692 1.76671 1 0.915842 1.569519 1 10°C 2.90135 1.567601 1 0.610627 2.414555 1 Ref.15°C 2.701977 1.238242 1 1.249366 1.856337 1 15°C 2.64381 1.319222 1 1.196388 1.337592 1 Ref.30°C 2.57988 1.468501 1 1.334174 1.719105 1 30°C 2.545087 1.242657 1 0.922361 0.942817 1 Ratio between biopolymers under anaerobic conditions Ratio between total biopolymers Ratio between dissolved biopolymers
Temperature Total protein Total Humus Total Carbohydrate Dissolved protein Dissolved humus
Dissolved carbohydrate
Ref. 5°C 3.109486 1.959793 1 1.106653 2.309997 1 5°C 3.101965 1.572588 1 0.912604 2.384969 1 Ref. 10°C 3.342014 2.112523 1 1.012966 3.486707 1 10°C 3.2324 1.944648 1 1.14769 2.692685 1 Ref. 15°C 4.331976 2.522927 1 0.922885 2.674726 1 15°C 4.061215 2.160548 1 1.04906 3.628849 1 20°C(Ref.30°C)3.780513 2.398199 1 1.437255 4.456203 1 30°C 3.763385 2.645556 1 2.19863 4.583406 1

58
Appendix (VII): Values of dissolved oxygen, pH and conductivity at the end of each experiment Aerobic conditions 1st Experiment 2nd Experiment
Temperature (ºC) DO(mg/L) pH
Conductivity(µS/cm)
DO (mg/L)
pH
Conductivity (µS/cm)
Reference reactor of 5 ºC 20 5 7.05 632 4.5 7.21 928 Test reactor 5 10.9 7.25 651 10.6 7.52 959 Reference reactor of 10 ºC 20 6 7.33 899 2.7 7.32 969 Test reactor 10 9.4 7.49 910 8.2 7.47 977 Reference reactor of 15 ºC 20 3.2 7.12 778 5.2 7.15 933 Test reactor 15 6.4 7.26 784 7.8 7.39 930 Reference reactor 20 4.2 7.21 1068 4.2 7.2 965 Test reactor 30 2.5 7.29 1070 3.5 7.25 970 Anaerobic conditions 1st Experiment 2nd Experiment
Temperature (ºC)
DO (mg/L) pH
Conductivity(µS/cm)
DO (mg/L)
pH
Conductivity(µS/cm)
Reference reactor 20 0.2 8.22 850 0.2 8.1 959 Test reactor 5 0.1 8.33 867 0.4 8 976 Reference reactor 20 0.02 8.1 988 0.02 8.11 1691 Test reactor 10 0.03 8.07 994 0.004 8 1709 Reference reactor 20 0.02 7.5 790 0.03 8.1 929 Test reactor 15 0.02 7.94 773 0.02 8.28 926 Reference reactor 20 0.03 8.18 996 0.03 8.15 1019 Test reactor 30 0.03 8.26 986 0.03 8.26 1011 Appendix (VIII): Average concentration of ions (mg/g MLSS) in the total sludge Aerobic conditions Anaerobic conditions Temp. Na Mg Al K Ca Fe Na Mg Al K Ca Fe 5ºC 19.034 3.6528 12.25 18.69 15.267 124.66 29.217 4.272819 11.77 25.12743 12.385 135.17 10ºC 26.676 3.7419 11.11 23.62 8.1905 119.24 20.588 5.006719 12.34 18.76746 11.294 132.97 15ºC 27.564 4.3444 13.85 26.89 11.695 125.11 20.826 4.407822 13.99 24.22449 9.1169 141.1 30ºC 27.033 4.656 13.52 24.28 12.219 121.49 31.724 4.831177 14.75 33.07583 14.914 144.58

59
Appendix (IX): The concentration of ions (mg/L) in the supernatant of the duplicated experiments performed under aerobic conditions I II I II I II I II I II I II 20ºC(Reference Reactor of 5ºC) Time (min) Na Na Mg Mg Al Al K K Ca Ca Fe Fe 0 95.81602 140.5187 5.30882 8.245455 0.042068 0.03706 13.39891 17.29353 15.59087 20.95616 0.003603 0.023428 60 100.8107 149.626 4.633318 7.51867 0.103793 0.07748 14.52096 18.92495 13.10803 18.55554 0.023308 0.07328 120 103.2666 151.9535 4.449973 7.300265 0.079538 0.074283 15.13066 19.3217 12.76263 18.00282 0.029575 0.023025 5ºC (Test Reactor ) Time (min) Na Na Mg Mg Al Al K K Ca Ca Fe Fe 0 61.82792 147.4577 3.725353 9.1925 0.038115 0.05814 9.330705 17.54132 10.53988 22.43709 0.009895 0.01431 60 101.6073 152.1109 5.396055 8.54476 0.07148 0.068845 14.57466 18.93513 14.71398 20.11061 0.018805 0.026235 120 53.74614 152.6612 2.89656 8.283953 0.047105 0.067448 8.25054 19.28942 7.68018 19.17841 -0.00293 0.01958 20ºC (Reference Reactor of 10ºC) Time (min) Na Na Mg Mg Al Al K K Ca Ca Fe Fe 0 146.483 158.8645 8.898203 8.60195 0.050695 0.043603 18.95454 20.30403 20.90342 21.23464 0.02909 0.01617 60 148.1646 159.8153 8.044778 7.588975 0.060318 0.08455 19.88705 20.62129 18.2889 18.87195 0.0281 0.012623 120 147.8918 163.2553 7.600393 7.399165 0.062768 0.095305 19.75231 21.49717 17.17869 18.35699 0.004293 0.013588 10ºC (Test Reactor ) Time (min) Na Na Mg Mg Al Al K K Ca Ca Fe Fe 0 142.7957 157.6621 9.129945 9.007455 0.05529 0.065503 18.13441 19.64585 21.12486 22.81311 0.010043 0.039863 60 146.8164 161.2961 8.708535 8.404983 0.072198 0.076656 19.36539 20.59541 19.78882 19.88564 0.029308 0.026635 120 147.6172 144.0445 8.489345 7.513273 0.0586 0.086668 19.43543 21.00268 18.74089 19.42608 0.003575 0.01847 20ºC (Reference Reactor of 15ºC) Time (min) Na Na Mg Mg Al Al K K Ca Ca Fe Fe 0 123.0454 139.0896 7.169945 8.517748 0.053155 0.06115 19.09261 18.8601 21.86609 22.93229 0.013928 0.006548 60 122.2354 155.0819 6.339055 8.446485 0.108313 0.114703 19.46353 21.42005 19.143 21.95651 0.012775 0.007255 120 124.7254 152.0793 6.201618 8.26885 0.115638 0.099705 20.32668 21.06605 18.74355 21.30061 0.017058 0.007728 15ºC (Test Reactor)

60
Time (min) Na Na Mg Mg Al Al K K Ca Ca Fe Fe 0 120.8962 156.0155 7.125395 9.583635 0.06897 0.045855 19.40616 21.13809 21.4364 25.672 0.00622 0.005083 60 111.8428 157.5448 6.112463 8.933263 0.08764 0.101328 17.28393 21.75677 17.95326 23.11977 0.00527 0.004752 120 117.4768 157.2959 6.215695 8.687915 0.104033 0.106498 18.78674 21.68335 18.20816 22.22483 0.015505 0.00184 20ºC (Reference Reactor of 30ºC) Time (min) Na Na Mg Mg Al Al K K Ca Ca Fe Fe 0 181.4167 164.7379 10.04073 9.138575 0.07555 0.043145 20.19553 21.13243 23.66542 23.94417 0.00532 0.014185 60 185.0601 163.9059 9.274263 8.157 0.095723 0.093218 20.8872 21.44869 21.09238 20.70882 0.010283 -0.00361 120 183.5736 166.2722 8.917035 7.954463 0.101093 0.099435 20.88263 21.73157 20.25243 20.11162 -0.00627 0.002688 30ºC (Test Reactor) Time (min) Na Na Mg Mg Al Al K K Ca Ca Fe Fe 0 186.2797 162.0016 10.01507 8.702725 0.15087 0.064893 21.48066 21.47508 24.20285 23.45413 0.018295 0.033113 60 185.8998 166.3112 8.844483 7.8002 0.104615 0.097788 21.61152 22.36579 20.58831 20.01477 0.01269 0.014725 120 188.2155 168.5651 8.758293 7.698358 0.105285 0.09551 22.36695 22.5826 20.21064 19.62192 0.002623 0.02337
Appendix (X): The concentration of ions (mg/l) in the supernatant of the duplicated experiments performed under anaerobic conditions 20ºC (Reference Reactor of 5ºC) I II I II I II I II I II I II Time (min) Na Na Mg Mg A Al K K Ca Ca Fe Fe 0 132.9732 116.9981 7.892848 7.148373 0.061075 0.036435 23.22232 21.96067 20.67676 19.40639 0.293128 0.182845 60 132.2204 148.6423 6.090355 7.44514 0.121265 0.173595 26.01813 31.18653 12.98433 16.39211 0.303763 0.14495 120 130.6425 150.178 5.328633 6.978888 0.197245 0.110378 26.98947 32.93566 10.2494 13.406 0.185343 0.195803 5ºC (Test Reactor) Time (min) Na Na Mg Mg Al Al K K Ca Ca Fe Fe 0 130.3854 145.7639 8.295648 8.934608 0.049515 0.041558 22.23593 26.07868 21.87552 24.0755 0.129003 0.089183 60 131.6635 148.7036 6.739755 7.589293 0.069178 0.05855 23.30815 26.77984 15.71234 19.43705 0.11916 0.075035 120 133.6614 150.3327 6.234018 7.397765 0.136838 0.06487 24.7043 27.20157 13.67108 18.69881 0.13771 0.070188 20ºC (Reference Reactor of 10ºC)

61
Time (min) Na Na Mg Mg Al Al K K Ca Ca Fe Fe 0 151.1813 281.6633 9.007833 24.24361 0.04336 0.069218 25.31195 25.87046 22.25649 26.12693 0.172043 0.174138 60 155.0306 276.4796 7.995055 21.07758 0.110075 0.101393 29.06015 26.17269 16.28746 20.84543 0.140795 0.093838 120 155.5739 292.712 7.456093 21.69738 0.127365 0.142525 30.82038 30.75798 13.49395 19.37442 0.12125 0.08955 10ºC (Test Reactor) Time (min) Na Na Mg Mg Al Al K K Ca Ca Fe Fe 0 151.496 282.5775 8.913575 24.42277 0.04885 0.099738 24.57217 25.298 21.80167 25.91379 0.125193 0.106765 60 152.905 225.2842 7.94658 12.38617 0.101408 0.059233 25.96808 14.73739 17.11733 12.40875 0.153975 0.097295 120 156.6839 289.6421 7.6551 22.38791 0.100883 0.07865 26.65666 27.89735 16.12719 20.59781 0.093583 0.085633 20ºC (Reference Reactor of 15ºC) Time (min) Na Na Mg Mg Al Al K K Ca Ca Fe Fe 0 121.6507 148.2102 7.648833 8.424398 0.06037 0.105148 18.1175 22.91427 17.48648 18.76153 0.059433 0.081408 60 123.9406 150.3306 7.027953 7.271108 0.157535 0.21163 20.1636 25.19374 13.38728 13.78743 0.09763 0.065588 120 123.8745 150.7956 6.813863 6.951015 0.205118 0.253158 21.67079 26.97784 11.79539 11.91678 0.107785 0.06345 15ºC (Test Reactor) Time (min) Na Na Mg Mg Al Al K K Ca Ca Fe Fe 0 119.9635 151.8578 7.766175 8.765628 0.083103 0.09077 17.8366 23.14286 17.83105 19.76307 0.051983 0.060123 60 123.759 149.6862 6.648453 7.363963 0.101955 0.150588 18.81982 24.23043 13.41702 14.45912 0.039203 0.05204 120 124.717 154.4003 5.965265 7.296373 0.101723 0.162575 19.1383 26.57633 11.7448 12.7762 0.036753 0.066265 Reference Reactor of 30ºC(A) Time (min) Na Na Mg Mg Al Al K K Ca Ca Fe Fe 0 161.3775 172.335 8.90062 8.70459 0.186985 0.0994 24.89475 24.69442 20.71667 21.88572 0.113053 0.101733 60 167.2616 175.044 8.225063 7.847215 0.404308 0.310593 27.96121 27.13008 16.67774 17.20068 0.07647 0.097465 120 160.715 173.2609 7.99239 7.044005 0.591425 0.484333 28.50536 28.84171 15.9727 13.43259 0.110248 0.0853 Test Reactor 30ºC(B) Time (min) Na Na Mg Mg Al Al K K Ca Ca Fe Fe 0 164.1148 172.678 8.86932 8.48461 0.16089 0.098 26.73193 25.84329 20.14777 20.66592 0.164063 0.10215 60 167.3063 171.6506 7.695123 6.89318 0.522935 0.453743 30.10954 28.75508 14.55497 13.55135 0.069853 0.058153 120 160.4228 171.3466 6.847178 6.288013 0.634085 0.616323 29.92011 30.28081 11.81108 11.07396 0.091578 0.049225

62

63
Appendix (XI): The average concentration of ions (mg/L) in the supernatant of experiments performed under aerobic conditions 20ºC (Reference reactor of 5ºC) Time (min) Na Mg Al K Ca Fe 0 118.1673 6.777138 0.039564 15.34622 18.27352 0.013515 60 125.2183 6.075994 0.090636 16.72295 15.83178 0.048294 120 127.6101 5.875119 0.07691 17.22618 15.38272 0.0263 5ºC (Test reactor) Time (min) Na Mg Al K Ca Fe 0 104.6428 6.458926 0.048128 13.43601 16.48848 0.012103 60 126.8591 6.970408 0.070163 16.7549 17.4123 0.02252 120 103.2037 5.590256 0.057276 13.76998 13.42929 0.008324 20ºC (Reference reactor of 10ºC) Time (min) Na Mg Al K Ca Fe 0 152.6737 8.750076 0.047149 19.62928 21.06903 0.02263 60 153.9899 7.816876 0.072434 20.25417 18.58043 0.020361 120 155.5736 7.499779 0.079036 20.62474 17.76784 0.00894 10ºC (Test reactor) Time (min) Na Mg Al K Ca Fe 0 150.2289 9.0687 0.060396 18.89013 21.96899 0.024953 60 154.0562 8.556759 0.154378 19.9804 19.83723 0.194858 120 145.8308 8.001309 0.072634 18.96406 19.08348 0.011023 20ºC (Reference reactor of 15ºC) Time (min) Na Mg Al K Ca Fe 0 131.0675 7.843846 0.057153 18.97635 22.39919 0.010238 60 138.6587 7.39277 0.111508 20.44179 20.54976 0.010015 120 138.4024 7.235234 0.107671 20.69636 20.02208 0.012393 15ºC (Test reactor) Time (min) Na Mg Al K Ca Fe 0 138.4559 8.354515 0.057413 20.27212 23.5542 0.013525 60 134.6938 7.522863 0.094484 19.52035 20.53652 0.021395 120 137.3864 7.451805 0.105265 20.23504 20.21649 0.008673 20ºC (Reference reactor of 30ºC) Time (min) Na Mg Al K Ca Fe 0 173.0773 9.589654 0.059348 20.66398 23.8048 0.009753 60 174.483 8.715631 0.09447 21.16795 20.9006 0.003339 120 174.9229 8.435749 0.100264 21.3071 20.18203 -0.00179 30ºC (Test reactor) Time (min) Na Mg Al K Ca Fe 0 174.1407 9.358898 0.107881 21.47787 23.82849 0.025704 60 176.1055 8.322341 0.101201 21.98866 20.30154 0.013708 120 178.3903 8.228325 0.100398 22.47477 19.91628 0.012996

64
Appendix (XII): The average concentration of ions (mg/l) in the supernatant of experiments performed under anaerobic conditions 20ºC (Reference reactor of 5ºC) Time (min) Na Mg Al K Ca Fe 0 124.9856 7.52061 0.048755 22.59149 20.04158 0.237986 60 140.4313 6.767748 0.14743 28.60233 14.68822 0.224356 120 140.4102 6.15376 0.153811 29.96256 11.8277 0.190573 5ºC (Test reactor) Time (min) Na Mg Al K Ca Fe 0 138.0747 8.615128 0.045536 24.15731 22.97551 0.109093 60 140.1835 7.164524 0.063864 25.04399 17.57469 0.097098 120 141.9971 6.815891 0.100854 25.95294 16.18495 0.103949 20ºC (Reference reactor of 10ºC) Time (min) Na Mg Al K Ca Fe 0 216.4223 16.62572 0.056289 25.5912 24.19171 0.17309 60 215.7551 14.53632 0.105734 27.61642 18.56645 0.117316 120 224.143 14.57674 0.134945 30.78918 16.43418 0.1054 10ºC (Test reactor) Time (min) Na Mg Al K Ca Fe 0 217.0367 16.66817 0.074294 24.93509 23.85773 0.115979 60 155.0946 10.16638 0.08032 20.35273 14.76304 0.146346 120 223.163 15.0215 0.139766 27.277 18.3625 0.089608 20ºC (Reference reactor of 15ºC) Time (min) Na Mg Al K Ca Fe 0 134.9304 8.036615 0.082759 20.51589 18.124 0.07042 60 137.1356 7.14953 0.184583 22.67867 13.58735 0.081609 120 137.3351 6.882439 0.229138 24.32431 11.85608 0.085618 15ºC(Test reactor ) Time (min) Na Mg Al K Ca Fe 0 135.9107 8.265901 0.086936 20.48973 18.79706 0.056053 60 136.7226 7.006208 0.126271 21.52513 13.93807 0.045621 120 139.5586 6.630819 0.132149 22.85731 12.2605 0.051509 20ºC (Reference reactor of 30ºC) Time (min) Na Mg Al K Ca Fe 0 166.8562 8.802605 0.143193 24.79459 21.3012 0.107393 60 172.1528 8.036139 0.35745 27.54564 16.93921 0.086968 120 166.9879 7.518198 1.137879 28.67354 14.70264 4.527774 30ºC (Test reactor) Time (min) Na Mg Al K Ca Fe 0 168.3964 8.676965 0.129445 26.28761 20.40684 0.183106 60 169.4784 7.294151 0.463339 29.43231 14.05316 0.064003 120 165.8847 6.567595 0.625204 30.10046 11.44252 0.070401