study of the quality montreal · 3 determinants of a quality air service 1. determinants of an air...
TRANSCRIPT

STUDY OF THE QUALITYOF THE AIR SERVICE IN
MONTREAL
September 2014
© 2014 KPMG LLP, a Canadian limited liability partnership and a member firm of the KPMG network of independent member firmsaffiliated with KPMG International Cooperative (“KPMG International”), a Swiss entity. All rights reserved.1
TABLE OF CONTENTS
Introduction2
Determinants of aquality air service
Evaluation of the airservice in Montreal
Conclusion
Potential forimproving the service
3
8
24
33

© 2014 KPMG LLP, a Canadian limited liability partnership and a member firm of the KPMG network of independent member firmsaffiliated with KPMG International Cooperative (“KPMG International”), a Swiss entity. All rights reserved.2
INTRODUCTION
With the globalization of trade, the quality of a region's air service isan increasingly important driver of economic development
• The quality of a service influences the attractiveness of a location for headoffices and companies with international operations
• Regions that are well connected with the rest of the world are often moredynamic and innovative
Conversely, economic strength also influences the quality of theexisting air service
• The demand for air services is closely linked to the strength and structureof the local economy
• This demand is also closely related to a region's level of wealth
Evaluating the quality of an air service is a complex exercise• It requires an understanding of the decision-making factors for air
carriers and the environment in which they work in order to judge the levelof air services on offer
• Evaluation of the quality of service must also be put into the context of theregion's existing socioeconomic characteristics
In this context, the presentstudy includes twoobjectives
1. To evaluate the Montreal airservice in comparison withother similar North Americancities
2. To identify potential areas ofdevelopment for the service toand from Montreal-Trudeauairport

3
DETERMINANTS OF A QUALITYAIR SERVICE1. Determinants of an air service
2. Evaluation parameters of the quality of an airservice

© 2014 KPMG LLP, a Canadian limited liability partnership and a member firm of the KPMG network of independent member firmsaffiliated with KPMG International Cooperative (“KPMG International”), a Swiss entity. All rights reserved.4
In addition to a balance between supply and demand, a large number of conditions must also be met toallow the establishment of a new link
DETERMINANTS OF AN AIR SERVICE
CARRIERS' PROVISION AND DEMAND FOR TRAVEL:KEY DETERMINANTS OF A REGION'S AIR SERVICE
The air service of a city or region is first and foremost a question of profitability for the carriers, which is itselfdependent on demand
THE SUPPLY of air connections depends mainly on thefinancial and strategic interests of private carriers
§ With the disappearance of public carriers and competitionwithin the industry, the establishment of a new connection isa business decision based on a rigorous financial analysis
§ As a general rule, the establishment or maintenance of anair link assumes the existence of a sufficient minimumdemand to make this connection profitable
A city's basic air transport DEMAND is dependent on severalsocioeconomic and geographic factors
• The strength and structure of the local economy, wealth,socio-demographic profile and the region's attractivenessgreatly influence the demand for a city as an origin-destination
• A favourable geographical position can encourage acarrier to choose a city as a hub, allowing the carrier toacquire additional (connecting) traffic
CONSTRAINTS may hamper the establishment of directconnections
• These constraints may be related to the capacity of theorigin and destination airports, to taxation or regulations
SOME LEVERS may have a positive influence on thedevelopment of a service
• These levers include, among other things, the financialincentives offered by airports and the mobilization ofstakeholders

© 2014 KPMG LLP, a Canadian limited liability partnership and a member firm of the KPMG network of independent member firmsaffiliated with KPMG International Cooperative (“KPMG International”), a Swiss entity. All rights reserved.5
DEMANDTravel demand (destination and frequency)
• Leisure travellers• Business travellers• Family and friends travellers• Connecting traffic
DETERMINANTS OF AN AIR SERVICE
ANALYSIS OF AN AIR SERVICE:SUPPLY AND DEMAND, PLUS LEVERS AND CONSTRAINTS
Origin – destination demand§ Strength of economy (employment, growth)§ Wealth (GDP, average income)§ Industrial structure (main industries, large
companies, head offices)§ Socio-demographic profile (% immigrants)§ Attractiveness of the city (tourism, business)
Source: KPMG-SECOR
CARRIER PROVISIONDecision criteria for airlines (routes, frequency)
• Level of traffic anticipated (local andconnecting)
• Pricing• Potential for profitability (load factor, yield)
LEVERS§ Direct subsidies§ Reduction of costs (e.g. landing fees)§ Minimum guaranteed volume§ Investment in promotion§ Involvement of the business community
and government
CONSTRAINTS§ Capacity of origin and destination
airports (e.g. infrastructure, schedules)§ Taxes, landing fees and other costs§ Policies and regulations
§ Business model (e.g. regular, LCC, charter)§ Network strategy (e.g. hub & spoke,
point-to-point)§ Fleet (number, type and capacity)§ Cost structure§ Revenue structure
Connection demand§ Geographical location§ Quality of airport experience (e.g. waiting
time, comfort)
OPTIMALSERVICE
© 2014 KPMG LLP, a Canadian limited liability partnership and a member firm of the KPMG network of independent member firmsaffiliated with KPMG International Cooperative (“KPMG International”), a Swiss entity. All rights reserved.6
DETERMINANTS OF AN AIR SERVICETHE CARRIER'S PERSPECTIVE: A MINIMUM DEMAND OF BETWEEN 10,000 AND 40,000 PASSENGERS FORA DIRECT LINK FROM MONTREAL DEPENDING ON THE DESTINATION
Source: KPMG-SECOR
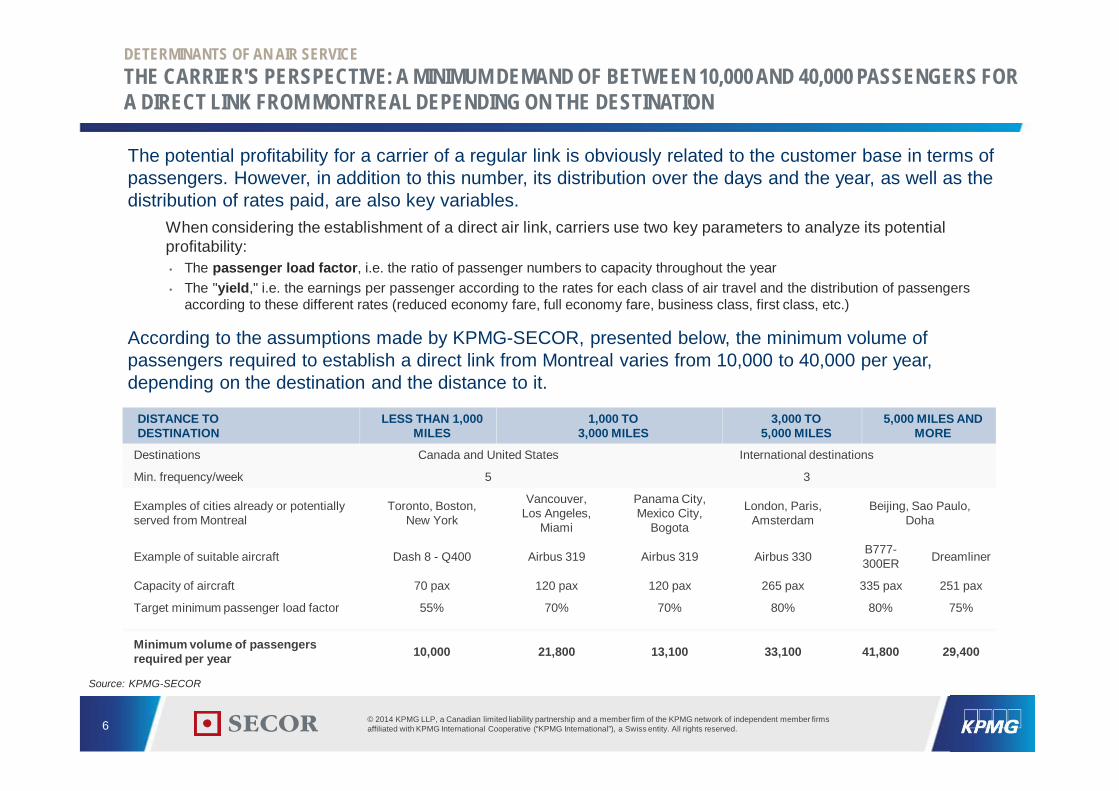
DISTANCE TODESTINATION
LESS THAN 1,000MILES
1,000 TO3,000 MILES
3,000 TO5,000 MILES
5,000 MILES ANDMORE
Destinations Canada and United States International destinations
Min. frequency/week 5 3
Examples of cities already or potentiallyserved from Montreal
Toronto, Boston,New York
Vancouver,Los Angeles,
Miami
Panama City,Mexico City,
Bogota
London, Paris,Amsterdam
Beijing, Sao Paulo,Doha
Example of suitable aircraft Dash 8 - Q400 Airbus 319 Airbus 319 Airbus 330 B777-300ER Dreamliner
Capacity of aircraft 70 pax 120 pax 120 pax 265 pax 335 pax 251 pax
Target minimum passenger load factor 55% 70% 70% 80% 80% 75%
Minimum volume of passengersrequired per year 10,000 21,800 13,100 33,100 41,800 29,400
The potential profitability for a carrier of a regular link is obviously related to the customer base in terms ofpassengers. However, in addition to this number, its distribution over the days and the year, as well as thedistribution of rates paid, are also key variables.
When considering the establishment of a direct air link, carriers use two key parameters to analyze its potentialprofitability:• The passenger load factor, i.e. the ratio of passenger numbers to capacity throughout the year• The "yield," i.e. the earnings per passenger according to the rates for each class of air travel and the distribution of passengers
according to these different rates (reduced economy fare, full economy fare, business class, first class, etc.)
According to the assumptions made by KPMG-SECOR, presented below, the minimum volume ofpassengers required to establish a direct link from Montreal varies from 10,000 to 40,000 per year,depending on the destination and the distance to it.

© 2014 KPMG LLP, a Canadian limited liability partnership and a member firm of the KPMG network of independent member firmsaffiliated with KPMG International Cooperative (“KPMG International”), a Swiss entity. All rights reserved.7
KEY PARAMETERS FOR EVALUATING THE QUALITY OF AN AIR SERVICE
PARAMETERS FOR EVALUATING THE QUALITY OF AN AIR SERVICE
THE PASSENGER'S PERSPECTIVE: A QUALITY SERVICE DEPENDS FIRSTLY ONDESTINATIONS AND ALSO ON THE FREQUENCY OF FLIGHTS
Source: KPMG-SECOR
A greater number of destinations servedby direct flights allows improvedaccessibility for travellers and reducedtravelling time, a particularly importantfactor for business travellers.
0 – 10
10 – 20
...
NUMBER OFDESTINATIONS SERVEDBY DIRECT FLIGHTS1
The cities served are not all of equalimportance in terms of business andconnectivity. The "major" cities, that isthe 123 most economically influentialcities, have been identified using theGaWC network classification.
Holiday destinations
Secondary cities
Major cities (including largeinternational hubs)
IMPORTANCE OFDESTINATIONS2
A quality service usually includes aminimum of three flights per weekthroughout the year to majorinternational cities served and five flightsper week to major Canadian andAmerican cities. Access to more flightsand to a variety of carriers providesgreater choice and flexibility fortravellers.
Seasonal link
Year-round link with 1 to 3flights per week
Regular link with 3 to 7 flightsper week
Regular link with more than 7flights per week
FREQUENCY OFFLIGHTS3

8
EVALUATION OF THE AIRSERVICE IN MONTREAL1. Context: customer base and carriers
2. Quality of the air service in Montreal
3. The Montreal air service within the Canadiancontext
4. North American comparison of air servicequality

© 2014 KPMG LLP, a Canadian limited liability partnership and a member firm of the KPMG network of independent member firmsaffiliated with KPMG International Cooperative (“KPMG International”), a Swiss entity. All rights reserved.9
CONTEXT: CUSTOMER BASE AND CARRIERS
CUSTOMER BASE OF MONTREAL AIRPORT:SIGNIFICANT GROWTH, PARTICULARLY IN TERMS OF INTERNATIONAL PASSENGERS
2004 2005 2006 2007 2008 2009 2010 2011 2012 2013
13
14
5
15
10
11
12
4
2
3
0
5,4
3,2
4,4
3,0
3,52,8
9,4
4,3 4,75,2
13,0
4,9
12,2
3,1
5,0
4,6
2,9
4,8
12,8
4,5
3,1
5,3
12,8
3,2
5,2
13,8
5,4
3,4
5,3
14,1
2,3
5,3
4,2
10,911,4
3,7
13,7
5,2
3,1 3,2
CAGR 2004-2013
2.5%9.8%
2.1%
DomesticInternational
Transborder
4.6%Total
Sources: ADM, KPMG-SECOR
The total number of passengers at Montreal-Trudeau increased from 9.4 million in 2004 to over 14million in 2013
• An average annual increase of 4.6%, greater than the increase in Quebec's GDP and population
The number of international passengers has shown the greatest increase during this period, withan average annual growth rate of 9.8%.
NUMBER OF PASSENGERS AT MONTREAL-TRUDEAUIN MILLIONS OF PASSENGERS, 2004-2013

© 2014 KPMG LLP, a Canadian limited liability partnership and a member firm of the KPMG network of independent member firmsaffiliated with KPMG International Cooperative (“KPMG International”), a Swiss entity. All rights reserved.10
CONTEXT: CUSTOMER BASE AND CARRIERS
GREAT DIVERSITY OF ACTIVE AIR CARRIERS IN MONTREAL,INCLUDING 20 CARRIERS WITH INTERNATIONAL SERVICES
A total of 29 air carriers are active at Montreal-Trudeau in 2014• 20 of the current carriers in Montreal serve the international sector and 15 are affiliated with an air carrier alliance,
allowing greater ease of connection
CARRIER AFFILIATION INTERNATIONALSERVICE
1. Air Canada Star Alliance ü2. Air Transat ü3. Westjet ü4. Porter Airlines
5. American Airlines OneWorld ü6. Delta Air Lines SkyTeam ü7. Sunwing Airlines ü8. Air France SkyTeam ü
9. United Airlines Star Alliance ü
10. US Airways OneWorld ü11. KLM SkyTeam ü12. British Airways OneWorld ü13. Royal Air Maroc ü14. Lufthansa Star Alliance ü15. SWISS Star Alliance ü
CARRIER AFFILIATION INTERNATIONALSERVICE
16. Aeromexico SkyTeam ü17. Air Inuit
18. CORSAIR ü19. Air Algerie ü20. Qatar Airways OneWorld ü21. Cubana ü22. Royal Jordanian OneWorld ü23. First Air
24. Provincial Airlines
25. Air Creebec26. Turkish Airlines Star Alliance ü27. COPA Star Alliance ü28. Air St. Pierre ü29. SATA International ü
CURRENT AIR CARRIERS IN MONTREALAUGUST 2013 – JULY 2014
Sources: ADM, KPMG-SECOR

© 2014 KPMG LLP, a Canadian limited liability partnership and a member firm of the KPMG network of independent member firmsaffiliated with KPMG International Cooperative (“KPMG International”), a Swiss entity. All rights reserved.11
QUALITY OF AIR SERVICE IN MONTREAL
TOTAL NUMBER OF DESTINATIONS WITH A DIRECT SERVICE: 129 DIRECT LINKS AVAILABLEIN MONTREAL, INCLUDING 75 INTERNATIONAL LINKS
Source: ADM
The air service in Montreal included a total of 129 destinations in 2013• 75 international destinations, 26 in the United States and 28 in Canada

© 2014 KPMG LLP, a Canadian limited liability partnership and a member firm of the KPMG network of independent member firmsaffiliated with KPMG International Cooperative (“KPMG International”), a Swiss entity. All rights reserved.12
EXAMPLES OF IMPORTANT NEW DIRECT INTERNATIONAL CONNECTIONS FROM MONTREAL2005-2014
QUALITY OF AIR SERVICE IN MONTREAL
TOTAL NUMBER OF DESTINATIONS WITH A DIRECT SERVICE:ADDITION OF SEVERAL IMPORTANT CONNECTIONS IN THE LAST 10 YEARS
Prague*
Panama City
Tunis
Istanbul
Istanbul*
Doha
Geneva
Venice*
201420112009
Dublin*
Basel*
2008
Algiers
Barcelona*
Amman
2007
Madrid*
2006
Brussels
Rome*
Lisbon*
Toulouse*
2005
Sources: ADM, KPMG-SECOR
*Destinations served on a predominantly seasonal basis (summer)
Montreal's air service has undergone significant improvement over the past ten years, the number ofdirect international destinations available from Montreal having increased from 30 to 75
• In 2014, four new direct destinations were added to the schedule, namely Istanbul, Panama City, Tunis and Prague(summer)

© 2014 KPMG LLP, a Canadian limited liability partnership and a member firm of the KPMG network of independent member firmsaffiliated with KPMG International Cooperative (“KPMG International”), a Swiss entity. All rights reserved.13
QUALITY OF AIR SERVICE IN MONTREAL
IMPORTANT DESTINATIONS AND FREQUENCY OF FLIGHTS: A REGULAR SERVICE TO 28MAJOR CITIES
1. Amman2. San Francisco*
Destinations served throughout theyear but with fewer than 3
flights/week
1. Athens2. Barcelona3. Lisbon4. Lyon5. Panama City*6. Rome7. Tampa
Seasonal destinations
*Note: During the analysis period (2013) Panama City had only a seasonal connection, and flights to San Francisco were maintained at arate of 3 flights or more per week for each week of the year.
Sources: ADM with Diio, KPMG-SECOR
1. Amsterdam2. Atlanta3. Boston4. Brussels5. Calgary6. Casablanca7. Chicago8. Cleveland9. Dallas10. Denver11. Detroit12. Doha13. Frankfurt14. Geneva
15. Houston16. London17. Los Angeles18. Mexico City19. Miami20. Minneapolis21. Munich22. New York23. Paris24. Philadelphia25. Toronto26. Vancouver27. Washington28. Zurich
Scheduled destinations (3 flights ormore per week throughout the year)
With regard to major cities, namely the 123 most influential cities in the world, Montreal had a significantconnection in 2013 with 37 of them, with 50 flights or more flights per year
• 28 major cities are served on a regular basis, with a minimum of three flights per week throughout the year
DIRECT CONNECTIONS BETWEEN MONTREAL AND THE 123 MOST INFLUENTIAL CITIES IN THE WORLDMAJOR CITIES SERVED BY 50 FLIGHTS OR MORE PER YEAR, 2013
© 2014 KPMG LLP, a Canadian limited liability partnership and a member firm of the KPMG network of independent member firmsaffiliated with KPMG International Cooperative (“KPMG International”), a Swiss entity. All rights reserved.14
QUALITY OF AIR SERVICE IN MONTREAL
IMPORTANT DESTINATIONS AND FREQUENCY OF FLIGHTS: A REGULAR SERVICE TO 17MAJOR INTERNATIONAL HUBS
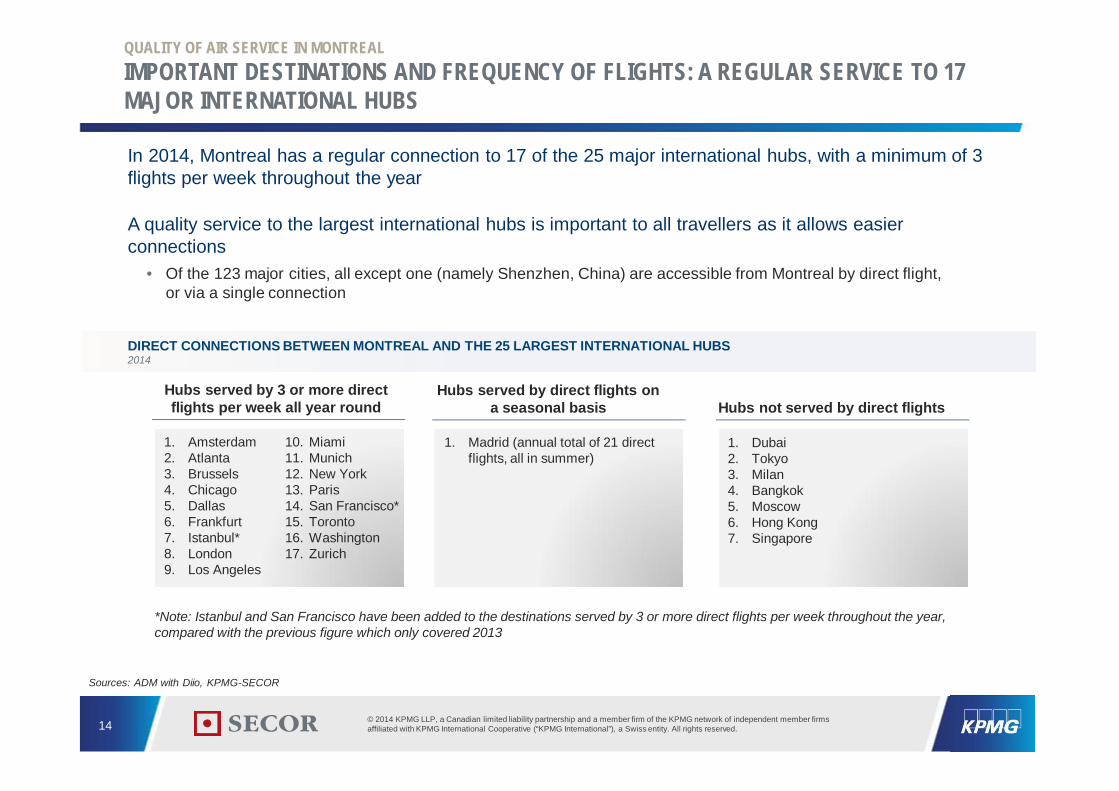
1. Dubai2. Tokyo3. Milan4. Bangkok5. Moscow6. Hong Kong7. Singapore
1. Madrid (annual total of 21 directflights, all in summer)
Hubs served by direct flights ona seasonal basis Hubs not served by direct flights
1. Amsterdam2. Atlanta3. Brussels4. Chicago5. Dallas6. Frankfurt7. Istanbul*8. London9. Los Angeles
10. Miami11. Munich12. New York13. Paris14. San Francisco*15. Toronto16. Washington17. Zurich
Hubs served by 3 or more directflights per week all year round
*Note: Istanbul and San Francisco have been added to the destinations served by 3 or more direct flights per week throughout the year,compared with the previous figure which only covered 2013
Sources: ADM with Diio, KPMG-SECOR
In 2014, Montreal has a regular connection to 17 of the 25 major international hubs, with a minimum of 3flights per week throughout the year
A quality service to the largest international hubs is important to all travellers as it allows easierconnections
• Of the 123 major cities, all except one (namely Shenzhen, China) are accessible from Montreal by direct flight,or via a single connection
DIRECT CONNECTIONS BETWEEN MONTREAL AND THE 25 LARGEST INTERNATIONAL HUBS2014
© 2014 KPMG LLP, a Canadian limited liability partnership and a member firm of the KPMG network of independent member firmsaffiliated with KPMG International Cooperative (“KPMG International”), a Swiss entity. All rights reserved.15
MONTREAL'S AIR SERVICE WITHIN THE CANADIAN CONTEXT
A GREATER CUSTOMER BASE THAN VANCOUVER AND CALGARY AT INTERNATIONAL LEVEL,BUT SMALLER AT DOMESTIC LEVEL
100 %
Calgary
Domestic
TransborderInternational
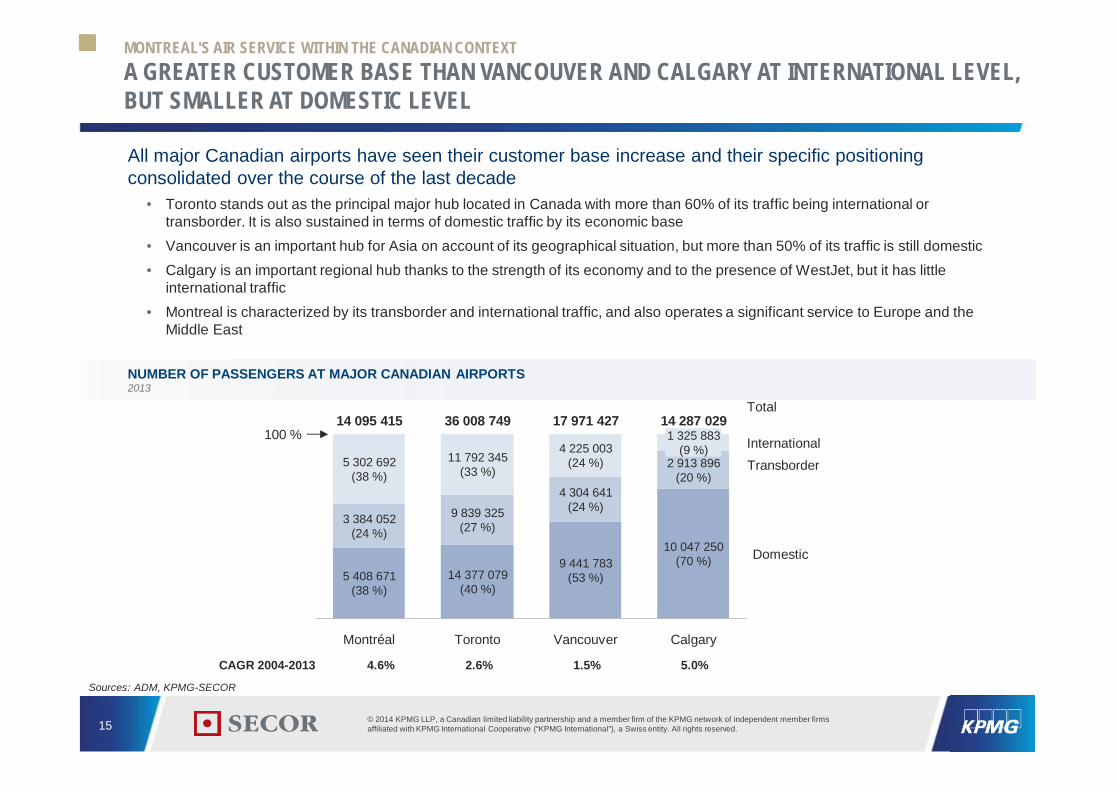
14 287 029
10 047 250(70 %)
2 913 896(20 %)
1 325 883(9 %)
Vancouver
17 971 427
9 441 783(53 %)
4 304 641(24 %)
4 225 003(24 %)
Toronto
36 008 749
14 377 079(40 %)
9 839 325(27 %)
11 792 345(33 %)
Montréal
14 095 415
5 408 671(38 %)
3 384 052(24 %)
5 302 692(38 %)
Total
CAGR 2004-2013 4.6% 2.6% 1.5% 5.0%
All major Canadian airports have seen their customer base increase and their specific positioningconsolidated over the course of the last decade
• Toronto stands out as the principal major hub located in Canada with more than 60% of its traffic being international ortransborder. It is also sustained in terms of domestic traffic by its economic base
• Vancouver is an important hub for Asia on account of its geographical situation, but more than 50% of its traffic is still domestic• Calgary is an important regional hub thanks to the strength of its economy and to the presence of WestJet, but it has little
international traffic• Montreal is characterized by its transborder and international traffic, and also operates a significant service to Europe and the
Middle East
NUMBER OF PASSENGERS AT MAJOR CANADIAN AIRPORTS2013
Sources: ADM, KPMG-SECOR

© 2014 KPMG LLP, a Canadian limited liability partnership and a member firm of the KPMG network of independent member firmsaffiliated with KPMG International Cooperative (“KPMG International”), a Swiss entity. All rights reserved.16
THE MONTREAL AIR SERVICE WITHIN THE CANADIAN CONTEXT
TOTAL NUMBER OF DESTINATIONS WITH A DIRECT SERVICE: MORE SIGNIFICANTDEVELOPMENT THAN OTHER CANADIAN AIRPORTS
28 28 30 31 36 34 28 32
28 2651 53
25 2414 20
3075
7298
23 28
1221
153
8673
2013
86
200420132004
54
182
129
84
20132013 20042004
TransborderInternational
Domestic
TorontoMontreal Vancouver Calgary
Between 2004 and 2013, 43 new direct connections were made available in Montreal, a more significantdevelopment than in Toronto (29), Calgary (19) and Vancouver (2)
• 45 additional international connections in Montreal compared with 26 in Toronto, 9 in Calgary and 5 in Vancouver• Calgary is the only airport with a significant increase in transborder and domestic destinations
NUMBER OF DESTINATIONS SERVED BY DIRECT FLIGHTSREGULAR AND SEASONAL FLIGHTS, 2004 AND 2013
Source: ADM

© 2014 KPMG LLP, a Canadian limited liability partnership and a member firm of the KPMG network of independent member firmsaffiliated with KPMG International Cooperative (“KPMG International”), a Swiss entity. All rights reserved.17
NORTH AMERICAN COMPARISON OF QUALITY OF SERVICE
IN RELATION TO COMPARABLE AIRPORTS, A FAVOURABLE POSITIONINGWITH REGARD TO DESTINATIONS AND AVERAGE FREQUENCY
Source: KPMG-SECOR
In order to position Montreal within a North American context, 14 comparable airports were selected• These are similar airports located in cities of comparable size and economic importance to Montreal, with the
exception of Toronto which is in a different category due to its status as a major international hub
Montreal compares favourably in terms of the number of direct connections to major cities and isaverage in terms of the number of flights
NORTH AMERICAN CITIES INCLUDED IN THE SAMPLE

© 2014 KPMG LLP, a Canadian limited liability partnership and a member firm of the KPMG network of independent member firmsaffiliated with KPMG International Cooperative (“KPMG International”), a Swiss entity. All rights reserved.18
NORTH AMERICAN COMPARISON OF QUALITY OF SERVICE
IMPORTANT DESTINATIONS SERVED: MONTREAL IN 2ND POSITION WITHIN CANADA,AND 5TH WITHIN NORTH AMERICA
2720
12 11 11 914
8
20
20
18 18 17 1812
1820
2016 13 15 16 16
44 2
18
Bos
ton
2426
22M
inne
apol
is
2S
anD
iego
40
Hou
ston
30
47
Toro
nto
26
Van
couv
er
Den
ver
Sea
ttle
28
Mon
tréa
l
Phi
lade
lpie
29
Det
roit
Cal
gary
Cle
vela
nd
17 16
2
16
Pitt
sbur
gh
Por
tland
17
27
InternationalCanada – USA
Total
2nd in Canada5th in North America
Sources: ADM with Diio, KPMG-SECOR
With 28 direct destinations (32 in 2014) to the world's 123 most influential cities, Montreal is ranked 2ndin Canada and 5th in North America among comparable airports in terms of the number of destinations
• Montreal comes in ahead of Boston and Seattle and is roughly on a par with Philadelphia and Detroit• Houston stands out due to its status as a hub toward South America• In Canada, only Toronto comes in ahead of Montreal with 47 destinations; Montreal is thus better connected to major
global destinations than Vancouver (26) and Calgary (17)
NUMBER OF DIRECT REGULAR CONNECTIONS TO MAJOR CITIESDIRECT CONNECTIONS TO THE 123 MAJOR CITIES WITH A MINIMUM OF 3 FLIGHTS PER WEEK THROUGHOUT THE YEAR, FEBRUARY 2013 - FEBRUARY 2014
MONTREAL'S POSITION

© 2014 KPMG LLP, a Canadian limited liability partnership and a member firm of the KPMG network of independent member firmsaffiliated with KPMG International Cooperative (“KPMG International”), a Swiss entity. All rights reserved.19
NORTH AMERICAN COMPARISON OF QUALITY OF SERVICE
FREQUENCY OF FLIGHTS TO MAJOR DESTINATIONS:MONTREAL IN 2ND POSITION WITHIN CANADA AND 9TH WITHIN NORTH AMERICA
18091650
1924
1723
Bos
ton
Hou
ston
Den
ver
Toro
nto
San
Die
go
1099
873
Det
roit
1515 1514
Min
neap
olis
840
1187
Mon
tréa
l
Sea
ttle
Phi
lade
lpie
1445
Pitt
sbur
gh
771
Por
tland
754
Van
couv
er
629
837
Cal
gary
Cle
vela
nd
Sources: ADM with Diio, KPMG-SECOR
NUMBER OF DIRECT FLIGHTS PER WEEK TO MAJOR CITIES WITH A DIRECT REGULAR CONNECTIONDIRECT FLIGHTS TO DESTINATIONS SERVED BY A MINIMUM OF 3 FLIGHTS PER WEEK THROUGHOUT THE YEAR, FEBRUARY 2013 - FEBRUARY 2014
With regard to the number of flights to major cities, Toronto is ranked first in Canada with 1924 direct flights,ahead of Montreal with 1099 direct flights
• Seven major US cities are also ahead of Montreal. This is largely a reflection of their considerable volume of domesticflights and also their more flexible position due to the bilateral and multilateral "Open Skies" agreements in force in theUnited States
Total
2nd in Canada9th in North America
MONTREAL'S POSITION
InternationalCanada – USA

© 2014 KPMG LLP, a Canadian limited liability partnership and a member firm of the KPMG network of independent member firmsaffiliated with KPMG International Cooperative (“KPMG International”), a Swiss entity. All rights reserved.20
NORTH AMERICAN COMPARISON OF QUALITY OF SERVICE
IMPORTANT DESTINATIONS AND FREQUENCY OF FLIGHTS:GOOD CONNECTIVITY TO MAJOR INTERNATIONAL HUBS
99910101111
13141515
161617
19
Por
tland
Cle
vela
nd
Pitt
sbur
gh
San
Die
go
Cal
gary
Den
ver
Van
couv
er
Min
neap
olis
Det
roit
Sea
ttle
Mon
tréa
l
Hou
ston
Bos
ton
Phi
lade
lpie
Toro
nto
288359402
507582613
699864
953961964975985987
1374
Por
tland
Pitt
sbur
gh
Van
couv
er
Cle
vela
nd
San
Die
go
Cal
gary
Mon
tréa
l
Sea
ttle
Toro
nto*
Hou
ston
Phi
lade
lpie
Det
roit
Min
neap
olis
Den
ver
Bos
ton
Number of regular direct connections Number of direct flights
Note: As Toronto is the only city in the sample that is a major international hub, it is at a disadvantage
Connections
2nd in Canada5th in NorthAmerica
Flights
2nd in Canada8th in NorthAmerica
Sources: ADM with Diio, KPMG-SECOR
When the analysis focuses on service to the 25 most importantinternational hubs:
• Montreal is ranked 2nd in Canada and 5th in North America for the number ofhubs served regularly in 2013, namely 15 (17 in 2014)
• Montreal is ranked 2nd in Canada and 8th in North America for the number offlights to regularly served hubs
NUMBER OF CONNECTIONS AND DIRECT FLIGHTS TO THE 25 MAJOR INTERNATIONAL HUBSFOR DESTINATIONS SERVED BY A MINIMUM OF 3 FLIGHTS PER WEEK THROUGHOUT THE YEAR, FEBRUARY 2013 - FEBRUARY 2014
MONTREAL'S POSITION

© 2014 KPMG LLP, a Canadian limited liability partnership and a member firm of the KPMG network of independent member firmsaffiliated with KPMG International Cooperative (“KPMG International”), a Swiss entity. All rights reserved.21
NORTH AMERICAN COMPARISON OF QUALITY OF SERVICE
A SERVICE CONSISTENT WITH THE SOCIOECONOMICVARIABLES OF THE MONTREAL REGION
0
10
20
30
40
50
400.000300.000200.000100.0000
San DiegoPortland
Seattle
Houston
Denver Minneapolis
Detroit
ClevelandPittsburgh
Philadelphie
BostonCalgary
Vancouver
Toronto*
Montréal
200.000100.0000
300
300.000
2.100
400.0000
1.500
1.200
1.800
900
600
Vancouver
Portland
Seattle
Toronto*
Philadelphie
Boston
Cleveland
Minneapolis
Pittsburgh
DetroitDenver
Montréal
San Diego
Calgary
Houston
The service in Montreal appears consistent with the level of wealth of its economy• Taking into account wealth measured by GDP (or wealth per capita), Montreal is situated above the level expected
for the number of destinations and at the level expected for the number of flights.• This wealth effect may partly explain the difference in the propensity to travel. We note that there is less travel per
1,000 inhabitants in Montreal than in other major Canadian cities, the per capita personal income or per capita GDPbeing higher in Calgary, Toronto and Vancouver.
Number of direct connections in relation to GDP Number of direct flights in relation to GDP
# flights
Less extensive service than inthe most comparable cities
More extensive service than inthe most comparable cities
Number of direct connections in relation to GDP Number of direct flights in relation to GDP
*Note: Toronto has been excluded from the calculation of regression lines,given its status as a major international hub
GDP ($M)
# connections
GDP ($M)
Less extensive service than inthe most comparable cities
More extensive service than inthe most comparable cities
NUMBER OF CONNECTIONS AND DIRECT FLIGHTS IN RELATION TO GDPTO THE 123 MAJOR CITIES, FOR DESTINATIONS SERVED BY A MINIMUM OF 3 FLIGHTS PER WEEK THROUGHOUT THE YEAR
Sources: Diio, Statistics Canada, U.S. Bureau of Economic Analysis, KPMG-SECOR analysis

© 2014 KPMG LLP, a Canadian limited liability partnership and a member firm of the KPMG network of independent member firmsaffiliated with KPMG International Cooperative (“KPMG International”), a Swiss entity. All rights reserved.22
NORTH AMERICAN COMPARISON OF QUALITY OF SERVICE
A SIGNIFICANT IMPROVEMENT IN THE MONTREAL SERVICE, IN SPITE OF BELOW-AVERAGEECONOMIC GROWTH
Sources: ADM with Diio, KPMG-SECOR
-4-1-1
012233355
7
12
18
Por
tland
Cle
vela
nd
Pitt
sbur
gh
Min
neap
olis
Bos
ton
Cal
gary
Van
couv
er
Den
ver
San
Die
go
Hou
ston
Toro
nto
Det
roit
Phi
lade
lphi
e
Mon
tréa
l
Sea
ttle
Net variation in direct regular connectionsTo the 123 major cities, 2003-2013
Despite below-average economic growth in the 15 cities studied, Montreal is among the cities whosequality of service has improved the most, both in terms of the number of connections and the number offlights to major cities
-277-244-96-81
22577276102147186273279
455
773
Sea
ttle
Mon
tréa
l
Toro
nto
Hou
ston
Den
ver
Phi
lade
lphi
e
Cal
gary
Por
tland
Pitt
sbur
gh
Cle
vela
nd
Det
roit
San
Die
go
Min
neap
olis
Bos
ton
Van
couv
er
Net variation in direct flightsTo the 123 major cities regularly served, 2003-2013
Pitt
sbur
gh
1,0%Avg. 3,3 %
Det
roit
Por
tland
4,3%
Hou
ston
4,4%
Cal
gary
7,6%
Min
neap
olis
3,9%
Den
ver
3,6%
Bos
ton
2,6%
Phi
lade
lpie
2,9%
Cle
vela
nd
Van
couv
er
3,4%3,7%2,8%
San
Die
go
2,4%
Mon
tréa
l
1,9%
Toro
nto
2,5% 2,4%
Sea
ttle
GDP growth2002-2012
Below average economic growthAbove average economic growth

© 2014 KPMG LLP, a Canadian limited liability partnership and a member firm of the KPMG network of independent member firmsaffiliated with KPMG International Cooperative (“KPMG International”), a Swiss entity. All rights reserved.23
NORTH AMERICAN COMPARISON OF QUALITY OF SERVICE
MONTREAL, IN BRIEF: AN ENVIABLE SERVICE TO EUROPE AND THE MIDDLE EAST,IMPROVEMENTS TO BE MADE TO ASIA AND SOUTH AMERICA
In comparison with similar North American airports, Montreal has an enviable service to Europe, andincreasingly to the Middle East and North Africa
• But a lack of direct connections to South America and Asia is noted. However, this situation is not surprising when thefocus is on O-D traffic between Montreal and these parts of the world (see following section).
Above average Average Below averageCanada and United States ü
Mexico and Central America ü
South America ü
Europe ü
Middle East and Africa ü
Asia and Oceania ü
Note: Montreal achieves "above average" rating when it is ranked in the first third (first 5 cities out of 15), "average" when it is in the second third (cities 6 to 10),and "below average" when it is in the group of the last 5 cities
Sources: ADM with Diio, KPMG-SECOR
AIR SERVICE BY GEOGRAPHICAL REGION (NUMBER OF REGULAR DIRECT CONNECTIONS AND DIRECT FLIGHTS)

24
POTENTIAL FOR IMPROVING THESERVICE1. Service in relation to potential for carriers
2. Regional strategies

© 2014 KPMG LLP, a Canadian limited liability partnership and a member firm of the KPMG network of independent member firmsaffiliated with KPMG International Cooperative (“KPMG International”), a Swiss entity. All rights reserved.25
O-D traffic in % of the requiredminimum demand*
Distribution of the 122 major citiesaccording to the % of minimum
demand met in Montreal
Number of direct connections in2013-2014
for these cities
300% plus 8 cities § 8 regular connections
100% - 299% 19 cities § 11 regular connections§ 5 seasonal connections
75% - 99% 6 cities § 4 regular connections
50% - 74% 14 cities § 6 regular connections§ 2 seasonal connections
25% - 49% 21 cities § 2 regular connections§ 1 seasonal connection
Less than 25% 54 cities § 1 regular connection§ 1 seasonal connection
SERVICE IN RELATION TO POTENTIAL FOR CARRIERS
27 MAJOR CITIES HAVE AN O-D DEMAND THAT MEETS THE MINIMUM REQUIREMENT,INCLUDING 23 ALREADY SERVED BY MONTREAL
An analysis of the O-D demand between Montreal and the 122 other major cities reveals that the currentprovision by carriers is broadly in line with the size of the region's O-D customer base. The minimumdemand required to provide potential profitability for carriers is met in the case of 27 cities.
• Among these, 23 are already served directly from Montreal, including 19 on a regular basis• 8 cities show a particularly high demand justifying daily frequency and/or several different carriers (300% and above O-D
traffic compared with the required minimum demand)
*Depending on destinations, the required minimum demand is between 10,000 and 40,000 passengers (see table on page 6). The percentage of demand met for each of the 122 major cities isavailable in the appendix.
Requiredminimumdemand*reached
Requiredminimumdemand*not reached

© 2014 KPMG LLP, a Canadian limited liability partnership and a member firm of the KPMG network of independent member firmsaffiliated with KPMG International Cooperative (“KPMG International”), a Swiss entity. All rights reserved.26
SERVICE IN RELATION TO POTENTIAL FOR CARRIERS
OF THE 8 DESTINATIONS WITHOUT A REGULAR SERVICE AND SHOWING THE REQUIREDLEVEL OF DEMAND, ONLY 3 PROVE FEASIBLE THROUGHOUT THE YEAR
Routes not served but with potential (required minimum O-D demand)
Currently "non-feasible"potential routes
Regular "feasible" routes
3 cities 1 city
Beijing, San Diego, San Jose (CR) Beirut (national security)Rome, Barcelona, Lyon, Athens,
Seasonal routes
4 cities
8 cities
Sources: ADM with Diio, KPMG-SECOR
Only four destinations not yet served have a sufficient level of demand throughout the year to provide aminimum level of profitability for an airline. These are Beijing, San Diego and San Jose (Costa Rica).Beirut (which cannot currently be served for national security reasons) may also be added to these.
• In the medium term, with the arrival of new energy-efficient aircraft such as the Dreamliner, certain additional links includingMadrid, Seattle, Tel Aviv, Lima and Shanghai could become viable
Rome, Barcelona, Lyon and Athens arecurrently served by seasonal flightsonly. Analysis of the potential demandto these destinations reveals that thelow season (winter) demand does notat present allow the minimum level ofdemand required throughout the yearto be met.
Beirut cannot currently be served fornational security reasons.
Despite efforts made over the years byADM and its partners, it has not yetbeen possible to establish a Montreal-Beijing connection. This is mainly dueto the lack of a suitable landing slot atBeijing airport.

© 2014 KPMG LLP, a Canadian limited liability partnership and a member firm of the KPMG network of independent member firmsaffiliated with KPMG International Cooperative (“KPMG International”), a Swiss entity. All rights reserved.27
SERVICE IN RELATION TO POTENTIAL FOR CARRIERS
POTENTIAL O-D DEMAND TO THE MOST POPULAR DESTINATIONSIN SOUTH AMERICA AND ASIA
South America Asia
Sources: ADM with Diio, KPMG-SECOR
Required minimum demand: 30,000 to 40,000 passengers per year
For the moment, no Asian or South American destination shows a sufficient level of demand to justifyestablishing a cost-effective direct connection, with the exception of Beijing
l In other cases, establishing a direct connection would require a combination of destinations, a solution notfavoured by air carriers because of the additional costs linked to fuel consumption and landing fees, among otherreasons
POTENTIAL O-D DEMAND TO THE MOST POPULAR DESTINATIONS IN SOUTH AMERICA AND ASIAPOTENTIAL PASSENGER DEMAND BETWEEN MONTREAL AND THE MOST POPULAR DESTINATIONS IN THE REGIONS CONCERNED, 2013

© 2014 KPMG LLP, a Canadian limited liability partnership and a member firm of the KPMG network of independent member firmsaffiliated with KPMG International Cooperative (“KPMG International”), a Swiss entity. All rights reserved.28
SERVICE IN RELATION TO POTENTIAL FOR CARRIERS
STAKEHOLDERS IN MONTREAL AND QUEBEC ARE LARGELY SATISFIED WITH THECONNECTIVITY OF MONTREAL AIRPORT
In addition to the analyses presented above, interviews were also carried out in order to understandexpectations and opinions in Montreal. To this end, various stakeholders were interviewed (multinationalcompanies, international organizations, regional and provincial authorities).
On the whole, the various stakeholders consulted consider the air service in Montreal to be generallysatisfactory
• Most of the organizations consulted are of the opinion that there are simple and effective options for travelling anywherein the world, even when a connection is necessary.
According to stakeholders, priority needs relate mainly to:
1. The addition of a direct link to Asia2. Greater frequency in Canada and the United States, in particular to cities in the West
With regard to the traveller's experience at Montreal-Trudeau airport, which is not directly connected to thequality of the air service but is nevertheless important, the greatest weakness that stakeholders regret is theabsence of an efficient link between the airport and the city centre, either by rail or improved road accessgiven the current state of the roads to the airport.
© 2014 KPMG LLP, a Canadian limited liability partnership and a member firm of the KPMG network of independent member firmsaffiliated with KPMG International Cooperative (“KPMG International”), a Swiss entity. All rights reserved.29
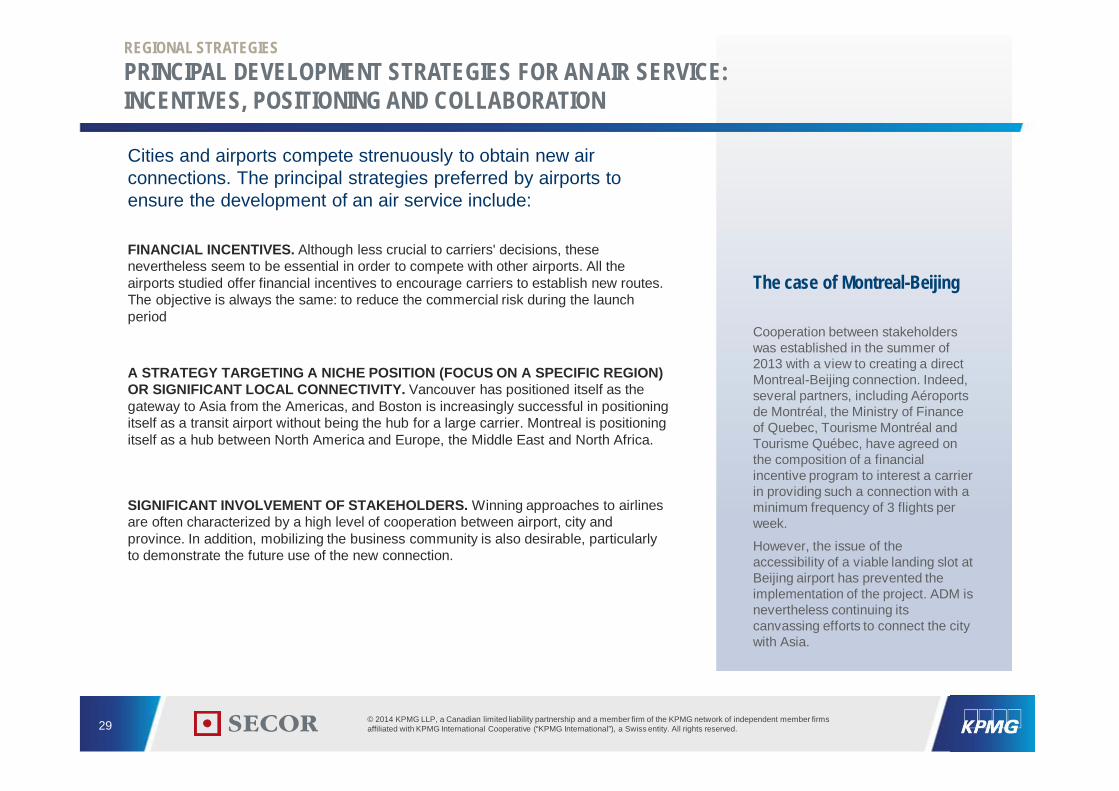
Cities and airports compete strenuously to obtain new airconnections. The principal strategies preferred by airports toensure the development of an air service include:
FINANCIAL INCENTIVES. Although less crucial to carriers' decisions, thesenevertheless seem to be essential in order to compete with other airports. All theairports studied offer financial incentives to encourage carriers to establish new routes.The objective is always the same: to reduce the commercial risk during the launchperiod
A STRATEGY TARGETING A NICHE POSITION (FOCUS ON A SPECIFIC REGION)OR SIGNIFICANT LOCAL CONNECTIVITY. Vancouver has positioned itself as thegateway to Asia from the Americas, and Boston is increasingly successful in positioningitself as a transit airport without being the hub for a large carrier. Montreal is positioningitself as a hub between North America and Europe, the Middle East and North Africa.
SIGNIFICANT INVOLVEMENT OF STAKEHOLDERS. Winning approaches to airlinesare often characterized by a high level of cooperation between airport, city andprovince. In addition, mobilizing the business community is also desirable, particularlyto demonstrate the future use of the new connection.
The case of Montreal-Beijing
Cooperation between stakeholderswas established in the summer of2013 with a view to creating a directMontreal-Beijing connection. Indeed,several partners, including Aéroportsde Montréal, the Ministry of Financeof Quebec, Tourisme Montréal andTourisme Québec, have agreed onthe composition of a financialincentive program to interest a carrierin providing such a connection with aminimum frequency of 3 flights perweek.
However, the issue of theaccessibility of a viable landing slot atBeijing airport has prevented theimplementation of the project. ADM isnevertheless continuing itscanvassing efforts to connect the citywith Asia.
REGIONAL STRATEGIES
PRINCIPAL DEVELOPMENT STRATEGIES FOR AN AIR SERVICE:INCENTIVES, POSITIONING AND COLLABORATION

© 2014 KPMG LLP, a Canadian limited liability partnership and a member firm of the KPMG network of independent member firmsaffiliated with KPMG International Cooperative (“KPMG International”), a Swiss entity. All rights reserved.30
REGIONAL STRATEGIES
FINANCIAL INCENTIVES OFFERED TO CARRIERS:MONTREAL IN A GOOD POSITION
Source: KPMG-SECOR
Abolition or reduction oflanding fees
• Abolition or reduction of landing fees (by between 25% and 100%) offered by all airports studied• Incentives also offered by very large airports (e.g. Miami and Atlanta) as well as smaller airports (e.g. Syracuse, NY)
Promotional investment forthe new route
• Objective: To promote the new route (at the airport of origin and/or destination) in order to ensure its use• Matching the amount invested by the carrier (50-50) is offered by almost all airports studied. In some cases,
amounts are granted unilaterally, without the requirement to match (e.g. Portland and Houston).• Amounts granted vary according to airport, destination and airline (between $25 K and $400 K per route annually,
over periods of 1 to 2 years)
Preferential rates foraircraft parking • Preferential rates or free aircraft parking, for a limited time period (one or two years)
Other incentives • Free use of common gates and free customs services for periods of 1 to 2 years (e.g. Denver and Portland)• Free check-in desk for one year (e.g. Portland)
Negotiations between airports and airlines take place on a case-by-case basis and offers made tocarriers are not always known
According to publicly available information, Montreal's offer seems to be the most favourable in Canada• A 100% reduction of the landing fee in year 1, 50% in year 2 and 25% in year 3 for new direct flights to
destinations defined as "priority"• Investment in the promotion of the new destination to match the amount invested by the carrier (50-50)
EXAMPLES OF FINANCIAL INCENTIVES OFFERED TO CARRIERS BY NORTH AMERICAN AIRPORTS

© 2014 KPMG LLP, a Canadian limited liability partnership and a member firm of the KPMG network of independent member firmsaffiliated with KPMG International Cooperative (“KPMG International”), a Swiss entity. All rights reserved.31
REGIONAL STRATEGIES
EXAMPLE OF AN AIRPORT FOCUSING ON A NICHE POSITION: VANCOUVER
Source: KPMG-SECOR
Vancouver: hub position targeting an international region
KEY FACTORS FORSUCCESS DESCRIPTION
Market size• Passenger volume of nearly 18 M per year• Significant O-D market, with a growing population and strong community of Asian origin• Proportion of passengers in transit: 28%
Strategy of the airport andcarriers
• Distinctive "Trans-Pacific" position and role as a hub for the West Coast (according to the airport's "Master Plan")• Proposal to create a "stop-over-zone" that does not require passengers to go through customs/visa when arriving from China• Determination of Air Canada (which holds 50% of the market) to develop Vancouver as a hub between Asia and the
Americas• Agreements between WestJet and Cathay Pacific and Taiwan's China Airlines also contribute to increasing international
transit• Opening an office in Hong Kong to contribute to achieving the "Gateway Development Strategy"
Involvement of publicpartners and the businesscommunity
• Abolition by the province of fuel tax for international routes (financial impact for carriers estimated at $2 K to $3 K per long-haul flight)
• Liberalization of aviation treaties between Canada and Japan to allow more flights to Tokyo• Request that the federal government expand the airport and create a "stop-over-zone" between Asia and the EU and South
America (transfer without having to go through customs or needing a visa)
Recent new internationalroutes
• Guangzhou (China Southern Airlines)• Chengdu (Sichuan Airlines)• London (Virgin Atlantic): seasonal flight• Munich (Lufthansa)• Tokyo (ANA)• Tokyo and Beijing: additional flights
Financial incentives • In the framework of the "Gateway Incentive Program", landing fees and terminal fees for carriers remain fixed,even with the addition of new routes or more flights (between 2010 and 2015)

© 2014 KPMG LLP, a Canadian limited liability partnership and a member firm of the KPMG network of independent member firmsaffiliated with KPMG International Cooperative (“KPMG International”), a Swiss entity. All rights reserved.32
REGIONAL STRATEGIES
EXAMPLE OF AN AIRPORT MAXIMIZING LOCAL AND REGIONAL CONNECTIVITY: BOSTON
Source: KPMG-SECOR
Boston: maximization of local and regional connectivityKEY FACTORS FORSUCCESS DESCRIPTION
Market size• Nearly 30 M passengers per year, 20% of whom are international passengers• Significant local market in terms of number (population of the city and surrounding areas) and profile (companies, universities, etc.)• Significant O-D market: maximizing the size of the business population, professionals and students in businesses, hospitals and universities.
Strategy of the airport andcarriers
• JetBlue, a low-cost-carrier, controls almost 30% of the market (ranked first, ahead of United at 14%)• JetBlue targets the business community by introducing new connections to business destinations with lots of flights. E.g.: New York (JFK),
Washington DC, Charlotte, Chicago, Dallas.• JetBlue has developed numerous agreements with major international carriers such as Aer Lingus, American Airlines, Icelandair, Japan Airlines,
Lufthansa, Virgin Atlantic and Emirates Airline. Passengers can thus make "easy" connections, as between carriers in an alliance (codeshare).
Involvement of publicpartners and the businesscommunity
• Commitment of Boston businesses to ensure volume on new routes• Establishment of an "Asian Task Force," a committee of nearly 100 individuals from the financial, technology, health, education and other sectors,
who often travel to Asia and have supplied the customer base predictions for a direct flight to Tokyo and given a presentation to JAL• Strong involvement of the governor of Massachusetts in attracting carriers
Recent new internationalroutes
• Beijing (Hainan Airlines): significant Chinese student population in Boston• Tokyo (JAL): the carrier's first international destination for the Dreamliner• Istanbul (Turkish Airlines)• Panama (COPA)• Dubai (Emirates): combined with the addition by JetBlue of a link to Detroit for Arab customers
Financial incentives
• A sum of $5.6 million will be paid over the next 4 years for the 5 new international routes• Free landing rights for one year (or 2 as the case may be)• Cooperative promotional investments, the amount of which varies depending on the carrier and route
(e.g. $200 K over 2 years for COPA and $350 K for Emirates)
Benefits of the airport • Short waiting time• Investment of $100 M announced to improve the international terminal

33
CONCLUSION

© 2014 KPMG LLP, a Canadian limited liability partnership and a member firm of the KPMG network of independent member firmsaffiliated with KPMG International Cooperative (“KPMG International”), a Swiss entity. All rights reserved.34
The quality of an air service depends primarily on the size anddynamism of the local market. On this basis, it should be noted thatMontreal's air service is in line with the size of its market.
• The supply of carriers is broadly in line with traveller demand. Almost allimportant destinations with sufficient demand are already served directlyfrom Montreal.
• Montreal's air service compares favourably with that of other North Americancities of similar size. Montreal is ranked 2nd in Canada for the total numberof destinations and 5th among the 15 North American airports used forcomparison in terms of the number of connections to the most influentialworld cities and major international hubs.
• If the economic wealth of the region is taken into account, Montreal's airservice seems significant when compared with that of similar regions.
• Finally, Montreal's air service has improved over the last ten years, both interms of passenger traffic and air service quality (number of destinations andfrequency), in spite of below-average economic growth in comparison withother similar cities.
IN SUMMARY
© 2014 KPMG LLP, a Canadian limited liability partnership and a member firm of the KPMG network of independent member firmsaffiliated with KPMG International Cooperative (“KPMG International”), a Swiss entity. All rights reserved.35
IN SUMMARY
In some cases, air service quality exceeds a region's economic strength.Despite its proximity to a global hub in Toronto, Montreal can capitalize oncertain development opportunities to make itself stand out:
• Montreal can build on its position as a hub between North America and Europe,and also increasingly the Middle East/North Africa, to develop its connectiontraffic
• The deployment of aircraft such as the Dreamliner, which lowers the minimumlevel of customer base required for certain destinations, will make new routes tomajor cities profitable.
• Major international alliances in Montreal can increase its attractiveness to foreigncarriers. For example, the latest two international carriers to have chosenMontreal as a destination (Turkish and COPA) are, like Air Canada, members ofthe Star Alliance.
The involvement of various stakeholders, in particular ADM, the Quebecgovernment, the City of Montreal as well as the business community, maybe key in establishing favourable conditions for the introduction of newconnections.
• To this end, the parties involved over the past few years in developing a directconnection with Beijing should continue their efforts in this direction in order toprovide Montreal with its first direct link with Asia.
36
APPENDIX

© 2014 KPMG LLP, a Canadian limited liability partnership and a member firm of the KPMG network of independent member firmsaffiliated with KPMG International Cooperative (“KPMG International”), a Swiss entity. All rights reserved.37
REQUIRED MINIMUM DEMAND PERCENTAGE, BETWEEN MONTREAL ANDTHE 122 OTHER MAJOR CITIES THAT IS MET BY O-D DEMAND
Destinations % Dem. required
Toronto 11011%
New York 1931%
Paris 866%
Chicago 753%
Vancouver 656%
Calgary 539%
Washington 414%
Miami 300%
Boston 285%
Los Angeles 265%
Mexico City 243%
Atlanta 223%
London 213%
Casablanca 199%
Rome* 195%
San Francisco 189%
Philadelphia 157%
San Jose (CR)* 150%
Minneapolis 133%
Barcelona* 125%
Lyon* 121%
Panama City 118%
Beirut 114%
Dallas 109%
Beijing 104%
Destinations % Dem. required
Athens* 102%
San Diego 102%
Seattle 96%
Brussels 95%
Cleveland 90%
Detroit 88%
Tunis 86%
Guatemala City 82%
Bogota 72%
Geneva 71%
Lisbon* 67%
Tel Aviv 67%
Denver 62%
Houston 60%
Lima 60%
Shanghai 57%
Bucharest 55%
Amsterdam 54%
Frankfurt 52%
Caracas 51%
Madrid* 50%
Munich 50%
Hong Kong 48%
Zurich 44%
Dubai 43%
Destinations % Dem. required
Milan 43%
Istanbul 39%
Berlin 36%
Manila 35%
Bangkok 34%
Tokyo 34%
Moscow 34%
New Delhi 33%
Cairo 33%
Copenhagen 33%
Sao Paulo 32%
Vienna 32%
Prague* 31%
Dublin 30%
Budapest 29%
Santiago 27%
Monterrey 25%
Buenos Aires 25%
Stockholm 23%
Seoul 21%
Warsaw 20%
Sofia 19%
Mumbai 19%
Sydney 18%
Amman* 18%
Destinations % Dem. required
Kiev 18%Ho Chi MinhCity 18%
Manchester 16%
Edinburgh 16%
Rio de Janeiro 15%
Düsseldorf 14%
Taipei 14%
Quito 14%
Doha 13%
Singapore 12%
Hamburg 12%
Johannesburg 11%
Hanoi 11%
Helsinki 10%
Riyadh 9%
Cape Town 9%
Melbourne 8%
Guangzhou 8%
Belgrade 8%
Nairobi 8%
Auckland 8%
Oslo 7%
Luxembourg 7%
Bangalore 7%
Abu Dhabi 7%
Destinations % Dem. required
Brisbane 7%
Kuwait City 6%
Birmingham (UK) 5%
Kuala Lumpur 5%
Stuttgart 4%
Chennai 4%
Montevideo 4%
Manama 4%
Jakarta 4%
Karachi 4%
Lagos 3%
Perth 3%
Almaty 2%
Calcutta 2%
Hyderabad 2%
Riga 2%
Rotterdam 0%
Shenzhen 0%
Antwerp 0%
Bratislava 0%
Nicosia 0%
Port Louis 0%
Legend:Cities served by a direct regularconnection throughout the year*Cities served on a seasonal basis orwith reduced frequency

The information contained herein is of a general nature and is not intended to addressthe circumstances of any particular individual or entity. Although we endeavour to provideaccurate and timely information, there can be no guarantee that such information isaccurate as of the date it is received or that it will continue to be accurate in the future.No one should act on such information without appropriate professional advice after athorough examination of the particular situation.
© 2014 KPMG LLP, a Canadian limited liability partnership and a member firm of theKPMG network of independent member firms affiliated with KPMG InternationalCooperative (“KPMG International”), a Swiss entity. All rights reserved. Printed inCanada.
The KPMG name, logo and “cutting through complexity” are registered trademarks ortrademarks of KPMG International. The SECOR name and logo are trademarks of KPMGInternational.