study of water quality and heavy metals in soil & water of ex
TRANSCRIPT
International Journal of Basic & Applied Sciences IJBAS-IJENS Vol:10 No:03 7
102003-4646 IJBAS-IJENS © June 2010 IJENS I J E N S
Study of Water Quality and Heavy Metals in Soil &
Water of Ex-Mining Area Bestari Jaya, Peninsular
Malaysia
Muhammad Aqeel Ashraf1, Mohd. Jamil Maah
1 and Ismail Bin Yusoff
1Department of Chemistry University of Malaya, Kuala Lumpur 50603, Malaysia.
Department of Geology, University of Malaya, Kuala Lumpur 50603, Malaysia.
Abstract-- Tin mining is one of the oldest industries in
Malaysia that have started since1820s. These mining activities
have resulted in about 113,700 hectors of tin tailings
throughout the peninsula that created numerous
environmental problems such as threat to natural reserves due to landscape changes, damage to natural drainage, pollution
and destruction of natural habitats The present study was
carried out in old tin mining area Bestari Jaya (Batang
Berjuntai old name), district Kuala Selangor in Selangor state.
The purpose of this study is to get the ground information about environmental and contamination characteristics and
also planning for future work. The mined out catchment covers
an area of 323.74 hectors. Initially 92.61 hectors of downstream
catchment were investigated which includes two mined out
water ponds. These ponds flow downstream to River Ayer Hitam that ultimately ends up with River Selangor, 5 Km
upstream of Batang Berjunti Water Treatment Plants SSP1
and SSP2 which are major water distributors to federal
territory (Kuala Lumpur and Putrajaya) and Selangor state as
well. Samples of soil and water were taken separately from fifteen locations of downstream catchment using Global
Positioning System. In preliminary studies physio-chemical
parameters and concentration of heavy metals Pb2+, Zn2+, Ni2+,
Co2+, As3+, Cu2+, Fe2+, Mn2+, Sn2+ were analyzed. The metals
were extracted by nitric acid and hydrogen peroxide in a closed vessel microwave digestion system and analysed by using
atomic absorption spectroscopy. The method was validated by
using standard reference material (NIST SRM 4354, 1643e)
and results were compared with interim national water quality
standards for Malaysia and found that most of physio-chemical parameters and metals concentration exceeds the permissible
limits set by interim national water quality standards for
Malaysia. So it is concluded that Bestari Jaya ex-mining
catchment has a high pollution potential due to mining
activities and Sungai (River) Ayer Hitam, recipient of catchment water is a highly polluted river. Therefore extensive
research needs to be carried out in order to evaluate possible
environmental risk factors in the area. Different environmental
aspects have also discussed in this paper for the future research
during this project. Index Term-- Ex-mining, catchment, water quality, heavy
metals, soil.
I. INTRODUCTION History of tin mining in Malaysia is very old that have
started since 1820 after the arrival of Chinese immigrants.
Tin mining was one of the leading mining industry in
Malaysia during 19th
century and have contributed a lot in
the socio-economic development of the country. Malaysia
was one of the largest tin producers until the tin crisis of
1985[1]. Malaysia’s tin deposits occur in a strip of land
about 400 Km long and 60 Km wide between the town of
Georgetown and Melaka, along the western coast of
Peninsular Malaysia. Most Malaysian tin comes from two
states Perak (63%) and Selangor (22%), which together
account for about 90 percent of the country’s tin mining
output [2].
After the discovery of tin many methods have been used. In
the start panning and open cast mining were normally used.
Other methods include lampanning and dredging [3].
'Lampanning' (ground-sluicing on hillsides) was the most
destructive form of tin mining. In certain areas where it was
extensively practised, it left a persistent legacy of disturbed
and scarred land. 'Lampanning' operations also constituted a
major source of sediment, and contributed to the siltation of
rivers in mining areas and to more frequent flooding in
subsequent years [4].After the mining operations has carried
out, it left behind ponds, lakes, tin tailings (sand and slime
tailings) and areas of mixed material. It is estimated that
there are about 210,000 hectares ex-mining land in the
country and most areas has been rehabilitated into useful
land [1]. According to JMG (Jabatan Minerals dan
Gesoains, 2008) there is 4909.6 hectares examining land in
Selangor and the area under study still need rehabilitation.
Besides employment and economic profit, there are a lot of
environment hazards also associated as well. These may
include threat to natural reserves due to landscape changes,
damage to natural drainage, pollution and destruction of
natural habitats [5].The environmental problems caused by
tin mining have been lessened with the help of governments
in legislations in Malaysia. Some of these are The mining
codes of Perak (1895) and Negeri Sembilan (1895), The
Mining Enactment N0.7 (1899), The Selangor Mining
Enactment (1901), (1911), (1921), (1928) etc. [3].Most of
these laws were mainly concerned on mining code of
practice but not purely discuss environmental issues so The
F.M.S. Mining Enactment (1934) was the first to introduce
some environmental standards. They passed laws which
required tin mining companies to carry out restoration work
after they have mined a parcel of excavated land [3].
The preliminary investigation of soil and water chemistry of
the proposed site will help to get the ground information
about environmental and contamination characteristics and
to get guidelines for detailed planning of the work in future.
As Selangor state is the most populated state in Malaysia

International Journal of Basic & Applied Sciences IJBAS-IJENS Vol:10 No:03 8
102003-4646 IJBAS-IJENS © June 2010 IJENS I J E N S
and is shortage of land. This project will also be valuable for
rehabilitation and reclamation of the study area for safer
economic development of the state and country.
II. DESCRIPTION OF THE STUDY AREA
The study area Bestari Jaya catchment is located at 30, 24’
40.41” N and 1010 24’ 56.23” E is part of district Kuala
Selangor in Selangor state that includes three towns Mukim
Batang Berjuntai, Mukim Ulu Tinggi, Mukim Tg.karang.
The old name of Bestari Jaya is Batang Berjuntai. On 2007
the name Batang Berjuntai was renamed "Bestari Jaya" due
to censorship by the government, as "Batang Berjuntai" had
phallic meanings in Malay. Bestari Jaya has a tropical,
humid climate, with very little variations in temperature
throughout the year. The average temperature of the area is
32 0C during day and 23
0C at night. An annual average
rainfall of 2000 mm and 3000 mm with potential
evaporation of 1600 mm per year [6].
The Bestari Jaya is an old tin mining area for over 10 years
.The whole catchment covers an area of 2656.31 hectors
which is located downstream at the embankment of
Kampung Bestari Jaya and University Industry Selangor
(UNISEL) main campus. The catchment flow downstream
to Sungai Ayer Hitam and Sungai Udang which ultimately
ends up with Sungai Selangor at 5 Km upstream of Batang
Berjunti Water Treatment Plants SSP1 and SSP2 which are
major water distributors to federal territory (Kuala Lumpur
and Putrajaya) and Selangor state as well.
Fig. 1. Map of Selangor State
The area consists of myriad ecosystems which can be
subdivided into several categories such as degraded land,
large open lakes and small ponds, earth drains and wetlands
area, tin tailings (sand and slime tailings), logged peat

International Journal of Basic & Applied Sciences IJBAS-IJENS Vol:10 No:03 9
102003-4646 IJBAS-IJENS © June 2010 IJENS I J E N S
swamp forest land in east. The contribution of storm water,
peat swamp forest water and recent sand mining activity has
caused severe environmental pollution due to drainage
problem in the area. The area has a lot of big lakes and small
ponds that are interconnected by earth drains. Excess water
from these lakes and ponds is discharged to the existing
earth drains at the downstream of the lakes and ponds.
Precipitation rate is high in some stagnant ponds.
Flow routing had been carried out by applying the survey
data. Some of the lakes flow across the downstream into
open spaces and wetlands that run off into Sungai Ayer
Hitam, meets up Sungai Udang and ultimately ends up to
Sungai Selangor at the Jalan Timur Tambahan road junction,
east of UNISEL.
Fig. 2. Map of Catchment Area
In the study area Sungai Selangor has an average water
depth 5.7 meter, channel width 8.4 meter and river flow 54.6
m3/sec. Ayer Hitam has an average water depth 1.7 meter,
channel width 5 meter and river flow is 21.5 m3/sec while
Sungai Udang (the smallest channel) has an average water
channel depth of 32 cm, channel width 110cm and 42
m3/sec.
The wetlands has an area of 579.7 hectors is stretched along
the north western border of the site. Several useful plant
species have been seen in the wetland while several harmful
weed species have been also seen in the study area that
cause blocking of water courses and water become foul due
to large masses of water leaves. This area is sandy in texture
and it is representative of entire examining area in the
country. The parent material is of reverine alluvium
materials, with pH in range of 3.5-5.5.
III. MATERIAL & METHODS
Sampling Location
In preliminary analysis 92 hectors of downstream part of the
catchment were analysed that includes drain of catchment to
Sungai Ayer Hitam that meets Sungai Selangor at the Jalan
Timur Tambahan road junction. Water samples were taken
from two ex-mining ponds, at the junction of Sungai Ayer
Hitam and at the junction of Sungai Selangor and soil
samples were taken at the embankment of the river and
ponds and the area nearby.
International Journal of Basic & Applied Sciences IJBAS-IJENS Vol:10 No:03 10
102003-4646 IJBAS-IJENS © June 2010 IJENS I J E N S
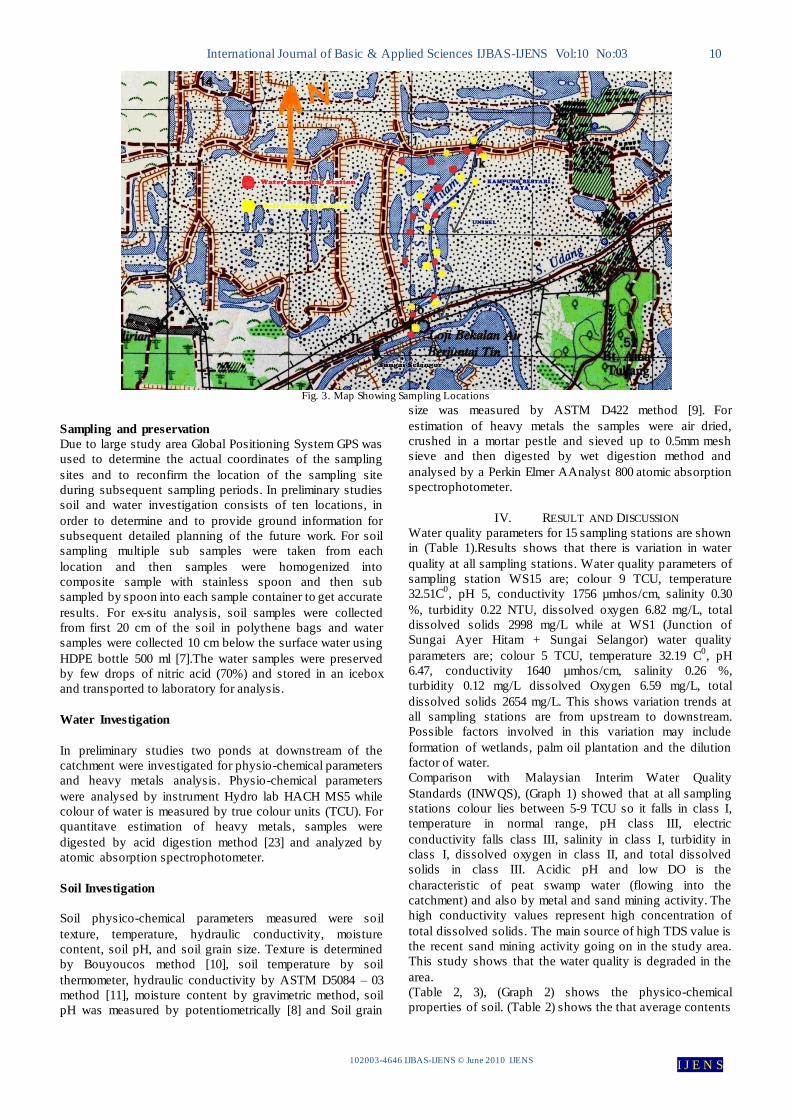
Fig. 3. Map Showing Sampling Locations
Sampling and preservation
Due to large study area Global Positioning System GPS was
used to determine the actual coordinates of the sampling
sites and to reconfirm the location of the sampling site
during subsequent sampling periods. In preliminary studies
soil and water investigation consists of ten locations, in
order to determine and to provide ground information for
subsequent detailed planning of the future work. For soil
sampling multiple sub samples were taken from each
location and then samples were homogenized into
composite sample with stainless spoon and then sub
sampled by spoon into each sample container to get accurate
results. For ex-situ analysis, soil samples were collected
from first 20 cm of the soil in polythene bags and water
samples were collected 10 cm below the surface water using
HDPE bottle 500 ml [7].The water samples were preserved
by few drops of nitric acid (70%) and stored in an icebox
and transported to laboratory for analysis.
Water Investigation
In preliminary studies two ponds at downstream of the
catchment were investigated for physio-chemical parameters
and heavy metals analysis. Physio-chemical parameters
were analysed by instrument Hydro lab HACH MS5 while
colour of water is measured by true colour units (TCU). For
quantitave estimation of heavy metals, samples were
digested by acid digestion method [23] and analyzed by
atomic absorption spectrophotometer.
Soil Investigation
Soil physico-chemical parameters measured were soil
texture, temperature, hydraulic conductivity, moisture
content, soil pH, and soil grain size. Texture is determined
by Bouyoucos method [10], soil temperature by soil
thermometer, hydraulic conductivity by ASTM D5084 – 03
method [11], moisture content by gravimetric method, soil
pH was measured by potentiometrically [8] and Soil grain
size was measured by ASTM D422 method [9]. For
estimation of heavy metals the samples were air dried,
crushed in a mortar pestle and sieved up to 0.5mm mesh
sieve and then digested by wet digestion method and
analysed by a Perkin Elmer AAnalyst 800 atomic absorption
spectrophotometer.
IV. RESULT AND DISCUSSION
Water quality parameters for 15 sampling stations are shown
in (Table 1).Results shows that there is variation in water
quality at all sampling stations. Water quality parameters of
sampling station WS15 are; colour 9 TCU, temperature
32.51C0, pH 5, conductivity 1756 µmhos/cm, salinity 0.30
%, turbidity 0.22 NTU, dissolved oxygen 6.82 mg/L, total
dissolved solids 2998 mg/L while at WS1 (Junction of
Sungai Ayer Hitam + Sungai Selangor) water quality
parameters are; colour 5 TCU, temperature 32.19 C0, pH
6.47, conductivity 1640 µmhos/cm, salinity 0.26 %,
turbidity 0.12 mg/L dissolved Oxygen 6.59 mg/L, total
dissolved solids 2654 mg/L. This shows variation trends at
all sampling stations are from upstream to downstream.
Possible factors involved in this variation may include
formation of wetlands, palm oil plantation and the dilution
factor of water.
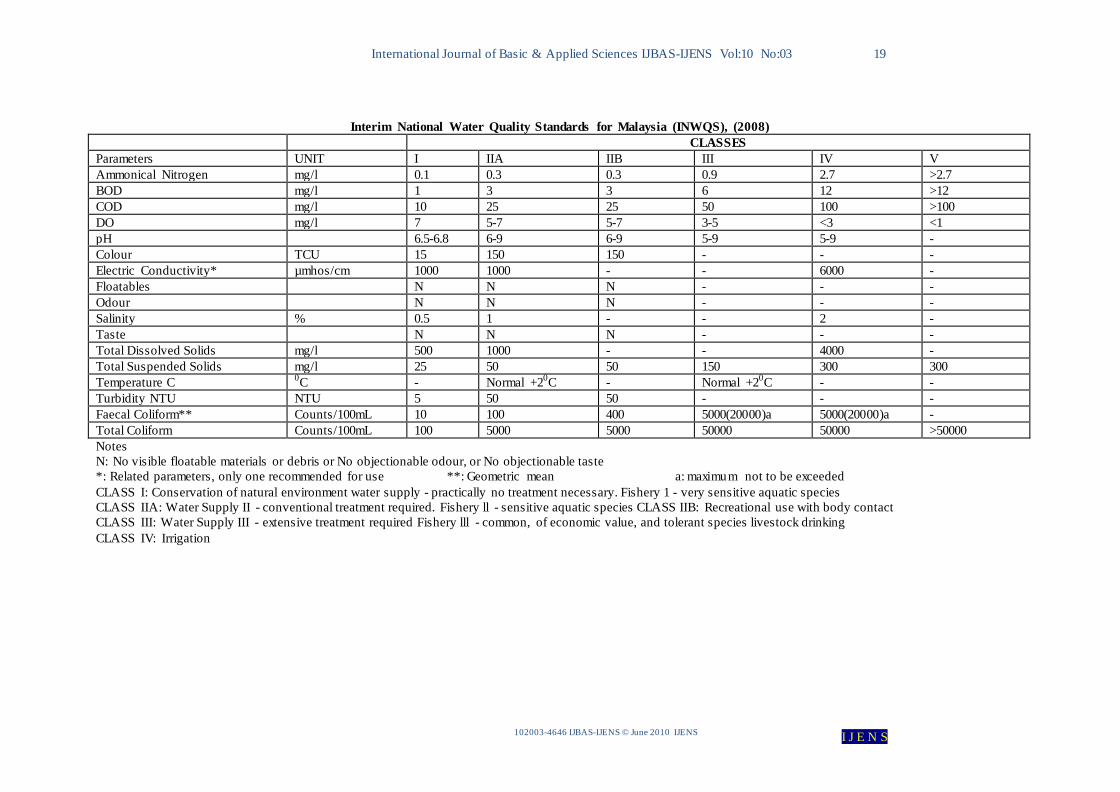
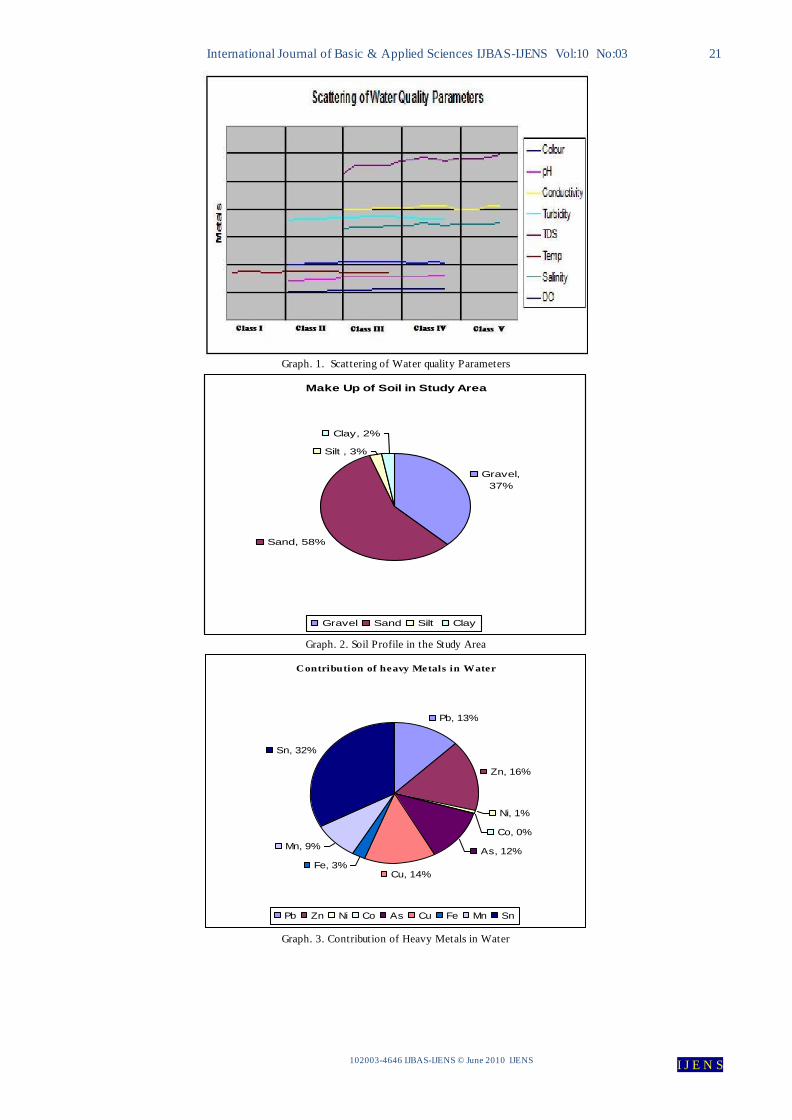
Comparison with Malaysian Interim Water Quality
Standards (INWQS), (Graph 1) showed that at all sampling
stations colour lies between 5-9 TCU so it falls in class I,
temperature in normal range, pH class III, electric
conductivity falls class III, salinity in class I, turbidity in
class I, dissolved oxygen in class II, and total dissolved
solids in class III. Acidic pH and low DO is the
characteristic of peat swamp water (flowing into the
catchment) and also by metal and sand mining activity. The
high conductivity values represent high concentration of
total dissolved solids. The main source of high TDS value is
the recent sand mining activity going on in the study area.
This study shows that the water quality is degraded in the
area.
(Table 2, 3), (Graph 2) shows the physico-chemical
properties of soil. (Table 2) shows the that average contents

International Journal of Basic & Applied Sciences IJBAS-IJENS Vol:10 No:03 11
102003-4646 IJBAS-IJENS © June 2010 IJENS I J E N S
of the soil are gravel 37.3% with diameter 3-6 mm, sand
57.20% with diameter 0.1-2 mm, silt 2.9% with diameter
0.008-0.4 mm and clay 2.46% with diameter 0.0008-0.0014
mm that is kind of medium textured sandy soil. Sandy soils
have low clay and organic matter contents and aggregation
is very weak to non existent. The structure is called single
grained. Such kind of soil cannot retain so much water and
can drain quickly. Single drained soils required frequent
irrigation and fertilization for plants roots to penetrate.
(Table 3) indicates that the average moisture content of soil
is 6.36% of soil, temperature 22.0 C0,
pH5.64 and hydraulic
conductivity is 13.7cm/day. This shows that soil
temperature and hydraulic conductivity is feasible for plant
growth but low pH due to high cations in soil and moisture
content due to sandy structure depress plant growth.
Metal concentration of water and soil are good indicators of
degree of contamination. (Table 4), (Graph 3, 4) shows the
concentration of heavy metals in water of the area under
investigation. At the sampling station WS1 are as follows;
lead 38 mg/L, zinc 88 mg/L, nickel 2.5 mg/L, cobalt 1.0
mg/L, arsenic 30 mg/L, copper 59 mg/L, iron 06 mg/L,
manganese 44 mg/L and tin 85 mg/L while at sampling
station WS15 concentration of heavy metals are as follows;
lead 96 mg/L, zinc 121 mg/L, nickel 2.8 mg/L, cobalt 1.8
mg/L, arsenic 77 mg/L, copper 80 mg/L, iron 16 mg/L,
manganese 48 mg/L and tin 250 mg/L. Same variation
trends of decrease in metal concentration are at all sampling
stations from upstream to down stream. According to
Meteorological Department Malaysia 1995, Bestari Jaya is a
flooding area with average rainfall 2670 mm, annual
precipitation 1800 mm and average wind speed upto 10km/h
so the possible causes of this decrease in metals
concentration are natural aeration, natural precipitation other
possible causes of decrease in metal concentration are
formation of wetlands, palm oil plantation and the dilution
factor of water as it flows downstream.
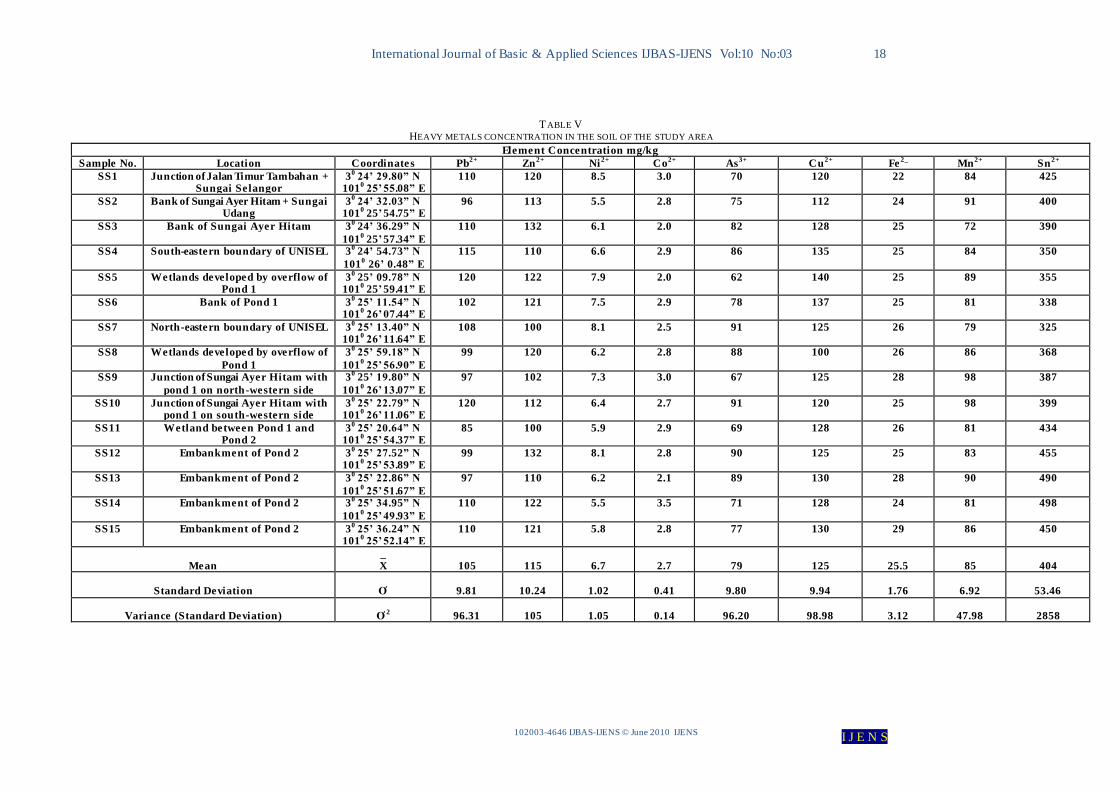
(Table 5), (Graph 5, 6) shows heavy metals concentration in
soil. Concentration is even higher in soil as compared to
water. Comparison of metal concentration in water and soil
with Interim National Water Quality Standards Malaysian
(INWQS) shows that the heavy metals concentration falls
above class IV so it shows that the study area has a high
pollution impact on the environment.
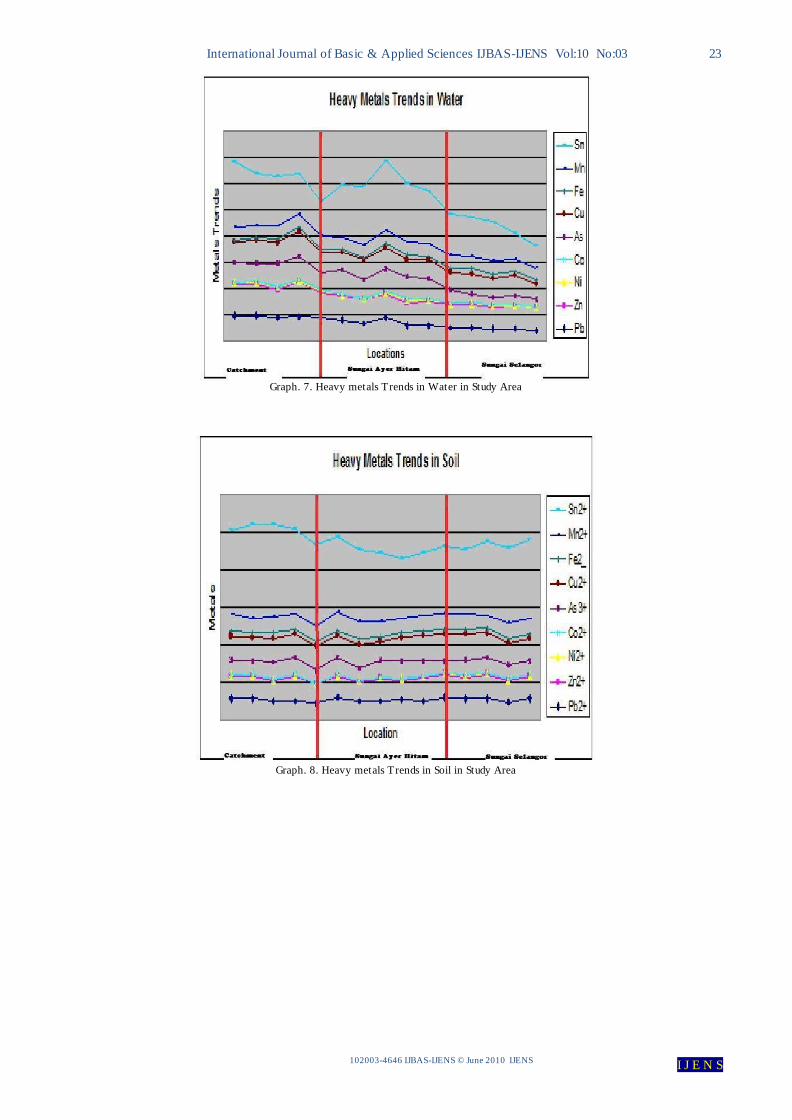
Graph (7, 8) clearly shows the variation trends about metals
concentration in soil and water at the catchment, Sungai
Ayer Hitam and Sungai Selangor. In (graph 7) metals
concentration decreased as water flows from catchment to
Sungai Selangor but in (Graph 8) soil no such trends are
observed so it can be concluded that main causes of
decrease are precipitation, aeration and formation of
wetlands that acts as a filter for the heavy metals.
V. CONCLUSIONS The preliminary result obtained from this study is alarming.
The results of water quality trends clearly show that
majority of water quality parameters are quite high and fall
in Class III in terms of Malaysian Interim Water Quality
Standards. The picture is more severe if we talk in terms of
heavy metals concentration in the area. It falls above level
IV in INWQS. After comparison of different parts of study
area it is concluded that Bestari Jaya catchment has high
pollution risks on environment, Sungai Ayer Hitam recipient
of catchment water is highly polluted river that ultimately
ends into Sungai Selangor, is vulnerable and sensitive
ecosystem especially to metal pollution. Therefore lot of
research needs to be carried out to access the pollution
impact of the area on the environment and for the
rehabilitation and reclamation steps to be taken.
VI. FUTURE CONCERNS
Morphology and Characterization of Lakes and Ponds
About 4909.60 hectors of land in Selangor were under
mining leases at the end of 2000 and most of these lands
have been mined out for tin ore with open cast palong or
dredging method [12]. What is left from these mining
activities are hundreds of small ponds and big lakes that
vary in sizes from few tens square meters to 50 hectares or
more .So present work is the structuring and
characterization of these lakes and ponds in terms of in
terms of length, width, depth, zonation, inflow and outflow,
type and shape, location on coordinates and the nature of the
surroundings. The purpose of this study is to make
rehabilitation and reclamation process more smooth and
feasible for the state government.
Water quality
Surface water resources have played an important role
throughout the history in the development of human
civilization. About one third of the drinking water
requirement of the world is obtained from surface sources
like rivers, canals and lakes [13]. Water quality is affected
by a wide range of natural and human influences. The most
important of the natural influences are geological,
hydrological and climatic, since these affect the quantity and
the quality of water available. Due to tin mining activity the
water quality of the whole catchment is degraded. The
purpose of this study is to understand physical, chemical and
biological characteristics of lakes and pond water and to
access environmental impact through drainage into Sungai
Selangor and to check the possibility of using pond water
for live stock, irrigation or portable water.
Metals distribution, speciation & transport in water,
soil, sediments and plants
Heavy metals originate within the Earth. But human
activities opened Pandora’s Box by spreading these toxic
metals throughout the environment. The levels have risen in
air, water, and topsoil. High concentration of some of the
heavy metals have direct effects on the growth of crops
while some don’t have direct effect but may effect the
animals feeding on the crops [14]. So ultimate effect is on
our body, contributing to chronic diseases, learning
disorders, cancer, dementia, and premature aging. So the
purpose of the study is to check the distribution, speciation
& transport in water, soil, sediments and plants in order to
determine the ultimate effect of these metals on the
environment.
Tin Tailings
Tin tailings have been defined as tracts of waste land made
up of washed waste products of alluvial mining. The tailing
consists of two fractions: sand tailings and slime tailings,

International Journal of Basic & Applied Sciences IJBAS-IJENS Vol:10 No:03 12
102003-4646 IJBAS-IJENS © June 2010 IJENS I J E N S
the former is very coarse textured and shows an absence of
aggregation and profile development. The slime tailings
consists mainly of very fine soils and minerals (silt and
clay), and has compact structure. In terms of fertility the tin
tailings are extremely deficient in almost all nutrients and
have very low water retention capacity [15].Continuous
mining operations in Malaysia which began about 150 years
ago have resulted in large areas of barren land called tin
tailings. It is estimated that about 250000 hectares of
landfall in this category [16].Bestari Jaya is one of the oldest
tin mining area in Selangor .Over a century of tin mining
has produced a large amount of tin tailings or “Amang”, a
bye product ore tin mining. Amang is a Malaysian term. It
consists of a group of heavy minerals which occur together
with the tin ore recovered from the alluvium. The
constituents of amang are monazite, ilmenite, zircon,
xenotime, rutile and some other minerals [17].Of the amang
contents monazite and xenotime have substantial amounts of
thorium and uranium which are radioactive and provide high
external dose rates in the work place, storage room, and to
the environment [18]. The purpose of the study is to access
the concentration of radioactive elements Uranium and
Thorium in the area.
A-Sand Tailings
Land which has been mined has now been turned into barren
wasteland with mined out pounds surrounded by mounds of
tailings sand. These tailings sand are presently exploited for
use as construction sand [19].Due to recent sand mining
operations in the area, the concentration of TSS and TDS
has increased in water which ultimately causes the growth
of sediments in Sungai Selangor and also high concentration
of metals in riverine sediments.
B-Slime Tailings
Tin mining in the study area was carried out mainly in the
alluvium rich concentrations of cassiterite which were found
on the valley floor or which were trapped within the troughs
of pinnacled limestone. The end result of mining in almost
all cases is the formation of pond .The present investigation
is to study slurry slime at the ponds bottom. To improve the
properties of slurry slime that has little or no bearing and
shear strength and also to determine that the concentration
of metals in slurry slime is hazardous to environment and
whether the concentration of heavy metals in the slurry
slime conform to the norm of earths’ crust or are similar to
that in the stream sediments
Rehabilitation and Reclamation
While talking about mining activity, one cannot escape from
the issues of safety and environment. Interestingly both
issues are equally important while the mine is operating and
also after it is closed. From the point of safety, a mine
should be made safe even after its closure and from the
point of environment a mine site should be rehabilited so as
to make it useful instead of leaving it as waste land. Mined
out land usually has almost all of its infertile topsoil and fine
clay being washed, resulting in infertile, loose and dry soil
unsuitable for vegetation. Rehabilitation cost is usually high
.From the engineering aspect they are problematic since
slime contents causes differential settlement that in turn
gives problems to foundation of roads and buildings. Due to
rapid urbanization in the state, Selangor has greatly
increased the size of built up areas. Many urban areas have
expanded to mined out land which has numerous ponds. It is
estimated that the urban population will double itself every
ten to 15 years[20] and mined out ponds in the way of urban
expansion will be reclaimed and utilised for the construction
of industrial, recreational and residential centres. Many
methods have been adopted for reclaiming ex-mining lakes
and ponds. the most commonly used method is the
developing of housing estates and industrial parks is to
lower the water level of the ponds and emplace fill material
from one end of the pond [21].Similar kind of method is
adopted by Selangor Estate Government to rehabilitate the
ex-mining area of Bestari Jaya by the development of
University Industry Selangor (UNISEL) and Kampung
Bestari Jaya. Two other methods of reclamation are
Displacement method and The Containment Method.[22].
The purpose of current study is to make the rehabilitation
and reclamation process more feasible and cheaper. While
talking about rehabilitation and reclamation, no-one can
ignore the importance of methods such as phytoremediation,
biosorption and biodegradation so these methods will be top
priority in our study.
ACKNOWLEDGEMENT
The work reported in this paper is a basic research work
carried out in Analytical Laboratory, Department of
Chemistry, University of Malaya in order get ground
information about the ex-mining area. I take this opportunity
to express my gratitude to Ministry of Higher Education,
Malaysia to provide me scholarship to complete my higher
studies in Malaysia. Thanks also go to Institut Pengurusan
Dan Pemantauan Penyelidikan, (IPPP) University of Malaya
for providing me enough funding to complete this valuable
research.
REFERENCES
[1] IR.Khor Peng Seong, “Ex-tin mining land in Malaysia: a
valuable asset and resource,” in 2000 conf. on Asia-Pacific Mining and Quarrying (APMQ), Malaysia.
[2] http://earthsci.org/mineral/mindep/depfile/tin.htm#anchor210973
[3] G. Balamurugan, “Tin mining and sediment supply in Peninsular Malaysia with special reference to the Kelang River basin,” The Environmentalist Vol.11, no. 4, pp.281-291, 1991.
[4] S.R. Aiken, C.H. Leinbach, T.R. and M.R. Moss, “Development
and environment in Peninsular Malaysia,” McGraw-Hill, Southeast Asia series, Singapore, 1982.
[5] TED database, case studies, tin mining in Malaysia. [Online].
Available: http://www.american.edu/projects/mandala/TED/tin.htm
[6] Department of Irrigation and Drainage (DID), Hydrology and Water Resource Division, HydroNet: National Hydrological
Networks, [Online]. Available: h2o.water.gov.my/v2/fail/Invstations/Inventory.html
[7] APHA Standard Methods of Water and Waste Water analysis, (20
th ed.) Washington, \ D.C.1998.
[8] J.E. Duddridge and M. Wianwright , “Heavy metals in river sediments-calculation of metal absorption maximum using Langmuir and Freundlch isotherms,” Environ. Poll., no. 2, pp. 131-136, 1981.
[9] ASTM Standard Test Method for Particle-Size Analysis of Soils, ASTM D422 – 63, 2007.

International Journal of Basic & Applied Sciences IJBAS-IJENS Vol:10 No:03 13
102003-4646 IJBAS-IJENS © June 2010 IJENS I J E N S
[10] G. J. Bouyoucos, “Directions for making mechanical analysis of soils by the hydrometer method,” Soil Sc. No. 3, pp. 42, 1936.
[11] ASTM Standard Test Methods for Measurement of Hydraulic Conductivity of Saturated Porous Materials Using a Flexible Wall Permeameter, ASTM D5084 – 03, 2009.
[12] IR. Haji Abdullah Zawawi, “Mines safety and rehabilitation
policy- the Malaysian experience,” in 2000 conf. on Asia-Pacific Mining and Quarrying (APMQ), Malaysia, pp 207-214.
[13] J.Das and B.C. Acharya, “Hydrology and assessment of lotic water quality in Cuttack city, India,” Water, Air, Soil Poll.
Vol.150, pp.163-175, 2003. [14] D.L. Rowell, Soil Science Methods and Applications. Longman
Scientific and Technical, United Kingdom, 1994, ch. 1. [15] N.M. Majid, A. Hashim and I. Abdol, “Rehabilitation of ex-tin
mining land by aggroforestry practice,” J.Trop. F. Sc. Vol. 1, no. 7, pp.113-127, 1994.
[16] J.A. Samshuddin, N. Mokhtar, and S. Paramananthan,
“Morphology, mineralogy and chemistry of ex-mining land in Ipoh, Perak,” Pertanika, Vol.3, pp. 88-991, 1986.
[17] S.K. Lee, H. Wagiran, A.T. Ramli, N.H. Apriantoro and A.K. Wood, “Radiological monitoring- terrestrial natural
radionuclides in Kinta District, Perak, Malaysia,” J.Environ. Rad. Vol. 100, no. 5, pp. 368-374. 2009.
[18] S.J. Hu, C.S. Chong and S. Subas, “238U and 232v
Th in cassiterites samples and amang by products,” Health Phys.
Vol.40, pp. 248-250, 1981. [19] W.S. Chow and A.R.Yunus, “Geological assessment and
evaluation of construction materials in land development ,”
Malaysian experience geological survey, E (F) 2/91, unpublished, 1992.
[20] R.N. Yong, C.K. Chen, C.S. Sellapah and B.K.Tan, “Characterisation studies of the Singapore clay slurry (slime),” Geotech. Engg. Vol.16, pp. 139-166, 1985.
[21] B.K. Tan, “Geological and geotechnical problems of urban
centres in Malaysia,” proceedings of land plan, Tech. Rep. II AGID -12, 1986.
[22] K.Yee, “The uses of geotextiles in reclamation of ex-mining land for housing development and other Purposes,” presented at
1990 seminar on Land Affected by Mining – Utilization, Planning, Investigation, and Reclamation, Mines Research Institute Ipoh, Perak, Malaysia.
[23] ASTM Standard Practice for Nitric Acid Digestion of Solid
Waste, ASTM D Standard 5198-09, 2009.
Biography Muhammad Aqeel Ashraf
1, M.Phil. is a PhD student in environmental
chemistry at the Department of Chemistry, University of Malaya, Kuala
Lumpur, Malaysia. Email: [email protected] Mohd. Jamil Maah
1, M.Sc, PhD is a Professor of analytical chemist ry at
Department of Chemistry and is currently serving as Deputy Vice
Chancellor (Research & Innovation) in University of Malaya, Kuala Lumpur, Malaysia. Email: [email protected]
Ismail Bin Yusoff, M.Sc, PhD is an Associate Professor at Department of Geology, University of Malaya, Kuala Lumpur, Malaysia. Email: [email protected]

International Journal of Basic & Applied Sciences IJBAS-IJENS Vol:10 No:03 14
102003-4646 IJBAS-IJENS © June 2010 IJENS I J E N S
T ABLE I PHYSIO-CHEMICAL PARAMETERS OF SURFACE WATER IN THE STUDY AREA
Sample No. Location Coordinates Colour TCU
Temperature C
0 pH Conductivity
µS/cm Salinity %
Turbidity NTU
Dissolved O xygen mg/l
Total Dissolved Solids mg/l
WS1 Junction of Sungai Selangor + Sungai Ayer Hitam
30
24’ 28.04” N 101
0 25’ 54.89” E
5 32.19 6.47 1640 0.27 16 6.83 2654
WS2 Junction of Sungai Ayer Hitam + Sungai
Udang
30
24’ 30.96” N
1010 25’ 54.08” E
7 32.62 6.27 1680 0.28 18 6.65 2784
WS3 Sungai Ayer Hitam water flow 30
24’ 36.54” N 101
0 25’ 59.96” E
7 32.52 6.27 1686 0.28 18 6.70 2797
WS4 Sungai Ayer Hitam at bank of UNISEL 30
24’ 56.68” N 101
0 25’ 59.18” E
7 32.51 6.29 1686 0.28 18 6.72 2800
WS5 Sungai Ayer Hitam at bank of UNISEL 30
25’ 06.69” N 101
0 26’ 08.14” E
7 32.98 6.29 1688 0.28 19 6.15 2812
WS6 Junction of Pond 1 to Sungai Ayer Hitam
30
25’ 16.57” N 101
0 26’ 09.24” E
7 32.90 6.28 1690 0.28 18 6.42 2864
WS7 Pond 1 30
25’ 13.37” N
1010 26’ 04.66” E
7 32.75 5.78 1704 0.29 19 6.34 2900
WS8 Pond 1 30
25’ 15.56” N 101
0 26’ 0.79” E
7 32.50 5.20 1744 0.29 20 6.00 2934
WS9 Junction of Pond 1 to another Pond 30
25’ 13.87” N 101
0 25’ 55.35” E
7 32.44 5.32 1734 0.29 19 6.42 2924
WS10 Junction of Sungai Ayer Hitam to Pond 2 at north-eastern boundary UNISEL
30
25’ 20.92” N 101
0 26’ 12.06” E
7 32.28 5.41 1694 0.28 18 6.39 2887
WS11 Junction of Sungai Ayer Hitam to Pond 2 30
25’ 22.11” N 101
0 26’ 6.66” E
9 32.32 5.34 1710 0.28 20 6.28 2912
WS12 Pond 2 30
25’ 22.54” N
1010 26’ 0.94” E
9 32.12 5.22 1724 0.29 22 6.87 2920
WS13 Pond 2 30
25’ 22.05” N 101
0 25’ 58.38” E
9 32.57 5.39 1732 0.29 24 6.45 2922
WS14 Pond2 30
25’ 23.71” N 101
0 25’ 52.42” E
9 32.29 5.28 1738 0.29 22 6.59 2956
WS15 Junction of Pond 2 to another Pond 30
25’ 33.21” N 101
0 25’ 51.34” E
9 32.51 5.00 1756 0.30 22 6.82 2998
Mean
_ X
7
32.5
5.71
1707
0.28
0.19
6.50
2870
Standard Deviation
Ơ
1.18
0.24
0.52
30.83
0.007
2.13
0.25
87.26
Variance (Standard Deviation)
Ơ
2
1.40
0.06
0.27
950.78
0.00006
4.552
0.06
7615.49

International Journal of Basic & Applied Sciences IJBAS-IJENS Vol:10 No:03 15
102003-4646 IJBAS-IJENS © June 2010 IJENS I J E N S
T ABLE II GRAIN SIZE ANALYSIS OF THE SOIL
Sample No.
Location
Coordinates
Gravel
Sand Silt
Clay Course to Medium Fine
Particle Diameter
mm
%age Particle Diameter
mm
%age Particle Diameter
mm
%age Total %age
Particle Diameter
mm
%age Particle Diameter
mm
%age
SS1 Junction of Jalan Timur Tambahan
+ Sungai Selangor
30
24’ 29.80” N
1010 25’ 55.08” E
4 37.66 1 32.01 0.1 25.34 57.35 0.04 2.81 0.0014 2.18
SS2 Bank of Sungai Ayer Hitam + Sungai Udang
30
24’ 32.03” N 101
0 25’ 54.75” E
5 37.98 2 30.45 0.2 26.73 57.18 0.02 2.40 0.0009 2.44
SS3 Bank of Sungai Ayer Hitam 30
24’ 36.29” N 101
0 25’ 57.34” E
3 35.44 1 29.48 0.1 27.52 57.00 0.02 3.88 0.0008 3.68
SS4 South-eastern boundary of UNISEL 30
24’ 54.73” N 101
0 26’ 0.48” E
6 38.41 2 30.18 0.3 27.36 57.54 0.04 2.57 0.0016 1.48
SS5 Wetlands developed by overflow of Pond 1
30
25’ 09.78” N 101
0 25’ 59.41” E
5 36.98 1 31.24 0.3 25.57 56.81 0.01 2.88 0.0016 3.38
SS6 Bank of Pond 1 30
25’ 11.54” N
1010 26’ 07.44” E
4 37.52 2 31.12 0.2 26.60 57.72 0.009 2.67 0.0019 2.09
SS7 North-eastern boundary of UNISEL 30
25’ 13.40” N 101
0 26’ 11.64” E
3 37.84 2 30.52 0.2 25.92 56.44 0.02 3.13 0.0018 2.59
SS8 Wetlands developed by overflow of Pond 1
30
25’ 59.18” N 101
0 25’ 56.90” E
4 36.85 2 29.92 0.2 26.34 56.26 0.008 3.98 0.0019 2.91
SS9 Junction of Sungai Ayer Hitam with pond 1 on north-western side
30
25’ 19.80” N 101
0 26’ 13.07” E
5 35.94 2 30.74 0.1 26.40 57.14 0.1 3.76 0.0016 3.16
SS10 Junction of Sungai Ayer Hitam with pond 1 on south-western side
30
25’ 22.79” N 101
0 26’ 11.06” E
5 37.72 2 29.12 0.1 27.86 56.98 0.3 2.81 0.0008 2.49
SS11 Wetland between Pond 1 and
Pond 2
30
25’ 20.64” N
1010 25’ 54.37” E
4 37.44 1 31.19 0.3 27.15 58.34 0.4 2.21 0.0008 2.01
SS12 Embankment of Pond 2 30
25’ 27.52” N 101
0 25’ 53.89” E
3 37.74 1 32.92 0.2 25.47 58.39 0.2 2.10 0.0009 1.77
SS13 Embankment of Pond 2 30
25’ 22.86” N 101
0 25’ 51.67” E
6 37.54 2 31.44 0.4 26.13 57.57 0.2 2.56 0.0014 2.33
SS14 Embankment of Pond 2 30
25’ 34.95” N 101
0 25’ 49.93” E
3 37.75 2 30.88 0.3 25.71 56.59 0.3 3.12 0.0016 2.54
SS15 Embankment of Pond 2 30
25’ 36.24” N 101
0 25’ 52.14” E
5 37.58 1 31.12 0.2 26.76 57.88 0.009 2.62 0.0018 1.92
Mean
_
X
4.33
37.35
1.6
30.82
0.2
26.45
57.20
0.11
2.9
0.0013
2.46
Standard Deviation
Ơ
1.04
0.77
0.50
0.95
0.09
0.78
0.63
0.13
0.57
0.0004
0.61
Variance (Standard Deviation)
Ơ
2
1.09
0.60
0.25
0.91
0.008
0.61
0.40
0.01
0.33
0
0.37

International Journal of Basic & Applied Sciences IJBAS-IJENS Vol:10 No:03 16
102003-4646 IJBAS-IJENS © June 2010 IJENS I J E N S
T ABLE III PHYSIO-CHEMICAL PARAMETERS OF SOIL IN THE STUDY AREA
Sample No. Location Coordinates Moisture Content %
by weight
Temperature C0
pH Hydraulic Conductivity cm/day
SS1 Junction of Jalan Timur Tambahan + Sungai Selangor
30
24’ 29.80” N 101
0 25’ 55.08” E
6.23 21.22 5.7 14.3
SS2 Bank of Sungai Ayer Hitam + Sungai Udang
30
24’ 32.03” N 101
0 25’ 54.75” E
6.24 22.84 5.5 12.4
SS3 Bank of Sungai Ayer Hitam 30
24’ 36.29” N 101
0 25’ 57.34” E
6.38 21.44 5.3 15.2
SS4 South-eastern boundary of UNISEL 30
24’ 54.73” N 101
0 26’ 0.48” E
6.43 22.19 5.3 12.9
SS5 Wetlands developed by overflow of
Pond 1
30
25’ 09.78” N
1010 25’ 59.41” E
6.52 22.92 5.4 13.8
SS6 Bank of Pond 1 30
25’ 11.54” N 101
0 26’ 07.44” E
6.18 21.14 5.8 12.5
SS7 North-eastern boundary of UNISEL 30
25’ 13.40” N 101
0 26’ 11.64” E
6.34 22.81 5.7 13.6
SS8 Wetlands developed by overflow of Pond 1
30
25’ 59.18” N 101
0 25’ 56.90” E
6.48 22.45 5.8 13.7
SS9 Junction of Sungai Ayer Hitam with pond 1 on north-western side
30
25’ 19.80” N 101
0 26’ 13.07” E
6.44 21.91 5.8 14.1
SS10 Junction of Sungai Ayer Hitam with
pond 1 on south-western side
30
25’ 22.79” N
1010 26’ 11.06” E
6.30 21.65 5.8 14.5
SS11 Wetland between Pond 1 and Pond 2 30
25’ 20.64” N 101
0 25’ 54.37” E
6.38 22.24 5.4 14.8
SS12 Embankment of Pond 2 30
25’ 27.52” N 101
0 25’ 53.89” E
6.41 21.14 5.8 13.8
SS13 Embankment of Pond 2 30
25’ 22.86” N 101
0 25’ 51.67” E
6.28 22.34 5.1 12.9
SS14 Embankment of Pond 2 30
25’ 34.95” N 101
0 25’ 49.93” E
6.39 21.87 5.8 14.6
SS15 Embankment of Pond 2 30
25’ 36.24” N
1010 25’ 52.14” E
6.43 22.39 5.7 13.3
Mean
_
X
6.36
22.0
5.6
13.7
Standard Deviation
Ơ
0.09
0.61
0.23
0.84
Variance (Standard Deviation)
Ơ
2
0.009
0.37
0.05
0.71

International Journal of Basic & Applied Sciences IJBAS-IJENS Vol:10 No:03 17
102003-4646 IJBAS-IJENS © June 2010 IJENS I J E N S
T ABLE IV HEAVY METALS CONCENTRATION IN THE SURFACE WATER OF THE STUDY AREA
Element Concentration mg/l (ppm)
Sample No. Location Coordinates Pb2+
Zn2+
Ni2+
Co2+
As3+
Cu2+
Fe2_
Mn2+
Sn2+
WS1 Junction of Sungai Selangor + Sungai Ayer Hitam
30
24’ 28.04” N 101
0 25’ 54.89” E
38 88 2.5 1.0 30 59 06 44 85
WS2 Junction of Sungai Ayer Hitam + Sungai Udang
30
24’ 30.96” N 101
0 25’ 54.08” E
46 86 2.5 2.1 35 78 10 46 100
WS3 Sungai Ayer Hitam water flow 30
24’ 36.54” N
1010 25’ 59.96” E
45 86 3.1 2.0 32 68 12 46 150
WS4 Sungai Ayer Hitam at bank of UNISEL 30
24’ 56.68” N
1010 25’ 59.18” E
51 87 3.6 1.9 36 76 15 47 150
WS5 Sungai Ayer Hitam at bank of UNISEL 30
25’ 06.69” N 101
0 26’ 08.14” E
51 86 2.9 2.0 52 69 13 49 155
WS6 Junction of Pond 1 to Sungai Ayer Hitam
30
25’ 16.57” N 101
0 26’ 09.24” E
60 88 7.5 2.9 78 71 10 49 200
WS7 Pond 1 30
25’ 13.37” N 101
0 26’ 04.66” E
58 88 8.1 2.5 91 60 12 48 225
WS8 Pond 1 30
25’ 15.56” N
1010 26’ 0.79” E
89 90 6.2 2.8 88 80 15 49 268
WS9 Junction of Pond 1 to another Pond 30
25’ 13.87” N
1010 25’ 55.35” E
67 90 4.3 3.0 67 75 20 48 227
WS10 Junction of Sungai Ayer Hitam to Pond 2 at north-eastern boundary UNISEL
30
25’ 20.92” N 101
0 26’ 12.06” E
80 92 3.4 2.7 91 70 14 48 199
WS11 Junction of Sungai Ayer Hitam to Pond 2 30
25’ 22.11” N 101
0 26’ 6.66” E
89 94 5.9 2.9 69 78 18 49 134
WS12 Pond 2 30
25’ 22.54” N 101
0 26’ 0.94” E
91 132 8.1 1.8 90 95 19 51 155
WS13 Pond 2 30
25’ 22.05” N
1010 25’ 58.38” E
87 110 6.2 2.1 89 81 20 50 190
WS14 Pond2 30
25’ 23.71” N
1010 25’ 52.42” E
94 122 5.5 2.5 71 88 18 49 198
WS15 Junction of Pond 2 to another Pond 30
25’ 33.21” N 101
0 25’ 51.34” E
96 121 2.8 1.8 77 80 16 48 250
Mean
_ X
69.46
87.8
4.8
2.2
66
75
14
48
179
Standard Deviation
Ơ
20.70
31.96
2.06
0.55
23.36
9.56
4.10
1.75
52.53
Variance (Standard Deviation)
Ơ
2
428.55
1021.7
4.24
0.30
546.11
91.45
16.83
3.06
2760
International Journal of Basic & Applied Sciences IJBAS-IJENS Vol:10 No:03 18
102003-4646 IJBAS-IJENS © June 2010 IJENS I J E N S
T ABLE V HEAVY METALS CONCENTRATION IN THE SOIL OF THE STUDY AREA
Element Concentration mg/kg
Sample No. Location Coordinates Pb2+
Zn2+
Ni2+
Co2+
As3+
Cu2+
Fe2_
Mn2+
Sn2+
SS1 Junction of Jalan Timur Tambahan + Sungai Selangor
30
24’ 29.80” N 101
0 25’ 55.08” E
110 120 8.5 3.0 70 120 22 84 425
SS2 Bank of Sungai Ayer Hitam + Sungai Udang
30
24’ 32.03” N 101
0 25’ 54.75” E
96 113 5.5 2.8 75 112 24 91 400
SS3 Bank of Sungai Ayer Hitam 30
24’ 36.29” N
1010 25’ 57.34” E
110 132 6.1 2.0 82 128 25 72 390
SS4 South-eastern boundary of UNISEL 30
24’ 54.73” N
1010 26’ 0.48” E
115 110 6.6 2.9 86 135 25 84 350
SS5 Wetlands developed by overflow of Pond 1
30
25’ 09.78” N 101
0 25’ 59.41” E
120 122 7.9 2.0 62 140 25 89 355
SS6 Bank of Pond 1 30
25’ 11.54” N 101
0 26’ 07.44” E
102 121 7.5 2.9 78 137 25 81 338
SS7 North-eastern boundary of UNISEL 30
25’ 13.40” N 101
0 26’ 11.64” E
108 100 8.1 2.5 91 125 26 79 325
SS8 Wetlands developed by overflow of
Pond 1
30
25’ 59.18” N
1010 25’ 56.90” E
99 120 6.2 2.8 88 100 26 86 368
SS9 Junction of Sungai Ayer Hitam with
pond 1 on north-western side
30
25’ 19.80” N
1010 26’ 13.07” E
97 102 7.3 3.0 67 125 28 98 387
SS10 Junction of Sungai Ayer Hitam with pond 1 on south-western side
30
25’ 22.79” N 101
0 26’ 11.06” E
120 112 6.4 2.7 91 120 25 98 399
SS11 Wetland between Pond 1 and Pond 2
30
25’ 20.64” N 101
0 25’ 54.37” E
85 100 5.9 2.9 69 128 26 81 434
SS12 Embankment of Pond 2 30
25’ 27.52” N 101
0 25’ 53.89” E
99 132 8.1 2.8 90 125 25 83 455
SS13 Embankment of Pond 2 30
25’ 22.86” N
1010 25’ 51.67” E
97 110 6.2 2.1 89 130 28 90 490
SS14 Embankment of Pond 2 30
25’ 34.95” N
1010 25’ 49.93” E
110 122 5.5 3.5 71 128 24 81 498
SS15 Embankment of Pond 2 30
25’ 36.24” N 101
0 25’ 52.14” E
110 121 5.8 2.8 77 130 29 86 450
Mean
_ X
105
115
6.7
2.7
79
125
25.5
85
404
Standard Deviation
Ơ
9.81
10.24
1.02
0.41
9.80
9.94
1.76
6.92
53.46
Variance (Standard Deviation)
Ơ
2
96.31
105
1.05
0.14
96.20
98.98
3.12
47.98
2858
International Journal of Basic & Applied Sciences IJBAS-IJENS Vol:10 No:03 19
102003-4646 IJBAS-IJENS © June 2010 IJENS I J E N S
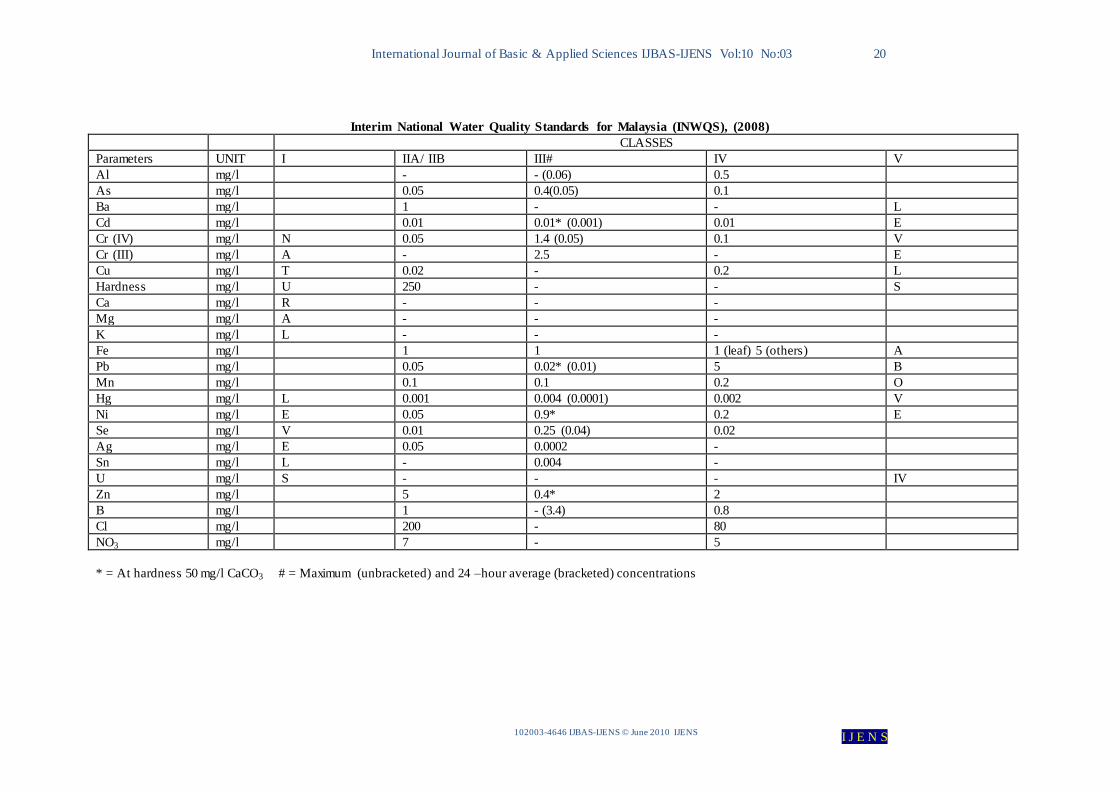
Interim National Water Quality Standards for Malaysia (INWQS), (2008)
CLASSES
Parameters UNIT I IIA IIB III IV V
Ammonical Nitrogen mg/l 0.1 0.3 0.3 0.9 2.7 >2.7
BOD mg/l 1 3 3 6 12 >12
COD mg/l 10 25 25 50 100 >100
DO mg/l 7 5-7 5-7 3-5 <3 <1
pH 6.5-6.8 6-9 6-9 5-9 5-9 -
Colour TCU 15 150 150 - - -
Electric Conductivity* µmhos/cm 1000 1000 - - 6000 -
Floatables N N N - - -
Odour N N N - - -
Salinity % 0.5 1 - - 2 -
Taste N N N - - -
Total Dissolved Solids mg/l 500 1000 - - 4000 -
Total Suspended Solids mg/l 25 50 50 150 300 300
Temperature C 0C - Normal +2
0C - Normal +2
0C - -
Turbidity NTU NTU 5 50 50 - - -
Faecal Coliform** Counts/100mL 10 100 400 5000(20000)a 5000(20000)a -
Total Coliform Counts/100mL 100 5000 5000 50000 50000 >50000
Notes
N: No visible floatable materials or debris or No objectionable odour, or No objectionable taste
*: Related parameters, only one recommended for use **: Geometric mean a: maximum not to be exceeded
CLASS I: Conservation of natural environment water supply - practically no treatment necessary. Fishery 1 - very sensitive aquatic species
CLASS IIA: Water Supply II - conventional treatment required. Fishery ll - sensitive aquatic species CLASS IIB: Recreational use with body contact
CLASS III: Water Supply III - extensive treatment required Fishery lll - common, of economic value, and tolerant species livestock drinking
CLASS IV: Irrigation
International Journal of Basic & Applied Sciences IJBAS-IJENS Vol:10 No:03 20
102003-4646 IJBAS-IJENS © June 2010 IJENS I J E N S
Interim National Water Quality Standards for Malaysia (INWQS), (2008)
CLASSES
Parameters UNIT I IIA/ IIB III# IV V
Al mg/l - - (0.06) 0.5
As mg/l 0.05 0.4(0.05) 0.1
Ba mg/l 1 - - L
Cd mg/l 0.01 0.01* (0.001) 0.01 E
Cr (IV) mg/l N 0.05 1.4 (0.05) 0.1 V
Cr (III) mg/l A - 2.5 - E
Cu mg/l T 0.02 - 0.2 L
Hardness mg/l U 250 - - S
Ca mg/l R - - -
Mg mg/l A - - -
K mg/l L - - -
Fe mg/l 1 1 1 (leaf) 5 (others) A
Pb mg/l 0.05 0.02* (0.01) 5 B
Mn mg/l 0.1 0.1 0.2 O
Hg mg/l L 0.001 0.004 (0.0001) 0.002 V
Ni mg/l E 0.05 0.9* 0.2 E
Se mg/l V 0.01 0.25 (0.04) 0.02
Ag mg/l E 0.05 0.0002 -
Sn mg/l L - 0.004 -
U mg/l S - - - IV
Zn mg/l 5 0.4* 2
B mg/l 1 - (3.4) 0.8
Cl mg/l 200 - 80
NO3 mg/l 7 - 5
* = At hardness 50 mg/l CaCO3 # = Maximum (unbracketed) and 24 –hour average (bracketed) concentrations
International Journal of Basic & Applied Sciences IJBAS-IJENS Vol:10 No:03 21
102003-4646 IJBAS-IJENS © June 2010 IJENS I J E N S
Graph. 1. Scattering of Water quality Parameters
Graph. 2. Soil Profile in the Study Area
Graph. 3. Contribution of Heavy Metals in Water
Make Up of Soil in Study Area
Gravel,
37%
Sand, 58%
Silt , 3%
Clay, 2%
Gravel Sand Silt Clay
Contribution of heavy Metals in Water
Pb, 13%
Zn, 16%
Ni, 1%
Co, 0%
As, 12%
Cu, 14%Fe, 3%
Mn, 9%
Sn, 32%
Pb Zn Ni Co As Cu Fe Mn Sn

International Journal of Basic & Applied Sciences IJBAS-IJENS Vol:10 No:03 22
102003-4646 IJBAS-IJENS © June 2010 IJENS I J E N S
Graph. 4. Concentration of Heavy Metals in Water
Graph. 5. Contribution of Heavy Metals in Soil
Graph. 6. Concentration of Heavy Metals in Soil
Concentration of Heavy Metals in Water
69.46
87.8
4.8 2.2
6675
14
48
179
0
20
40
60
80
100
120
140
160
180
200
Pb Zn Ni Co As Cu Fe Mn Sn
Metal s
Co
nc
en
tr
at
ion
(p
pm
)
Contribution of Heavy Metals in Soil
Pb, 11%
Zn, 12%
Ni, 1%
Co, 0%
As, 8%
Cu, 13%
Fe, 3%Mn, 9%
Sn, 43%
Pb Zn Ni Co As Cu Fe Mn Sn
Concentration of Heavy Metals in Soil
105115
6.7 2.7
79
125
25.5
85
404
0
50
100
150
200
250
300
350
400
450
Pb Zn Ni Co As Cu Fe M n Sn
Metal s
Co
nc
en
tr
at
ion
(p
pm
)
International Journal of Basic & Applied Sciences IJBAS-IJENS Vol:10 No:03 23
102003-4646 IJBAS-IJENS © June 2010 IJENS I J E N S
Graph. 7. Heavy metals Trends in Water in Study Area
Graph. 8. Heavy metals Trends in Soil in Study Area