study on highly efficient methane fermentation by adoption
TRANSCRIPT

Study on Highly Efficient Methane Fermentation
by Adoption of Ethanol Fermentation
Pretreatment of Food Waste
JIN SUN
2020

1
Contents
Chapter 1. Introduction ············································································ 4
1.1 The current situation and utilization technology of food waste ······················· 4
1.2 Research progress and development trend on improving the efficiency of biogas
fermentation of food waste······································································ 6
1.2.1 Existing pretreatment technology for FW ·········································· 6
1.2.2 Pretreatment of food waste with ethanol to improve anaerobic biodegradability
··································································································· 7
1.3 Objective and structure of the dissertation ··············································· 9
Chapter 2. Production of methane-rich biogas and minimization of sludge by adopting
ethanol fermentation for the pretreatment of biomethanation ····························· 17
2.1 Introduction ················································································· 17
2.2. Materials and Methods ··································································· 18
2.2.1 Substrate (Artificial food waste) ··················································· 18
2.2.2 Pretreatment (ethanol fermentation) ·············································· 18
2.2.3 Biomethanation (sequential batch experiment) ·································· 18
2.2.4 Analysis method ······································································ 19
2.3 Results and discussion ···································································· 21
2.3.1 Feasibility of operating in a stable state ·········································· 21
2.3.2 Characteristics of the biomethanation of pretreated substrate ················· 22
2.3.3 Improving biogas methane content by pretreatment ···························· 23
2.3.4 Decreasing sludge generation and improving degradation ratio through

2
pretreatment ················································································· 24
2.4 Summary ···················································································· 27
Chapter 3. Research on the possibility by adoption of ethanol fermentation pretreatment
for methane fermentation of food waste using an anaerobic membrane bioreactor ···· 35
3.1. Introduction ················································································ 35
3.2. Materials and Methods ··································································· 37
3.2.1 Substrate (Artificial food waste) ··················································· 37
3.2.2 Pretreatment (ethanol fermentation pretreatment) ······························ 37
3.2.3 Methane fermentation using AnMBR ············································· 38
3.2.4. Analysis method ····································································· 39
3.2.5. COD balances in the AnMBR ····················································· 39
3.3. Results and Discussion ··································································· 41
3.3.1 Higher loading operation by pretreatment········································ 41
3.3.2 Upgrading methane production by pretreatment ································ 42
3.3.3 Analysis of COD mass balance ···················································· 42
3.3.4 Investigation of the cause of high load operation of the EP series ············ 43
3.4 Summary ···················································································· 47
Chapter 4. Higher load operation by adoption of ethanol fermentation pretreatment for
methane fermentation of food waste using an anaerobic membrane bioreactor:
Performance and microbial community ······················································ 60
4.1. Introduction ················································································ 60
4.2. Materials and methods ··································································· 62

3
4.2.1. Substrate (Artificial food waste) ·················································· 62
4.2.2. Pretreatment (ethanol fermentation pretreatment) ······························ 62
4.2.3. Methane fermentation using AnMBR ············································ 63
4.2.4. Analysis biogas production rate ··················································· 64
4.2.5. Analysis method ····································································· 64
4.2.6. Metagenomic analysis ······························································ 65
4.3. Results and discussion ··································································· 67
4.3.1 Higher loading operation by pretreatment········································ 67
4.3.2 Effect of EP on biogas production rate kinetics ································· 69
4.3.3 Microbial community ······························································· 70
4.3.3.1 Bacterial taxonomic identification ··········································· 70
4.3.3.2 Archaeal taxonomic identification ··········································· 72
4.3.3.3 The main metabolic pathways of the microbial communities ··········· 75
4.4 Summary ···················································································· 77
Chapter 5. Conclusions ·········································································· 94
Acknowledgement ··············································································· 97

4
Chapter 1. Introduction
1.1 The current situation and utilization technology of food waste
Food waste (FW) was defined by the UN Food and Agriculture Organization (FAO)
and includes any healthy or edible substance that is wasted, lost, degraded at every stage
of the food supply chain [1]. Approximately 1.3 to 1.6 billion tons of FW are generated
globally each year and the amount of FW is expected to increase in the next 25 years [2,
3]. FW is currently a serious issue in megacities worldwide. FW, which is the dominant
fraction of organic fraction of municipal solid waste, is putrescible; when buried in a
landfill, it decomposes to form methane, a greenhouse gas with a global warming
potential 25 times greater than CO2 on a 100 year time scale [4]. In Japan, ~19 million
tons of FW was generated annually, including ~ 11.3 million tons from wholesale, retail,
catering, and restaurant activities for food manufacturing and ~ 7.7 million tons from
household preparation and cooking [5]. Presently, the most common FW treatment and
utilization methods are incineration, landfilling, use as animal feed, methane fermentation,
and composting. In particular, incineration or landfillin has been the main process for
discarding and reducing the volume of FW from restaurants and households [6]. However,
Japan is short of available land for landfilling, and a large amount of harmful substances
(dioxins) and greenhouse gases (CO2) are produced during incineration [5]. Therefore,
more sustainable and environmentally friendly management strategies for food waste
should be addressed and developed.
Compared with other waste types, FW is rich in organic matter, oil, salt, and nutrients
[7, 8]. FW is a high organic waste which is rich in starch, fat, protein and cellulose, and
has an average water content of 80% [9]. Compared to landfilling, composting and

5
incineration, AD is regarded as an economic and eco-friendly method has been widely
applied in the disposal of FW. Due to its ability of converting organic substrates to
methane and organic fertilizers from FW simultaneously, largely reducing the risk of FW
to human health and the environment [5, 10]. This process in which organic substrates
are degraded in the absence of oxygen is based on the metabolism and interspecies
interactions of diverse microorganisms [11, 12]. AD has various advantages as a method
for waste treatment and energy generation. AD of food waste is a highly ranked alternative
method to recycle food waste when it is not practical to utilize food waste as feed or
fertilizer, e.g., while separating inadequate matter is difficult or when the utilization site
is located far from urban areas. In particular, biogas power generation that is attractive
because of the comparatively higher prices of other renewable energy sources that are
subjected to tariffs [13]. In Japan, acquisition price of solar power (between 10 and 250
kW) in 2020 was 12~13 yen (plus tax) per 1 kW, and methane fermentation power was
39 yen (plus tax) [14].
The driving force of development of anaerobic digestion of FW also derived from
serious shortage of fossil fuels and the urgent demand for renewable and sustainable
alternative fuels [15]. The mobilization and extensive use of organic FW as a renewable
bioenergy production source have high potential to help secure a safe energy supply [16].
Therefore, methane fermentation with low greenhouse gas emission and higher profit
which meets growing energy demand in promoting renewable alternatives [17].

6
1.2 Research progress and development trend on improving the efficiency of biogas
fermentation of food waste
1.2.1 Existing pretreatment technology for FW
As mentioned in the previous section, methane fermentation technology has many
economic and sustainability benefits. Consequently, food recycling methods have gained
more attention and many recycling projects are based on AD. However, methane
fermentation processes have certain disadvantages, methanogens grow more slowly than
bacteria; this may readily lead to an imbalance between acidification and methanation
[18]. In addition, long hydraulic retention times (HRTs), dependence on sluggish
decomposition, and decreases in pH due to the accumulation of VFAs (Cesaro &
Belgiorno et al., 2014; Ma et al., 2018).
AD comprises a series of reactions which are performed by different groups of
microbial populations. AD mainly involves four stages: hydrolysis, acidogenesis,
acetogenesis and methanogenesis [19]. During AD, VFAs are decomposed to acetate, CO2
and H2 which are subsequently utilized as substrates for methanogenesis [20]. Many FW
pretreatment methods have been explored in order to make AD go smoothly. FW
pretreatment methods can be divided into four categories, namely heat treatment;
mechanical treatment, including microwave, ultrasonic, high-pressure and pulse
discharge; biological treatment, including enzymatic hydrolysis and aerobic composting;
and chemical treatment, including addition of acid, alkali and oxide [21, 22]. As well as
combinations of these have been applied for improving methane production and increase
processing load of AD.
In addition, adding a membrane into a fermenter effectively prevents the runoff of
anaerobic microorganisms with low growth rates, providing the long sludge retention

7
time (SRT) needed to maintain substrate degradation while enabling operation with short
HRT [23–25]. In theory, the AnMBR is more suitable to treat highstrength wastewater
due to the prolonged SRT [26]. Therefore, more and more researchers are attempting to
use AnMBRs for the treatment of organic solidwastes. Cheng et al. (2018) and Amha et
al. (2019) reported achieving high degradation efficiency up to an organic loading rate
(OLR) of 10 g-COD/L/d in mesophilic methane fermentation of FW using anaerobic
membrane bioreactors (AnMBR). AnMBR effectively prevent the washout of these slow
growing methanogens, enabling operation at longer solid retention times than HRT.
1.2.2 Pretreatment of food waste with ethanol to improve anaerobic biodegradability
Batch biomethanation experiments using an ethanol fermented artificial food waste
substrate showed an increased methane ratio in biogas, indicating that carbon dioxide
generation decreased without affecting methane generation [29]. Ethanol fermentation
using organic waste is generally performed to produce liquid fuel. To obtain further
energy, biomethanation is available for ethanol fermented residues following evaporating
[30–32]. However, the methods for gaseous and liquid fuels necessitate collection and
refinement, which are complex processes; thus, integrating biomethanation will be
simpler than described previously. Therefore, ethanol fermentation was adopted to
improve the biodegradability process for methanation but not for biofuel collection
process. The secondary advantage of ethanol fermentation as pretreatment for
biomethanation is that higher methane content is obtained in biogas than that obtained via
conventional biomethanation. Under direct methanation, 1 mol of glucose would be
stoichiometrically converted to 3 mol of methane and 3 mol of carbon dioxide, as depicted
in Eq. (1-1). Thus, approximately 50% of the biogas would be methane:

8
C6H1 2O6 → 3CH4 + 3CO2 (1-1)
Furthermore, the ethanol fermentation of glucose in an open vessel, as shown in Eq.
(1-2), would release 2 mol of carbon dioxide. Moreover, 2 mol of ethanol produces 3 mol
of methane and 1 mol of carbon dioxide through acetic acid, as shown in Eq. (1-3),
resulting in a biogas with a methane content of 75%:
C6H1 2O6 → 2C2H5OH + 2CO2 (1-2)
2C2H5OH → 3CH4 + CO2 (1-3)
Kalyuzhnyi and Davlyatshina demonstrated that the biogas obtained through anaerobic
decomposition of ethanol depicted a methane content of 79% and that the carbon dioxide
generation was decreased to one-third [33].
Food waste from retail outlets and restaurants is rich in starch [31, 32, 34], indicating
that pretreatment would be effective for methane fermentation using such waste. Other
reports have indicated that improved methane yields could be obtained using ethanol
fermentation pretreatment [35, 36]. Ethanol fermentation pretreatment (EP) in biological
pretreatment is an effective treatment with bacteriostatic action on FW, increasing the
methane fermentation system’s buffering capacity while maintaining hydrolytic
acidification [36–38].
9
1.3 Objective and structure of the dissertation
Methane fermentation is a technology that can be expected to reduce the volume of
waste and produce energy. Methane fermentation using food waste has been introduced
in large-scale factories, but it is expected that it will be introduced in shopping centers
and small-scale factories in the future due to the recent attention to biomass resources.
Therefore, research and development for miniaturize the methane fermentation facility
will become more important in the future. In this study, to investigated the effectiveness
of ethanol pretreatment fermentation for improving the biodegradation rate in methane
fermentation of FW. The feature of this study is that ethanol is not recovered and is
fermented with methane as it is. Since food waste contains a relatively large amount of
carbohydrates, it can be expected that ethanolization will reduce the molecular weight of
the carbohydrates, improve the decomposition rate and methane concentration, and
reduce the amount of sludge generated.
This chapter as the first chapter, in chapter 2, a sequential batch experiment was
demonstrated by supplying ethanol fermented artificial food waste. The feasibility of the
operation in a stable state was discussed, and the biomethanation characteristics were
compared with those of a control group whose substrate was not ethanol fermented.
However, it should be considered that solid–liquid separation has to be performed to keep
the biomass in the reactor.
In chapter 3, examined whether anaerobic membrane bioreactor (AnMBR) can
contribute to prevent the runoff of anaerobic microorganisms, and investigate whether
stable continuous operation and pretreatment effects can be obtained of this method, and
by testing different load with the aim to investigate the degradation characteristics of an
ethanol fermented substrate on an AnMBR system. The results are expected to contribute

10
to the comprehensive understanding of the reaction rate of FW and the reduction rate of
generated sludge, thus providing a reference for further studies and engineering
applications.
In Chapter 4, based on the knowledge obtained in Chapters 2 and 3, aimed to
systematically compare control series (substrate: FW) and EP series (substrate: ethanol
fermented FW) performance of both substrates using AnMBRs. Moreover, the substrate
with a moisture content of 80 ~ 85% is used, which is close to the moisture content of
actual food waste. In the present study, a laboratory-scale mesophilic semi-continuous
AD reactor, bacterial communities present in the stable AD reactor were analysed by
Illumina MiSeq high-throughput sequencing. Both series were operated step-by-step
increasing the load to compare performance and operating limits. This study examined
whether EP of FW can allow for more effective high load operation in an AnMBR,
examining whether pretreatment effects can be obtained in a stable state and determining
the effect of EP on the maximal organic loading rate (OLR), providing a reference for
further potential engineering applications.
11
References of chapter 1
1. Braguglia CM, Gallipoli A, Gianico A, Pagliaccia P (2018) Anaerobic
bioconversion of food waste into energy : a critical review. Bioresour Technol
248:37–56. https://doi.org/10.1016/j.biortech.2017.06.145
2. Li Y, Chen Z, Peng Y, et al (2020) Changes in aerobic fermentation and
microbial community structure in food waste derived from different dietary
regimes. Bioresour Technol 317:123948.
https://doi.org/10.1016/j.biortech.2020.123948
3. Melikoglu M (2020) Reutilisation of food wastes for generating fuels and value
added products: A global review. Environ Technol Innov 19:101040.
https://doi.org/10.1016/j.eti.2020.101040
4. Clercq D De, Wen Z, Fan F, Caicedo L (2016) Biomethane production potential
from restaurant food waste in megacities and project level-bottlenecks : A case
study in Beijing. Renew Sustain Energy Rev 59:1676–1685.
https://doi.org/10.1016/j.rser.2015.12.323
5. Hou T, Zhao J, Lei Z, et al (2020) Bioresource Technology Synergistic e ff ects
of rice straw and rice bran on enhanced methane production and process stability
of anaerobic digestion of food waste. Bioresour Technol 314:123775.
https://doi.org/10.1016/j.biortech.2020.123775
6. Babalola MA (2015) A Multi-Criteria Decision Analysis of Waste Treatment
Options for Food and Biodegradable Waste Management in Japan. Environments
2:471–488. https://doi.org/10.3390/environments2040471
7. Pagliaccia P, Gallipoli A, Gianico A, et al (2019) Variability of food waste

12
chemical composition: Impact of thermal pre-treatment on lignocellulosic matrix
and anaerobic biodegradability. J Environ Manage 236:100–107.
https://doi.org/10.1016/j.jenvman.2019.01.084
8. Ren Y, Yu M, Wu C, et al (2018) A comprehensive review on food waste
anaerobic digestion: Research updates and tendencies. Bioresour Technol
247:1069–1076. https://doi.org/10.1016/j.biortech.2017.09.109
9. Wang P, Wang H, Qiu Y, et al (2018) Microbial characteristics in anaerobic
digestion process of food waste for methane production–A review. Bioresour
Technol 248:29–36. https://doi.org/10.1016/j.biortech.2017.06.152
10. Li Y, Tang Y, Xiong P, et al (2020) High-ef fi ciency methanogenesis via kitchen
wastes served as ethanol source to establish direct interspecies electron transfer
during anaerobic Co-digestion with waste activated sludge. Water Res
176:115763. https://doi.org/10.1016/j.watres.2020.115763
11. Liu G, Zhang R, El-Mashad HM, Dong R (2009) Effect of feed to inoculum
ratios on biogas yields of food and green wastes. Bioresour Technol 100:5103–
5108. https://doi.org/10.1016/j.biortech.2009.03.081
12. Cayetano RDA, Park JH, Kang S, Kim SH (2019) Food waste treatment in an
anaerobic dynamic membrane bioreactor (AnDMBR): Performance monitoring
and microbial community analysis. Bioresour Technol 280:158–164.
https://doi.org/10.1016/j.biortech.2019.02.025
13. Sun J, Kosaki Y, Watanabe N, Ishikawa M (2019) Production of methane-rich
biogas and minimization of sludge by adopting ethanol fermentation for the
pretreatment of biomethanation. J Mater Cycles Waste Manag 21:258–264.
https://doi.org/10.1007/s10163-018-0785-7

13
14. Agency for Natural Resources and Energy (2020) Guidebook on feed-in tariff for
renewable energy in 2020 (in Japanese).
15. Zhang W, Li L, Xing W, et al (2019) Dynamic behaviors of batch anaerobic
systems of food waste for methane production under different organic loads ,
substrate to inoculum ratios and initial pH. J Biosci Bioeng 128:733–743.
https://doi.org/10.1016/j.jbiosc.2019.05.013
16. Pazera A, Slezak R, Krzystek L, et al (2015) Biogas in Europe: Food and
Beverage (FAB) Waste Potential for Biogas Production. Energy and Fuels
29:4011–4021. https://doi.org/10.1021/ef502812s
17. Li Y, Chen Y, Wu J (2019) Enhancement of methane production in anaerobic
digestion process : A review. Appl Energy 240:120–137.
https://doi.org/10.1016/j.apenergy.2019.01.243
18. Li Q, Li H, Wang G, Wang X (2017) Bioresource Technology Effects of loading
rate and temperature on anaerobic co-digestion of food waste and waste activated
sludge in a high frequency feeding system , looking in particular at stability and
efficiency. Bioresour Technol. https://doi.org/10.1016/j.biortech.2017.02.045
19. Yin C, Shen Y, Yu Y, et al (2019) Bioresource Technology In-situ biogas
upgrading by a stepwise addition of ash additives : Methanogen adaption and CO
2 sequestration. Bioresour Technol 282:1–8.
https://doi.org/10.1016/j.biortech.2019.02.110
20. Kaur G, Johnravindar D, Wong JWC (2020) Bioresource Technology Enhanced
volatile fatty acid degradation and methane production e ffi ciency by biochar
addition in food waste-sludge co-digestion : A step towards increased organic
loading e ffi ciency in co-digestion. Bioresour Technol 308:123250.
14
https://doi.org/10.1016/j.biortech.2020.123250
21. Phun C, Bong C, Lim LY, et al (2018) The characterisation and treatment of food
waste for improvement of biogas production during anaerobic digestion – a
review. J Clean Prod 172:1545–1558.
https://doi.org/10.1016/j.jclepro.2017.10.199
22. Yue L, Cheng J, Hua J, et al (2020) Improving fermentative methane production
of glycerol trioleate and food waste pretreated with ozone through two-stage dark
hydrogen fermentation and anaerobic digestion. Energy Convers Manag
203:112225. https://doi.org/10.1016/j.enconman.2019.112225
23. Berkessa YW, Yan B, Li T, et al (2018) Novel anaerobic membrane bioreactor
(AnMBR) design for wastewater treatment at long HRT and high solid
concentration. Bioresour Technol 250:281–289.
https://doi.org/10.1016/j.biortech.2017.11.025
24. Chen C, Guo W, Ngo HH, et al (2016) Challenges in biogas production from
anaerobic membrane bioreactors. Renew Energy 98:120–134.
https://doi.org/10.1016/j.renene.2016.03.095
25. Becker AM, Yu K, Stadler LB, Smith AL (2017) Co-management of domestic
wastewater and food waste: A life cycle comparison of alternative food waste
diversion strategies. Bioresour Technol 223:131–140.
https://doi.org/10.1016/j.biortech.2016.10.031
26. Cheng H, Li Y, Kato H, Li YY (2020) Enhancement of sustainable flux by
optimizing filtration mode of a high-solid anaerobic membrane bioreactor during
long-term continuous treatment of food waste. Water Res 168:115195.
https://doi.org/10.1016/j.watres.2019.115195

15
27. Cheng H, Hiro Y, Hojo T, Li YY (2018) Upgrading methane fermentation of
food waste by using a hollow fiber type anaerobic membrane bioreactor.
Bioresour Technol 267:386–394. https://doi.org/10.1016/j.biortech.2018.07.045
28. Amha YM, Corbett M, Smith AL (2019) Two-Phase Improves Performance of
Anaerobic Membrane Bioreactor Treatment of Food Waste at High Organic
Loading Rates. Environ Sci Technol 53:9572–9583.
https://doi.org/10.1021/acs.est.9b02639
29. Y. Kosaki MI (2015) Study on methane fermentation using biological ethanol
fermentation as pretreatment (in Japanese). Doboku Gakkai Ronbunshuu G 71
(7):III–47–III–55
30. Publishing IWA, Science W (2011) The effect of sul fi de and ammonia on
cassava fermentation for ethanol production in an ethanol – methane coupled
system Ke Wang , Li Jiang , ZhongGui Mao , ChengMing Zhang , JianHua
Zhang. 2066–2071. https://doi.org/10.2166/wst.2011.668
31. Tang Y, Koike Y, Liu K, et al (2008) Ethanol production from kitchen waste
using the flocculating yeast Saccharomyces cerevisiae strain KF-7. 32:1037–
1045. https://doi.org/10.1016/j.biombioe.2008.01.027
32. Koike Y, An M, Tang Y, et al (2009) Production of fuel ethanol and methane
from garbage by high-efficiency two-stage fermentation process. JBIOSC
108:508–512. https://doi.org/10.1016/j.jbiosc.2009.06.007
33. Kalyuzhnyi S V, Davlyatshina MA (1997) BATCH A N A E R O B I C
DIGESTION OF GLUCOSE A N D ITS MATHEMATICAL MODELING . I .
KINETIC INVESTIGATIONS. 59:
34. Wu C, Wang Q, Xiang J, et al (2015) Enhanced Productions and Recoveries of

16
Ethanol and Methane from Food Waste by a Three-Stage Process.
https://doi.org/10.1021/acs.energyfuels.5b01507
35. Wu C, Wang Q, Yu M, et al (2015) Effect of ethanol pre-fermentation and
inoculum-to-substrate ratio on methane yield from food waste and distillers’
grains. Appl Energy 155:846–853.
https://doi.org/10.1016/j.apenergy.2015.04.081
36. Yu M, Wu C, Wang Q, et al (2018) Ethanol prefermentation of food waste in
sequencing batch methane fermentation for improved buffering capacity and
microbial community analysis. Bioresour Technol 248:187–193.
https://doi.org/10.1016/j.biortech.2017.07.013
37. K. Tanaka, Y. Kosaki MI (2015) Study on improvement of methane fermentation
using saccharification and ethanol fermentation as pretreatment (in Japanese).
Annu Conf Japan Soc Mater Cycles Waste Manag 26th B7-7
38. Zhao N, Yu M, Wang Q, et al (2016) Effect of Ethanol and Lactic Acid Pre-
fermentation on Putrefactive Bacteria Suppression, Hydrolysis, and
Methanogenesis of Food Waste. Energy and Fuels 30:2982–2989.
https://doi.org/10.1021/acs.energyfuels.5b02779

17
Chapter 2. Production of methane-rich biogas and minimization of sludge
by adopting ethanol fermentation for the pretreatment of biomethanation
2.1 Introduction
In this chapter, researchers have focused on ethanol fermentation as a pretreatment for
biomethanation of FW. Although we can know from the other reports in the chapter 1
have indicated that improved methane yields could be obtained using ethanol
fermentation pretreatment [1, 2] ; however, previous research were only reported in short-
term studies such as batch experiments. Thus, it is necessary to understand the
characteristics of the process under continuous operation in a stable state to discuss the
feasibility of its use in real-time facilities, which are usually operated through continuous
feeding.
In this chapter, a sequential batch experiment was demonstrated by supplying ethanol
fermented artificial food waste. The feasibility of the operation in a stable state was
discussed, and the biomethanation characteristics were compared with those of a control
group whose substrate was not ethanol fermented.

18
2.2. Materials and Methods
2.2.1 Substrate (Artificial food waste)
An artificial food waste (AFW) was created comprising boiled rice (300 g), cabbage
(90 g), carrot (90 g), chicken (60 g), and small dried sardines (48 g), measured on a wet
basis. The chicken and dried sardines were weighed after boiling. The material weight
ratios in the AFW were estimated based on a survey that was conducted in a university
cafeteria [3]; the materials were combined; and their mixture was further homogenized
into a paste using a grinder (Grindomix GM200, Retsch, Haan, Germany) without
sterilization process. The total solids (TS) of the AFW were adjusted to 100 g/L by adding
distilled water purged by nitrogen gas. The average composition of the AFW was 98 g/L
of volatile solids (VS), 46 g/L of total organic carbon (TOC), and 83 g/L of total sugar.
2.2.2 Pretreatment (ethanol fermentation)
The AFW adjusted to 100 g TS/L was saccharized by adding 7.5 mL glucoamylase as
an enzyme (Novozymes, Spirizyme Fuel) per 1 L of food waste at 50 °C for 2 h with
constant stirring. The saccharized AFW’s glucose concentration was 65 g/L.
Subsequently, the saccharized AFW was fermented by adding 10 g of commercial yeast
(Alcotec, Alcotec 48 Turbo Yeast) per 1 L of saccharized AFW at 26 °C for 65 h while
stirring. The fermentation procedure yielded an ethanol concentration of 33 g/L and TOC
of 43 g/L for the fermented AFW. Substrate of control was not conducted the pretreatment
procedure.
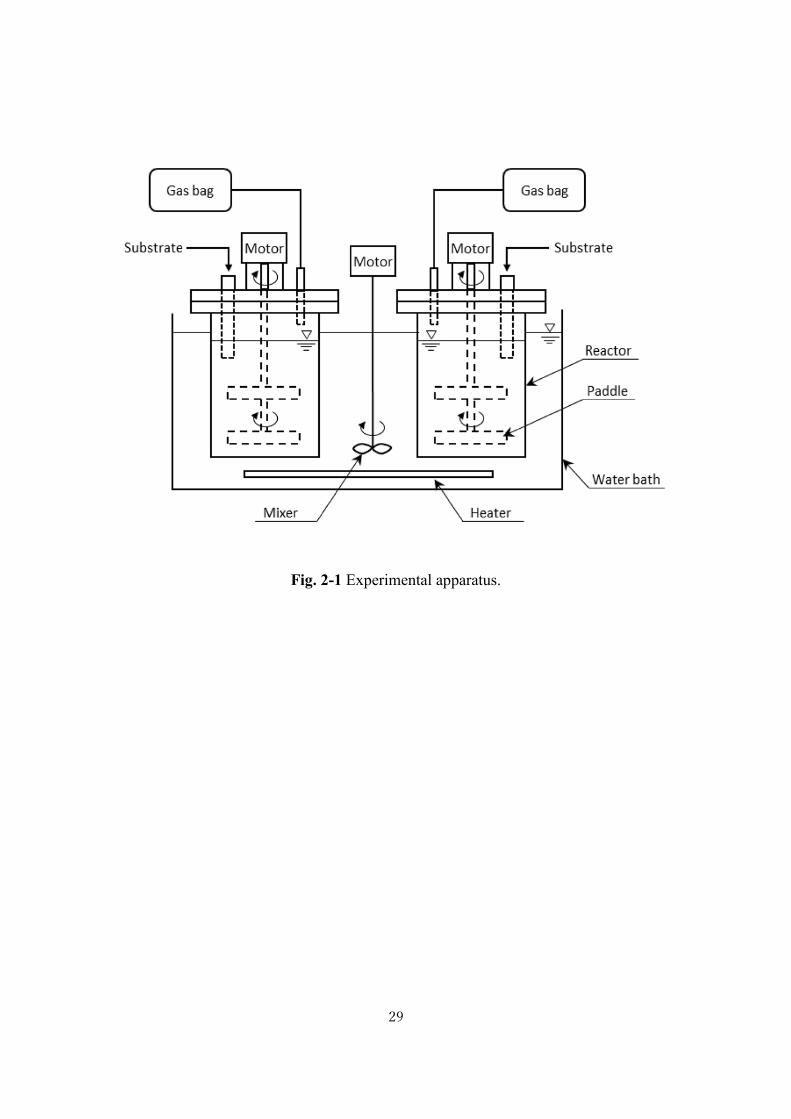
2.2.3 Biomethanation (sequential batch experiment)
An anaerobic digester (AF10-2, Miyamoto Corp., Osaka, Japan), as depicted in Fig. 2-

19
1, was used to perform the sequential batch experiment. Two 10 L vinyl chloride
cylindrical reactors were set at 37 °C, and the contents were stirred using a paddle at 90
rpm. One reactor was supplied with ethanol fermented in pretreated series AFW, whereas
the other was supplied with AFW without any pretreatment in the control series. Next,
250 mL of the substrate was fed once each day, except on Sundays, and a solution of trace
minerals dissolved in water was added—100 mg of Fe as FeCl3⋅ 6H2O, 10 mg of Co as
CoCl2, and 10 mg of Ni as NiCl2 (per 1 L of AFW)— simultaneously. The digested liquid
was drawn from the reactor just before feeding. To maintain the reactor’s biomass
concentration, half of the drawn liquid was spun in a centrifuge (H-201F, Kokusan, Tokyo,
Japan) at 10,000 rpm for 5 min after which the solid components were returned to the
reactor. Seed sludge from livestock was acclimated to the experiment by adding AFW
over a period of 6 months. pH, biomass concentration, and biogas generation volume
were checked to determine whether a stable state had been reached. Experimental
conditions were hydraulic retention time for 47 days with a VS volumetric load of 2.5 g
/L/day in the control experiment and 2.7 g L/day in the pretreatment experiment along
with the presence of enzyme (0.306 gVS/mL) and yeast (0.580 gVS/g-yeast).
2.2.4 Analysis method
Biomethanated sludge was sampled just before feeding the substrates and analyzed the
samples immediately afterward. TS, VS, suspended solids (SS), and volatile suspended
solids (VSS) were analyzed following standard methods [4]. Total sugar was analyzed
using the phenol sulfuric acid method [5], whereas glucose, ethanol, and volatile fatty
acids (VFAs) were measured after filtration using a PTFE filter (DISMIC-25HP,
ADVANTEC, Tokyo, Japan). Glucose concentration was analyzed using the glucose

20
oxidase method (Glucose kit, Glucose CIItest Wako), and total carbon in the AFW was
analyzed by combustion catalytic oxidation and non-dispersive infrared (NDIR) methods
(SSM-5000A, Shimadzu). The total organic carbon (TOC) and inorganic carbon (IC)
from the digestion liquid was also analyzed using the combustion catalytic oxidation and
NDIR methods (TOC-V, Shimadzu, Kyoto, Japan). Ethanol was quantified using a flame
ionization detector gas chromatography (GC14B, Shimadzu) using a Gasukuropack-55
column (GL Sciences, Tokyo, Japan) with helium as the carrier gas, and VFAs were
quantified using ion chromatography (Organic Acid Analysis System, Shimadzu) with a
Shimpack column SCR-102H (Shimadzu) and a mobile phase of 5 mM p-toluenesulfonic
acid, 20 mM Bis–Tris buffer, and 0.1 mM ethylenediaminetetraacetic acid (EDTA).
Biogas from the methane fermentation tank was collected by gas bag and quantified by
performing thermal conductivity detector (TCD) gas chromatography (GC14B,
Shimadzu) using a ShinCarbon ST 50/80 column (Shinwa Chemical Industries, Kyoto,
Japan) with argon as the carrier gas. The biogas volume was measured at 23–26 °C, which
was the room temperature in the laboratory.

21
2.3 Results and discussion
2.3.1 Feasibility of operating in a stable state
Feasibility of operating in a stable state Fig. 2-2a shows the VSS concentration
variations in the biomethanation reactor. The pretreatment and control series depicted the
VSS concentrations of 17.4 g/L at the beginning of the experiment. In the control series,
the VSS concentrations were observed to stabilize at approximately 16 g/L after the 14th
day, and the pH, VFA, and other characteristics were also stabilized. The control series
could operate for 70 days, from the 14th to the 84th day, at a stable state. Thus, the
operation was terminated on the 84th day, because it was deemed that sufficient data had
been obtained. In contrast, the pretreatment series depicted a decrease in its VSS
concentration to 12.6 g/L by the 42nd day. It was feared that decreasing biomass in the
reactor would lead to the failure of biomethanation. Therefore, to maintain the biomass
concentration equal to that of the control, all effluents that were observed after the 42nd
day were centrifuged, and the sediments were returned to the reactor except for sampling
for analyzing. Consequently, operation term was longer than that required for the control,
the VSS concentration recovered to become 13 g/L after the 77th day and further went on
to stabilize. The pH and VFA values also stabilized; thus, the pretreatment series could
operate for 56 days, from the 77th to the 133rd day, in a stable state. Table 2-1 shows the
average result of substrate, reactor, biogas and effluent during the stable state. In the
pretreatment series, lactic acid and acetic acid existed in addition to ethanol in the ethanol
fermented AFW; therefore, the pH was low at 4.2. In contrast, although VFA was
observed to mainly comprise acetic acid in the biomethanation reactor, it depicted a low
concentration of approximately 0.2 g/L. In addition, the pH in the reactor was 7.9, and
ethanol could not be detected. As stated previously, methane fermentation supplying the

22
ethanol fermented substrate would not cause VFA inhibition by maintaining operation of
the sludge in the reactor, thereby allowing the sequential batch operation to be maintained
in a stable state.
2.3.2 Characteristics of the biomethanation of pretreated substrate
Fig. 2-2b shows the variations in the methane content of the biogas. The methane
contents stabilized in both series; it reached a value that was between 50 and 55% in the
control series, which was within the range of results that were observed in studies related
to food waste (50–65%) [6–11]. In the pretreatment series, the methane contents were
between 65 and 70% after the third day, which was higher than that in the control series.
The average biogas methane values were 53.1% for the control series and 67.5% for the
pretreatment series (Table 2-1), approximately 15% greater than in the control series. The
biogas yield in the pretreatment series was 680 mL/gVSadded, which was smaller than
that in the control series (800 mL/gVSadded). In contrast, the methane yields were 420
mL/gVSadded for the control series and 460 mL/gVSadded for the pretreatment series,
which were almost identical. The methane yields that were observed in previous studies
ranged between 400 and 500 mL/g VS [6, 8, 10, 12] for food waste, which indicated that
this study fell within the same range illustrated by those studies.
Fig. 2c shows the variations in the accumulated drawn sludge. The drawn volume in
the control series stabilized; therefore, it was increased linearly. In the pretreatment series,
all the sludge drawn after the 47th day was centrifuged. Thus, the sludge generation in
the pretreatment series was lower than that observed in the control series. The sludge
generation that was calculated using the results in a stable state was 1.7 gVSS/day for the
control series and 0.3 gVSS/day for the pretreatment series. Thus, sludge generation in

23
the pretreatment series was observed to be one-fifth of that in the control series. As their
values were expressed as the sludge yield per added substrate, the control series value
was 0.082 gVSS/gVSadded, and the pretreatment series value was 0.014
gVSS/gVSadded. Qiang indicated that the biomass yield of food waste was between 1.5
and 15% on the COD base [8]. Although it was a different indicator, the yield obtained
from the control series in this study was similar to that obtained in Qiang’s study.
The VS decomposing ratios calculated using the substrates (excluding enzyme and
yeast) and drawn residue (Table 2-1) are 94% for the pretreatment series and 87% for the
control series. Cho reported a VS base decomposing ratio of 90% for food waste that
contained 73% dry weight of boiled rice [13], which was similar to that observed in this
study.
As stated previously, biomethanation installed ethanol fermentation pretreatment
caused a 15% improvement in methane content of the produced biogas without any loss
in the volume of generated methane and with a decrease in sludge generation to one-fifth
of the VSS base.
2.3.3 Improving biogas methane content by pretreatment
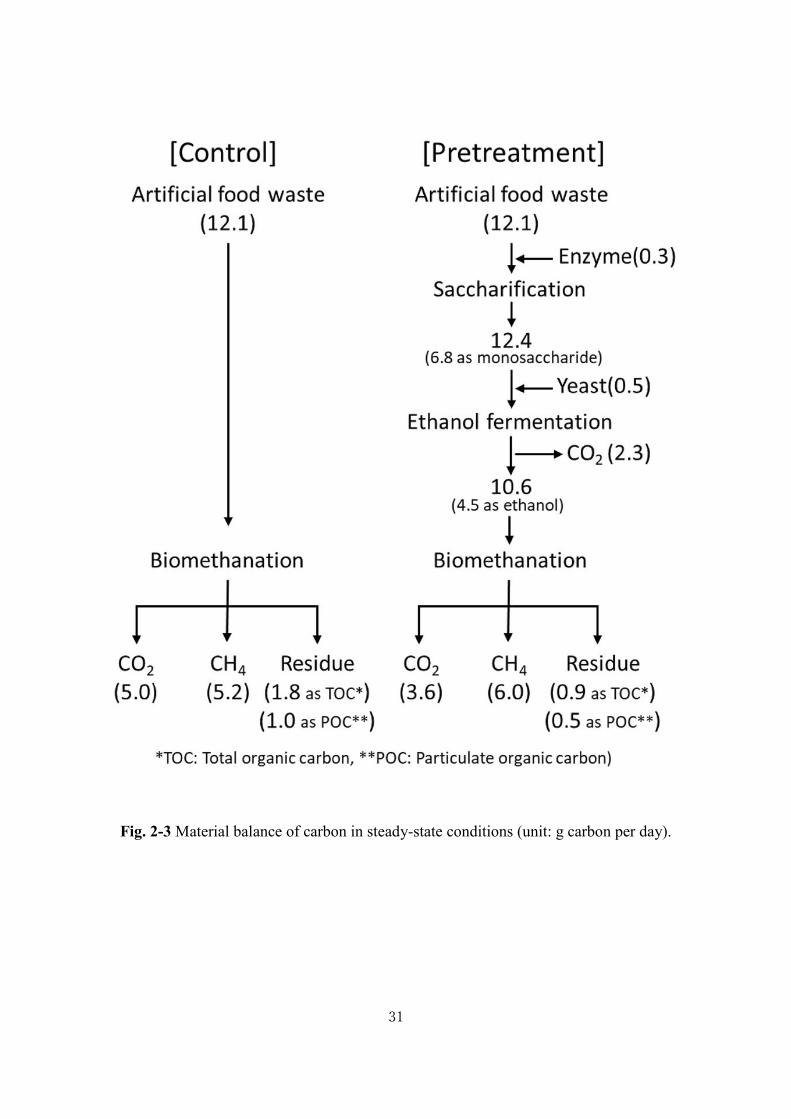
Fig. 2-3 shows the material balances of carbon in the stable state conditions. Values
from biomethanation were calculated from the concentration and volume of all effluents
and biogas during the stable state, whereas carbon dioxide from biomethanation was
analyzed for biogas and drawn effluent. Carbon dioxide generated from ethanol
fermentation was calculated by produced ethanol concentration using Eq. (1-2). In the
control series, the generated weights of methane and carbon dioxide from the substrate
were 5.2 and 5.0 gC, respectively. Therefore, the methane to carbon dioxide ratio was
24
1:0.96. The total sugar content of the AFW was 72% on carbon base. Therefore, it was
considered that similar amounts of methane and carbon dioxide were generated following
Eq. (1-1). In the pretreatment series, the weight of the monosaccharide generated by
saccharification was 6.8 gC, and almost all of the monosaccharide was consumed during
ethanol fermentation. The generated weight of ethanol in this series was 4.5 gC, which
nearly agreed with the theoretical value that was calculated using Eq. (1-2). In addition,
the calculated carbon dioxide was 2.3 gC. In case of biomethanation after ethanol
fermentation, the generated weights of methane and carbon dioxide were 6.0 and 3.6 gC,
respectively. The higher methane generation in the pretreatment series (6.0 gC) than in
the control series (5.0 gC) was because of the added carbon from the enzyme, yeast, and
an improved decomposing ratio, as discussed later. The generated weights of methane and
carbon dioxide were 6.0 and 5.9 gC, respectively, for the whole reaction, which indicated
a ratio that was identical to that of the control series (1:0.98). These results indicate that
the final products correspond with that of the control series although they use different
pathways and that the methane content of the biogas is improved by decreasing the
volume of carbon dioxide without any loss in the volume of methane during
biomethanation.
2.3.4 Decreasing sludge generation and improving degradation ratio through
pretreatment
As stated previously, sludge generation in the pretreatment series decreased on a VSS
base. With the carbon material balance shown in Fig. 2-3, the particulate organic carbon
(POC) of residue in pretreatment was 0.5 gC/day, which was smaller than that of the
control (1.0 gC/day). Both indicator VSS and POC showed smaller sludge generation

25
from biomethanation in the pretreatment. There are two reasons for decreasing sludge
generation. First, the biomass yield from the ethanol substrate was less than that obtained
from starch. Heijnen et al. indicated that the molecular base biomass yield of ethanol was
0.028 C-mol/(C)-mol of substrate, which was one-sixth of that of glucose (0.176 C-
mol/(C)-mol substrate). They stated that this was caused, because the substrate carbon
number near a biomass cell requires less energy for chemotrophic growth [14]. Second,
the substrate energy available for cell growth is decreased by ethanol fermentation.
Variations in free energy resulting from the presence of methane and carbon dioxide as
final glucose metabolites are calculated in Eqs. (2-1) and (2-2) using Gibbs free energy
of formation [15]:
C6H12O6 → 3CH4 + 3CO2 (2-1)
ΔGf0 = 3 × (− 50.75) + 3 × (− 386.02) − (− 917.2) (2-2)
= − 393.11 kJ mol−1.
In contrast, in case of the generation of ethanol from glucose, the free energy changes
are calculated using Eqs. (2-3) and (2-4):
C6H12O6 → 2C2H5OH + 2CO2 (2-3)
ΔGf0 = 2 × (− 181.75) + 2 × (− 386.02) − (− 917.2)
= − 218.34 kJ mol−1. (2-4)
When biomethanation occurs after ethanol fermentation, it is calculated using Eqs. (2-

26
5) and (2-6):
2C2H5OH → 3CH4 + CO2 (2-5)
ΔGf0 = 3 × (− 50.75) + 1 × (− 386.02) − 2 × (− 181.75)
= − 174.77 kJ mol−1. (2-6)
Using Eqs. (2-4) and (2-6), the variation of free energy that was obtained through
ethanol fermentation is observed to case of ethanol as a substrate, it is − 174.77 kJ mol−1,
which is half of that of a glucose substrate. Thus, the free energy that the bacterial cells
can obtain through biomethanation by conducting ethanol fermentation as a pretreatment
mechanism decreases; therefore, growth becomes difficult.
In addition, from Fig. 2-3, the decomposing ratio on the carbon base in the pretreatment
series was calculated to be 93%, which was higher than 85% that was observed in the
control series. Therefore, it was considered that the lower biomass yields also contribute
to the improved degradation ratio of the substrate.

27
2.4 Summary
Ethanol fermentation as a pretreatment process for biomethanation of food waste was
conducted in this study. A sequential batch biomethanation experiment was performed for
130 days using AFW that was saccharized and ethanol fermented. A stable state was
feasible at least for 56 days of the experiment. Furthermore, the results described an
improvement in the methane content of the biogas, a reduction in sludge generation. The
results of the sequential batch experiment followed stoichiometry, and thermodynamics
indicated that a biomethanation system that includes pretreatment is a theoretically
controllable system. However, it should be considered that solid–liquid separation has to
be performed to keep the biomass in the reactor.

28
Table 2-1 Average substrate, reactor, biogas, and effluent in a stable state.
Description Control Pretreatment
Substrate
Substrate Artificial food waste Ethanol fermented
artificial food
waste
pH 6.5 4.2
Total solid (g/L) 100 –
Volatile solid (g/L) 98 –
Total organic carbon (g/L) 46 43
Total Kjeldahl nitrogen (g/L) 3.2 3.4
Ethanol (g/L) 0 33
Lactic acid (g/L) 0 10
Acetic acid (g/L) 0 2
In the reactors
pH 7.5 (0.02) 7.9 (0.01)
Total solid (g/L) 25.0 (0.85) 25.5 (1.2)
Volatile solid (g/L) 21.3 (0.93) 18.0 (0.71)
VS/TS 0.86 (0.01) 0.71 (0.03)
Total suspended solid (g/L) 18.1 (0.37) 16.4 (0.61)
Volatile suspended solid (g/L) 16.0 (0.36) 13.1 (0.34)
VSS/TSS 0.88 (0.004) 0.80 (0.02)
Total organic carbon (g/L) 12.3 (0.31) 10.7 (0.33)
Dissolved organic carbon (g/L) 1.8 (0.15) 1.6 (0.23)
Dissolved total nitrogen (g/L) 2.1 (0.14) 3.7 (0.28)
Propionic acid (mg/L) ND (0) 33 (65.5)
Acetic acid (mg/L) 12 (16.4) 220 (28.9)
Ethanol ND (0) ND (0)
Biogas
Methane ratio (%) 53.1 (0.59) 67.5 (1.2)
Biogas yield (mL/g VSadded)a 800 680
Methane yield (mL/g VSadded)a 420 460
Effluent
Drawn residue (gVS/day)a 3.3 1.5
(gVSS/day)a1.7 0.3
Sludge yield (gVSS/gVSadded)a
0.082 0.014
The values in the brackets are standard deviations
a The values calculated from mass balance during entire stable state period
29
Fig. 2-1 Experimental apparatus.

30
Fig. 2-2 Variation of biomethanation during the sequential batch experiment.
31
Fig. 2-3 Material balance of carbon in steady-state conditions (unit: g carbon per day).

32
References of chapter 2
1. Wu C, Wang Q, Yu M, et al (2015) Effect of ethanol pre-fermentation and
inoculum-to-substrate ratio on methane yield from food waste and distillers’
grains. Appl Energy 155:846–853.
https://doi.org/10.1016/j.apenergy.2015.04.081
2. Yu M, Wu C, Wang Q, et al (2018) Ethanol prefermentation of food waste in
sequencing batch methane fermentation for improved buffering capacity and
microbial community analysis. Bioresour Technol 248:187–193.
https://doi.org/10.1016/j.biortech.2017.07.013
3. Konishi T, Matsuoka T, Kosaki Y, Ishikawa M (2011) Survey of food waste
from university cafeteria considering biomass recycling and proposition of
components for artificial food waste (in Japanese). Proc Doboku gakkai Kansai
shibu Annu Conf Heisei, 23th VII-16–17
4. APHA (2005) American Public Health Association/American Water Works
Association/Water Environment Federation., 2005. Standard methods for the
examination of water and wastewater 2005, 21st ed. American Public Health
Association, Washington, USA.
5. Kitamura S, Nakaya M (2012) Analyzing method of sugar (in Japanese). Soc
Biosci Bioeng 90:790–793
6. Zamanzadeh M, Hagen LH, Svensson K, et al (2016) Anaerobic digestion of
food waste - Effect of recirculation and temperature on performance and
microbiology. Water Res 96:246–254.
https://doi.org/10.1016/j.watres.2016.03.058

33
7. Sasaki H, Li Y-Y, Seki K, Kamigochi I (1999) Effects of Hydraulic Retention
Time and Loading Rate on High-Solids Thermophilic Methane Fermentation of
the Organic Fraction of Municipal Solid Waste. J. Japan Soc. Water Environ.
22:983–989
8. Qiang H, Lang DL, Li YY (2012) High-solid mesophilic methane fermentation
of food waste with an emphasis on Iron, Cobalt, and Nickel requirements.
Bioresour Technol 103:21–27. https://doi.org/10.1016/j.biortech.2011.09.036
9. Pham TPT, Kaushik R, Parshetti GK, et al (2015) Food waste-to-energy
conversion technologies: Current status and future directions. Waste Manag
38:399–408. https://doi.org/10.1016/j.wasman.2014.12.004
10. Lin J, Zuo J, Gan L, et al (2011) Effects of mixture ratio on anaerobic co-
digestion with fruit and vegetable waste and food waste of China. J Environ Sci
23:1403–1408. https://doi.org/10.1016/S1001-0742(10)60572-4
11. Kim JK, Oh BR, Chun YN, Kim SW (2006) Effects of temperature and hydraulic
retention time on anaerobic digestion of food waste. J Biosci Bioeng 102:328–
332. https://doi.org/10.1263/jbb.102.328
12. Zhang R, El-Mashad HM, Hartman K, et al (2007) Characterization of food
waste as feedstock for anaerobic digestion. Bioresour Technol 98:929–935.
https://doi.org/10.1016/j.biortech.2006.02.039
13. Cho JK, Park SC, Chang HN (1995) Biochemical methane potential and solid
state anaerobic digestion of Korean food wastes. Bioresour Technol 52:245–253.
https://doi.org/10.1016/0960-8524(95)00031-9
14. Heijnen JJ, van Dijken JP (1993) Response to comments on “in search of a
thermodynamic description of biomass yields for the chemotropic growth of

34
microorganisms.” Biotechnol Bioeng 42:1127–1130.
https://doi.org/10.1002/bit.260420916
15. Thauer RK, Jungermann K, Decker K (1977) Energy conservation in
chemotrophic anaerobic bacteria. Bacteriol Rev 41:100–180

35
Chapter 3. Research on the possibility by adoption of ethanol fermentation
pretreatment for methane fermentation of food waste using an anaerobic
membrane bioreactor
3.1. Introduction
In chapter 2, confirmed reduced sludge generation, improved biogas methane
concentration, and long-term operation possibilities in a sequential batch EP experiment
using starch-rich food waste [1]. Because EP improves reaction rates and reduces sludge
generation as compared with conventional processes.
However, anaerobic bacteria grow very slowly. A loss of bacteria also occurs when the
processing load is increased by raising the feed volume, thus limiting the treatment of
higher loads. Treatments utilizing the traditional methodology can only operate on a long
HRT. It is problematic to extend the SRT and simultaneously shorten the HRT. Previous
studies [2, 3] have used the supernatant of centrifuged sludge as treated water and have
returned the sediment to the tank after centrifuging, thus separating and controlling the
HRT and SRT. However, the use of centrifuges is not economical in practical terms.
AnMBRs have recently evinced promise as viable alternatives to conventional anaerobic
digesters for the treatment of organic waste. The membrane separation in AnMBRs
decouples the SRT and HRT, enabling operations at longer SRTs [4–7]. Problems
involving the loss of bacteria can hence be effectively resolved. The membrane can treat
food waste in the anaerobic reactor and can also be used for the treatment of organic
sludge. Cheng et al. (2018) were able to operate the AnMBR system at a higher load by
adding a membrane unit reactor after the continuous stirred tank reactor. However, their
design required two reactors, bioreactor which needs mixing and membrane separation

36
tank which needs membrane washing by biogas circulation. Further, Amha et al. (2019)
employed a flat-sheet membrane and were able to actualize the former project using a
single reactor. Despite improvements, this process required the circulation of biogas to
flush the membrane and must be mandated the use of an impeller to mix the reactor. The
flushing of the hollow fiber membrane only required one biogas spout underneath, while
the flushing of the flat-sheet membranes needed multiple spouts to be positioned beneath
the membrane. Thus, hollow fiber membranes were also found to be suitable for small
reactors. In this chapter, the authors of this paper were able to actualize the
abovementioned project using a single reactor. The proposed method allows the
circulation of biogas to simultaneously flush the hollow fiber membrane and enable the
mixing of the reactor; hence, this design makes system simplify and reduces operational
difficulties.
In addition, very few studies have investigated AnMBR treatment of only FW, and
there is no studies have investigated AnMBR treatment of ethanol fermented FW.
Therefore, in this chapter, examined whether AnMBR can contribute to prevent the runoff
of anaerobic microorganisms, and investigate whether stable continuous operation and
pretreatment effects can be obtained of this method, and by testing different load with the
aim to investigate the degradation characteristics of an ethanol fermented substrate on an
AnMBR system. The results are expected to contribute to the comprehensive
understanding of the reaction rate of FW and the reduction rate of generated sludge, thus
providing a reference for further studies and engineering applications.

37
3.2. Materials and Methods
3.2.1 Substrate (Artificial food waste)
An artificial FW (AFW) was created consisting of boiled rice (300 g), cabbage (90 g),
carrot (90 g), chicken (20 g), and small dried sardines (48 g). The AFW components were
measured on a wet basis and the chicken and dried sardines were weighed after boiling.
Material weight ratios in the AFW were estimated based on a survey conducted in the
Osaka Institute of Technology’s cafeteria [8]. The mixtures were then further
homogenized into a paste using a Grindmix GM 200 grinder (Grindmix, Retsch, Haan,
Germany) without a sterilization process. The total solids (TS) content of the AFW were
adjusted to 100 g/L by adding distilled water purged with nitrogen gas. The average AFW
composition was 98 g / L of volatile solids (VS) and 46 g/L of total organic carbon (TOC).
Additionally, a lack of trace minerals in substrates has been reported to severely limit the
growth and metabolism of hydrogenotrophic and acetoclastic methanogens [9, 10].
Therefore, a solution of trace minerals dissolved in water was added—100 mg of Fe as
FeCl3⋅6H2O, 10 mg of Co as CoCl2, and 10 mg of Ni as NiCl2 (per 1 L of AFW) —
simultaneously [1].
3.2.2 Pretreatment (ethanol fermentation pretreatment)
The TS-adjusted AFW was then saccharized by reacting 7.5 mL of glucoamylase
(Spirizyme Fuel, Novozymes, Denmark) per 1 L of AFW for 2 hours at 50 °C with
constant stirring. The glucose concentration was 80 g/L. Subsequently, the saccharized
AFW was fermented by adding 10 g of commercial yeast (48 Turbo Yeast, Alcotec, UK)
per 1 L of saccharized AFW for 65 hours at 27 °C with stirring. The substrate
characteristics before and after pretreatment are shown in Table 3-1. The fermentation

38
procedure yielded an ethanol concentration of approximately 40 g/L, and the control
substrate was not pretreated. In addition, trace minerals were added to the substrate after
the pretreatment.
3.2.3 Methane fermentation using AnMBR
The AnMBR system used in this study is shown in Fig. 3-1. Because this system was
divided into a control series and an EP series, two identical systems were prepared as
shown in Fig. 3-1. A hollow fiber membrane (LSPMW-02, Sumitomo Electric Industries,
Japan) used in both systems has an average pore diameter of 0.2 μm and an effective
filtration area of 0.1 m2 of polytetrafluoroethylene (PTFE). The membrane module was
immersed in the reaction vessel with an effective volume of 4.5 L and maintained at 37 °C
using a water jacket, and the substrate tank was maintained at 4 °C using a water jacket.
The AFW without pretreatment and the pretreated AFW were stored in the substrate tank
for the control and EP series, respectively. The substrate was supplied from the substrate
tank to the reaction tank using roller pumps, the roller pumps were operated under cycle
of 1 minutes on, 239 minutes off, and treated water was permeated from the membrane
module. The membrane was washed by circulating biogas from the head space to the
bottom of the reactor using a diaphragm gas pump.
The fermentation reactor was purged with O2-free N2 for 15 min before seed sludge
was added. Seed sludge was collected from the mesophilic anaerobic digester at the
sewerage treatment plant and FW digester, and was acclimated with AFW (without
pretreatment) in both series with a 20 d HRT for 3 months before use.
In the AnMBR system, HRT reduced stepwise from 20 to 5 days to increase the load
by raising feeding volume. The corresponding OLR was 6.6 to 26.5 g-COD/L/d.
39
3.2.4. Analysis method
TS, VS, suspended solids (SS), volatile suspended solids, and alkalinity were analyzed
by standard methods [11]. Glucose, ethanol, and volatile fatty acids (VFA) were measured
after filtration with a PTFE filter (DISMIC-25HP, ADVANTEC, Japan). Glucose
concentration was analyzed using the glucose oxidase method (Glucose kit, Glucose
CIItest, Wako, Japan), and total carbon (TC) in the AFW was analyzed using combustion
catalytic oxidation and a non-dispersive infrared (NDIR) method (SSM-5000A,
Shimadzu, Japan). Dissolved organic carbon (DOC) and inorganic carbon from the
permeate were also analyzed using combustion catalytic oxidation and a NDIR method
(TOC-V, Shimadzu, Japan). Ethanol and VFA were quantified using a flame ionization
detector gas chromatography (GC14B, Shimadzu, Japan) using a Gasukuropack-54 60/80
column (GL Sciences, Tokyo, Japan) with helium as the carrier gas (44 mL/min). 1 μm
of sample was injected using airtight syringes and with injector, column, and FID
temperatures of 250 ℃, 200 ℃, and 250 ℃, respectively. Biogas from the AnMBR was
collected with a gas bag and quantified by performing thermal conductivity detector gas
chromatography (GC14B, Shimadzu, Japan) using a ShinCarbon ST 50/80 column
(Shinwa Chemical Industries, Kyoto, Japan) with argon as the carrier gas (50 mL/min).
0.5 mL of biogas was injected into gas chromatograph and with injector, column, and
TCD temperatures of 200 ℃, 40℃ (12 min. hold)–200℃, and 200 ℃, respectively.
Analysis of chemical oxygen demand (COD) used a spectrophotometer (DR900, HACH,
USA) and CODcr reagent (HACH 4236, HACH, USA).
3.2.5. COD balances in the AnMBR
COD mass balance was investigated to understand material balance behavior during

40
methane fermentation. Influent AFW was a fractionate component of COD and outflow
COD was assumed to be distributed as four components: (1) soluble COD derived from
the drawn sludge, (2) permeate COD, (3) solid content COD, and (4) COD transformed
into collected methane gas. Therefore, solid content COD was defined as the value
obtained by subtracting soluble COD from total sludge COD. Additionally, permeate was
defined as soluble COD. COD resulting from biomass growth was calculated from drawn
sludge and COD of methane gas was estimated using conversion of methane to carbon
dioxide by oxidation. The COD equivalent of measured methane gas volumes was
determined as 1mol CH4 = 64 g COD [12].

41
3.3. Results and Discussion
3.3.1 Higher loading operation by pretreatment
The daily change of main measurement items is shown in Fig. 3-2. Table 3-2 shows
the operating index average under each operating condition. In the AnMBR system, HRT
reduced stepwise from 20 to 5 days to increase the load by raising feeding volume. The
corresponding OLR was 6.6 to 26.5 g-COD/L/d. The experimental equipment divided the
control and EP series, and HRT values that can be operated were 20 and 15 days for the
control series and 20, 15, 12.5, 10, 7.5, and 5 days for the EP series. The corresponding
OLR was 6.6, 8.8 g-COD/L/d, and 6.6, 8.8, 10.5, 13.2, 17.7, 26.5 g-COD/L/d.
Table 3-2 indicates that the control series had methane yields corresponding to these
HRT values of 380 and 370 mL-CH4/g-VSadded, respectively. The EP series had
corresponding values of 440, 420, 410, 420, 410, and 390 mL-CH4/g-VSadded,
respectively. However, as shown in Fig. 3-2, when HRT was further reduced to 12.5 days
in the control series, methane gas concentration decreased to 41.7%, the amount of
generated biogas sharply decreased to 0.43 L/L/d, and pH decreased to 5.1. This indicate
that control series failed by irreparable inhibition. The failure of control series was not
only suddenly pH drop but caused by unstable in the reactor during the 12.5-day control
series HRT. Since the alkalinity has decreased from the 60th day, it has earlier than the
pH drop. The system state was seemed to be unstable by weaken the buffering capacity.
On the other hand, the alkalinity of the EP series was maintained at a high concentration.
Although the accumulation of VFA at 5-day EP series HRT, it was considered that the
buffering capacity maintained the stable of the operation.
In the control series, inhibition occurred between 8.8 and 10.5 g-COD/L/d. Cheng et
al. (2018) noted that the OLR was inhibited from 9.72 to 14.58 g-COD/L/d, and the

42
operational load in this study’s control series was similar to that in Cheng et al. Therefore,
the OLR capability in this study was like that of previous research. In the EP series, even
if the HRT was further raised to 5 days, OLR = 26.5-COD/L/d, methane gas concentration
was the same as a lower load, and methane yield was only slightly lower. Additionally,
pH stabilized at around 7.5, enabling operation at three times the load than the control
series. This clarified that methane production in an AnMBR system using ethanol
fermentation for pretreatment was superior to other AnMBR system operation methods.
3.3.2 Upgrading methane production by pretreatment
Fig. 3-2 shows that the biogas production rate under each operating condition tended
to increase in proportion to HRT shortening. HRT values that could be operated
simultaneously on both series were 20 days and 15 days. The control series had a methane
gas concentration of 53–54% and that of the EP series was 69–71%. Previous studies
explained stoichiometry as the reasons for increased methane concentration generating
from ethanol fermentation due to lower carbon dioxide generation from subsequent
methane fermentation [13, 14]. As shown in Table 3-2, comparing the methane gas yield
per 1 g of added VS in the measured values of 20 day and 15 day HRT, the control series
yields were 380 and 370 mL and the EP series yields were 440 and 420 mL, respectively.
Thus, the EP series enables a 15–18% higher methane concentration while keeping the
same methane yield.
3.3.3 Analysis of COD mass balance
COD mass balance was determined to understand material reaction behavior during
methane fermentation. As shown in Table 3-3, COD output was based on soluble COD

43
derived from the drawn sludge, permeate COD, solid content COD, methane COD in
biogas. In pretreatment, COD input is AFW before adding enzyme and yeast in the EP
series. COD mass balances were calculated based on methods from Jeong et al. (2017).
Calculation results show that the errors of inflowing and outflowing material are within
5%, which is clear evidence of the AnMBR system’s stability and the reliability of the
experimental results [15]. After anaerobic digestion, methane gas accounted for the most
recoverable component, with the EP series being slightly higher than the control series
under OLR conditions of 6.6 and 8.8 g-COD/L/d. Even under a 10.5 ~ 26.5 g-COD/L/d
OLR condition, the EP series had a methanation ratio maintained at 80–90%, and an
operation loading three times higher than the control series was possible. Through the
calculation of solid content of drawn sludge rate, at three times the load of the control
series, EP series can still reduce the sludge yield by 27-46%. The above results indicate
that pretreatment maintains satisfactory substrate biodegradability.
3.3.4 Investigation of the cause of high load operation of the EP series
As the results show, methane fermentation in the EP series could be performed series
by avoiding acidification caused by VFA accumulation. In addition, it was confirmed that
the EP series could operate at three times the substrate level of the control series. To
clarify the cause of the higher load operation possible in the EP series, the authors
examined variations of parameters in each feeding period.
In this experiment, the substrate was fed every 240 minutes. Fig. 3-3 and Table 3-4
shows material fluctuation over 240 minutes from one substrate feeding to the next
feeding on experiment day 73 (HRT 12.5 d), with the substrate fed at 0 minutes. The VFA
generation amount is shown in a stacked area chart, with the height of the stacked area

44
representing the sum of VFA concentrations (TVFA). VFA was shown as an acetic acid
conversion value (mg/L) as follows [16].
TVFA = Acetic acid + ( Propionic acid
74.08+
(Isobutyric acid)+(n−butyric acid)
88.11+
Isovaleric acid
102.13) × 60.05 (3-1)
As shown in Fig. 3-3, the maximum amount of TVFA in the control series was 230
mg/L 5 minutes after substrate feeding. After that, it decreased to 37 mg/L at 180 minutes
and then stabilized. In the EP series, the decomposition most part of ethanol was
completed around 50 min after the substrate feeding, this trend was the same as previously
reported [14]. TVFA increased in the meantime, reaching a maximum of 540 mg/L 50
minutes after feeding. Then the TVFA dropped sharply to 11.5 mg/L by 180 minutes.
Although the maximum VFA was higher in the EP series, the time to stabilize was the
same. Therefore, the reaction on easily degradable matter was completed before the next
substrate feeding. In contrast, the biogas production rate in the control series reached a
maximum of 0.72 L/L/hr after 5 minutes, dropped sharply to 0.3 L/L/hr after 20 minutes,
and then decreased slowly. In the EP series, the biogas production rate did not reach the
same level as in the control series, with a 0.4 L/L/hr gas production rate continuing until
60 minutes and then suddenly dropping to 0.25 L/L/hr. After that it decreased slowly until
180 minutes, after which it dropped again to 0.04 L/L/hr. Considering VFA concentration,
the EP series completed degradation of easily degradable substrate after 180 minutes,
which was before the next feeding. In contrast, the gas generation rate in the control series
was 0.18 L/L/hr, which was about four times greater than that of the EP series. This

45
indicates that the easily degradable substrate did not completely degrade. In the control
series, the produced VFA amount was increased over the degradation of VFA due to the
next substrate feeding occurring despite continuing degradation of the substrate.
Therefore, it was thought that VFA accumulation would decrease pH, lead to the failure
of the anaerobic fermentation process.
The ratio of propionic acid to acetic acid is an important indicator used to assess
anaerobic fermentation process stability [17]. In a previous study, this ratio was generally
used to predict digestion system stability and generally ratios ≤ 0.5 resulted in faster
methane production and VFA decomposition than ratios ≥ 1 [13, 18]. In addition, as
shown in Table 3-4, the propionic acid to acetic acid ratio in the control series increased
sharply the feeding, with a peak ratio of 2. However, the ratio of propionic acid to acetic
acid was significantly lower in the EP series. This indicates that ethanol fermentation of
the substrate contributes to stable methane fermentation.
Table 3-5 shows the main reactions of glucose, which is a constitutional unit of starch
in the substrate in both series [19, 20]. In the control series, hydrolyzed saccharides in the
substrate are degraded to acetic acid and propionic acid following eqs. 3-2 and 3-3 under
anaerobic conditions. In the anaerobic reaction, propionic acid is produced in an
endergonic reaction and is thus difficult to progress spontaneously. When hydrogen
produced from the decomposition of glucose as seen in eq 3-2, the reaction of propionic
acid of eq 3-4 is maintained at a very low rate [21]. By comparing the Gibbs free energy
changes for the methane conversion are ΔGo = −31.0KJ/mol for acetic acid and ΔGo = +
68.7KJ/mol for propionic acid, as show in eq 3-4 and 3-6. In the control series, the major
VFA produced by acidogenesis in the reactor was propionic acid. Thus, due to propionic
acid tends to be accumulated in the reactor. Causing the control series failed due to

46
irreparable inhibition. In contrast, the VFA produced from the anaerobic digestion of
ethanol in the EP series was acetic acid, as shown in eq 3-5. When acetic acid and H2 are
formed, the reactions described in eqs 3-6 and 3-7 easier proceed than propionic acid in
control series. This indicates that acetic acid was easily converted to methane than
propionic acid under high load conditions.

47
3.4. Summary
The aim of this chapter was operation in the AnMBR system was attempted by using
EP for AFW rich in starch. Ethanol fermented substrate was fed to the AnMBR several
times per day. The HRT reduced stepwise from 20 to 5 days to increase the load by raising
feeding volume. The OLR was 6.6 to 26.5 g-COD/L/d. The control series (without
pretreatment) was operable to an OLR of up to 8.8 g-COD/L/d, whereas EP series was
26.5 g-COD/L/d. At three times the load of the control series, EP series can still reduce
the sludge yield by 27-46%. By comparing the Gibbs free energy changes for the methane
conversion, EP was demonstrated that effective in avoiding accumulation of propionic
acid. The methane fermentation process generated a large proportion of acetic acid in
VFA generation whereas in the control series it was propionic acid. Therefore,
experiments have proved that using AnMBR treatment of EP is feasible, and EP
significantly improves AnMBR performance. The use of pretreatment in AnMBR shows
that it avoids the serious accumulation of propionic acid and the subsequent decreased
pH, and membrane contribute to prevent the runoff of anaerobic microorganisms. The
author considered that this method has the potential to operate under higher loads.

48
Table 3-1
Characteristics of artificial food waste (AFW) added in the control and ethanol
fermentation pretreatment (EP) series.
Parameters Control Pretreatment
Substrate AFW Ethanol-fermented AFW
pH 6.5 4.2
TS (g/L) 100 -
VS (g/L) 98 -
T-organic carbon (g/L) 46 43
T-kjeldahl nitrogen (g/L) 3.2 3.4
T-phosphorus (g/L) 0.2 0.2
T-CODcr (g/L) 131 135
Ethanol (g/L) 0 40

49
Table 3-2
Main operating conditions and performance of the control and ethanol fermentation pretreatment series.
Series Control Pretreatment
Operation feasibility Enable Enable Failure Enable Enable Enable Enable Enable Enable
Operating conditions
OLR (g-COD/L/d) 6.6 8.8 10.5 6.6 8.8 10.5 13.2 17.7 26.5
HRT (d) 20 15 12.5 20 15 12.5 10 7.5 5
Operating performance
Biogas
Methane ratio (%) 53.1 ± 0.55 53.7 ± 0.15 51.4→41.7 69 ± 0.55 70.2 ± 0.35 69.9 ± 0.3 70.9 ± 1.75 69.3 ± 0 71.4 ± 0.4
Biogas yield (mL/g-VSadded) 720 690 690→60 640 600 580 600 600 544
Methane yield (mL/g-VSadded) 380 370 360→20 440 420 410 420 410 390
In the reactors
pH 7.3 ± 0.02 7.3 ± 0.03 7.4→5.1 7.7 ± 0.01 7.7 ± 0.03 7.7 ± 0.05 7.7 ± 0.04 7.7 ± 0.02 7.5 ± 0.04
TS (g/L) 35.1 ± 0 39.8 ± 1.5 43.1→48 37.8 ± 2.92 38.7 ± 0.53 41.7 ± 1.84 47.7 ± 3.94 55.9 ± 4.03 59.2 ± 2.01
VS (g/L) 30.6 ± 0.01 34.8 ± 1.3 38.3→43.5 32.11 ± 2.2 32.2 ± 0.34 34.4 ± 1.49 39.2 ± 3.37 46.9 ± 3.42 50.8 ± 1.9
TC (g/L) 14.6 ± 0.54 17.4 ± 0.45 19.6→32.4 16.5 ± 0.98 18.3 ± 0.08 17 ± 1.13 27.5 ± 1.63 24.5 ± 1.14 27.3 ± 0.94
Dissolved organic carbon (g/L) 0.3 ± 0.08 0.27 ± 0.01 0.23→0.43 0.36 ± 0.11 0.58 ± 0.04 0.68 ± 0.02 0.79 ± 0.01 0.89 ± 0.03 2.57 ± 0.48
Dissolved inorganic carbon (g/L) 1.33 ± 0.16 1.34 ± 0.04 1.23→0.23 1.82 ± 0.13 1.95 ± 0.15 2.12 ± 0.01 2.15 ± 0.04 1.98 ± 0.1 1.38 ± 0.19
Dissolved total nitrogen (g/L) 1.82 ± 0.32 1.78 ± 0.06 1.5→1.15 2.38 ± 0.1 2.63 ± 0.16 2.67 ± 0.01 2.73 ± 0.06 2.63 ± 0.08 2.73 ± 0.16
T-CODcr (g/L) 48.9 ± 0.57 55.7 ± 1.28 64.9→86.1 50.8 ± 0.25 55.5 ± 0.45 58.2 ± 2.43 61.8 ± 0.9 79.3 ± 4.98 90.6 ± 2.78
D-CODcr (g/L) 1.08 ± 0.09 0.97 ± 0.11 0.72→10.3 1.65 ± 0.19 1.74 ± 0.06 2.18 ± 0.11 2.52 ± 0.08 3.03 ± 0.09 7.99 ± 1.69
Alkalinity (g/L) 6.73 ± 0.07 6.58 ± 0.18 5.55→1.25 9.58 ± 0.08 10.1 ± 0.13 10.3 ± 0.1 10.2 ± 0.08 9.78 ± 0.18 8.14 ± 0.04

50
Table 3-3
Chemical oxygen demand (COD) mass balance of the anaerobic membrane bioreactor system.
Parameters Control Pretreatment
OLR (g-COD/L/d) 6.6 8.8 6.6 8.8 10.5 13.2 17.7 26.5
COD input (%) 100 100 100 100 100 100 100 100
Biogas production (%) 82.9 81.1 93.2 88.4 86.0 89.6 87.3 82.1
Solid content of drawn sludge (%) 14.2 15.0 6.61 11.7 13.3 9.93 7.65 11.0
Dissolved content of drawn sludge (%) 0.34 0.21 0.14 0.19 0.25 0.22 0.21 1.07
Permeate (%) 0.35 0.56 1.08 1.07 1.28 1.43 1.99 2.88

51
Table 3-4
Variations in one cycle of feeding on the 73rd day of the continuous experiment in both series.
In this table, 0 min is the time of substrate feeding, and 240 min is immediately before the next feeding.
a Immediately before feeding
b Immediately after feeding
Retention time 0 min ᵃ 0 min ᵇ 5 min 20 min 50 min 70 min 120 min 180 min 240 min ᵃ
Control
Acetic acid (mg/L) 29 56 77 68 79 78 78 32 33
Propionic acid (mg/L) 0 0 152 112 71 44 7.4 5.1 0
Isovaleric acid (mg/L) 0 0 0 2.6 3.8 3.8 2.9 0 0
Issoquissoic acid (mg/L) 0 0 3.2 4.1 4.6 4.9 2.9 0 0
Propionic acid/Acetic acid 0 0 2 1.6 0.9 0.6 0.1 0.2 0
pH 7.6 7.5 7.2 7.1 7.2 7.2 7.3 7.4 7.6
Pretreatment
Acetic acid (mg/L) 19 23 130 261 468 425 202 11 17
Propionic acid (mg/L) 0 0 29 37 65 36 0 0 0
Isovaleric acid (mg/L) 0 0 0 2.6 4 2.3 0 0 0
n-butyric acid (mg/L) 0 0 6.1 4.4 4.9 2.6 0 0 0
Issoquissoic acid (mg/L) 0 0 0 2.4 2.3 2.9 1.9 0 0
Propionic acid/Acetate acid 0 0 0.2 0.1 0.1 0.1 0 0 0
Ethanol (mg/L) 0 518 514 304 31 0 0 0 0
pH 7.8 7.8 7.9 7.9 8.1 8.1 8.1 8.1 7.8

52
Table 3-5
Different CH4 fermentation pathways and free energy change yielded from different
substrates.
Control
Acidogenesis & Acetogenesis
C6H12O6 + 4H2O → 2CH3COO– + 2HCO3–
+ 4H+ + 4H2 ΔGo = −206.1KJ/mol (3-2)
3C6H12O6 → 4CH3CH2COO– + 2CH3COO–
+ 2HCO3– + 8H+ ΔGo = −940.4KJ/mol (3-3)
CH3CH2COO– + 3H2O → CH3COO– + HCO3–
+ H+ + 3H2 ΔGo = +68.7KJ/mol (3-4)
Pretreatment
Acidogenesis & Acetogenesis
C2H5OH + 2H2O → 2CH3COO– + 2HCO3–
+ 4H+ + 4H2 ΔGo = +9.6KJ/mol (3-5)
Control & Pretreatment
Methanogenesis
CH3COO– + H2O → HCO3– + CH4
ΔGo = −31.0KJ/mol (3-6)
HCO3– + 4H2 + H+ → CH4 + 3H2O
ΔGo = −135.6KJ/mol (3-7)

53
Fig. 3-1. Experimental apparatus.

54
Fig. 3-2. Time course of changes in alkalinity, pH, total volatile fatty acid (TVFA) levels,
biogas production rates, and CH4 content in the anaerobic membrane bioreactor.

55
Fig. 3-3. Variation of the concentrations of ethanol and volatile fatty acids (VFAs) in the
one feeding period at the methane fermentation stage.

56
References of chapter 3
1. Sun J, Kosaki Y, Watanabe N, Ishikawa M (2019) Production of methane-rich
biogas and minimization of sludge by adopting ethanol fermentation for the
pretreatment of biomethanation. J Mater Cycles Waste Manag 21:258–264.
https://doi.org/10.1007/s10163-018-0785-7
2. H. Myanishi, A. Kimura, M. Iwamoto, M. Ishikawa SK (2006) Improving the
Anaerobic Digestion of Garbage by Hydrothermal Treatment (in Japanese). J
Japan Soc Waste Manag Expert 17:23–30
3. H. Myanishi, A. Kimura, S. Kasahara MI (2004) Upgrading of the Anaerobic
Digestion by Addition of Bio Active Reagent(Saponin) (in Japanese). J Japan
Biiological Soc Water Waste 40:37–44
4. Seco A, Mateo O, Zamorano-López N, et al (2018) Exploring the limits of
anaerobic biodegradability of urban wastewater by AnMBR technology. Environ
Sci Water Res Technol 4:1877–1887. https://doi.org/10.1039/c8ew00313k
5. Amha YM, Corbett M, Smith AL (2019) Two-Phase Improves Performance of
Anaerobic Membrane Bioreactor Treatment of Food Waste at High Organic
Loading Rates. Environ Sci Technol 53:9572–9583.
https://doi.org/10.1021/acs.est.9b02639
6. Becker AM, Yu K, Stadler LB, Smith AL (2017) Co-management of domestic
wastewater and food waste: A life cycle comparison of alternative food waste
diversion strategies. Bioresour Technol 223:131–140.
https://doi.org/10.1016/j.biortech.2016.10.031
7. Cheng H, Hiro Y, Hojo T, Li YY (2018) Upgrading methane fermentation of

57
food waste by using a hollow fiber type anaerobic membrane bioreactor.
Bioresour Technol 267:386–394. https://doi.org/10.1016/j.biortech.2018.07.045
8. Konishi T, Matsuoka T, Kosaki Y, Ishikawa M (2011) Survey of food waste
from university cafeteria considering biomass recycling and proposition of
components for artificial food waste (in Japanese). Proc Doboku gakkai Kansai
shibu Annu Conf Heisei, 23th VII-16–17
9. Zhang W, Chen B, Li A, et al (2019) Mechanism of process imbalance of long-
term anaerobic digestion of food waste and role of trace elements in maintaining
anaerobic process stability. Bioresour Technol 275:172–182.
https://doi.org/10.1016/j.biortech.2018.12.052
10. Zhang L, Loh KC (2019) Synergistic effect of activated carbon and encapsulated
trace element additive on methane production from anaerobic digestion of food
wastes – Enhanced operation stability and balanced trace nutrition. Bioresour
Technol 108–115. https://doi.org/10.1016/j.biortech.2019.01.073
11. APHA (2005) American Public Health Association/American Water Works
Association/Water Environment Federation., 2005. Standard methods for the
examination of water and wastewater 2005, 21st ed. American Public Health
Association, Washington, USA.
12. Jeong Y, Hermanowicz SW, Park C (2017) Treatment of food waste recycling
wastewater using anaerobic ceramic membrane bioreactor for biogas production
in mainstream treatment process of domestic wastewater. Water Res 123:86–95.
https://doi.org/10.1016/j.watres.2017.06.049
13. Zhao N, Yu M, Wang Q, et al (2016) Effect of Ethanol and Lactic Acid Pre-
fermentation on Putrefactive Bacteria Suppression, Hydrolysis, and

58
Methanogenesis of Food Waste. Energy and Fuels 30:2982–2989.
https://doi.org/10.1021/acs.energyfuels.5b02779
14. Tanaka K, Kosaki Y, Munetaka I (2015) Study on improvement of methane
fermentation using saccharification and ethanol fermentation as pretreatment (in
Japanese). Annu Conf Japan Soc Mater Cycles Waste Manag 26th B7-7
15. Meng Y, Luan F, Yuan H, et al (2017) Enhancing anaerobic digestion
performance of crude lipid in food waste by enzymatic pretreatment. Bioresour
Technol 224:48–55. https://doi.org/10.1016/j.biortech.2016.10.052
16. Kosaki Y, Ishikawa M (2015) Study on methane fermentation using biological
ethanol fermentation as pretreatment (in Japanese). Doboku Gakkai Ronbunshuu
G 71 (7):III–47–III–55
17. Wang LH, Wang Q, Cai W, Sun X (2012) Influence of mixing proportion on the
solid-state anaerobic co-digestion of distiller’s grains and food waste. Biosyst
Eng 112:130–137. https://doi.org/10.1016/j.biosystemseng.2012.03.006
18. Wagner AO, Reitschuler C, Illmer P (2014) Effect of different acetate:
Propionate ratios on the methanogenic community during thermophilic anaerobic
digestion in batch experiments. Biochem Eng J 90:154–161.
https://doi.org/10.1016/j.bej.2014.05.014
19. Wu C, Wang Q, Yu M, et al (2015) Effect of ethanol pre-fermentation and
inoculum-to-substrate ratio on methane yield from food waste and distillers’
grains. Appl Energy 155:846–853.
https://doi.org/10.1016/j.apenergy.2015.04.081
20. Thauer RK, Jungermann K, Decker K (1977) Energy conservation in
chemotrophic anaerobic bacteria. Bacteriol Rev 41:100–180

59
21. Xu R, Xu S, Florentino AP, et al (2019) Enhancing blackwater methane
production by enriching hydrogenotrophic methanogens through hydrogen
supplementation. Bioresour Technol 278:481–485.
https://doi.org/10.1016/j.biortech.2019.01.014

60
Chapter 4. Higher load operation by adoption of ethanol fermentation
pretreatment for methane fermentation of food waste using an anaerobic
membrane bioreactor: Performance and microbial community
4.1. Introduction
The disposal of food waste (FW) has become a social problem in recent years. However,
owing to its high moisture content, and rich organic matter content, FW is considered as
a potentially valuable material [1]. Consequently, food recycling methods have gained
more attention and many recycling projects are based on anaerobic digestion (AD). AD
mainly involves four stages: hydrolysis, acidogenesis, acetogenesis and methanogenesis
[2]. Many FW pretreatment methods have been explored in order to improve digestion
performance, and to make these four stages go smoothly. Many pretreatment methods
including chemical [2, 3], thermal [4, 5], and biological disintegration [6, 7], as well as
combinations of these have been applied for improving methane production and increase
processing load of AD.
However, some characteristics of FW are the most problematic features in the process
of AD, resulting volatile fatty acid (VFA) inhibition, affecting the stability and
sustainability of AD [8]. Among of VFA, the propionate is not easily converted to acetate,
which leads to the accumulation in the methanogenesis stage [9]. At high VFA
concentrations, causes a decrease in pH, and causing the acid–base imbalance of
intracellular environment, inactivating the cells, reducing the degradation rate of organic
acids and H2/CO2 and eventually leading to the failure of anaerobic fermentation [1, 10].
Of these pretreatment methods, ethanol fermentation pretreatment (EP) has been
demonstrated to be effective in avoiding VFA accumulation which can cause a subsequent

61
decrease of pH, affecting reactor performance [11]. In addition, EP could improve the
methanogenic carbon conversion rate and speed of substrates [12, 13].
However, the excessively slow growth rate of anaerobic microorganisms utilized in
this process when compared with that of conventional fermenters is a drawback in
keeping sufficient biomass in the rector to maintain efficient operation [14]. Anaerobic
membrane bioreactors (AnMBR) effectively prevent the washout of these slow growing
methanogens, enabling operation at longer solid retention times (SRT) than hydraulic
retention times (HRT).
Up to date, very few studies have investigated AnMBR treatment of ethanol fermented
FW [11], and no research has evaluated microbial community dynamics within AnMBR
treatment of ethanol fermented FW. In particular, there is no report indicating how high
the load in AnMBR can be operated by using ethanol fermented FW. Therefore, in this
work we aimed to systematically compare control series (substrate: FW) and an EP series
(substrate: ethanol fermented FW) performance of both substrate using AnMBRs. In the
present study, a laboratory-scale mesophilic semi-continuous AD reactor, bacterial
communities present in the stable AD reactor were analysed by Illumina MiSeq high-
throughput sequencing. Both series were operated at incremental OLRs up to 43.5 g COD
L/day to compare performance and operating limits. This study examined whether EP of
FW can allow for more effective high load operation in an AnMBR, examining whether
pretreatment effects can be obtained in a stable state and determining the effect of EP on
the maximal organic loading rate (OLR), providing a reference for further studies and
potential engineering applications.

62
4.2. Materials and methods
4.2.1. Substrate (Artificial food waste)
Artificial FW (AFW) was created using boiled rice (300 g), cabbage (90 g), carrots (90
g), chicken (20 g), and small dried sardines (20 g). The specific production process of
AFW was according to the methods described by Sun et al. (2020a). As shown in Table
4-1, the total solids (TS) content of AFW was 200 g/L. The average AFW composition
was 190 ± 4.9 g/L of volatile solids (VS) and 91.3 ± 2.6 g/L of total organic carbon (TOC).
Trace minerals dissolved in water was added—100 mg of Fe as FeCl3⋅6H2O, 10 mg of
Co as CoCl2, and 10 mg of Ni as NiCl2 (per 100 g-TS of AFW)—simultaneously [14]. In
addition, when the total solids (TS) content of the AFW were needs adjusted to 150 g/L,
which adding distilled water purged with nitrogen gas.
4.2.2. Pretreatment (ethanol fermentation pretreatment)
AFW with a total solids (TS) content of 200 g/L was used for pretreatment. The TS-
adjusted AFW was then saccharized by reacting 5 mL of glucoamylase (Spirizyme Fuel,
Novozymes, Denmark) per 100g-TS of AFW for 2 h at 50 °C with constant stirring. The
saccharized AFW was fermented by adding 1.9 g of commercial yeast (Maurivin POP
Yeast, AB MAURI, UK) per 100g-TS of saccharized AFW for 44 h at 27 °C with stirring.
The substrate characteristics before and after pretreatment are shown in Table 4-1. The
fermentation procedure yielded an ethanol concentration of approximately 85.4 ± 2.26
g/L, and the control substrate was not pretreated. In addition, trace minerals were added
to the substrate after the pretreatment same as 4.2.1.

63
4.2.3. Methane fermentation using AnMBR
The AnMBR system was divided into a control series and an EP series, two identical
systems were prepared as shown in Fig. 4-1. A hollow fiber membrane (LSPMW-02,
Sumitomo Electric Industries, Japan) used in both systems has an average pore diameter.
The membrane module was immersed in the reaction vessel with an effective volume of
4.5 L, and the temperature was maintained at 37 °C using a water jacket. In addition, the
substrate tank was maintained at 4 °C using a water jacket. The AFW without and with
pretreatment were stored in the substrate tanks for the control and EP series, respectively.
The substrate was supplied from the substrate tank to the reaction tank using roller pumps,
which were operated under a cycle of 1 min on and 359 min off on OLR load from 6.5 to
9.6 g-COD/L/day; 1 min on and 239 min off from 13.0 to 43.5 g-COD/L/day. The treated
water was permeated from the membrane module to the treated permeate tank using a
roller pump. Before substrate was supplied, most of the biodegradation had been
completed [15]. Thus, the roller pump was intermittent relaxation operated for 60 min
before the substrate was supplied, intermittent relaxation operation can reduce the fouling
rate of the module [16]. The membrane was washed by circulating biogas from the head
space to the bottom of the reactor using a diaphragm gas pump.
The seed sludge was collected from the mesophilic anaerobic digester at the sewage
treatment plant and FW digester and was acclimated with AFW (without pretreatment) in
other reactor (volume of 10 L) using an OLR of 1.1 g-COD/L/day at 6 months before
added in AnMBR. The AnMBR was purged with O2-free N2 for 15 min before seed sludge
was added. In the AnMBR system, the OLR load was increased stepwise to 6.5 g-
COD/L/day for 1 months; it was confirmed that the gas generation amount and pH were
in a steady state, and they were used for the formal experiment.

64
In the formal experiment, the AnMBR system was operated from 6.5 to 43.5 g-
COD/L/day by increasing the feeding load.
4.2.4. Analysis biogas production rate
The use of the diaphragm gas pump in this study caused the pressure of biogas to
fluctuate, raising the potential of error in the gas meter. Therefore, a retractable rubber
gasbag (113401, DEBIKA, Japan) was installed before the biogas entered the gas meter
so that generated biogas passed through the gas meter at a constant speed. Biogas
production was measured using a wet tipping gas meter (µFlow, Bioprocess control,
Sweden). The operating of these gas meters is based on the “tipping bucket” principle in
which liquid is displaced by gas in a specially-designed chamber [17]. This gas meter
allowed the measurement of each tipping of the container. The measurement of signal
from the gas meter was processed by the data logger and sent to the computer for
calculation. Biogas production rate was calculated by dividing the volume of biogas by
the time elapsed since the previous tipping.
4.2.5. Analysis method
TS, VS, suspended solids (SSs), volatile SSs, and alkalinity were analyzed using
standard methods (American Public Health Association, 2005). Glucose, ethanol, and
volatile fatty acids (VFAs) were measured after filtration with a PTFE filter (DISMIC-
25HP, ADVANTEC, Japan). The glucose concentration was analyzed using the glucose
oxidase method (Glucose kit, Glucose CIItest, Wako, Japan), and total carbon (TC) in the
AFW was analyzed using combustion catalytic oxidation and a non-dispersive infrared
(NDIR) method (SSM-5000A, Shimadzu, Japan). Dissolved organic carbon (DOC) and

65
inorganic carbon from the permeate were also analyzed using combustion catalytic
oxidation and a NDIR method (TOC-V, Shimadzu, Japan). Ethanol and VFA levels were
quantified by flame ionization detection-gas chromatography (GC14B, Shimadzu, Japan)
using a Gasukuropack-54 60/80 column (GL Sciences, Tokyo, Japan) with helium as the
carrier gas (44 mL/min). In total, 1 μL of sample was injected using airtight syringes, and
the injector, column, and FID temperatures were 250 °C, 200 °C, and 250 °C, respectively.
Biogas from the AnMBR was collected using a gas bag and quantified by thermal
conductivity detection-gas chromatography (GC14B, Shimadzu, Japan) using a
ShinCarbon ST 50/80 column (Shinwa Chemical Industries, Kyoto, Japan) with argon as
the carrier gas (50 mL/min). In total, 500 μL of biogas was injected into the gas
chromatograph, with injector, column, and TCD temperatures were 200 °C, 40 °C–200 °C,
and 200 °C, respectively. Analysis of chemical oxygen demand (COD) used a
spectrophotometer (DR900, HACH, USA) and CODcr reagent (HACH 4236, HACH,
USA).
4.2.6. Metagenomic analysis
DNA extraction from samples, stored at 4℃, was conducted by DNA extraction kit
(Nippon Gene, ISOIL for Beads Beating). DNA concentration was measured with DNA
analyzing kit (life technologies Qubit ds DNA BR Assasy kit) and analyzer (life
technologies, Qubit2.0 fluorometer). 16S rRNA gene sequencing analysis was conducted
by MiSeq system (Illumina). The primer sets were selected 16S Amplicon PCR forward
primer/reverse primer : 5’- CCTACGGGNGGCWGCAG -3’ / 5’-
GACTACHVGGGTATCTAATCC -3’ to amplify V3-V4 region. Library denaturing was
carried out using MiSeq Reagent kit v2500 cycle (Illumina).

66
Quality of reads were confirmed by FastQC to judge their use, or not. Sequence
analysis was conducted using the Quantitative Insight Into Microbial Ecology (Qiime2
ver. 2020.2) [18]. Reads were joined and primers were trimmed. Low quality reads which
were under 80% base pairs of Q < 20 on quality value were detected and removed by
FastX tool kit. Chimeric reads were detected and removed using usearch61. They were
clustered at 97% read identity by de novo otu picking method. Representative reads in
OTUs were selected by PyNAST and assigned to taxonomy using Qiime2’s uclust-based
taxonomy assigner referring GreenGenes (ver. 13_8) database. Read numbers were
counted in each OTU and totalized on each taxonomy.

67
4.3. Results and discussion
4.3.1 Higher loading operation by pretreatment
The daily changes in the main measurement items are shown in Fig. 4-2. Table 4-2
presents the average operating index under each operating condition. In the AnMBRs
systems, the OLR values that could be operated were 6.5 to 13.0 g- COD/L/d for the
control series and 6.5 to 43.5 g- COD/L/d for the EP series. At OLR 6.5 g- COD/L/d, the
VFA of the EP system increased. This may be due to the EP series has not adapted to the
high TS of the FW temporarily, which caused the decomposition of VFA to weaken. As a
countermeasure, on the 55th day, the TS of the FW before ethanol fermentation has been
reduced from 20% to 15% and maintained OLR remains unchanged. In addition, at the
OLR43.5 of the EP series, the TS of the substrate before ethanol fermentation has been
increased to 20%. Although the TS the substrate has increased, AnMBR can still maintain
a high decomposition rate and operate stably. Previous studies explained stoichiometry as
the reason for the increased methane concentration generated from ethanol fermentation,
because of the lower carbon dioxide generation from subsequent methane fermentation
[14].The control series had a methane gas concentration of 52–57%, whereas that of the
EP series was 71–74% under operable load.
Methane production rate (primary y-axis) and methane yield (secondary y-axis) are
shown in Fig. 3. When the OLR was 6.5, 7.8, 9.8, and 13.0 g-COD/L/d, the control and
EP series both had methane yields that stabilized at approximately 0.3 L/g-COD (Fig. 4-
3). However, when the OLR was further increased to 19.6 g- COD/L/d in the control
series, the amount of generated biogas sharply decreased to 0 COD/L/d, VFA
correspondingly increased to 7.7 g L−1 and was accompanied by a significant pH and
alkalinity drop (to pH 4.2, alkalinity 0 mg/L). The methane gas concentration also

68
decreased to 47.5% accompanied by a sharp decrease in the amount of generated methane,
indicating severe inhibition of the anaerobic fermentation process. Low pH (< 6.2) and
high VFA concentrations (> 5.8 g/L) have been shown to completely inhibit methanogens
(Cheng et al. 2018; Amha et al., 2019). In contrast, for the EP series, when the OLR was
further raised to as high as 43.5 g- COD/L/d, methane yield remained the same as that
seen at lower loads.
In the control series, inhibition occurred between 13.0 and 19.6 g- COD/L/d. Many
researchers indicated that the OLR was inhibiting from 10 to 15 g- COD/L/d in an
AnMBR system [5, 7]; the operational load of the control series in this study was similar
to that used by Amha et al. (2019), and therefore the results observed correlate well with
previous research on maximum OLR. In the EP series, the pH stabilized at around 7.7,
enabling operation at 3 times the load than that seen for the control series. These results
demonstrate that methane production in an AnMBR system using ethanol fermentation as
a pretreatment strategy produces superior performance to that seen with a conventional
AnMBR system.
At the highest load of the EP system, the author discovered that the sludge would
expand by about 10% due to the substantial increase in biogas production after the
substrate was feeds. If the load is increased more, the sludge will be sucked into the biogas
pump and clogged due to the limited head space. Therefore, it can be considered that the
maximum operable load in the EP series was 43.5 g-COD/L/d. If it is operated at a higher
load, the author recommends increasing the head space or shortening the interval between
feedings to stabilize biogas production.

69
4.3.2 Effect of EP on biogas production rate kinetics
Since this experiment was semi-continuous experiment, the substrate was fed every
240 min at the beginning of OLR 13.0. Fig. 4-4 shows biogas generation rate over 240
min from first substrate feeding to the next feeding on different loads, with the substrate
fed at 0 min. Fig. 4-4A shows the biogas production rate of the control series under the
highest stable operating load. In a previous study knows that, three steps can be
distinguished in these curves: step 1 a rapid increasing and then decreasing phase of
biogas production (CH4 formation by hydrogenotrophic methanogens); step 2 constant
high biogas production (CH4 formation by acetotrophic methanogens) and step 3 constant
low biogas production and there are transition stage between the last two steps [17].
Transition moved backward as the load increased. But under operable loads, the transition
will remain stable. Fig. 4-4B, C and D shows the AD of acidosis at OLR19.6. The second
step was gradually longer, until the transition disappears, which is consistent with the
results of previous studies. [15, 17]. From day 155, daily biogas production decreased due
to severe acetotrophic methanogens inhibition of step 2 leading to a drop in pH. Finally,
all these conditions resulted in a total inhibition of all methanogens.
Previous research on EP series show that methane produced from hydrogen generated
by the decomposition of ethanol in the first step; the second step was mainly acetic acid
to methane production [11]. In EP series, it was interesting that this transition was
relatively late compared to the control system. If refer to the experience of the control
series would suggest that a relatively late transition of the EP series might increase the
inhibition risk of methanogenesis. However, although the transition in the EP series was
after 180 minutes, the position of the transition does not change much even when the load
increases to OLR 43.5. It can be considered that whenever the load increases, the EP

70
series can adapt and decompose the increased substrate, thereby maintaining a constant
biodegradability. In addition, when the two series were at the same load of OLR 13.0, the
gas production rate of the EP series in the third step was lower than that of the control
series. This shows that before the next feeding, the EP system has less undecomposed
substrates than the control system, thus avoiding excessive substrate accumulation.
In the EP series, as the load increases, it can be clearly observed that the advantages of
the first step gradually appear. In Fig. 4-4H, it can be observed that the duration of the
first step was significantly longer than Fig. 4-4A. This may be due to the gradual increase
of hydrogen bacteria to become the dominant species, which improves the utilization
efficiency of hydrogen and enables high-load operation. However, the analysis of the
kinetics of the biogas production rate alone is not enough to explain what changes have
taken place in the microbial community for the decomposition and pretreatment of FW.
Therefore, it is necessary to analyze the microbial community.
4.3.3 Microbial community
4.3.3.1 Bacterial taxonomic identification
The results of the bacterial community structure (Fig. 4-5) showed that the Clostridium
genus was the most abundant bacterium in both AnMBRs. The genus Clostridium belongs
to the Firmicutes phylum and includes a number of species that are known to degrade
complex biopolymers such as cellulose [8]. In this work, the EP series substrate contains
ethanol. Ethanol is a common intermediate produced by hydrolytic and fermentative
bacteria during methanogenesis [19], and so it can be easily used by bacteria. There are
some species of the Clostridium are uses the ethanol which converted into VFAs and H2
[20, 21]. Clostridium are also the main bacteria for the hydrolysis of lipids, similar

71
function of these bacteria were also reported in previous studies [22, 23]. In the control
and the EP series, its proportion in the genus classification did not change much, but
significant changes occurred in the unclassified species classification. Although they
belong to the same genus, the decomposition of starch and ethanol may not be the same
species. Paludibacter belongs to Bacteroidales utilize various sugars and produce acetate
and propionate as major fermentation end-products with succinate as a minor product
[24]. In the previous anaerobic fermentation research using food waste as the substrate,
the abundant genus Paludibacter, showed a significantly negative correlation with HRT,
suggesting Paludibacter to be robust at high OLR and low HRT. [25]. This was consistent
with the obvious increase when Paludibacter was at the highest load in the EP series.
Candidatus Cloacamonas was a genus of bacteria in the family Cloacamonaceae, which
the bacterial genus can produce acetate, hydrogen, and carbon dioxide from various
organic materials such as amino acids, lactate, succinate, and propionate previously found
to be hydrogen-producing, and the reaction is thermodynamically favorable under low
hydrogen pressure [26].
In a previous study, the major bacterial genera were also similar among the AnMBRs
with changes in OLR (i.e., 1.5–6 kg VS/m3/d), because the anaerobic
hydrolytic/acidogenic bacteria have strong resistance to process disturbance [27]. In this
study, the control series was operated with a higher load 9.8 g-COD/L/d (7.5 kg VS/m3
/d) beyond the range, so it can be considered that the reason for the significant change in
the bacterial community compared with the low-load (OLR<1 kg VS/m3/d) seed sludge.
Another reason might be that the control series into AnMBR, which was caused by
relatively low HRT and high SRT.
In addition, it is interesting that this study found that the bacterial communities of the

72
control series (OLR 9.8) and the EP series (OLR 19.6) are also very similar in the two
AnMBR systems with different substrates. It has been reported that ethanol had little
effect on bacterial microflora, but changed the microflora structure of archaea
significantly, changing the gas-producing pathway from acetoclastic to hydrogenotrophic
[28]. The author found that the proportion of some bacteria in the EP series operating
under the highest load (OLR 43.5) has changed. This may be due to the adaptation to the
high-load substrate feeding and the formation of a new syntrophy with bacteria and
archaea.
4.3.3.2 Archaeal taxonomic identification
Fig. 4-6 shows the methanogenic microbial composition at the genus level. There were
two main of archaea in seed sludge: obligate aceticlastic methanogens of Methanosaeta
accounted for 62.2% and hydrogenotrophic methanogenesis of Methanolinea accounted
for 29.3%. With the increase of the load, the microflora structure of archaea of the EP
series has undergone a fundamental change, and the hydrogenotrophic
(Methanomassiliicoccus, Methanobacterium, and Methanoculleus) increased from 36.4%
(OLR 19.6) to 84.7% (OLR 43.5). However, we found that the proportion of
hydrogenotrophic was only 38% in the control series under the OLR 9.8. EP caused an
increase in hydrogenotrophic methanogenesis, which increased the rate of conversion of
hydrogen to methane. Further caused a reduction in the hydrogen partial pressure, thereby
promoting the conversion of ethanol, propionate, and butyrate to acetate, consistent with
the results of previous studies [13, 29]. This showed that the AnMBR was adapted to the
matrix containing ethanol as the substrate by changing the methane production pathway,
which well explained the reason why the high biodegradation rate can be maintained

73
under high load.
In the EP series (OLR 43.5), the total proportion of obligate hydrogenotrophic
methanogens (Methanomassiliicoccus, Methanobacterium, and Methanoculleus) was
identified as the dominant methanogen. Many researchers indicated obligate aceticlastic
methanogens were more sensitive to ammonium inhibition compared with
hydrogenotrophic methanogens [28, 30]. It is interesting that as the one and the only
important facultative aceticlastic methanogen, Methanosarcina is the most metabolically
and physiologically versatile methanogen that can convert different substrates, such as
acetate, H2, and methyl containing groups to CH4 [31]. In other words, Methanosarcina
are both acetoclastic and hydrogenotrophic methanogens. Recent studies have confirmed
the diversification of the metabolic pathways of Methanosarcina through the analysis of
key enzymes in the anaerobic fermentation facilities of municipal sewage treatment plants
[32]. Many researchers indicated that Methanosarcina also robust to ammonia inhibition
[31, 33]. This may be because Methanosarcina are not obligate aceticlastic methanogens.
Therefore, the inhibition of ammonium may weaken the VFAs decomposition ability of
others aceticlastic methanogen and cause the accumulation. In the EP system, the decrease
of obligate aceticlastic methanogens (Methanosaeta) and the increase of
hydrogenotrophic methanogens will avoid the above risks. On the other hand, ammonium
is the main component of alkalinity in AD, and the produced ammonium further improved
the AD system buffer capacity [34]. Table 4-3 shows that the control series had a NH4-N
concentration of below 2000mg/L and that of the EP series was 2900–3900 mg/L.
Therefore, EP could enable the AnMBR reactor to biologically decompose FW with a
higher relative nitrogen concentration and ensure the stable production of methane.
On the other hand, when the load of the EP system was from OLR 19.6 to 43.5, the

74
proportion of Methanosarcina decreased from 40.8% to 15.2%, and the proportion of
Methanomassiliicoccus increased from 16.8% to 65.4%. Therefore, it can be inferred that
although Methanosarcina can convert part of the hydrogen and methyl compounds (i.e.,
methanol, dimethylamine, and monomethylamine) to produce methane, as the load
increases, the proportion of Methanomassiliicoccus increases significantly and replaces
the Methanosarcina. It is interesting that when methanogenic bacteria use hydrogen and
methyl compounds to produce methane, the appropriate reduction of Methanosarcina in
AnMBR may be beneficial in mode of energy conservation in methanogenic archaea. A
common method to compare methanogenic archaea with respect to the efficiency of their
energy conserving systems is the determination of growth yields. The growth yield is
defined as the amount of dry cell mass (g) which is obtained per mole of methane that is
formed and is referred to as YCH4 [35]. Table 4-3 shows the different species display
remarkable differences in specific growth yields (YCH4), i.e., the amount of biomass
formed per mole of methane produced at a given growth condition [36]. In previous
studies, the growth yield was determined for Methanomassiliicoccus on methanol + H2
and trimethylamine + H2 which resembled the growth yield of hydrogenotrophic
methanogens with 2.4 g of cell dry mass being formed per mole methane, respectively
[35]. When Methanosarcina depredated hydrogen and methanol to produce methane, the
amount of cells produced is two to three times that of acetic acid. However, when
Methanomassiliicoccus replaces Methanosarcina to decompose hydrogen and methanol,
the efficiency of methane production of AnMBR is significantly improved and the
increase of sludge can be reduced. However, in this study the ratio of acetic acid,
hydrogen, and methanol to methane produced by Methanosarcina is still an unknown
question. In future research, new methods (such as key enzyme analysis) are needed to

75
determine the specific methane production pathway of Methanosarcina.
4.3.3.3 The main metabolic pathways of the microbial communities
In anaerobic processes, syntrophic bacteria play an important role for reducing
metabolic intermediates which can inhibit methanogenic activity or supplying substrate
on methanogens [29]. In particular, for anaerobic processes treating high-strength organic
such as food wastes, syntrophic relationship among the functional microbial communities
is closely related to stable process performances [27]. In order to summarize the main
metabolic pathways of ethanol pretreated food waste degradation and methanogenesis for
high load in the AnMBR, which combined the results of this experiment and previous
research to draw Fig. 4-7. The lipids were degraded by bacteria (the genus Clostridium).
The starch in carbohydrates has been converted into ethanol by ethanol fermented process,
and the remaining cellulose is converted into monosaccharides by bacteria (the genus
Clostridium and Caldicobacter), and then into VFAs. On the other hand, most of ethanol
was converted to acetic acid, which reduced the accumulation of VFAs such as propionic
acid [13]. The major bacteria for protein decomposition were genus Candidatus
Cloacamonas, etc. The increase of the genus Candidatus Cloacamonas produced a large
amount of methyl compounds and ammonium, and the produced ammonium further
improved the AnMBR buffer capacity [34]. The methyl compounds, hydrogen and carbon
dioxide produced in it could supply hydrogenotrophic methanogens to generate biogas.
On the highest load of EP, hydrogenotrophic methanogens and obligate aceticlastic
methanogens (Methanosaricina) were identified as the dominant methanogens, and all of
them which with a high tolerance of ammonium inhibition.
Another the decrease of Methanosarcina and the increase of Methanomassiliicoccus

76
may be caused by changes in their respective co-nutritive bacteria. While
Methanomassiliicoccus increased greatly, it was found that the family Cloacamonaceae
multiply at the same time. It can be speculated that it may form a co-nutritive relationship
with Methanomassiliicoccus. Cloacamonaceae produces a large amount of methyl
intermediates and hydrogen in the process of protein conversion, which provides energy
for Methanomassiliicoccus. This reaction is thermodynamically favourable only when the
large amount of Methanomassiliicoccus reduces the partial pressure of hydrogen, which
in turn makes Cloacamonaceae work more smoothly. A virtuous cycle was formed
between bacteria and archaea in the stable and high-rate AnMBR. Therefore, using EP for
FW is a promising alternative to improve AD stability, gas production, methane
concentration and operating load.

77
4.4. Summary
A higher operating load was at tempted using EP for AFW in an AnMBR system by
using a sequential batch experiment, where ethanol fermented substrate was fed to the
AnMBR. The control series (without ethanol fermentation) was operable to an OLR of
13.0 g COD/L/d, while the EP series was operable to an OLR of 43.5 g COD/L/d, 3 times
higher than the capability of the control series. In high load operation, EP also proved
effective in maintaining a stable methane yield and stable long term operation of the
reactor; together, this demonstrates that EP of AFW significantly improves anaerobic
digestion performance. The abundance of varieties of hydrogenotrophic methanogens rate
in the AnMBR were determined to be enhanced using EP for FW through high-throughput
sequencing analysis. The large amount of hydrogenotrophic methanogens reduces the
partial pressure of hydrogen, thereby promoting the biodegradation of the substrate by
bacteria. The hydrogenotrophic methanogens with a high tolerance of ammonium
inhibition, and higher ammonium then improves the AD buffer capacity. Therefore, a
virtuous cycle was formed in the EP series as an additive that was also responsible for the
stable and high operational loading by adoption of ethanol fermentation pretreatment.

78
Table 4-1
Characteristics of artificial food waste (AFW) added in the control and ethanol fermentation
pretreatment (EP) series. When the total solids (TS) content of AFW was 200 g/L.
Parameters Control Pretreatment
Substrate AFW Ethanol fermented AFW
TS (g/L) 200 -
VS (g/L) 190 ± 4.9 -
pH 4.9 ± 0.2 4.2 ± 0.2
T-organic carbon (g/L) 91.3 ± 2.58 69.7 ± 2.25
T-kjeldahl nitrogen (g/L) 4.3 ± 0.09 5.0 ± 0.01
T-phosphorus (g/L) 0.40 ± 0.002 0.46 ± 0.008
T-CODcr (g/L) 266 ± 14.8 261 ± 5.3
Ethanol (g/L) 0 85.4 ± 2.26

79
Table 4-2
Main operation conditions and performance of control and EP series.
Series Control EP (Ethanol fermentation pretreatment)
Operation feasibility Enable Enable Enable Enable Failure Enable Enable Enable Enable Enable Enable Enable
Operating condition
Operating days (d) 0→70 71→98 99→126 127→146 147→162 0→70 71→98 99→116 117→126 126→148 148→175 176→210
OLR (g-COD/L/d) 6.5 7.8 9.8 13.0 19.6 6.5 7.8 9.8 13.0 13.0→32.6 32.6 43.5
HRT (d) 30.0 25.0 20.0 15.0 10.0 30.0 25.0 20.0 15.0 15→6 6.0 6.0
SRT (d) 95 105 57 40 35 315 315 210 180 39 25
Biogas
Methane ratio (%) 57.3 54.9 54.6 51.8 49.4→47.5 73.9 73.9 72.7 71.3 70.9 70.3
Methane yield (L/g COD) 0.31 0.31 0.29 0.30 0.18 0.33 0.33 0.32 0.31 0.31 0.31
In the reactors
pH 7.4 7.4 7.3 7.3 7.2→4.2 7.8 7.8 7.8 7.8 7.7 7.8
TS (g/L) 58.4 61.4 69.2 64.7 71.1→83.6 43.9 51 59 68.2 75.7 76.3
VTS (g/L) 51.7 55.5 56.5 59.6 65.8→78.9 35.4 45.6 51.8 56.4 64.5 67.5
TC (g/L) 33.9 30.2 34.5 31.6 35.7→44.6 25.3 26.2 30.3 35.8 38.8 39.8
DOC (g/L) 0.68 0.94 0.56 0.39 0.33→5.65 2.08 1.32 1.34 1.33 1.11 2.07
DIC (g/L) 1.81 1.57 1.95 1.51 0.91→0.05 2.94 3.26 3.95 2.61 2.39 2.93
T-CODcr (g/L) 80.7 86 91.1 90.7 90.0→135 66.8 58.9 77.9 93.2 105 111
D-CODcr (g/L) 2.1 2.6 2.1 1.3 1.0→26 7.4 3.9 4.7 4.6 4.1 6.7
TVFA (mg/L) 48 2200 42 13 13→7700 4400 480 190 150 230 433
Alkalinity (g/L) 7.5 7.8 6.8 5.6 5.5→1.6 10.1 11.2 12.6 12.2 9.7 12
NH4-N (mg/L) 2150 1750 1980 1716 950→638 3550 3900 3550 3250 2900 3750
Main operation conditions and performance of control and pretreament series.

80
Table 4-3
Growth yields of methanogenic archaea growing.
Organism Substrate YCH4
(g cells/mol CH4) Reference
H2 + CO2 6.4 [37]
Methanosarcina barkeri Methanol 7.2
Acetate 2.1 [38] H2 + CO2 8.7
[39] Methanosarcina sp. strain 227 Methanol 6.0
Acetate 2.7
Methanomassiliicoccus luminyensis Methanol + H2 2.4
[35] Trimethylamine + H2 2.4
Methanobacterium bryantii H2 + CO2 2.5 [40]
Methanobacterium marburgensis H2 + CO2 3.0 [41]

81
Fig. 4-1. Experimental apparatus, a submerged hollow fiber type AnMBRs. The left side
is the control series, the right side is the EP series.

82
Fig. 4-2. Time course of changes in alkalinity, pH, total volatile fatty acid (TVFA)
levels, biogas production rates, and CH4 content in the anaerobic membrane bioreactor.
4
5
6
7
8
pH
0
10
20
30
40
50
OLR
(g
-CO
D/L
/d) OLR
TS of FW
0
100
200
300
400
500
TS of FW
(g/L)
0
5000
10000
15000
Alk
alin
ity
(g/L
)
0
20
40
60
80
Bio
gas
com
po
siti
on
(%)
CH4 CO2CH4 CO2
0
5
10
15
20
25
Bio
gas
pro
du
ctio
n
rate
(L/
L/d
)Control series EP series
0
1500
3000
4500
6000
0 20 40 60 80 100 120 140 160 180 200
VF
A C
on
cen
tra
tio
n
(g/L
)
Time (days)
0 20 40 60 80 100 120 140 160 180 200
Time (days)
Acetate acid Isovaleric acid
Isobutyric acid Butyric acid
Propionic acid valeric acid

83
Fig. 4-3. Methane production rate (primary y-axis) and methane yield (secondary y-axis).
Pattern fill shows control series and solid fill signifies EP series. The error bars indicate
in methane production rate for each OLR are the standard deviations.
0.0
0.1
0.2
0.3
0.4
0.5
0.6
0
2
4
6
8
10
12
14
16
6.5 7.8 9.8 13.0 19.6 32.6 43.5
Meth
an
e yield
(L g
-CO
D-
1)
Met
ha
ne
pro
du
ctio
n r
ate
( L
L-
1d-
1)
OLR (g-COD L-1 d-1)
Control: Methane production rate
EP: Methane production rate
Control: Methane yield
EP: Methane yield

84
Fig. 4-4. Biogas production rate kinetics acquired at different OLR of the digester
operation in experiments.
(d)
0
1
2
3
4
5
0 60 120 180 240Bio
gas
pro
duct
ion r
ate
(L h
r−1)
Time (min)
Control series OLR19.6, day 159
No Transition
0
1
2
3
4
5
0 60 120 180 240Bio
gas
pro
duct
ion r
ate
(L h
r−1)
Time (min)
Control series OLR13.0, day 144
Tra
nsi
tio
n
0
1
2
3
4
5
0 60 120 180 240Bio
gas
pro
duct
ion r
ate
(L h
r−1)
Time (min)
Control series OLR19.6, day 155
(b)
Tra
nsi
tio
0
1
2
3
4
5
0 60 120 180 240Bio
gas
pro
duct
ion r
ate
(L h
r−1)
Time (min)
Control series OLR19.6, day 157
Tra
nsi
tio
0
1
2
3
4
5
0 60 120 180 240Bio
gas
pro
duct
ion r
ate
(L h
r−1)
Time (min)
EP series OLR13.0, day 121
Tra
nsi
tio
n
0
1
2
3
4
5
0 60 120 180 240Bio
gas
pro
duct
ion r
ate
(L h
r−1)
Time (min)
EP series OLR19.6, day 140
Tra
nsi
tio
n
0
1
2
3
4
5
0 60 120 180 240Bio
gas
pro
duct
ion r
ate
(L h
r−1)
Time (min)
EP series OLR33.0, day 171
Tra
nsi
tio
n
0
1
2
3
4
5
0 60 120 180 240Bio
gas
pro
duct
ion r
ate
(L h
r−1)
Time (min)
EP series OLR43.5, day 201
Tra
nsi
tio
n
Feed subtrate Feed subtrate Feed subtrate Feed subtrate
(e)
(f)
(g)
(h)
(c)
(a)Step
1
Step 2
Step 3
Step
3
Step 1
Step 2
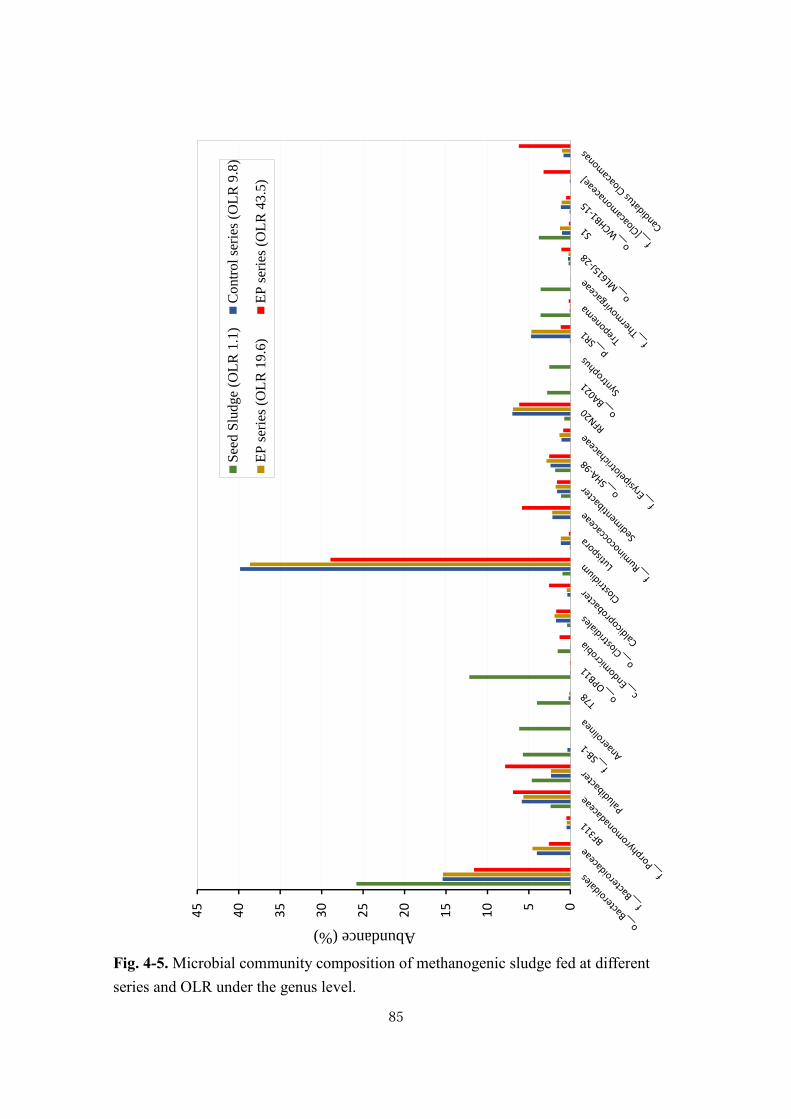
85
Fig. 4-5. Microbial community composition of methanogenic sludge fed at different
series and OLR under the genus level.
05
10
15
20
25
30
35
40
45
Abundance (%)
See
d S
lud
ge
(OL
R 1
.1)
Co
ntr
ol
seri
es (
OL
R 9
.8)
EP
ser
ies
(OL
R 1
9.6
)E
P s
erie
s (O
LR
43
.5)
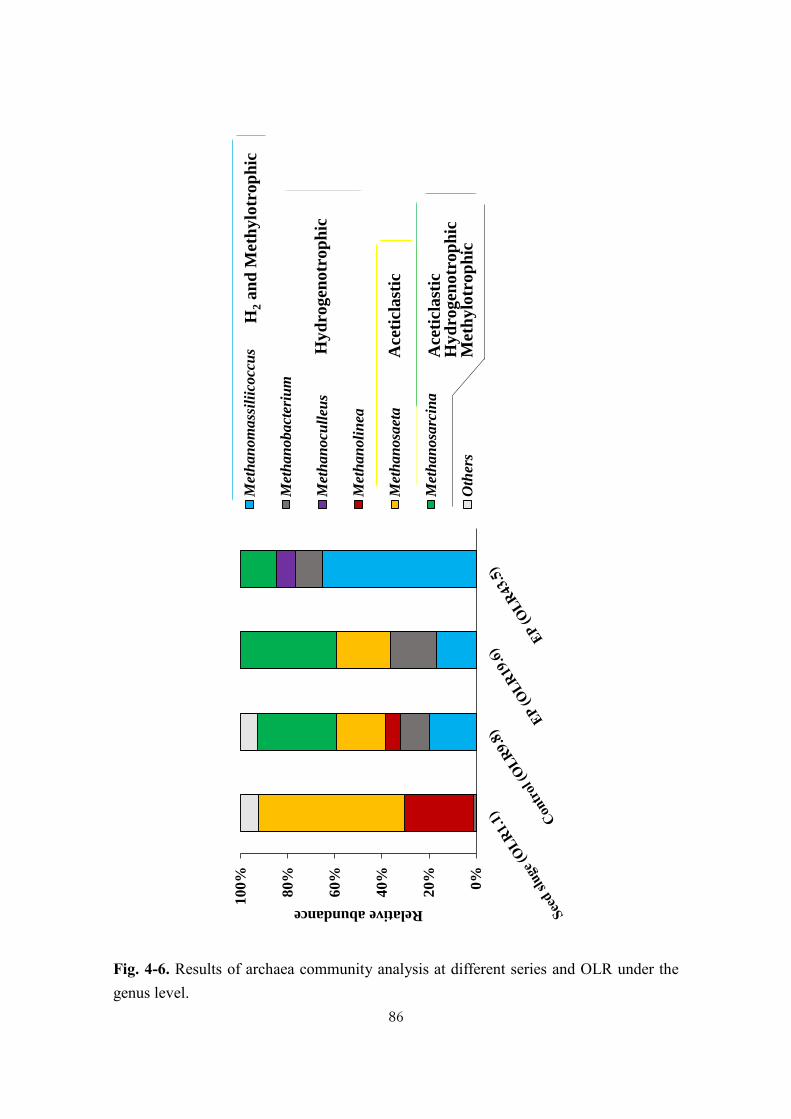
86
Fig. 4-6. Results of archaea community analysis at different series and OLR under the
genus level.
0%
20%
40%
60%
80%
100
%
Relative abundance
Met
ha
nom
ass
ilii
cocc
us
Met
ha
nob
act
eriu
m
Met
ha
nocu
lleu
s
Met
han
oli
nea
Met
ha
nosa
eta
Met
ha
nosa
rcin
a
Oth
ers
Ace
ticla
stic
Hy
dro
gen
otr
op
hic
H2
an
d M
eth
ylo
trop
hic
Ace
ticla
stic
Hy
dro
gen
otr
op
hic
Meth
ylo
trop
hic

87
Fig. 4-7. In order to summarize the main metabolic pathways of ethanol pretreated food
waste degradation and methanogenesis for high load (OLR 43.5) in the AnMBR, which
combined the results of this experiment and previous research.
Car
bo
hyd
rate
sC
ellu
lose
, et
c.
Sac
char
ides
Pre
tein
Am
ino
aci
dP
rop
ion
ate;
Bu
tyra
te, et
c.
NH
4+-N
Eth
ano
l
H2
H2
CO
2C
H4
CO
2
Ace
tate
Met
han
ol
Bact
eria
l gro
up
①C
lost
rid
ium
(28
.9%
)
②P
alu
dib
acte
r (7
.9%
)
③C
andid
atus
Clo
acam
onas
(6.2
%)
④C
ald
ico
pro
bac
ter
(2.6
%)
⑤S
edim
enti
bac
ter
(1.6
%)
Arc
hea
l g
rou
p⑥
Met
han
om
assi
liic
occ
us
(65
.4%
)
⑦M
eth
ano
sarc
ina
(15
.2%
)
⑧M
eth
ano
bac
teri
um
(11
.1%
)
⑨M
ethan
ocu
lleu
s (8
.2)
⑦
⑧
Met
hly
amin
es ⑦⑨
①
⑤
②
③④
An
MB
R
⑦⑥
CO
2
③
②
①S
tarc
h
FW
Eth
ano
l
Lip
ids
Hig
her
fat
ty a
cid
①
④
③

88
References of Chapter 4
1. Ma X, Yu M, Yang M, et al (2020) Effect of liquid digestate recirculation on the
ethanol-type two-phase semi-continuous anaerobic digestion system of food
waste. Bioresour Technol 123534. https://doi.org/10.1016/j.biortech.2020.123534
2. Yin C, Shen Y, Yu Y, et al (2019) Bioresource Technology In-situ biogas
upgrading by a stepwise addition of ash additives : Methanogen adaption and CO
2 sequestration. Bioresour Technol 282:1–8.
https://doi.org/10.1016/j.biortech.2019.02.110
3. Saha S, Jeon BH, Kurade MB, et al (2018) Optimization of dilute acetic acid
pretreatment of mixed fruit waste for increased methane production. J Clean Prod
190:411–421. https://doi.org/10.1016/j.jclepro.2018.04.193
4. Arelli V, Begum S, Anupoju GR, et al (2018) Dry anaerobic co-digestion of food
waste and cattle manure: Impact of total solids, substrate ratio and thermal pre
treatment on methane yield and quality of biomanure. Bioresour Technol
253:273–280. https://doi.org/10.1016/j.biortech.2018.01.050
5. Cheng H, Hiro Y, Hojo T, Li YY (2018) Upgrading methane fermentation of
food waste by using a hollow fiber type anaerobic membrane bioreactor.
Bioresour Technol 267:386–394. https://doi.org/10.1016/j.biortech.2018.07.045
6. Ma C, Liu J, Ye M, et al (2018) Towards utmost bioenergy conversion efficiency
of food waste: Pretreatment, co-digestion, and reactor type. Renew Sustain
Energy Rev 90:700–709. https://doi.org/10.1016/j.rser.2018.03.110
7. Amha YM, Corbett M, Smith AL (2019) Two-Phase Improves Performance of
Anaerobic Membrane Bioreactor Treatment of Food Waste at High Organic

89
Loading Rates. Environ Sci Technol 53:9572–9583.
https://doi.org/10.1021/acs.est.9b02639
8. Xing BS, Han Y, Wang XC, et al (2020) Acclimatization of anaerobic sludge
with cow manure and realization of high-rate food waste digestion for biogas
production. Bioresour Technol 315:123830.
https://doi.org/10.1016/j.biortech.2020.123830
9. Zou H, Gao M, Wang Q, et al (2019) Bioresource Technology Metabolic analysis
of e ffi cient methane production from food waste with ethanol pre-fermentation
using carbon isotope labeling. Bioresour Technol 291:121849.
https://doi.org/10.1016/j.biortech.2019.121849
10. Zhang W, Chen B, Li A, et al (2019) Mechanism of process imbalance of long-
term anaerobic digestion of food waste and role of trace elements in maintaining
anaerobic process stability. Bioresour Technol 275:172–182.
https://doi.org/10.1016/j.biortech.2018.12.052
11. Sun J, Kosaki Y, Watanabe N (2020) Higher load operation by adoption of
ethanol fermentation pretreatment on methane fermentation of food waste.
Bioresour Technol 297:122475. https://doi.org/10.1016/j.biortech.2019.122475
12. Zhao Z, Wang J, Li Y, et al (2020) Why do DIETers like drinking : Metagenomic
analysis for methane and energy metabolism during anaerobic digestion with
ethanol. Water Res 171:115425. https://doi.org/10.1016/j.watres.2019.115425
13. Zou H, Gao M, Yu M, et al (2019) Methane production from food waste via
mesophilic anaerobic digestion with ethanol pre-fermentation : Methanogenic
pathway and microbial community analyses Department of Environmental
Engineering , School of Energy and Environmental Beijing Key Laboratory.

90
Bioresour Technol 122450. https://doi.org/10.1016/j.biortech.2019.122450
14. Sun J, Kosaki Y, Watanabe N, Ishikawa M (2019) Production of methane-rich
biogas and minimization of sludge by adopting ethanol fermentation for the
pretreatment of biomethanation. J Mater Cycles Waste Manag 21:258–264.
https://doi.org/10.1007/s10163-018-0785-7
15. Sun J, Kosaki Y, Watanabe N (2020) MethodsX An anaerobic membrane
bioreactor using a hollow fiber membrane and biogas agitation. MethodsX 7:.
https://doi.org/10.1016/j.mex.2020.101018
16. Cheng H, Li Y, Kato H, Li Y (2020) Enhancement of sustainable flux by
optimizing fi ltration mode of a high-solid anaerobic membrane bioreactor during
long-term continuous treatment of food waste. Water Res 168:115195.
https://doi.org/10.1016/j.watres.2019.115195
17. Awhangbo L, Bendoula R, Roger JM, Béline F (2020) Detection of early
imbalances in semi-continuous anaerobic co-digestion process based on
instantaneous biogas production rate. Water Res 115444.
https://doi.org/10.1016/j.watres.2019.115444
18. Hall M, Beiko RG (2018) 16S rRNA Gene Analysis with QIIME2. Methods Mol
Biol 1849:113–129. https://doi.org/10.1007/978-1-4939-8728-3_8
19. Tholozan JL, Touzel JP, Samain E, et al (1992) Clostridium neopropionicum sp.
nov., a strict anaerobic bacterium fermenting ethanol to propionate through
acrylate pathway. Arch Microbiol 157:249–257.
https://doi.org/10.1007/BF00245158
20. Konstanz U (1985) Comparison of Ethanol Degradation Pathways in Anoxic
Freshwater. 651–660

91
21. Liberato V, Benevenuti C, Coelho F, et al (2019) Chemicals Production in a
Biorefinery Context. Catalysts 1–37
22. Ning Z, Zhang H, Li W, et al (2018) Anaerobic digestion of lipid-rich swine
slaughterhouse waste: Methane production performance, long-chain fatty acids
profile and predominant microorganisms. Bioresour Technol 269:426–433.
https://doi.org/10.1016/j.biortech.2018.08.001
23. Lei Z, Zhi L, Jiang H, et al (2019) Characterization of microbial evolution in
high-solids methanogenic co-digestion of canned coffee processing wastewater
and waste activated sludge by an anaerobic membrane bioreactor. J Clean Prod
232:1442–1451. https://doi.org/10.1016/j.jclepro.2019.06.045
24. Ueki A, Akasaka H, Suzuki D, Ueki K (2006) a novel strictly anaerobic , Gram-
negative , propionate-producing bacterium isolated from plant residue in irrigated
rice-field soil in Japan. 39–44. https://doi.org/10.1099/ijs.0.63896-0
25. Li Q, Yuwen C, Cheng X, et al (2018) Bioresource Technology Responses of
microbial capacity and community on the performance of mesophilic co-
digestion of food waste and waste activated sludge in a high- frequency feeding
CSTR. Bioresour Technol 260:85–94.
https://doi.org/10.1016/j.biortech.2018.03.087
26. Pelletier E, Kreimeyer A, Bocs S, et al (2008) “Candidatus Cloacamonas
acidaminovorans”: Genome sequence reconstruction provides a first glimpse of a
new bacterial division. J Bacteriol 190:2572–2579.
https://doi.org/10.1128/JB.01248-07
27. Seo H, Cho K, Shin J, et al (2019) Bioresource Technology Linking process
performances and core microbial community structures in anaerobic membrane

92
bioreactor with rotatory disk ( ARMBR ) system fed with high-strength food
waste recycling wastewater. Bioresour Technol 291:121918.
https://doi.org/10.1016/j.biortech.2019.121918
28. Yang X, Liang Q, Chen Y, Wang B (2019) Alteration of Methanogenic Archaeon
by Ethanol Contribute to the Enhancement of Biogenic Methane Production of
Lignite. 10:1–13. https://doi.org/10.3389/fmicb.2019.02323
29. Wang P, Wang H, Qiu Y, et al (2018) Microbial characteristics in anaerobic
digestion process of food waste for methane production–A review. Bioresour
Technol 248:29–36. https://doi.org/10.1016/j.biortech.2017.06.152
30. Tian H, Fotidis IA, Kissas K, Angelidaki I (2017) Effect of different ammonia
sources on aceticlastic and hydrogenotrophic methanogens. Bioresour Technol.
https://doi.org/10.1016/j.biortech.2017.11.081
31. Xie Z, Wang Z, Wang Q, et al (2014) Bioresource Technology An anaerobic
dynamic membrane bioreactor (AnDMBR) for landfill leachate treatment :
Performance and microbial community identification. Bioresour Technol
161:29–39. https://doi.org/10.1016/j.biortech.2014.03.014
32. Nobu MK, Tang Y (2020) Novel Syntrophic Isovalerate-Degrading Bacteria and
Their Energetic Cooperation with Methanogens in Methanogenic Chemostats.
https://doi.org/10.1021/acs.est.0c01840
33. Yang Z, Wang W, Liu C, et al (2019) Mitigation of ammonia inhibition through
bioaugmentation with different microorganisms during anaerobic digestion :
Selection of strains and reactor performance evaluation. Water Res 155:214–224.
https://doi.org/10.1016/j.watres.2019.02.048
34. Xing BS, Han Y, Wang XC, et al (2020) Cow manure as additive to a DMBR for

93
stable and high-rate digestion of food waste: Performance and microbial
community. Water Res 168:115099.
https://doi.org/10.1016/j.watres.2019.115099
35. Kröninger L, Gottschling J, Deppenmeier U (2017) Growth Characteristics of
Methanomassiliicoccus luminyensis and Expression of Methyltransferase
Encoding Genes. 2017:
36. Poorter LMI De, Geerts WJ, Keltjens JT (2007) Coupling of
Methanothermobacter thermautotrophicus Methane Formation and Growth in
Fed-Batch and Continuous Cultures under Different H2 Gassing Regimens.
73:740–749. https://doi.org/10.1128/AEM.01885-06
37. Weimer PJ, Zeikus JG (1978) One carbon metabolism in methanogenic bacteria.
Arch Microbiol 119:49–57. https://doi.org/10.1007/bf00407927
38. Smith MR, Mah RA (1980) Acetate as sole carbon and energy source for growth
of Methanosarcina strain 227. Appl Environ Microbiol 39:993–999.
https://doi.org/10.1128/aem.39.5.993-999.1980
39. Smith MR, Mah RA (1978) Growth and Methanogenesis by Methanosarcina
Strain 227 on Acetate and Methanol. 870–879
40. Roberton AM, Wolfe RS (1970) Adenosine triphosphate pools in
Methanobacterium. J Bacteriol 102:43–51. https://doi.org/10.1128/jb.102.1.43-
51.1970
41. Kaster A, Moll J, Parey K, Thauer RK (2011) Coupling of ferredoxin and
heterodisul fi de reduction via electron bifurcation in hydrogenotrophic
methanogenic archaea. 108:2981–2986. https://doi.org/10.1073/pnas.1016761108

94
Chapter 5. Conclusions and recommendations
In this study, the effectiveness of the ethanol fermentation pretreatment for methanae
fermentation was examined. Through previous research and investigation, mastered the
basic characteristics of pretreatment of food waste, and gradually improved the
experimental methods in this study to achieve the best anaerobic fermentation process of
food waste.
In Chapter 2, Ethanol fermentation as a pretreatment process for biomethanation of
food waste was conducted. A sequential batch biomethanation experiment was performed
for 130 days using AFW that was saccharized and ethanol fermented. A stable state was
feasible at least for 56 days of the experiment.
Furthermore, the results described an improvement in the methane content of the
biogas, a reduction in sludge generation. The results of the sequential batch experiment
followed stoichiometry, and thermodynamics indicated that a biomethanation system that
includes pretreatment is a theoretically controllable system. However, due to the slow
growth of anaerobic bacteria, it should be considered that solid–liquid separation has to
be performed to keep the biomass in the reactor.
In Chapter 3, combining the conclusions and shortcomings of Chapter 2, a new
experimental method is tried. The aim of this chapter was operation in the AnMBR system
was attempted by using EP for AFW rich in starch.
Ethanol fermented substrate was fed to the AnMBR several times per day. The HRT
reduced stepwise from 20 to 5 days to increase the load by raising feeding volume. The

95
OLR was 6.6 to 26.5 g-COD/L/d. The control series (without pretreatment) was operable
to an OLR of up to 8.8 g-COD/L/d, whereas EP series was 26.5 g-COD/L/d. At three
times the load of the control series, EP series can still reduce the sludge yield by 27-46%.
By comparing the Gibbs free energy changes for the methane conversion, EP was
demonstrated that effective in avoiding accumulation of propionic acid. The methane
fermentation process generated a large proportion of acetic acid in VFA generation
whereas in the control series it was propionic acid. Therefore, experiments have proved
that using AnMBR treatment of EP is feasible, and EP significantly improves AnMBR
performance. The use of pretreatment in AnMBR shows that it avoids the serious
accumulation of propionic acid and the subsequent decreased pH, and membrane
contribute to prevent the runoff of anaerobic microorganisms. The author considered that
this method has the potential to operate under higher loads.
In Chapter 4, a higher operating load was at tempted using EP for AFW in an AnMBR
system by using a sequential batch experiment, where ethanol fermented substrate was
fed to the AnMBR. In the experiments in this chapter, food waste with a moisture content
similar to that of actual food waste is used.
The control series (without ethanol fermentation) was operable to an OLR of 13.0 g
COD/L/d, while the EP series was operable to an OLR of 43.5 g COD/L/d, 3 times higher
than the capability of the control series. In high load operation, EP also proved effective
in maintaining a stable methane yield and stable long term operation of the reactor;
together, this demonstrates that EP of AFW significantly improves anaerobic digestion
performance.
The abundance of varieties of hydrogenotrophic methanogens rate in the AnMBR were

96
determined to be enhanced using EP for FW through high-throughput sequencing analysis.
The large amount of hydrogenotrophic methanogens reduces the partial pressure of
hydrogen, thereby promoting the biodegradation of the substrate by bacteria. The
hydrogenotrophic methanogens with a high tolerance of ammonium inhibition, and
higher ammonium then improves the AD buffer capacity. Therefore, a virtuous cycle was
formed in the EP series as an additive that was also responsible for the stable and high
operational loading by adoption of ethanol fermentation pretreatment.
The purpose of this study was to explore the potential by adoption of ethanol
fermentation pretreatment for methane fermentation of food waste, to obtain "stable
high load operation", "high methane concentration", and "high decomposition rate", and
to clarify the principle. The results of this study can realize the miniaturization of
fermentation reactor. As a kind of practical application proposal, the use of biological
anaerobic membrane in this study has achieved the expected goal, providing a reference
for further research and engineering applications. Therefore, in order to confirm whether
the results of this research can be used in methane fermentation facilities in the future. It
will be necessary to verify this with a continuous reactor. However, existing modules are
prone to blockage and relatively expensive, which may affect large-scale practical
applications. Further work is necessary to improve anaerobic membrane washing and
management methods to extend its service life. And explore other methods to maintain
the concentration of anaerobic bacteria in the AD reactor.

97
Acknowledgement
Time flies just like flash. Eleven years have passed since I entered Osaka Institute of
Technology in 2010, and then went to study for a doctorate three years ago. I would like
to write some words of gratitude as the end of my student days.
First of all, I would like to deeply thank my supervisor Prof. Yasunori Kosaki. In the
first place, his positive replies to my request in 2018, giving me the chance to join again
in his highly professional and academic team. He continuous help and valuable
suggestions for me, whether in study and life. During my writing process, he guided me
patiently not only on selecting of the thesis title and collecting the original data but also
research methods and analyzing the thesis data, which makes me benefit a lot. Without
he guidance over the selection of my thesis' subject, invaluable suggestions on my thesis'
framework and precious instructions, it's impossible for me to complete my thesis. In the
5 years of master and doctor course, I have learned much from Prof. Munetaka Ishikawa.
His careful and clear guidance has inspired me and helped me a lot to finish the thesis. I
believed that his invaluable advice, kindness and strictness will have a strong influence
me both on how to teaching and behave myself in society. I gratefully acknowledge Prof.
Nobuhisa Watanabe for your guidance on my research and employment.
Also, I would like to express my sincere gratitude to all the professors who have taught
me in this university that greatly broadened my horizon and enriched my knowledge in
my study. Their inspirational and conscientious teaching have provided me with a firm
basis for the composing of this paper and will always be of great value to my future
academic research. I want to express my heartfelt thanks to all the teachers who have
helped and taught me in this university. Thanks to the staff in the office of the school,

98
because their efficient work has provided great help to my study and life. Thanks to the
graduates of the research laboratory in these years, they have completed the experiment
excellently and provided excellent data during the graduation research period.
Many thanks and appreciation to all my parents and all the members in my family, who
helped, supported and motivated me a lot, helping me achieve this work and reach this
degree. Special thanks to my wife Xiaomin Guo for supporting and understanding me in
completing my current studies. Due to the new coronavirus epidemic this year, many tasks
cannot be carried out smoothly, and people cannot talk frequently. However, I believe that
we will surely get through the difficulties. Finally, I wish everyone good health and
success in our work.