study on rfid data based freight transportation planning · link volume was simulated manually...
TRANSCRIPT

Study on RFID Data based Freight Transportation Planning
ALEXANDRE ROJAS, UNIVERSIDADE FEDERAL DO RIO DE JANEIRO-UFRJ, [email protected] CEZAR M. RIBEIRO, UNIVERSIDADE FEDERAL DO RIO DE JANEIRO-UFRJ L,
This is an abridged version of the paper presented at the conference. The full version is being submitted elsewhere.Details on the full paper can be obtained from the author.

Study on RFID data based Freight Transportation Planning ROJAS, A., RIBEIRO,P.C.
13th WCTR, July 15-18, 2013 Rio de Janeiro, Brazil
1 05/04/2013
Study on RFID Data based Freight Transportation Planning
Alexandre Rojas,
Universidade Federal do Rio de Janeiro-UFRJ [email protected] Paulo Cezar M. Ribeiro
Universidade Federal do Rio de Janeiro-UFRJ l [email protected]
ABSTRACT
Recently, transportation planning using periodic pattern mining from time series data has
been extensively studied. Usual studies on periodic patterns mining mainly consider
discovering full periodic patterns from an entire time series from cordon line survey. However
mining results of Freight Movement needs more input information i.e type of commodity,
transportation mode and the adopted route. Consequently, we propose an integration of
three nationwide systems. The proposed model supports the understanding of movement
patterns that were extracted from RFID Radio Frequency Identification data collected on
vehicle trajectory.
Keywords: Freight Transportation Planning, Intelligent Transportation System-ITS, RFID
INTRODUCTION
Brasil’s highway system is critical to meeting the mobility and economic needs of local
communities, regions and the nation.
Last year’s freight traffic has been growing at a rate faster than passenger traffic on the
nation's highway network. As a result, freight bottlenecks have begun to develop at various
network points. Regardless the model, transportation studies require collecting a great deal
of traffic demand data and a number of impacting factors. A base-year Origin-Destination
(OD) matrix for highway freight flows plays an essential role in transportation planning
activities. However, due to Freight Analysis Zone (FAZ) of a large area, usually having a city
or region size, the field of OD traditional survey technique is expensive, time consuming, and
cannot provide up-to-date dynamic demand input required by ITS (Intelligent Transportation
System).
Deployment of RFID Radio Frequency Technologies to identify vehicles and cargo offer more
reliable and less costly methods to measure the frequent pattern of freight movement.
Integrating data collection of three nationwide Brazilian projects based on RFID technology
offers potential benefits in many fields including data survey for transportation planning,
safety and law enforcement, revenue collection and logistic operations.
OBJETIVE
This research proposes a nationwide RFID data collection systems integration model to
provide a strategic framework aiming to improve and expand the knowledge base for making

Study on RFID data based Freight Transportation Planning ROJAS, A., RIBEIRO,P.C.
13th WCTR, July 15-18, 2013 Rio de Janeiro, Brazil
2 05/04/2013
improved inroads in freight forecasting and planning and to accelerate innovative
breakthroughs.
The following definitions are used to represent the main concepts:
Knowledge
Relates to a general understanding of freight transportation issues and the extensive array of
elements involved in planning and forecasting freight demand;
Models
Are the tools used to plan and forecast freight transport–related activities at various
geographic levels; and
Data
Are the underlying information resources for modeling and planning efforts; these data often
represent an important modeling limitation .
RELATED WORKS
Significant researches have been devoted to OD estimation over past 30 years. The earliest
one related to estimating dynamic OD matrices is by Cremer and Keller (1981) which
identified dynamic origin-destination in intersections. Bell (Bell, 1983) introduced additional
travel time dispersion parameters to relax the constant travel time assumption and proposed
a constrained weighted least square formulation to estimate dynamic OD flows. Willumsen
(1984) used traffic counts to estimate time dependent OD. Cascetta et al. (1993) proposed a
generalized least square (GLS) estimator in a general network. Dixon and Rilett (2005)
proposed the use of information from automatic vehicle identification (AVI) systems to help
estimate short-term origin-destination matrices in an urban environment. Zhou and
Mahmassani (2006) proposed a dynamic origin-destination estimation method to extract
valuable point-to-point split fraction information from AVI system. Jim Sham, and Li Xu-hong
(2008) proposed a method based on the fuzzy programming theory outlined to estimate the
regional single-mode highway freight origin-destination matrix. Guozhen, Lindong & Yaodong
(2011) proposed the OADVL model using Automatic Vehicle Location AVL data and abandon
historic data that ensures all used data are real-time and avoids the uncertainty of historic
data. The importance of data analysis over Frequent Trajectories for Moving Objects has
been widely recognized (Huiping , Nikos , & Cheung, 2007), (Lee, Han, Li, & Cheng, 2011),
(Gidofalvi & Pedersen, T. B, 2009)
METHODOLOGY
This paper is based on a Brazil nationwide integration systems survey on collecting
disaggregates data aimed to identify Dynamic Freight OD and assignment.
The source data includes information from:

Study on RFID data based Freight Transportation Planning ROJAS, A., RIBEIRO,P.C.
13th WCTR, July 15-18, 2013 Rio de Janeiro, Brazil
3 05/04/2013
Brazil’s Nationwide Automatic Vehicle Identification system from SINIAV (Sistema
Nacional de Identificação Automatica de Veiculos) based on RFID system
(CONTRAN, 2006);
Brasil-ID: an RFID Nationwide system that identifies a cargo and integrates all freight
information; (Brasil-ID, 2009)
CT-e (Conhecimento Eletronico do Transporte): a nationwide system that describes a
cargo, its origin, destination and other related information. (CONFAZ, 2007)
The proposed model considers two different solution classes both based on vehicle and
freight transponder tag data, as shown below:
* OLAP
Data w
arehouse
SINIAV
Data Processing
Brasil-ID
CT-e
* OLAP- On Line Analytical Processing
Micro
Regions
Roads/
Checkpoints
Transportation PlanningTransportation Planning
Model adoptedModel adopted
Emerging
properties
Emerging
properties
ReportsReports
Figure 1 – proposed model
The OLAP process aims to determine a Freight OD and static assignment. The developed
software considers antenna location in ramps using statistics traditional formulas. The
selected road and antenna location can be positioned using the Google Maps technology.
The second process, Emerging properties of Freight Movement, aims to determine a
Dynamic OD and assignment using Data Mining to generate a KDD – Knowledge-Discovery
in Databases of Freight Movement.
To simulate microscopic and continuous road traffic, SUMO – Simulation of Urban Mobility
(2011) was used. SUMO is a package designed to handle large road networks data and to
analyze the traffic simulated data, using WEKA (2013) Data Mining Software in the Java
package.
Finally, to test the proposed model, we simulated traffic flow and applied the K-nearest
neighbor’s algorithm to compare the results with the Dynamic OD Estimation Using
Automatic Vehicle Location Information (2011) paper.

Study on RFID data based Freight Transportation Planning ROJAS, A., RIBEIRO,P.C.
13th WCTR, July 15-18, 2013 Rio de Janeiro, Brazil
4 05/04/2013
MODELS SUMMARY
Conceptualization
The first part of the study was identifying entities, properties, relationships and constraints, to
the nationwide Brazilian systems. A government perspective from planning point of view was
adopted.
A journey pattern is associated to a set of information collected from check points.
Information of Origin, Destination, main commodity, and vehicle (type, license) are
established over CT-e and Brasil-ID.
Algorithm to create a vehicle movement dataset
Data generated from an RFID application can be seen as a stream of RFID tuples of the form
(ID, location, time), where ID (r) is the unique identifier read by an RFID reader, location (l) is
the place where the RFID reader scanned the vehicle, and time (t) is the time when the
reading took place.
Table 1 is an example of a raw RFID database where a symbol starting with r represents an
RFID tag, l a location, and t a time.
Table 1: Raw RFID records
Raw Stay Records
(r1,l1,t1) (r2,l1,t1) …(r3,l1,t1),(r4,l1,t2) (r5,l1,t2) (r6,l1,t2) (r1,l2,t4) (r7,l2,t4) (r6,l2,t4) (r7,l1,t10)......
For our purposes we are interested in looking at the data at a level of abstraction different
than the one present in the raw data, is important to distinguish each item but rather look at
the data at the product category level. We can aggregate the product category table to the
level (pl, ll, tl) using information available in CT-e records and ID as primary key.
Movement graph model was used to provide a view over data movement and the queries to
analysis massive RFID datasets.
A movement graph G(V,E) is a direct graph representing the object movement; V is the set of
location. E is the set of transitions between locations. An edge e(I,j) indicates that objects
moved from location VI to location VJ. Each edge is annotated with the history of the object
movement along the edge and each entry in the history is a tuple of the form
(tstart,tend,tag_list:measure_list), where all the objects in the tag list took the transition
together, starting at time tstart and ending at time tend and measure list records properties of
shipment.
Figure 2 examples the representation of a graph schema of a road network.Where Pn are
the identifiers of Collection Points; A, B, C, D, E, F, G, H, I are the pathways that connect the
dots; and T1 and T2 are the Start and End times respectively.

Study on RFID data based Freight Transportation Planning ROJAS, A., RIBEIRO,P.C.
13th WCTR, July 15-18, 2013 Rio de Janeiro, Brazil
5 05/04/2013
Figure 2 Graph schema of road network
An RFID data set is a collection of paths, one per distinct tag in the system. Paths can be
seen as a probabilistic workflow, where nodes are path stages, and edges are transitions;
each edge has a probability that is the fraction of items took the transition.
OLAP Model
The OLAP model software aims to identify freight movement per zone, time, vehicle and
commodity using traditional database and statistics techniques. After merging RFID data and
CT-e the system can issue the following reports:
Origin and Destination of the domestic transportation;
Domestic transport’s weight from loading zone to unloading zone;
Travel distance, in kilometers, for each pair zone;
Main routes.
The flowchart to construct an up-to-date Freight OD matrix with RFID Data collection is
shown below:

Study on RFID data based Freight Transportation Planning ROJAS, A., RIBEIRO,P.C.
13th WCTR, July 15-18, 2013 Rio de Janeiro, Brazil
6 05/04/2013
Figure 3- Flowchart to create a real time OD Matrix
This diagram shows the main process of data acquisition related to cargo, vehicles and
adopted routes. Briefly, the antenna is the core of the system that contains antenna location,
vehicle ID, date and time of passage. Other information sources are (a) the system-Brazil ID
that identifies the existing goods in the vehicle and (b) the CT-e which identifies the origin
and destination of the goods, but not their route.
The design criteria used to collect data considered one tag reader by lane installed in
intersections of a highway. Link volume was simulated manually according DNIT statistic to
the BR101 road (DNIT, 2013) in the segment shown in figure 3. The same criteria was used
to ramp-up flow. Total highway flow was calculated computing all flows.
An example of the S3M software developed under the supervision of author (Ferreira,
Conceição, & Rojas, 2012) displays data movement as shown below, where it is possible to
select a road segment, antennas position, start and end of analysis time etc.

Study on RFID data based Freight Transportation Planning ROJAS, A., RIBEIRO,P.C.
13th WCTR, July 15-18, 2013 Rio de Janeiro, Brazil
7 05/04/2013
Figure 3 Movement Data
Below is an example of report simulating freight traffic according to DNIT statistics (2013).
Figure 4 Statistic Report

Study on RFID data based Freight Transportation Planning ROJAS, A., RIBEIRO,P.C.
13th WCTR, July 15-18, 2013 Rio de Janeiro, Brazil
8 05/04/2013
Data mining Model
Project Criteria: SUMO package and the network suggested were used to simulate the
traffic flow shown below:
Figure 5 Network for simulation
We insert a link from node 94 to 93 allowing an alternative traffic flow.
The layout of the area simulated is shown in Figure 6
91 911 1 5 914 94
92 912 2 4 913 93
6
3
D1
D2
L1
L2
L11
L12
L9
L10
L16L15
L8
L7
D8
D7
J1
D6
D5
L6
L5
L17
L18
L13
L14
L3
L4
D3
D4
: origin/destination node : dummy node : intersedion segment : node number91 : link nameL1
Figure 6 Layout of network
Four models of freight transportation vehicles , one car model and one bus model were
created. The layout of configuration file is shown below:

Study on RFID data based Freight Transportation Planning ROJAS, A., RIBEIRO,P.C.
13th WCTR, July 15-18, 2013 Rio de Janeiro, Brazil
9 05/04/2013
Figure 7 Part of configuration file
Simulation Data was generated for seven days a week, and for each day traffic flow with part
of vehicles using a fixed route and other part with variable route. The RFID reader antennas
were also simulated in SUMO, twenty-nine of them were scattered around the road network,
in ten points, one per lane.
Figure 8 Simulation example
After the simulation, the generated data was organized by vehicle and trip. A part of Software
program is shown below:

Study on RFID data based Freight Transportation Planning ROJAS, A., RIBEIRO,P.C.
13th WCTR, July 15-18, 2013 Rio de Janeiro, Brazil
10 05/04/2013
Data mining
WEKA data mining software was adopted do determinate emerging properties. The select
method for pattern analysis recognition was nearest neighbor method, available in software
WEKA.
Considering the proposed scenario to predict vehicles movement, the selection operation of
the data pre-processing was applied and the following attributes were considered:
Time: The time the vehicle spends on the road is important because there is standard
displacement at peak hours, where most drivers are going to or returning from usual
origin/destination;
ID_Vehicle: The reason for the choice of this attribute is similar to the previous one. A
driver/company who uses their vehicle to their routine work, study or freight tends to
go the same route and therefore the identifier of the vehicle becomes important for
predicting the movement;
Speed: This chosen attribute has minor contribution to the standards, but has
relevance in specific cases;
Vehicle type: movement pattern may be according to vehicle type. Usually taxi
vehicles have no standards.
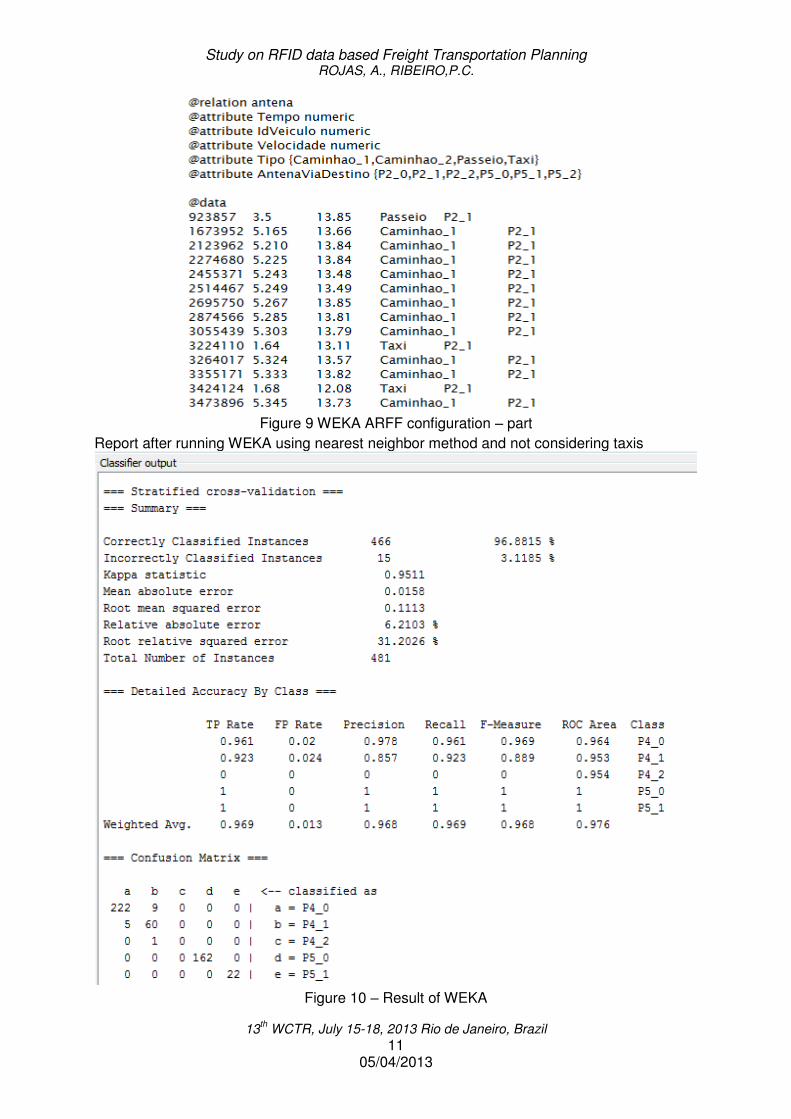
Part of the attributes configuration file ARFF of WEKA software used is shown in Figure 9
Study on RFID data based Freight Transportation Planning ROJAS, A., RIBEIRO,P.C.
13th WCTR, July 15-18, 2013 Rio de Janeiro, Brazil
11 05/04/2013
Figure 9 WEKA ARFF configuration – part
Report after running WEKA using nearest neighbor method and not considering taxis
Figure 10 – Result of WEKA

Study on RFID data based Freight Transportation Planning ROJAS, A., RIBEIRO,P.C.
13th WCTR, July 15-18, 2013 Rio de Janeiro, Brazil
12 05/04/2013
RESULTS
Studies using frequent pattern in WEKA have made the prediction of the road network and
the matrix OD (Origin-Destination). These studies are part of Dynamic OD matrix as an
essential input for traffic guidance and traffic control strategies of ITS Intelligent
Transportation System.
Guozhen, Lindong, & Yaodong (2011) propose the model ODAVL Dynamic OD Estimation
Using Automatic Vehicle Location Information to estimate dynamic OD demand using AVL
information as real-time data, which avoids the uncertainty of historic OD data.
The simulation results under different Market Penetration Rate-MPR and corresponding
Relative Error-RE are displayed in Table 2
Table 2 – ODAVL Market Penetration Rate
MPR 10% 20% 30% 40% 50% 60% 70% 80% 90%
RE 12,2 10,96 9,83 7,63 6,46 5,41 4,74 4,16 2,62
Market Penetration Rate – MPR concept in Guozhen, Lindong, & Yaodong (2011) is a
measure of the amount of vehicles with RFID tag compared to the total theoretical market for
vehicles with RFID. According CONTRAN (2006), all Brazilian fleet will be equipped with
SINIAV tag in few years. During SINIAV prototype tests approximately 70% of probe vehicles
using RFID tag were correctly read in check point. We compare MPR rate 70% of Guozhen,
Lindong, & Yaodong (2011) results with our proposed model.
The result comparing ODAVL with our proposed Model is displayed in Table 3
Table 3- results of simulation
Model All vehicles with OD established Relative error (%)
ODAVL Y 4,74%
Model proposed N (except taxi) 6,21%
CONCLUSIONS
In this paper, we propose a methodology to improve multi-source data collection from three
nationwide freight transportation projects.
OLAP Method results as an up-to-date Freight OD and assignment reports from collect data
in check points;
Data mining Method results as an application of knowledge discovery in databases (KDD) to
determinate frequent pattern. Similar results were found comparing results with other studies.
Examining the main characteristics of the Brazilian RFID Projects, we concluded that by
merging collected data in checkpoints, it is possible to obtain sufficient information to support
freight transportation planning.

Study on RFID data based Freight Transportation Planning ROJAS, A., RIBEIRO,P.C.
13th WCTR, July 15-18, 2013 Rio de Janeiro, Brazil
13 05/04/2013
BIBLIOGRAFY
Behrisch , M., Bieker , L., Erdmann , J., & Krajzewicz, D. (2011). SUMO - Simulation of
Urban MObility: An Overview. SIMUL 2011, The Third International Conference on
Advances in System, (pp. 63-68). Barcelona,Spain.
Bell, M. (1983). The Estimation of an origin-destination matrix from traffic counts.
Transportation Science, 1, 198-217.
Brasil-ID. (2009). Sistema de Identificação, Rastreamento e Autenticação de Mercadorias.
Centro de Pesquisas Avançadas Wernher von Braun.
Cascetta, E., Inaudi, D., & Marquis, G. (1993). Dynamic estimators of Origin Destination
matrices using traffic counts. Transportation Science, 27(4), 363 373.
CONFAZ. (2007). Conhecimento do Transporte Eletronico. Acesso em 31 de 01 de 2012,
disponível em Ministerio de Fazenda:
http://www.fazenda.gov.br/confaz/confaz/ajustes/2007/AJ_009_07.htm
CONTRAN. (2006). SINIAV. Brasilia. Acesso em 20 de 09 de 2011, disponível em
http://www.denatran.gov.br/siniav.htm: http://www.denatran.gov.br/siniav.htm
Cremer, M., & Keller, H. (1981). Dynamic identification of flows from traffic counts at
complex intersections. 8th Int. Symp. Transportation and Traffic Theory (pp. 121-
142). Toronto, Canada: Toronto,ON.
Cremer, M., & Keller, H. (1987). A New Class of Dynamic Methods for the Identification of
Origin-Destination Flows. Transportation Research Vol B No 2., pp. 117-132.
Dixon, M., & Rilett, L. (jan de 2002). Real-Time estimation using vehicle identification and
traffic count data. Computer Aided Civil Infrastructure Eng., 17, 7-21.
Dixon, M., & Rilett, L. (2005). Population Origin-Destination Using Automatic Vehicle
Identification and Volume Data. Journal of Transportation Engineering, 75-82.
DNIT. (19 de 03 de 2013). Estatisticas. Fonte: DNIT Departamento Nacional de
Infraestrutura de Transportes: http://www.dnit.gov.br/rodovias/operacoes-
rodoviarias/postos-de-monitoramento/estatisticas
Ferreira, A. N., Conceição, G. R., & Rojas, A. (2012). S3M:. Rio de Janeiro.
Gidofalvi, G., & Pedersen, T. B. (2009). Mining Long, Sharable Patterns in Trajectories of
Moving Objects. Geoinformatica, 13, pp. 27-55.
Guozhen, T., Lindong, L., & Yaodong, W. (2011). Dynamic OD Estimation Using Automatic
Vehicle Location Information. Information Technology and Artificial Intelligence
Conference (ITAIC), 2011 6th IEEE Joint International , (pp. 352-355).
Huiping , C., Nikos , M., & Cheung, D. W. (abril de 2007). Discovery of Periodic Patterns in
Spatiotemporal Sequences. (I. E. Department, Ed.) IEEE Transactions on Knowledge
and Data Engineering, 19(4).
Lee, J.-G., Han, J., Li, X., & Cheng, H. (maio de 2011). Mining Discriminative Patterns fo
Classifyng Trajectories on Road Networks. (I. C. Socity, Ed.) IEEE Transactions on
Knowledge ans Data Engineering, 23(5), 713-726.
Liu, Y., Chen, L., Pei, J., Chen, Q., & Zhao, Y. (2007). Mining Frequent Trajectory Patterns
Activity Monitoring Using Radio Frequency Tags. PERCOM '07 Proceedings of the
Fifth IEEE International Conference on Pervasive Computing and Communications,
(pp. 37-46).
Shan, J., & Xu-hong, L. (2008). Estimating the highway Freight Origin-Destination matrix
from multi-source Data based on Fuzzy Programming Theory. International
Workshop on Modeling, Simulation and Optimization (pp. 204-209). IEEE Computer
Society.

Study on RFID data based Freight Transportation Planning ROJAS, A., RIBEIRO,P.C.
13th WCTR, July 15-18, 2013 Rio de Janeiro, Brazil
14 05/04/2013
University of Waikato. (19 de 03 de 2013). Weka 3: Data Mining Software in Java. Fonte:
http://www.cs.waikato.ac.nz/ml/weka/
Willumsen, L. (1978a). Estimation of an OD matrix from traffic counts: a review. (L.
University, Ed.) Institute for Transport Studies, working paper 99.
WILLUMSEN, L. (1981). Simplified transport models based on traffic counts.
Transportation, 10, 257-278.
Willumsen, L. (1984). Estimating time-dependent trip matrices from traffic count. Proceeding
of Ninth Internationa Symporium on Transportation and Traffic Theory (pp. 397-411).
VUN Science Press.
Zhou, X., & Mahmassani, H. (march de 2006). Dynamic Origin-Destination Demand
Estimation Using Automatic Vehicle Identification data. IEEE Transactions on
Intelligent Transportation Systems, 7(1).