study on the structure of potassium chloride aqueous … · · 2017-10-04study of aqueous...
TRANSCRIPT

CHEMICAL ENGINEERINGTRANSACTIONS
VOL. 61, 2017
A publication of
The Italian Association of Chemical Engineering Online at www.aidic.it/cet
Guest Editors: Petar S Varbanov, Rongxin Su, Hon Loong Lam, Xia Liu, Jiří J Klemeš Copyright © 2017, AIDIC Servizi S.r.l.
ISBN978-88-95608-51-8; ISSN 2283-9216
Study on the Structure of Potassium Chloride Aqueous
Solution by Molecular Dynamics and Raman Spectroscopy
Methods
Fei Li, Shenyu Li, Xinming Zhuang, Junsheng Yuan*
School of Marine Science and Engineering, Hebei University of Technology, 300130 Tianjin, China
Study of aqueous solution micro structure is conducive to the development of water treatment materials. In
this paper, molecular dynamics simulation of structure of dilute KCl aqueous solutions at 298 K was
systematically carried out using the COMPASS force field. Based on simulation results, when the
concentrations of KCl are 0.01 M, 0.05 M, 0.10 M, 0.50 M, 0.75 M, 1.00 M and 2.00 M, the coordination
numbers of K+ are 6.43, 6.41, 6.41, 6.36, 6.27, 6.24, and 5.73. Raman spectrum has been performed on this
series of solutions. It revealed that the hydrogen bonds between water molecules were almost the same as
that in pure water when the concentrations were below 0.10M. While at 0.50 M, 0.75 M, 1.00 M, and 2.00 M,
the hydrogen bonds were obviously disturbed. The results obtained by Raman spectrum can directly support
the simulation results. In general, it was speculated that the structure tends to be steady in dilute KCl solutions
when the concentration is lower than 0.10 M.
1. Introduction
There are various water treatment materials. Such as Nanoporous Electrodes (Sechi et al., 2016) and
Bimetallic Nanoparticles (Muradova et al., 2016). Interactions between waters and ions in aqueous solution
system can direct the development of those water treatment materials. The aim of this paper is to get the KCl
aqueous solution structure, which is conductive to effectively extract potassium from the aqueous solution.
Coordination numbers for K+ in aqueous solution, which obtained by Monte Carlo–Metropolis statistical
thermodynamic computer simulation were 6.27 ± 0.25 (Li et al., 2015).Those resulting from MD simulations
were 6.1 (Zhou et al., 2002). Results received from X-ray and Neutron diffraction were 5.3 (Lawrence and
Kruh, 1967) and 8 (Fishkis and Soboleva, 1974). These results exhibited a rather diversified picture.
Nowadays, progress in computer resources allows more scientists performing simulations for more
sophisticated method, such as QM/MM (Azam et al., 2009), CPMD (Liu et al., 2010) etc. Azam et al. (2009)
used quantum mechanical charge field (QMCF) approach to resolve the problem of constructing potential
functions between the particles in the QM region and molecules in the MM zone. The coordination numbers of
potassium (in KCl aqueous solution) obtained from “classical” QM/MM and QMCF assisting QM/MM were 6.2
and 6.8.
Sun et al. (2010) have recorded the Raman spectrum of NaCl-H2O, KCl-H2O, CaCl2-H2O, MgCl2-H2O and
NaCl-KCl-CaCl2-H2O, and they found there is an equilibrium phenomenon between various structural species,
and the equilibrium constant was obtained. Chumaevskii et al. (2001) has received the Raman spectrum of
H2O and aqueous solutions of LiCl, NaCl, KCl, RbCl and CsCl, and a model of five-molecule unit was raised.
The structure of hydrated K+ still escape consistent experimental results for different scientists, which is
caused by the fact that the ion-water distance of K-Owater is very close to the O-O distance in bulk water.
Molecular dynamics simulation, which can model a real experiment, could provide quantitative information of
KCl aqueous solution. Simulation study of dilute aqueous KCl solutions is not comprehensive in the literature.
The authors carried out a structural investigation of aqueous KCl solutions with the concentrations ranging
from 0.01 M to 2.00 M by means of MD simulation and Raman spectrum. The results received from simulation
was compatible with the experimental data (Soper and Weckström, 2006).
DOI: 10.3303/CET1761126
Please cite this article as: Li F., Li S., Zhuang X., Yuan J., 2017, Study on the structure of potassium chloride aqueous solution by molecular dynamics and raman spectroscopy methods, Chemical Engineering Transactions, 61, 769-774 DOI:10.3303/CET1761126
769

2. Simulation and experiment
2.1 Simulation details The essential methods of molecular dynamics study are same as our previous works (Zhou et al., 2011). They
are described briefly for the reader’s convenience.
Molecular dynamics simulations were performed on an individual workstation (HP, xw8600). NVT ensemble
was performed at an average temperature of 298 K. KCl solutions were ranging from 0.01 M to 2.00 M in the
simulations. The concentrations of the KCl solutions were adjusted by the numbers of water molecules and
ions. A cubic box of 5,536 waters and 1 KCl was constructed for the 0.01 M solution. Periodic boundary
condition was applied. The cubic boxes were energy minimized using 10,000 steps of Newton minimization.
The ion–ion and ion–water interactions were represented by Lenard-Jones potentials. Van der Waals
interactions and electrostatic interactions were calculated by Atom-based method and Ewald summation
method. Nose-Hoover thermostat was used to control the temperature. The total time of the simulation was
300 ps with a time step of 1fs. Atomic properties, such as energies, atomic coordinates and velocities were
recorded every 100 time steps (0.1ps). The first 100 ps was used to equilibrate the system, while the last 200
ps was used to record various properties, which is used for later analysis.
2.2 Raman spectral measurements In this work, deionized water was produced by a UP water purification system (UPHW-I90T), and its electric
resistivity was 18.25 MΩ·cm. Aqueous KCl solutions were prepared with the same concentrations as the
simulation systems. The solute was guarantee grade reagent. Raman spectra of KCl solutions and pure water
were measured at ambient condition (T ≈ 298 K, p ≈ 1 bar).
The DXR Raman Microscope (Themo Fisher Company, America) was used to determine the solutions. The
laser wavelength was 532 nm. The spectral resolution was less than 1 cm-1. The exposure time was five
seconds for thirty times. O-H stretching spectrum was recorded from 2,800 cm-1 to 3,800 cm-1.
3. Results and discussion
3.1 Simulation results
3.1.1. Model design and energy optimization
The initial velocities of the atoms in the model were random velocities from Boltzmann distribution. The
optimized model is shown in Figure1. Cubic box representing microscopic structure of KCl solution was
obtained (Red, white, purple and green balls denote O, H, K+ and Cl-). The numbers of ions and water
molecules are determined by the concentrations of KCl solutions.
Figure 1: Structure model of the KCl solution at 298 K
3.1.2. Pair distribution functions and coordination numbers
Figure 2(a) - (b) displays the pair distribution functions gij(r) of K-O, Cl-H in KCl solutions at different
concentrations. The coordination numbers are defined by Eq(1) (Megyes et al., 2006).
r
ijjij drrgrrn0
2 )(4)( (1)
ρj is the atomic number density of the j atom. The characteristic properties of these PDFs, such as first peak
positions, coordination numbers and corresponding data from literatures are listed in Table 1.
As it shown in Figure 2, the K-O PDFs indicate clear first shells with their maximum located at 2.65 Å.
Integration up to the valley point (3.45 Å) following the first shell yields the first shell coordination number of
6.43, 6.41, and 6.41 for K+ in the KCl aqueous solutions at the concentrations of 0.01 M, 0.05 M, and 0.10 M.
770

For the concentration of 0.50 M, 0.75 M, 1.00 M, and 2.00 M, the coordination numbers are 6.36, 6.27, 6.24,
and 5.73. The increasing concentration obviously influenced the height of the first peak. That is the higher
concentration the lower peak height. When the concentration rose from 0.01 M to 0.10 M, there was no
apparent decline of the peak height. The remarkable reduction of the peak height for the 2.00 M KCl aqueous
solution compared with the lower concentrations indicates a loose structuration of this solution. As it
mentioned in Obst and Bradaczek’s (1996) research, for K+, only two distinct hydration shells were observed.
The lower height of the second peaks of K-O PDFs with the increasing concentration shows less pronounced
second hydration shells. The changes of PDFs for Cl-H were similar with that in K-O PDFs. The first shell
coordination numbers for Cl- in 0.01 M to 2.00 M KCl aqueous solutions were 6.53, 6.50, 6.49, 6.45, 6.43,
6.42, and 5.90. Similarly, clear variation is visible for the KCl aqueous solution at the concentration of 2.00 M.
Figure 2: Pair distribution functions and corresponding nij(r) of KCl solution system at different concentrations,
(a): K-O (b): Cl-H
It is necessary to notice the variation of O-O pair distribution function gOO(r) between two water molecules
(Figure 3). It implied the structure changes of bulk water caused by increased concentration. If the structure of
the first coordination shell is measured by the sharpness of the first peak of PDF, it can be concluded that the
increase of the concentration from 0.50 M to 2.00 M leads to an obvious decrease in the structure of bulk
water molecules. No apparent change is seen from 0.01 M to 0.10 M. There exists consensus among
researchers that water is highly structured liquid due to an extensive network of hydrogen bonds. (Marcus,
2009) It is deduced that hydrogen bonds in KCl aqueous solution, with the concentrations from 0.01 M to 0.10
M, were identical with each other. Hydrogen bonds in 2.00 M solution were disturbed markedly comparing with
those in dilute aqueous KCl solutions (0.01 M~0.10 M).
1 2 3 4 5 60.0
0.5
1.0
1.5
2.0
2.5
3.0
3.5
gO
-O(r
)
r/Angstrom
0.01M
0.05M
0.10M
0.50M
0.75M
1.00M
2.00M
2.6 2.7 2.8 2.9
2.0
2.2
2.4
2.6
2.8
Figure 3: Pair distribution functions of KCl solution system at different concentrations for O-O
In general, the peak positions and coordination numbers listed above agrees well with the published
experimental results (Table 1). Their experiments were performed at the same condition (T = 298 K, p = 1 bar)
as our simulation. Comparison between results from this work and NDIS method performed by Soper and
Weckström (2006) were reasonable and reliable. The results obtained from this work were also in good
consist with that got from the more sophisticated method QM/MM and QMCF (Table 1). This consistency
indicates clearly that the COMPASS force fields used in classical molecular simulations are sufficient to
describe the hydration of simple metal cations.
Overall, in MD simulation study, when the concentration is below 0.10 M (include 0.10 M), the coordination
shell structures around K+ did not change obviously with the increase of concentration. While the
concentration of KCl aqueous solution was 0.50 M, 0.75 M, 1.00 M, and 2.00 M, apparent shape changes
(a)
1 2 3 4 5 60
1
2
3
4
5
6
0
3
6
9
12
15
nK
-O(r
)
r/Angstrom
gK
-O(r
)
0.01M
0.05M
0.10M
0.50M
0.75M
1.00M
2.00M
(b)
0
1
2
3
4
5
6
1 2 3 4 5 60
3
6
9
12
15
nK
-O(r
)
0.01M
0.05M
0.10M
0.50M
0.75M
1.00M
2.00M
gC
l-H(r
)r/Angstrom
771
were observed. The authors proposed that water molecules around the K+ in the dilute aqueous solution
(below 0.10 M) may be at the same dynamical state.
Table 1: Comparison of first peak positions (rpeak) and coordination numbers for K-O from this work and
literatures
solute Concentration method rpeak/Å nKO ref
KCl 0.01 M (1/5536) MD 2.65 6.43 This work
KCl 0.05 M (1/1104) MD 2.65 6.41 This work
KCl 0.10 M (1/552) MD 2.65 6.41 This work
KCl 0.50 M (1/109) MD 2.65 6.36 This work
KCl 0.75 M (1/71) MD 2.65 6.27 This work
KCl 1.00 M (1/53) MD 2.65 6.24 This work
KCl 2.00 M (1/26) MD 2.65 5.73 This work
K 1/255 MD 2.86 6.1 Zhou et al. (2002)
K 1/48 CPMD 2.82 6.24 Liu et al. (2010)
KCl 1/499 QM/MM 2.8 6.2 Azam et al. (2009)
KCl 1/499 QMCF 2.8 6.8 Azam et al. (2009)
K MC 5-7 Kistenmacher (1974)
K 1/215 MC 6.27±0.25 Mezei and Beveridge (1981)
KCl 1.2/100 NDIS 2.65 6.2 Soper and Weckström (2006)
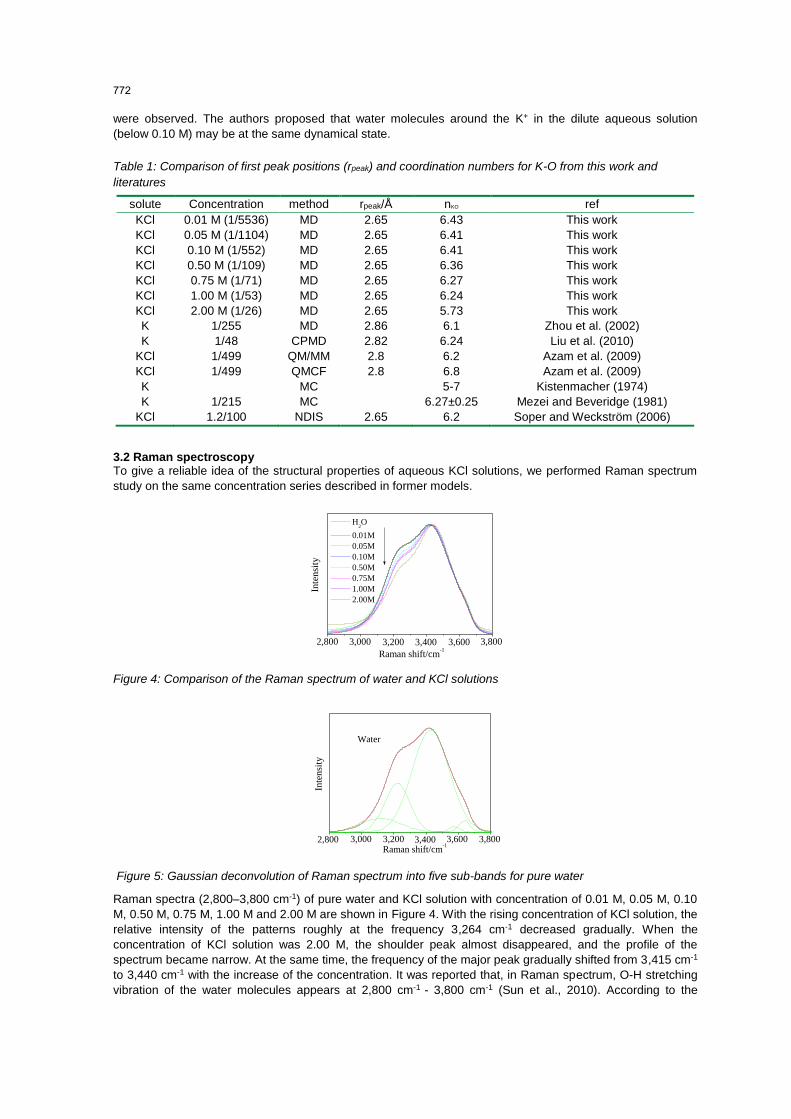
3.2 Raman spectroscopy To give a reliable idea of the structural properties of aqueous KCl solutions, we performed Raman spectrum
study on the same concentration series described in former models.
Raman shift/cm-1
3,8003,6003,4003,2003,0002,800
Inte
nsi
ty
H2O
0.01M
0.05M
0.10M
0.50M
0.75M
1.00M
2.00M
Figure 4: Comparison of the Raman spectrum of water and KCl solutions
Water
In
ten
sity
3,8003,6003,4003,2003,000
Raman shift/cm-1
2,800
Figure 5: Gaussian deconvolution of Raman spectrum into five sub-bands for pure water
Raman spectra (2,800–3,800 cm-1) of pure water and KCl solution with concentration of 0.01 M, 0.05 M, 0.10
M, 0.50 M, 0.75 M, 1.00 M and 2.00 M are shown in Figure 4. With the rising concentration of KCl solution, the
relative intensity of the patterns roughly at the frequency 3,264 cm-1 decreased gradually. When the
concentration of KCl solution was 2.00 M, the shoulder peak almost disappeared, and the profile of the
spectrum became narrow. At the same time, the frequency of the major peak gradually shifted from 3,415 cm-1
to 3,440 cm-1 with the increase of the concentration. It was reported that, in Raman spectrum, O-H stretching
vibration of the water molecules appears at 2,800 cm-1 - 3,800 cm-1 (Sun et al., 2010). According to the
772
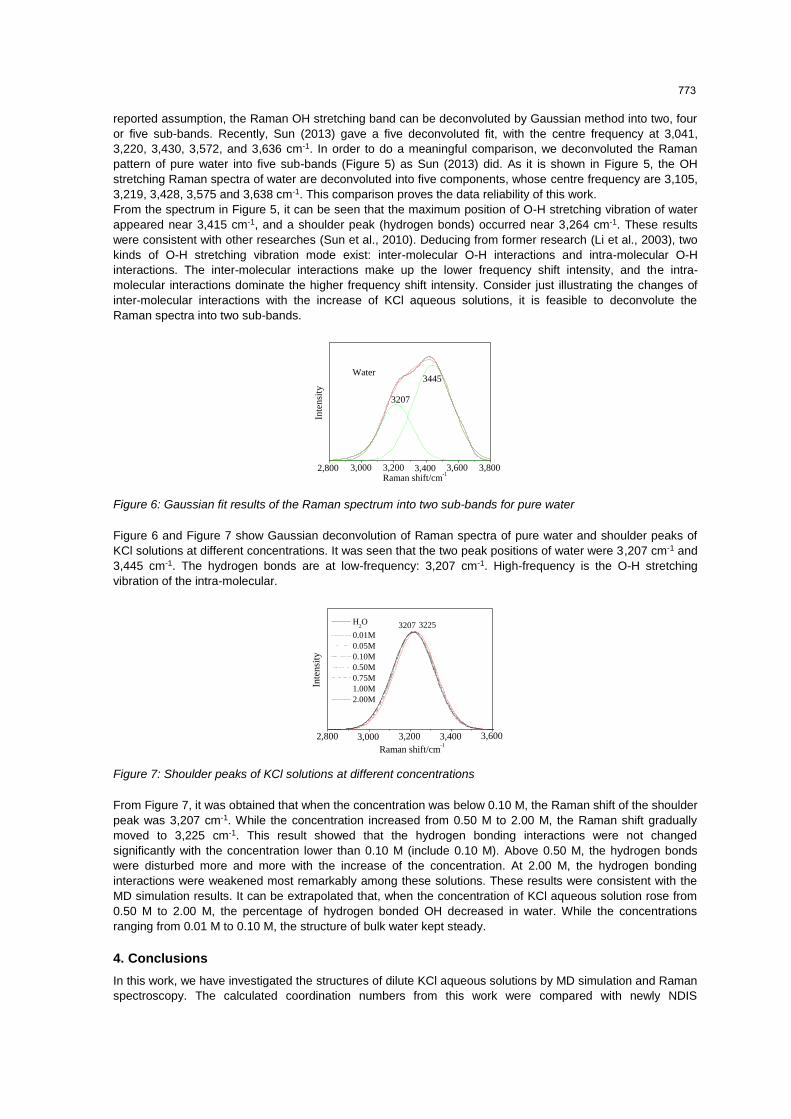
reported assumption, the Raman OH stretching band can be deconvoluted by Gaussian method into two, four
or five sub-bands. Recently, Sun (2013) gave a five deconvoluted fit, with the centre frequency at 3,041,
3,220, 3,430, 3,572, and 3,636 cm-1. In order to do a meaningful comparison, we deconvoluted the Raman
pattern of pure water into five sub-bands (Figure 5) as Sun (2013) did. As it is shown in Figure 5, the OH
stretching Raman spectra of water are deconvoluted into five components, whose centre frequency are 3,105,
3,219, 3,428, 3,575 and 3,638 cm-1. This comparison proves the data reliability of this work.
From the spectrum in Figure 5, it can be seen that the maximum position of O-H stretching vibration of water
appeared near 3,415 cm-1, and a shoulder peak (hydrogen bonds) occurred near 3,264 cm-1. These results
were consistent with other researches (Sun et al., 2010). Deducing from former research (Li et al., 2003), two
kinds of O-H stretching vibration mode exist: inter-molecular O-H interactions and intra-molecular O-H
interactions. The inter-molecular interactions make up the lower frequency shift intensity, and the intra-
molecular interactions dominate the higher frequency shift intensity. Consider just illustrating the changes of
inter-molecular interactions with the increase of KCl aqueous solutions, it is feasible to deconvolute the
Raman spectra into two sub-bands.
3,8003,6003,4003,2003,000
Inte
nsi
ty
Raman shift/cm-1
Water3445
3207
2,800
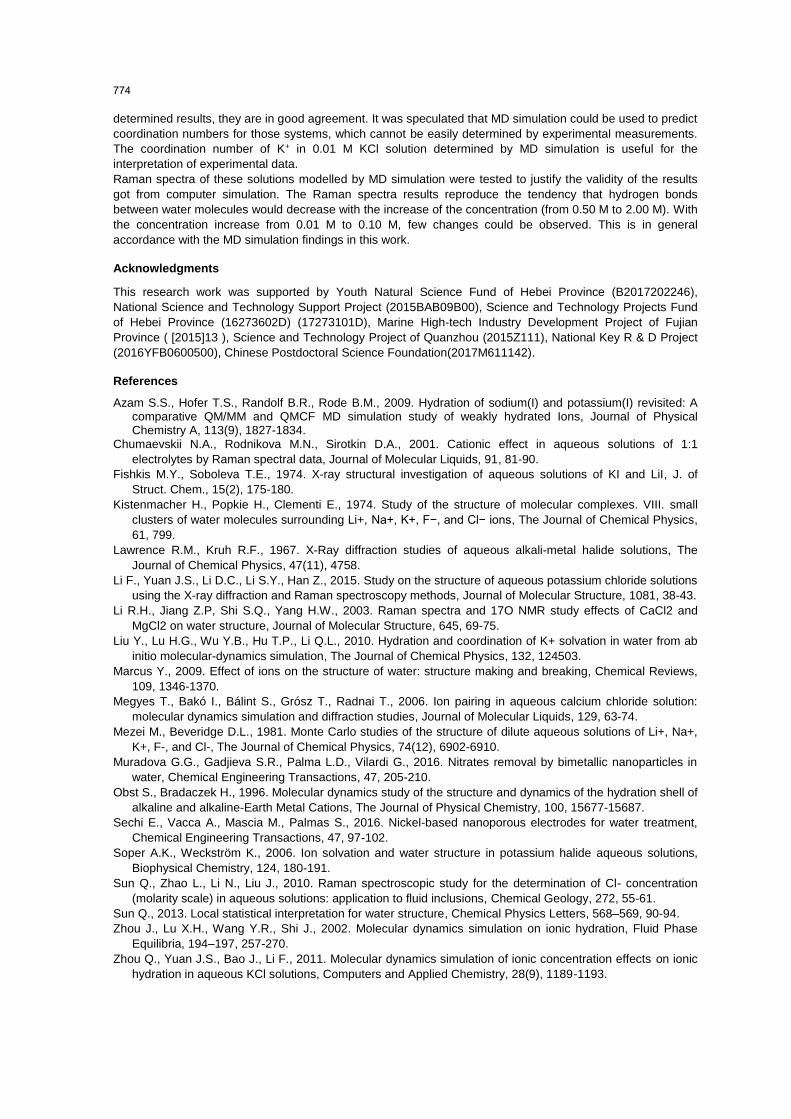
Figure 6: Gaussian fit results of the Raman spectrum into two sub-bands for pure water
Figure 6 and Figure 7 show Gaussian deconvolution of Raman spectra of pure water and shoulder peaks of
KCl solutions at different concentrations. It was seen that the two peak positions of water were 3,207 cm-1 and
3,445 cm-1. The hydrogen bonds are at low-frequency: 3,207 cm-1. High-frequency is the O-H stretching
vibration of the intra-molecular.
Inte
nsi
ty
3225 H2O
0.01M
0.05M
0.10M
0.50M
0.75M
1.00M
2.00M
3207
3,6003,4003,2003,000
Raman shift/cm-1
2,800
Figure 7: Shoulder peaks of KCl solutions at different concentrations
From Figure 7, it was obtained that when the concentration was below 0.10 M, the Raman shift of the shoulder
peak was 3,207 cm-1. While the concentration increased from 0.50 M to 2.00 M, the Raman shift gradually
moved to 3,225 cm-1. This result showed that the hydrogen bonding interactions were not changed
significantly with the concentration lower than 0.10 M (include 0.10 M). Above 0.50 M, the hydrogen bonds
were disturbed more and more with the increase of the concentration. At 2.00 M, the hydrogen bonding
interactions were weakened most remarkably among these solutions. These results were consistent with the
MD simulation results. It can be extrapolated that, when the concentration of KCl aqueous solution rose from
0.50 M to 2.00 M, the percentage of hydrogen bonded OH decreased in water. While the concentrations
ranging from 0.01 M to 0.10 M, the structure of bulk water kept steady.
4. Conclusions
In this work, we have investigated the structures of dilute KCl aqueous solutions by MD simulation and Raman
spectroscopy. The calculated coordination numbers from this work were compared with newly NDIS
773
determined results, they are in good agreement. It was speculated that MD simulation could be used to predict
coordination numbers for those systems, which cannot be easily determined by experimental measurements.
The coordination number of K+ in 0.01 M KCl solution determined by MD simulation is useful for the
interpretation of experimental data.
Raman spectra of these solutions modelled by MD simulation were tested to justify the validity of the results
got from computer simulation. The Raman spectra results reproduce the tendency that hydrogen bonds
between water molecules would decrease with the increase of the concentration (from 0.50 M to 2.00 M). With
the concentration increase from 0.01 M to 0.10 M, few changes could be observed. This is in general
accordance with the MD simulation findings in this work.
Acknowledgments
This research work was supported by Youth Natural Science Fund of Hebei Province (B2017202246),
National Science and Technology Support Project (2015BAB09B00), Science and Technology Projects Fund
of Hebei Province (16273602D) (17273101D), Marine High-tech Industry Development Project of Fujian
Province ( [2015]13 ), Science and Technology Project of Quanzhou (2015Z111), National Key R & D Project
(2016YFB0600500), Chinese Postdoctoral Science Foundation(2017M611142).
References
Azam S.S., Hofer T.S., Randolf B.R., Rode B.M., 2009. Hydration of sodium(I) and potassium(I) revisited: A comparative QM/MM and QMCF MD simulation study of weakly hydrated Ions, Journal of Physical Chemistry A, 113(9), 1827-1834.
Chumaevskii N.A., Rodnikova M.N., Sirotkin D.A., 2001. Cationic effect in aqueous solutions of 1:1
electrolytes by Raman spectral data, Journal of Molecular Liquids, 91, 81-90.
Fishkis M.Y., Soboleva T.E., 1974. X-ray structural investigation of aqueous solutions of KI and LiI, J. of
Struct. Chem., 15(2), 175-180.
Kistenmacher H., Popkie H., Clementi E., 1974. Study of the structure of molecular complexes. VIII. small
clusters of water molecules surrounding Li+, Na+, K+, F−, and Cl− ions, The Journal of Chemical Physics,
61, 799.
Lawrence R.M., Kruh R.F., 1967. X-Ray diffraction studies of aqueous alkali-metal halide solutions, The
Journal of Chemical Physics, 47(11), 4758.
Li F., Yuan J.S., Li D.C., Li S.Y., Han Z., 2015. Study on the structure of aqueous potassium chloride solutions
using the X-ray diffraction and Raman spectroscopy methods, Journal of Molecular Structure, 1081, 38-43.
Li R.H., Jiang Z.P, Shi S.Q., Yang H.W., 2003. Raman spectra and 17O NMR study effects of CaCl2 and
MgCl2 on water structure, Journal of Molecular Structure, 645, 69-75.
Liu Y., Lu H.G., Wu Y.B., Hu T.P., Li Q.L., 2010. Hydration and coordination of K+ solvation in water from ab
initio molecular-dynamics simulation, The Journal of Chemical Physics, 132, 124503.
Marcus Y., 2009. Effect of ions on the structure of water: structure making and breaking, Chemical Reviews,
109, 1346-1370.
Megyes T., Bakó I., Bálint S., Grósz T., Radnai T., 2006. Ion pairing in aqueous calcium chloride solution:
molecular dynamics simulation and diffraction studies, Journal of Molecular Liquids, 129, 63-74.
Mezei M., Beveridge D.L., 1981. Monte Carlo studies of the structure of dilute aqueous solutions of Li+, Na+,
K+, F-, and Cl-, The Journal of Chemical Physics, 74(12), 6902-6910.
Muradova G.G., Gadjieva S.R., Palma L.D., Vilardi G., 2016. Nitrates removal by bimetallic nanoparticles in
water, Chemical Engineering Transactions, 47, 205-210.
Obst S., Bradaczek H., 1996. Molecular dynamics study of the structure and dynamics of the hydration shell of
alkaline and alkaline-Earth Metal Cations, The Journal of Physical Chemistry, 100, 15677-15687.
Sechi E., Vacca A., Mascia M., Palmas S., 2016. Nickel-based nanoporous electrodes for water treatment,
Chemical Engineering Transactions, 47, 97-102.
Soper A.K., Weckström K., 2006. Ion solvation and water structure in potassium halide aqueous solutions,
Biophysical Chemistry, 124, 180-191.
Sun Q., Zhao L., Li N., Liu J., 2010. Raman spectroscopic study for the determination of Cl- concentration
(molarity scale) in aqueous solutions: application to fluid inclusions, Chemical Geology, 272, 55-61.
Sun Q., 2013. Local statistical interpretation for water structure, Chemical Physics Letters, 568–569, 90-94.
Zhou J., Lu X.H., Wang Y.R., Shi J., 2002. Molecular dynamics simulation on ionic hydration, Fluid Phase
Equilibria, 194–197, 257-270.
Zhou Q., Yuan J.S., Bao J., Li F., 2011. Molecular dynamics simulation of ionic concentration effects on ionic
hydration in aqueous KCl solutions, Computers and Applied Chemistry, 28(9), 1189-1193.
774