study prospectus naphtha nexus - esai energy llc nexus: the interaction of global gasoline, naphtha...
TRANSCRIPT

Naphtha Nexus:
The Interaction of Global Gasoline, Naphtha
and Petrochemical Markets to 2025
Study Prospectus

Naphtha Nexus:
The Interaction of Global Gasoline, Naphtha and Petrochemical Markets
2016
No parts of this publication may be duplicated, transmitted or stored without ESAI’s written permission. The estimates, forecasts and analyses in this report are our judgement and are subject to change without
notice. No warranty is made or implied. ©2016, ESAI Energy LLC
ESAI Energy LLC | 401 Edgewater Place, Suite640 | Wakefield, MA 01880 | +1.781.245.2036
www.esai.com

Naphtha Nexus: The Interaction of Global Gasoline, Naphtha and Petrochemical Markets to 2025 ESAI Energy, LLC
____________________________________________________________________________________
2
Contents Introduction
List of Figures ................................................................................................................................................ 6
I. Executive Summary .................................................................................................................................... 9
A. Naphtha Balances and West-to-East Trade .......................................................................................... 9
B. Demand Trajectories Favor Petrochemicals Over Transport .............................................................. 10
II. Overview ................................................................................................................................................. 11
A. Global and Regional Price Implications .............................................................................................. 11
B. Demand, Supply and Balance by Region............................................................................................. 13
North America ..................................................................................................................................... 13
Asia ...................................................................................................................................................... 14
Middle East ......................................................................................................................................... 15
Europe ................................................................................................................................................. 16
FSU ...................................................................................................................................................... 17
Africa ................................................................................................................................................... 18
Latin America ...................................................................................................................................... 19
III. Global Outlook on Naphtha Supply ....................................................................................................... 20
A. Condensate Impacts on Naphtha Supply............................................................................................ 20
Global Condensate Supply .................................................................................................................. 20
B. Global Refinery and Splitter Investment ............................................................................................ 22
East of Suez Leads Capacity Additions ................................................................................................ 22
Condensate Splitter Capacity Additions.............................................................................................. 22
Throughput Growth and Alternative Supply ....................................................................................... 24
C. Methodology and Forecasts for Naphtha Supply ............................................................................... 25
Trends in Naphtha Production from Distillation ................................................................................. 25
Splitting Light and Heavy Naphtha ...................................................................................................... 26
Global Naphtha Supply ....................................................................................................................... 27
Asia Naphtha Supply ........................................................................................................................... 29
Middle East Naphtha Supply ............................................................................................................... 30
Europe Naphtha Supply ...................................................................................................................... 32
North America Naphtha Supply .......................................................................................................... 33
Africa, Latin America and FSU Naphtha Supply .................................................................................. 34

Naphtha Nexus: The Interaction of Global Gasoline, Naphtha and Petrochemical Markets to 2025 ESAI Energy, LLC
____________________________________________________________________________________
3
IV. Naphtha Use in Gasoline Production ..................................................................................................... 35
A. Global Demand’s Structural Decline ................................................................................................... 35
United States CAFE Policy and OECD Demand Destruction ................................................................ 36
China’s Transition and the Limits of Asian Demand Growth .............................................................. 37
Emerging Market Demand in the Post-Super-Cycle Era ..................................................................... 38
B. Gasoline Blending Analysis ................................................................................................................. 39
Avenues for Blending Naphtha into Gasoline ..................................................................................... 39
Scale and Flexibility in North America ................................................................................................ 40
Filling Gasoline Supply Gaps in Asia .................................................................................................... 41
More Naphtha in Middle East Gasoline .............................................................................................. 42
Secondary Units Lift Naphtha Use in FSU ........................................................................................... 43
Naphtha’s “Blend Wall” in Africa ........................................................................................................ 44
Europe Refinery Cuts Trim Naphtha Use ............................................................................................ 45
Ethanol Drives Fickle LatAm Naphtha Use .......................................................................................... 46
V. Naphtha Demand from Ethylene Production ......................................................................................... 47
A. The Global Ethylene Market and Naphtha Demand........................................................................... 47
Macroeconomic Environment ............................................................................................................ 47
Ethylene Production from Naphtha .................................................................................................... 47
B. Regional Ethylene and Naphtha Demand Analysis ............................................................................. 49
China ................................................................................................................................................... 49
Rest of Asia .......................................................................................................................................... 50
Middle East ......................................................................................................................................... 51
Europe ................................................................................................................................................. 52
North America ..................................................................................................................................... 53
Other Regions: Africa, FSU, Latin America .......................................................................................... 54
VI. Naphtha Use in Aromatics Production .................................................................................................. 55
Middle East ......................................................................................................................................... 56
Asia ...................................................................................................................................................... 57
Europe ................................................................................................................................................. 57
North America ..................................................................................................................................... 58
Other Regions: FSU, Africa and Latin America .................................................................................... 58
VII. The Global Pentanes Plus Market ......................................................................................................... 59

Naphtha Nexus: The Interaction of Global Gasoline, Naphtha and Petrochemical Markets to 2025 ESAI Energy, LLC
____________________________________________________________________________________
4
A. Growing Source of Petrochemical Feedstock ..................................................................................... 59
B. Regional Balances ............................................................................................................................... 59
North America’s Emerging Surplus ..................................................................................................... 59
Middle East ......................................................................................................................................... 61
Rest of the World ................................................................................................................................ 62
VII. Statistical Appendix .............................................................................................................................. 63
A. Prices ................................................................................................................................................... 63
B. Condensate Balances .......................................................................................................................... 64
C. Naphtha and Pentanes Balances; Gasoline and Petrochemical Analysis ........................................... 65
Global .................................................................................................................................................. 65
Africa ................................................................................................................................................... 66
Asia ...................................................................................................................................................... 67
Europe ................................................................................................................................................. 68
FSU ...................................................................................................................................................... 69
Latin America ...................................................................................................................................... 70
Middle East ......................................................................................................................................... 71
North America ..................................................................................................................................... 72
United States ....................................................................................................................................... 73
China ................................................................................................................................................... 74
Russia .................................................................................................................................................. 75
India .................................................................................................................................................... 76
Japan ................................................................................................................................................... 77
South Korea ......................................................................................................................................... 78
Brazil .................................................................................................................................................... 79
Saudi Arabia ........................................................................................................................................ 80
Canada ................................................................................................................................................ 81
Iran ...................................................................................................................................................... 82
Mexico ................................................................................................................................................. 83
Thailand ............................................................................................................................................... 84
Singapore ............................................................................................................................................ 85
Venezuela ............................................................................................................................................ 86
Kuwait ................................................................................................................................................. 87

Naphtha Nexus: The Interaction of Global Gasoline, Naphtha and Petrochemical Markets to 2025 ESAI Energy, LLC
____________________________________________________________________________________
5
Taiwan ................................................................................................................................................. 88
Indonesia ............................................................................................................................................. 89
Belgium ............................................................................................................................................... 90
United Arab Emirates .......................................................................................................................... 91
Algeria ................................................................................................................................................. 92
Australia .............................................................................................................................................. 93
Argentina ............................................................................................................................................. 94
Egypt ................................................................................................................................................... 95
Malaysia .............................................................................................................................................. 96
France .................................................................................................................................................. 97
Germany .............................................................................................................................................. 98
Italy...................................................................................................................................................... 99
Netherlands ....................................................................................................................................... 100
Spain .................................................................................................................................................. 101
United Kingdom ................................................................................................................................ 102
Turkey ............................................................................................................................................... 103
South Africa ....................................................................................................................................... 104

Naphtha Nexus: The Interaction of Global Gasoline, Naphtha and Petrochemical Markets to 2025 ESAI Energy, LLC
____________________________________________________________________________________
6
List of Figures
Figure 1: Naphtha Balances by Region ......................................................................................................... 9
Figure 2: Naphtha Demand Growth by Type and Sector ............................................................................ 10
Figure 3: Global Naphtha Balances ............................................................................................................. 11
Figure 4: USGC Gasoline and Naphtha Spreads to LLS Crude ..................................................................... 12
Figure 5: Benchmark Regional Naphtha Prices ........................................................................................... 12
Figure 6: Naphtha Use in North America .................................................................................................... 13
Figure 7: Naphtha Supply in North America ............................................................................................... 13
Figure 8: Naphtha Balances in North America ............................................................................................ 13
Figure 9: Naphtha Use in Asia ..................................................................................................................... 14
Figure 10: Naphtha Supply in Asia .............................................................................................................. 14
Figure 11: Naphtha Balances in Asia ........................................................................................................... 14
Figure 12: Naphtha Use in the Middle East ................................................................................................ 15
Figure 13: Naphtha Supply in the Middle East............................................................................................ 15
Figure 14: Naphtha Balances in the Middle East ........................................................................................ 15
Figure 15: Naphtha Use in Europe .............................................................................................................. 16
Figure 16: Naphtha Supply in Europe ......................................................................................................... 16
Figure 17: Naphtha Balances in Europe ...................................................................................................... 16
Figure 18: Naphtha Use in FSU ................................................................................................................... 17
Figure 19: Naphtha Supply in FSU ............................................................................................................... 17
Figure 20: Naphtha Balances in FSU ........................................................................................................... 17
Figure 21: Naphtha Use in Africa ................................................................................................................ 18
Figure 22: Naphtha Supply in Africa ........................................................................................................... 18
Figure 23: Naphtha Balances in Africa ........................................................................................................ 18
Figure 24: Naphtha Use in Latin America ................................................................................................... 19
Figure 25: Naphtha Supply in Latin America ............................................................................................... 19
Figure 26: Naphtha Balances in Latin America ........................................................................................... 19
Figure 27: Distillation Capacity Growth by Region ..................................................................................... 22
Figure 28: Condensate Splitter Capacity Growth by Region ....................................................................... 23
Figure 29: Growth of Throughput and Other Oil Supply ............................................................................ 24
Figure 30: Refinery Throughput Growth by Region .................................................................................... 24
Figure 31: Crude Oil Demand Growth by Quality ....................................................................................... 25
Figure 32: CDU Naphtha Supply by Region ................................................................................................. 27
Figure 33: Global CDU Naphtha Supply ...................................................................................................... 27
Figure 34: Naphtha Supply from Condensate Splitters by Region .............................................................. 28
Figure 35: Global Naphtha Production by Unit Type .................................................................................. 28
Figure 36: Asia Naphtha Production ........................................................................................................... 29
Figure 37: Asia Naphtha Production Growth by Unit Type ......................................................................... 29
Figure 38: Asia CDU Naphtha Supply .......................................................................................................... 30
Figure 39: Middle East Naphtha Production ............................................................................................... 30
Figure 40: Middle East Naphtha Production Growth by Unit Type ............................................................ 31
Figure 41: Middle East CDU Naphtha Supply .............................................................................................. 31
Naphtha Nexus: The Interaction of Global Gasoline, Naphtha and Petrochemical Markets to 2025 ESAI Energy, LLC
____________________________________________________________________________________
7
Figure 42: Europe Naphtha Production Growth by Unit Type .................................................................... 32
Figure 43: Europe CDU Naphtha Supply ..................................................................................................... 32
Figure 44: North America Naphtha Production Growth by Unit Type ....................................................... 33
Figure 45: North America CDU Naphtha Supply ......................................................................................... 33
Figure 46: Africa CDU Naphtha Supply ....................................................................................................... 34
Figure 47: Latin America CDU Naphtha Supply ........................................................................................... 34
Figure 48: FSU CDU Naphtha Supply........................................................................................................... 34
Figure 49: Global Gasoline Demand Growth .............................................................................................. 35
Figure 50: Advanced Economy Gasoline Demand Growth ......................................................................... 36
Figure 51: Non-OECD Asia Gasoline Demand Growth ................................................................................ 37
Figure 52: Non-OECD, Non-Asia Gasoline Demand Growth ....................................................................... 38
Figure 53: 2014 Global Gasoline Blending Ratios ....................................................................................... 39
Figure 54: Additional Use of Naphtha Derivatives in Global Gasoline Production ..................................... 39
Figure 55: 2014 North America Gasoline Blending Ratios .......................................................................... 40
Figure 56: Additional Use of Naphtha Derivatives in North American Gasoline ........................................ 40
Figure 57: 2014 Asia Gasoline Blending Ratios ........................................................................................... 41
Figure 58: Additional Use of Naphtha Derivatives in Asian Gasoline ......................................................... 41
Figure 59: 2014 Middle East Gasoline Blending Ratios ............................................................................... 42
Figure 60: Additional Use of Naphtha Derivatives in Middle East Gasoline ............................................... 42
Figure 61: 2014 FSU Gasoline Blending Ratios ........................................................................................... 43
Figure 62: Additional Use of Naphtha Derivatives in FSU Gasoline ............................................................ 43
Figure 63: 2014 Africa Gasoline Blending Ratios ........................................................................................ 44
Figure 64: Additional Use of Naphtha Derivatives in African Gasoline ...................................................... 44
Figure 65: 2014 Europe Gasoline Blending Ratios ...................................................................................... 45
Figure 66: Additional Use of Naphtha Derivatives in European Gasoline .................................................. 45
Figure 67: 2014 Latin America Gasoline Blending Ratios ........................................................................... 46
Figure 68: Additional Use of Naphtha Derivatives in Latin American Gasoline .......................................... 46
Figure 69: Global Ethylene Production ....................................................................................................... 48
Figure 70: Global Ethylene Naphtha Demand ............................................................................................ 48
Figure 71: China Ethylene Production from Naphtha ................................................................................. 49
Figure 72: China Ethylene Naphtha Demand .............................................................................................. 49
Figure 73: Asian Ethylene Production ......................................................................................................... 50
Figure 74: Other Asia Ethylene Demand ..................................................................................................... 50
Figure 75: Middle East Ethylene Production ............................................................................................... 51
Figure 76: Middle East Ethylene Naphtha Demand .................................................................................... 51
Figure 77: Europe Ethylene Production ...................................................................................................... 52
Figure 78: Europe Ethylene Naptha Demand ............................................................................................. 52
Figure 79: North America Ethylene Production .......................................................................................... 53
Figure 80: North America Ethylene Naphtha Demand ............................................................................... 53
Figure 81: Ethylene Production in Other Regions ....................................................................................... 54
Figure 82: Ethylene Naphtha Demand in Other Regions ............................................................................ 54
Figure 83: Global Aromatics Production by Region .................................................................................... 55

Naphtha Nexus: The Interaction of Global Gasoline, Naphtha and Petrochemical Markets to 2025 ESAI Energy, LLC
____________________________________________________________________________________
8
Figure 84: Global Aromatics Production by Feedstock Source ................................................................... 55
Figure 85: Global Aromatics Naphtha Demand .......................................................................................... 56
Figure 86: Middle East Aromatics Naphtha Demand .................................................................................. 56
Figure 87: Asia Aromatics Naphtha Demand .............................................................................................. 57
Figure 88: Europe Aromatics Naphtha Demand ......................................................................................... 57
Figure 89: North America Aromatics Naphtha Demand ............................................................................. 58
Figure 90: FSU, Africa and Latin America Aromatics Naphtha Demand ..................................................... 58
Figure 91: Global C5+ Balance .................................................................................................................... 59
Figure 92: North America C5+ Demand ...................................................................................................... 60
Figure 93: North America C5+ Balance ....................................................................................................... 61
Figure 94: Middle East C5+ Balance ............................................................................................................ 62

Naphtha Nexus: The Interaction of Global Gasoline, Naphtha and Petrochemical Markets to 2025 ESAI Energy, LLC
Overview
Naphtha is a 19 million b/d market, accounting for one fifth of global oil demand, though much of the
naphtha produced is used to produce gasoline and petrochemicals before leaving the refinery gate. Since
95 percent of naphtha and pentanes is used for the production of gasoline and petrochemicals, it goes
without saying that understanding how much demand for naphtha will grow between now and 2025
requires a detailed analysis and forecast demand from both sectors.
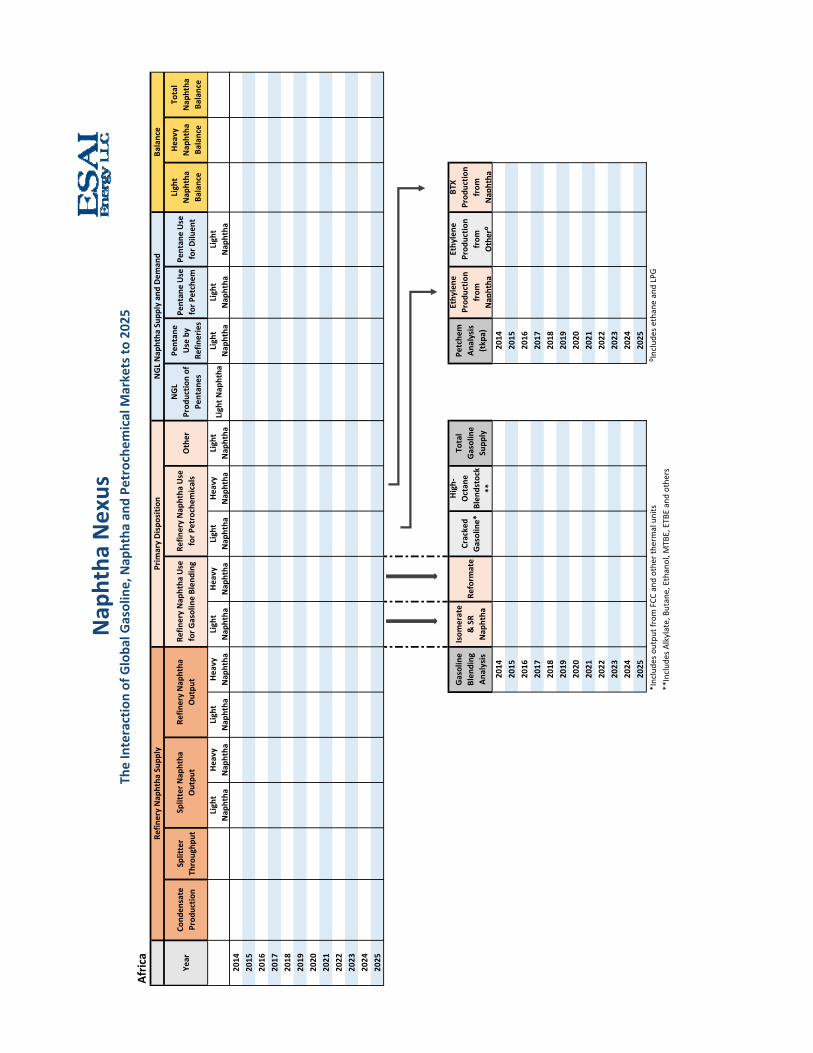
Our approach to supply-demand analysis was to
divide naphtha and pentanes into light and heavy
even though in practice a significant amount of
full-range naphtha, i.e. a mix of light and heavy,
is traded. Naphtha is classified as light or heavy
based on the number of carbon atoms in the
naphtha hydrocarbons, which can be anywhere
from 4 to 11. Petrochemical enterprises
producing ethylene favor light naphtha, which
has six or fewer carbon molecules. Heavy
naphtha with more carbon molecules is favored
for gasoline and aromatics production, though
the gasoline pool absorbs light naphtha as well.
More than 11 million b/d of naphtha are blended into the gasoline pool as reformate, isomerate and
straight-run naphtha. In this study, we lay out our forecast of light and heavy naphtha use to produce
gasoline along with the underlying analysis of the diverse blending methods across the world and of
anticipated changes in the trajectory of gasoline demand. Another 7 million b/d of light and heavy naphtha
are used to produce olefins and aromatics, respectively. Using our analysis of the future supply of
petrochemicals and the feedstocks used in that production, we explain how much petrochemical demand
will grow between 2015 and 2025.
The refinery and condensate splitter supply analysis and projections in this study draw on ESAI Energy’s
estimate of current and future crude slates of every refinery in the world, which falls within our analysis
of crude and condensate production as well as processing by quality. Pentanes from NGL fractionation are
an incremental source of light naphtha supply. This analysis includes our view of pentanes demand,
including in gasoline blending, petrochemicals and as diluent.
Lastly, price forecasts accompany our conclusions about changes in light and heavy naphtha fundamentals
and trade flows. The forecasts include ESAI Energy’s outlook to 2025 for crude prices and gasoline and
naphtha prices and spreads in the U.S. Gulf Coast, Northwest Europe and Asia. The pricing discussion
includes a brief description of future changes in gasoline spreads in the context of gasoline-diesel
dynamics affecting refining margins.
0
2,000
4,000
6,000
8,000
10,000
12,000
14,000
16,000
18,000
20,000
2015
Global Supply of Naphtha & Pentanes
HeavyNaphtha
LightNaphtha
Pentanes
('000 b/d)
Afric
a
Year
Cond
ensate
Prod
uctio
nSplitter
Throughp
utOther
NGL
Prod
uctio
n of
Pentan
es
Pentan
e Use by
Refin
eries
Pentan
e Use
for P
etchem
Pentan
e Use
for D
iluen
t
Light
Nap
htha
Ba
lance
Heavy
Nap
htha
Ba
lance
Total
Nap
htha
Ba
lance
Light
Na p
htha
Heavy
Nap
htha
Light
Nap
htha
Heavy
Nap
htha
Light
Nap
htha
Heavy
Nap
htha
Light
Nap
htha
Heavy
Nap
htha
Light
Nap
htha
Light N
aphtha
Light
Nap
htha
Light
Nap
htha
Light
Nap
htha
2014
2015
2016
2017
2018
2019
2020
2021
2022
2023
2024
2025
Gasoline
Blen
ding
An
alysis
Isom
erate
& SR
Nap
htha
Reform
ate
Cracked
Gasoline*
High‐
Octan
e Blen
dstock
**
Total
Gasoline
Supp
ly
Petche
m
Analysis
(tkp
a)
Ethylene
Prod
uctio
n from
Na p
htha
Ethylene
Prod
uctio
n from
Other⁰
BTX
Prod
uctio
n from
Na p
htha
2014
2014
2015
2015
2016
2016
2017
2017
2018
2018
2019
2019
2020
2020
2021
2021
2022
2022
2023
2023
2024
2024
2025
2025
*Include
s outpu
t from FCC
and
other th
ermal units
⁰Include
s ethane and LPG
**Includ
es Alkylate, Butane, Ethanol, M
TBE, ETB
E and othe
rs
Splitter N
aphtha
Outpu
tRe
finery Nap
htha
Outpu
t Re
finery Nap
htha
Use
for G
asoline Blen
ding
Refin
ery Nap
htha
Use
for P
etrochem
icals
Nap
htha
Nexus
The Interaction of Globa
l Gasoline, Nap
htha
and
Petrochem
ical M
arkets to
202
5
Refin
ery Nap
htha
Sup
ply
Prim
ary Dispo
sitio
nNGL Nap
htha
Sup
ply an
d Dem
and
Balance

South Ko
rea
Year
Cond
ensate
Prod
uctio
nSplitter
Throughp
utOther
NGL
Prod
uctio
n of
Pentan
es
Pentan
e Use by
Refin
eries
Pentan
e Use fo
r Pe
tche
m
Pentan
e Use fo
r Dilu
ent
Light
Nap
htha
Ba
lance
Heavy
Nap
htha
Ba
lance
Total
Nap
htha
Ba
lance
Light
Na p
htha
Heavy
Nap
htha
Light
Nap
htha
Heavy
Nap
htha
Light
Nap
htha
Heavy
Nap
htha
Light
Nap
htha
Heavy
Nap
htha
Light
Nap
htha
Light
Nap
htha
Light
Nap
htha
Light
Nap
htha
Light
Nap
htha
2014
2015
2016
2017
2018
2019
2020
2021
2022
2023
2024
2025
Gasoline
Blen
ding
An
alysis
Isom
erate
& SR
Nap
htha
Reform
ate
Cracked
Gasoline*
High‐Octan
e Blen
dstock**
Total
Gasoline
Supp
ly
2014
2015
2016
2017
2018
2019
2020
2021
2022
2023
2024
2025
*Include
s outpu
t from FCC
and
other th
ermal units
**Includ
es Alkylate, Butane, Ethanol, M
TBE, ETB
E and othe
rs
Splitter N
aphtha
Outpu
tRe
finery Nap
htha
Outpu
t Re
finery Nap
htha
Use
for G
asoline Blen
ding
Refin
ery Nap
htha
Use fo
r Pe
troche
micals
Nap
htha
Nexus
The Interaction of Globa
l Gasoline, Nap
htha
and
Petrochem
ical M
arkets to
202
5
Refin
ery Nap
htha
Sup
ply
Prim
ary Dispo
sitio
nNGL Nap
htha
Sup
ply an
d Dem
and
Balance

Invoice To:
Name:
Company:
Title:
Address:
Address 2:
City: State: Country: Postal Code:
Phone: Fax:
Email:
About ESAI Energy LLC
ESAI Energy, LLC is an energy research and forecasting firm that focuses on global petroleum, alternative fuels and natural gas markets. The firm is an affiliate of Energy Security Analysis, Inc, which has conducted energy market analysis and price forecasting since the mid-1980s.
ESAI Energy’s petroleum, alternative fuel and natural gas analysis and forecasting is based on a data-heavy methodology that is designed to integrate available data with the expert judgment of regional specialists to determine supply and demand trends by product and coun-try. Using actual data and estimates where data are unavailable, ESAI Energy’s regional analysts maintain historical databases for a varie-ty of industry attributes: consumption, production, quality and inventories for crude oil and each of the main petroleum products, refin-ery capacity and throughput, alternative fuels supply and demand, and petrochemical and midstream blending inputs. Using these data, information and understanding of language and political economy in each region, analysts forecast developments in these markets from one week to 25 years.
The quantitative supply/demand analysis is complemented by detailed political, regulatory, and industrial analysis. ESAI Energy maintains a database of environmental specifications, taxes, tariffs and subsidies, and combines that information with ongoing political, financial, and regulatory research to determine future market trends in countries and regions. In addition, we study and interpret key geopolitical developments that impact the global energy markets.
ESAI Energy produces multi-client studies like Naphtha Nexus several times per year. In addition, we provide our retainer clients, who include energy companies and national governments all over the world, with ongoing market analysis and forecasting.
ESAI Energy LLC | 401 Edgewater Place, Suite640 | Wakefield, MA 01880 | +1.781.245.2036
www.esai.com
Naphtha Nexus:
The Interaction of Global Gasoline, Naphtha
and Petchem Markets 2025
3 Ways to Order:
Phone: +1.781.245.2036 to speak with
Tom Lovett
Fax: Complete this order form and send
to +1.781.245.8706
Email: Please send email form infor-
mation to [email protected]
Credit Card Orders call +1-781-245-2036
ask for Kathy Cooper
Deliverables:
PDF copy of 100 Page report and appendix tables, emailed
Direct access to ESAI Energy analysts for questions pertaining to the study
Appendix Data Tables of Regional and 30 Individual Countries delivered in Excel
For more information, contact:
ESAI Energy LLC
401 Edgewater Place, Suite 640, Wakefield, MA 01880
Tel: +1-781-245‐2036, Fax: +1-781-245‐8706
www.esai.com
©2016, ESAI Energy LLC.