study: unconventional gas and oil drilling is associated with increased hospital utilization rates
TRANSCRIPT

RESEARCH ARTICLE
Unconventional Gas and Oil Drilling IsAssociated with Increased HospitalUtilization RatesThomas Jemielita1☯, George L. Gerton2☯, Matthew Neidell3, Steven Chillrud4,Beizhan Yan4, Martin Stute4, Marilyn Howarth2, Pouné Saberi2, Nicholas Fausti2, TrevorM. Penning2, Jason Roy1, Kathleen J. Propert1, Reynold A. Panettieri, Jr.2*
1 Department of Biostatistics, University of Pennsylvania Perelman School of Medicine, Philadelphia,Pennsylvania, United States of America, 2 Center of Excellence in Environmental Toxicology (CEET),Airways Biology Initiative, University of Pennsylvania Perelman School of Medicine, Philadelphia,Pennsylvania, United States of America, 3 Department of Health Policy and Management, Mailman Schoolof Public Health, Columbia University, New York, New York, United States of America, 4 Lamont-DohertyEarth Observatory of Columbia University, Palisades, New York, United States of America
☯ These authors contributed equally to this work.* [email protected]
AbstractOver the past ten years, unconventional gas and oil drilling (UGOD) has markedly
expanded in the United States. Despite substantial increases in well drilling, the health con-
sequences of UGOD toxicant exposure remain unclear. This study examines an associa-
tion between wells and healthcare use by zip code from 2007 to 2011 in Pennsylvania.
Inpatient discharge databases from the Pennsylvania Healthcare Cost Containment Coun-
cil were correlated with active wells by zip code in three counties in Pennsylvania. For over-
all inpatient prevalence rates and 25 specific medical categories, the association of
inpatient prevalence rates with number of wells per zip code and, separately, with wells per
km2 (separated into quantiles and defined as well density) were estimated using fixed-
effects Poisson models. To account for multiple comparisons, a Bonferroni correction with
associations of p<0.00096 was considered statistically significant. Cardiology inpatient
prevalence rates were significantly associated with number of wells per zip code
(p<0.00096) and wells per km2 (p<0.00096) while neurology inpatient prevalence rates
were significantly associated with wells per km2 (p<0.00096). Furthermore, evidence also
supported an association between well density and inpatient prevalence rates for the medi-
cal categories of dermatology, neurology, oncology, and urology. These data suggest that
UGOD wells, which dramatically increased in the past decade, were associated with
increased inpatient prevalence rates within specific medical categories in Pennsylvania.
Further studies are necessary to address healthcare costs of UGOD and determine whether
specific toxicants or combinations are associated with organ-specific responses.
PLOS ONE | DOI:10.1371/journal.pone.0131093 July 15, 2015 1 / 18
a11111
OPEN ACCESS
Citation: Jemielita T, Gerton GL, Neidell M, ChillrudS, Yan B, Stute M, et al. (2015) Unconventional Gasand Oil Drilling Is Associated with Increased HospitalUtilization Rates. PLoS ONE 10(7): e0131093.doi:10.1371/journal.pone.0131093
Editor: Jaymie Meliker, Stony Brook University,Graduate Program in Public Health, UNITEDSTATES
Received: February 2, 2015
Accepted: May 28, 2015
Published: July 15, 2015
Copyright: © 2015 Jemielita et al. This is an openaccess article distributed under the terms of theCreative Commons Attribution License, which permitsunrestricted use, distribution, and reproduction in anymedium, provided the original author and source arecredited.
Data Availability Statement: All relevant data areavailable in the paper and its Supporting Informationfiles.
Funding: This work was funded by grants from theNational Institute of Environmental Health Sciences(www.niehs.nih.gov): P30-ES013508 (GLG MH PSNF TMP JR KJP RAP) and P30-ES009089 (GLG MNSC BY MS MH PS NF TMP JR KJP RAP). Thefunders had no role in study design, data collectionand analysis, decision to publish, or preparation ofthe manuscript.

IntroductionThe United States now leads the world in producing natural gas from shale formations. Shalegas accounted for 40% of all natural gas produced in 2012 [1–4]. In comparison to the early2000s, natural gas production in the US has increased with more than a 30% increase in pro-duction, due in part to the cost-effective combination of horizontal drilling and hydraulic frac-turing [1–4].
Unconventional gas and oil drilling (UGOD), including hydraulic fracturing or “fracking”,refers to all activities that extract natural gas and oil from rock formations. At distances from 1to 2 miles below the earth’s surface, tight rock formations impede natural gas and oil flow intoa drill-hole [3]. Common reservoirs that contain natural gas and oils include: porous sand-stones, limestones, dolomite rocks, shale rocks, and coal beds. Hydraulic fracturing and hori-zontal drilling methods can effectively extract these resources. Typically, after drilling iscomplete, fissures are formed using a perforating gun; a mixture of water, proppants andhydraulic fracturing chemicals is then pumped into the rock [3,5]. Consequently, the fissuresremain open to liberate the gas. These substances as well as contaminants released from theshale are present in the flowback water. Contaminants include naturally occurring radioactivematerials [3,4], toxic organics and metals that may enter ground water, contaminating watersupplies especially if leakage occurs from casement failure or from holding ponds for wastewater [6,7]. Other toxicants and volatile organic compounds, such as benzene, ethylbenzene,toluene and xylene or radionuclides, have been seen in ground waters impacted by UGODspills [8] or surface waters receiving UGOD-related waste water [9]. The general lack of pub-lished baseline (i.e., pre-UGOD) data has limited efforts to associate contamination in drinkingwater wells to UGOD activities [10]. Additionally, exhaust produced by diesel trucks and off-site diesel engines, as well as emissions from other UGOD activities (e.g., venting, flaring, com-pressor stations, etc.) may also affect local air quality with potential impact on health [11–13].Plausibly, increased noise pollution, truck traffic, and psychosocial stress due to communitychange, which occur due to increased hydro-fracking activity, could impact public health [11].
Despite the growth in hydraulic fracturing, the health consequences of UGOD are unclear[3,4,14,15]. In Pennsylvania (PA), a rise in hydraulic fracturing has raised health concerns,especially since the Marcellus Shale formation underlies two-thirds of Pennsylvania [16]. Innortheastern Pennsylvania, most wells were drilled for dry gas rather than gas and oil [17]. Wepostulate that increases in active or producing wells in Pennsylvania from 2007 to 2011 areassociated with increases in inpatient prevalence rates. Three counties, which lie on the Marcel-lus Shale formation along the northern border of PA, were chosen for this study: Bradford, Sus-quehanna, and Wayne. Importantly, zip codes in Bradford and Susquehanna Countiessignificantly increased UGOD over this time period. These counties are some of the greatestproducers of natural gas in Pennsylvania, generating 489 million cubic feet of natural gas from598 wells in 2011 [18]. In contrast, zip codes in Wayne County have no active wells [18]. Spe-cifically, we evaluated the association between inpatient prevalence rates and well densitywithin 25 different medical categories, as well as overall inpatient prevalence rates.
Materials and MethodsThis study is an ecological study with the goal of assessing the association between hydro-fracking activity and health care use. Zip code specific inpatient counts were obtained from thetime frame of 2007–2011. Only zip codes from the counties Bradford, Susquehanna, andWayne were considered. For our analysis, only inpatient records for people who resided in oneof these three counties were included. Inpatient records of people who came to a hospital inthese counties, but did not reside in one of these counties, were excluded. These counties were
Hydraulic Fracturing and Hospitalization Use
PLOS ONE | DOI:10.1371/journal.pone.0131093 July 15, 2015 2 / 18
Competing Interests: The authors have declaredthat no competing interests exist.

of particular interest, since Wayne had no hydro-fracking activity between 2007 and 2011, whileBradford and Susquehanna saw increased hydro-fracking activity. Inpatient counts were thenconverted into inpatient prevalence rates (details in Statistical Methods). Furthermore, for eachzip code, we obtained the number of wells for each year in 2007–2011. In total, there were 67 zipcodes considered, with five inpatient prevalence rates/well counts each. Inpatient prevalencerates were the primary outcome of interest with wells as the primary predicator of interest.
Health Utilization DataTruven Health Analytics (THA) purchased UB92/UB04 inpatient discharge datasets from thePennsylvania Health Care Cost Containment Council (PHC4). The PHC4 datasets contain allinpatient hospital discharge records, including those for psychiatric and/or behavioral health,rehabilitation, and drug and alcohol treatment, for patients hospitalized in Pennsylvania.Skilled nursing facility (SNF), swing bed, transitional care unit, 23-hour observation, and hos-pice records are not included. After receipt of state discharge datasets, THA decoded suppliedvalues, checked the validity of information submitted and standardized the format. The ICD-9diagnosis codes and MSDRGs included in the data pulls can be found in S1 Table, in the sup-plemental material section.
Truven Health pulled discharge records for patients residing in any of the Bradford, Susque-hanna, and Wayne County zip codes for calendar years 2007, 2008, 2009, 2010, and 2011.Treatment records for those patients hospitalized outside of Pennsylvania were not captured.In addition, THA excluded patient records for those patients with dentistry, HIV, and neuro-surgery DRGs.
Insurance Coverage Estimates (ICE) OverviewICE reports by THA showed the total number of people covered by seven different types ofinsurance by zip code, age group, and sex for every market in the United States. The seven dif-ferent types of insurance are Medicaid, Medicare, dual eligible, private employer sponsored,private exchanges, private direct, and uninsured. Every person in a zip code who is a resident isassigned an insurance category based on his or her primary insurance coverage. Only non-resi-dents of zip codes were excluded from the analysis.
Demographics MethodologyTHA acquires all of its demographic data from The Nielsen Company statistics for every zipcode in the United States. Nielsen bases their estimates on products of the United States CensusBureau, including the 2010 Census Summary File 1 (SF1). Details of the methodology and defi-nitions used to create the SF1 data, including field definitions and the 2010 Census question-naire, are available in the Census 2010 Data Definitions publication [19].
Mapping of Unconventional GasWells in Bradford and SusquehannaCounties in PennsylvaniaTo create maps of the unconventional gas well locations, the complete data set for 2000–2013was downloaded as comma separated values (CSV) from the Pennsylvania Department ofEnvironmental Protection Oil and Gas Reporting Website [20] and imported into FileMakerPro Advanced 13.0.v.3 for further processing. For Fig 1, the data were filtered for unconven-tional, drilled wells that produced gas in the noted year. We use the state’s categorization, suchthat: “An unconventional gas well is a well that is drilled into an unconventional formation,which is defined as a geologic shale formation below the base of the Elk Sandstone or its
Hydraulic Fracturing and Hospitalization Use
PLOS ONE | DOI:10.1371/journal.pone.0131093 July 15, 2015 3 / 18

Fig 1. Pennsylvania active wells over time. Pennsylvania active wells in Bradford and SusquehannaCounties increased markedly from 2007 to 2011. Wells are shown as colored dots. From 2007 to 2011,Wayne County effectively had no active wells. Insert in the first panel shows location of Bradford,Susquehanna andWayne Counties within Pennsylvania.
doi:10.1371/journal.pone.0131093.g001
Hydraulic Fracturing and Hospitalization Use
PLOS ONE | DOI:10.1371/journal.pone.0131093 July 15, 2015 4 / 18

geologic equivalent where natural gas generally cannot be produced except by horizontal orvertical well bores stimulated by hydraulic fracturing.” These data were exported as a DBF fileand imported into ESRI ArcGIS v.10.2 to map the locations of the producing wells. In anygiven year, only wells that produced gas in that year are shown in Fig 1. For example, if a wellproduced gas in 2007 but did not in 2011, then this well would only appear on the 2007, butnot on the 2011 map.
Statistical AnalysisStatistical analysis was performed using STATA 13 software (StataCorp LP, College Station,Texas). Our data included the number of wells and inpatient counts for all combinations ofyear, medical category (25 total), and zip code within the three chosen counties in PA. In total,after excluding eight zip codes that had no available population information, 67 zip codes wereconsidered. Only inpatient counts for patients that resided in one of three counties were con-sidered. For each zip code, population and total area per square kilometer (km) data wereobtained from the US Census 2010. Importantly, zip code specific population and total areaper square km were the same for each year in 2007–2011. Number of wells is defined as thenumber of wells within a specific zip code for a certain year. All data are generated from activewells. We assume that once a well is active in 2007, this same well remains active for the timeframe of 2007–2011. For example, if there are 3 wells in 2007 and 8 wells in 2008 for some zipcode, then we assume that there were an additional 5 wells created between 2007 and 2008.This is in contrast to the definition of active wells for the mapping, where a well can move frombeing active to inactive in any given year in 2007–2011. Given the 5-year observation period,very few active wells became inactive. In addition, the actual date of inactivity could not beaccurately defined. Furthermore, it is possible that once a well becomes inactive, it could stillimpact the surrounding community for some period of time. Thus, for the statistical analysis,once an active well enters at any given year, we assume the well remains active for the remain-der of the years. In addition to the count of wells, we also generated wells per square km (wells/km2), which is the number of wells divided by the total area per square km (at the zip codelevel); we defined this variable as well density. We analyzed both exposure variables (count anddensity) because, a priori, it was unclear whether the number of wells or the density of wellswould have a stronger association with health outcomes. Zip code specific inpatient prevalencerates for each medical category (and overall) were calculated by dividing the zip code specificnumber of inpatient counts per year by the population of the zip code. The inpatient prevalencerates were then converted into prevalence rates per year per 100 people and treated as the pri-mary outcome for modeling. We now refer to prevalence rates per year per 100 people whenwe discuss inpatient prevalence rates.
Since we examined a relatively brief interval of time (2007–2011), we postulated that in agiven zip code, inpatient prevalence rates would be relatively stable. Our goal was to obtain anun-confounded estimate of the association between inpatient prevalence rates and wells. How-ever, it is possible that observable or unobservable zip code characteristics will be correlatedwith wells and inpatient prevalence rates. Accordingly, we used conditional fixed effects Pois-son regression, where the fixed effects are the zip codes. This controls for all possible character-istics of the zip codes, both measured and unmeasured, that did not change during the periodof observation. Thus, if zip codes that consistently have high rates of inpatient prevalence ratesare more likely to have more wells over time, this will be accounted for in the model. Alterna-tively, if there are zip code-level changes from 2007–2011 that affect the number of wells andinpatient prevalence rates, this model will not account for this. Essentially, our methodologycaptures the association between and within zip code changes in wells and inpatient prevalence
Hydraulic Fracturing and Hospitalization Use
PLOS ONE | DOI:10.1371/journal.pone.0131093 July 15, 2015 5 / 18

rates. Furthermore, to account for potential over-dispersion, we use robust standard errors[21]. These robust standard errors are cluster-robust estimates, where the clusters are the indi-vidual zip codes in this case. Two sets of analyses are then done to investigate the relationshipbetween inpatient prevalence rates and wells.
The first set of analyses relates inpatient prevalence rates to number of wells. Exploratoryanalyses suggested that the relationship between the log of the inpatient prevalence rates (Pois-son model uses a log link) and number of wells was linear. Thus, for these analyses, predictionvariables were the number of wells and year (2007–2011). This assumes a linear relationshipbetween number of wells and inpatient prevalence rates, as well as a linear association betweeninpatient prevalence rates and year. Note that the primary predictor of interest was the numberof wells. This will be referred to as the number of wells analysis.
Furthermore, while exploratory analyses suggested a linear relationship between the log ofinpatient prevalence rates and number of wells, we also reasoned that a quadratic relationshipbetween the log of inpatient prevalence rates and number of wells was plausible. Subsequently,we also examined whether there exists a non-linear relationship between number of wells andinpatient prevalence rates. Accordingly, a second model incorporated a quadratic relationshipbetween number of wells and inpatient prevalence rates, for each medical category and overall.Prediction variables within this model were year (2007–2011)/wells, and wells2.
The second set of analyses relates inpatient prevalence rates to wells/km2 (well density).However, the relationship between inpatient prevalence rates and well density is highly non-linear and heavily influenced by observations that have extremely high wells/km2. For example,one zip code located in Bradford had 16.9 wells/km2 and 23.4 wells/km2 in 2010 and 2011,respectively, while 99% of all wells/km2 observations had fewer than 4.28 wells/km2. Subse-quently, we opted to separate wells/km2 into four levels based on quantiles as shown in Table 1.We set Q0wells to be the reference category and all the other levels (Q1wells, Q2wells, Q3wells)to have separate dummy variables. This will be referred to as the quantile analysis.
Our analysis investigates the association of increasing wells/km2 on inpatient prevalencerates, while allowing for separate associations depending on the magnitude of well/km2. We,however, recognize that by using quantiles, we lose information and cannot make inference onexplicit changes in well density. Furthermore, while our cut-offs are somewhat arbitrary, thegoal is to determine whether increased well density is positively associated with inpatient prev-alence rates, which is accomplished by this modeling approach. Overall, the primary predictorsfor this set of analyses included Q1wells, Q2wells, Q3wells, and year. We test the overall Waldtest that the coefficients Q1wells = Q2wells = Q3wells = 0.
For all analyses, risk ratios were obtained by taking the exponential of the regression coeffi-cient estimates. Year is recoded into 2007 = 0, 2008 = 1, 2009 = 2, 2010 = 3, and 2011 = 4. Wemodel each medical category separately as well as the overall inpatient prevalence rates, for atotal of 26 models per set of analyses. Furthermore, to adjust for multiple comparisons, we usea Bonferroni correction to adjust for testing 25 different medical categories and overall inpa-tient prevalence rates in both sets of analyses (52 tests). Using an initial level of significance of
Table 1. Definition of quantiles by wells/km2.
Q0wells Q1wells Q2wells Q3wells
wells/km2 0 (0, 0.168] (0.168, 0.786] >0.786
Quantile (0, 65.97] (65.97, 80] (80, 90.15] (90.15, 100]
Note: (A, B] indicates that A is excluded from the range, and B is included.
doi:10.1371/journal.pone.0131093.t001
Hydraulic Fracturing and Hospitalization Use
PLOS ONE | DOI:10.1371/journal.pone.0131093 July 15, 2015 6 / 18
0.05, this means we reject the null hypothesis that wells are not associated with hospitalizationsfor p<0.00096.
Sensitivity analyses were also performed to determine if removing a specific zip code withmuch higher inpatient prevalence rates or with much higher well density affected inference.Thus, we removed the specific zip code(s) and recalculated the conditional fixed effects Poissonmodels, checking to see if the general inference changed.
All of the data obtained for this study were received anonymized and de-identified fromTruven Health Analytics. The data were provided as summary information, and there were nounique identifiers. The University of Pennsylvania Committee on the Study of Human Subjectsdeemed this work non-human subject research.
Results
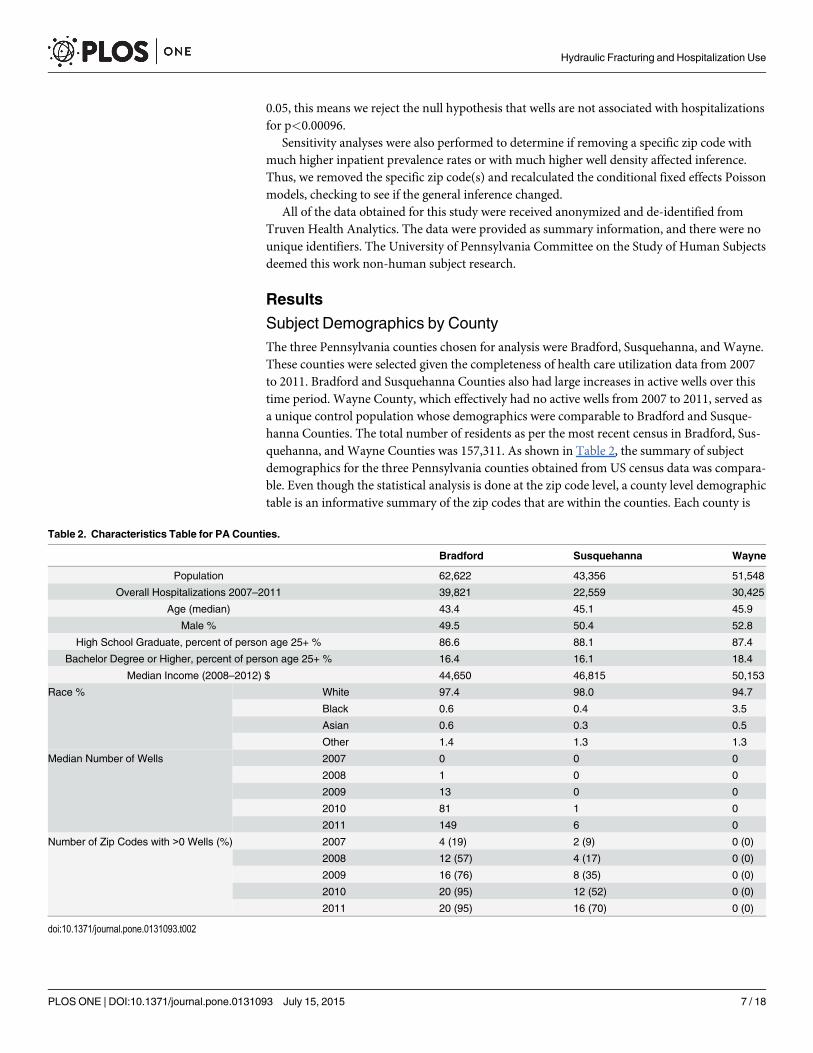
Subject Demographics by CountyThe three Pennsylvania counties chosen for analysis were Bradford, Susquehanna, and Wayne.These counties were selected given the completeness of health care utilization data from 2007to 2011. Bradford and Susquehanna Counties also had large increases in active wells over thistime period. Wayne County, which effectively had no active wells from 2007 to 2011, served asa unique control population whose demographics were comparable to Bradford and Susque-hanna Counties. The total number of residents as per the most recent census in Bradford, Sus-quehanna, and Wayne Counties was 157,311. As shown in Table 2, the summary of subjectdemographics for the three Pennsylvania counties obtained from US census data was compara-ble. Even though the statistical analysis is done at the zip code level, a county level demographictable is an informative summary of the zip codes that are within the counties. Each county is
Table 2. Characteristics Table for PA Counties.
Bradford Susquehanna Wayne
Population 62,622 43,356 51,548
Overall Hospitalizations 2007–2011 39,821 22,559 30,425
Age (median) 43.4 45.1 45.9
Male % 49.5 50.4 52.8
High School Graduate, percent of person age 25+ % 86.6 88.1 87.4
Bachelor Degree or Higher, percent of person age 25+ % 16.4 16.1 18.4
Median Income (2008–2012) $ 44,650 46,815 50,153
Race % White 97.4 98.0 94.7
Black 0.6 0.4 3.5
Asian 0.6 0.3 0.5
Other 1.4 1.3 1.3
Median Number of Wells 2007 0 0 0
2008 1 0 0
2009 13 0 0
2010 81 1 0
2011 149 6 0
Number of Zip Codes with >0 Wells (%) 2007 4 (19) 2 (9) 0 (0)
2008 12 (57) 4 (17) 0 (0)
2009 16 (76) 8 (35) 0 (0)
2010 20 (95) 12 (52) 0 (0)
2011 20 (95) 16 (70) 0 (0)
doi:10.1371/journal.pone.0131093.t002
Hydraulic Fracturing and Hospitalization Use
PLOS ONE | DOI:10.1371/journal.pone.0131093 July 15, 2015 7 / 18
one data point, so no formal statistical comparison is possible. There were no striking differ-ences among the three counties. The subjects were predominantly Caucasian with few peopleobtaining higher than a high school diploma. Further, the median income was similar amongthe counties. Table 2 also illustrates the growth in hydro-fracking activity from 2007 to 2011for Bradford and Susquehanna. By 2011, 95% of the zip codes in Bradford had at least one well,while 70% of the zip codes in Susquehanna had at least one well.
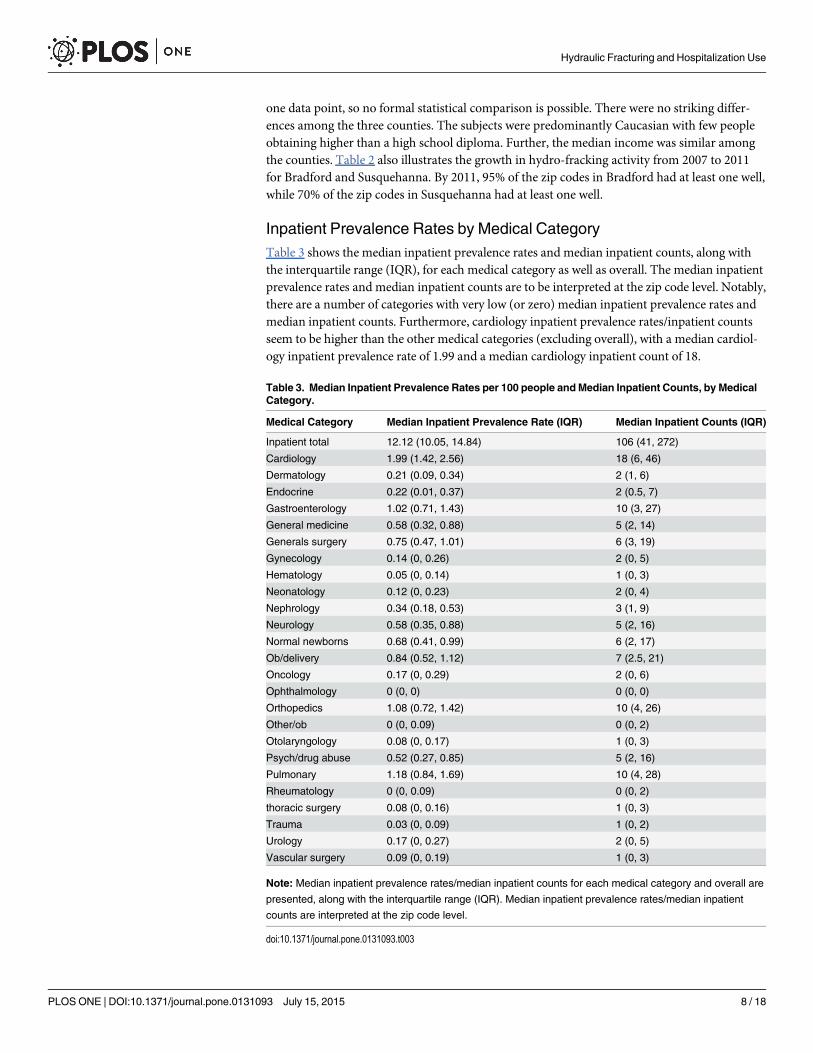
Inpatient Prevalence Rates by Medical CategoryTable 3 shows the median inpatient prevalence rates and median inpatient counts, along withthe interquartile range (IQR), for each medical category as well as overall. The median inpatientprevalence rates and median inpatient counts are to be interpreted at the zip code level. Notably,there are a number of categories with very low (or zero) median inpatient prevalence rates andmedian inpatient counts. Furthermore, cardiology inpatient prevalence rates/inpatient countsseem to be higher than the other medical categories (excluding overall), with a median cardiol-ogy inpatient prevalence rate of 1.99 and a median cardiology inpatient count of 18.
Table 3. Median Inpatient Prevalence Rates per 100 people andMedian Inpatient Counts, by MedicalCategory.
Medical Category Median Inpatient Prevalence Rate (IQR) Median Inpatient Counts (IQR)
Inpatient total 12.12 (10.05, 14.84) 106 (41, 272)
Cardiology 1.99 (1.42, 2.56) 18 (6, 46)
Dermatology 0.21 (0.09, 0.34) 2 (1, 6)
Endocrine 0.22 (0.01, 0.37) 2 (0.5, 7)
Gastroenterology 1.02 (0.71, 1.43) 10 (3, 27)
General medicine 0.58 (0.32, 0.88) 5 (2, 14)
Generals surgery 0.75 (0.47, 1.01) 6 (3, 19)
Gynecology 0.14 (0, 0.26) 2 (0, 5)
Hematology 0.05 (0, 0.14) 1 (0, 3)
Neonatology 0.12 (0, 0.23) 2 (0, 4)
Nephrology 0.34 (0.18, 0.53) 3 (1, 9)
Neurology 0.58 (0.35, 0.88) 5 (2, 16)
Normal newborns 0.68 (0.41, 0.99) 6 (2, 17)
Ob/delivery 0.84 (0.52, 1.12) 7 (2.5, 21)
Oncology 0.17 (0, 0.29) 2 (0, 6)
Ophthalmology 0 (0, 0) 0 (0, 0)
Orthopedics 1.08 (0.72, 1.42) 10 (4, 26)
Other/ob 0 (0, 0.09) 0 (0, 2)
Otolaryngology 0.08 (0, 0.17) 1 (0, 3)
Psych/drug abuse 0.52 (0.27, 0.85) 5 (2, 16)
Pulmonary 1.18 (0.84, 1.69) 10 (4, 28)
Rheumatology 0 (0, 0.09) 0 (0, 2)
thoracic surgery 0.08 (0, 0.16) 1 (0, 3)
Trauma 0.03 (0, 0.09) 1 (0, 2)
Urology 0.17 (0, 0.27) 2 (0, 5)
Vascular surgery 0.09 (0, 0.19) 1 (0, 3)
Note: Median inpatient prevalence rates/median inpatient counts for each medical category and overall are
presented, along with the interquartile range (IQR). Median inpatient prevalence rates/median inpatient
counts are interpreted at the zip code level.
doi:10.1371/journal.pone.0131093.t003
Hydraulic Fracturing and Hospitalization Use
PLOS ONE | DOI:10.1371/journal.pone.0131093 July 15, 2015 8 / 18
Geographic Location of Wells from 2007 to 2011Given the demand in accessing the Marcellus Shale for UGOD, we next examined the activewells over time. There was a dramatic increase in the number of active wells from 2007 to 2011as shown in Fig 1. In Bradford and Susquehanna Counties, there were substantial increases inthe total numbers of wells with two zip codes having the greatest number of wells with 400 and395, respectively. In Wayne County, there were no active wells from 2007 to 2011. The mostdramatic increases were in Bradford County where wells were acquired more uniformly thanthose in Susquehanna County, where active wells were primarily located in the southwest cor-ner as shown in Fig 1. Gas production tracked with increasing active well numbers from 2007–2013 as shown in Fig 2. These data suggest that if UGOD continues at the rates observedbetween 2007 and 2011, well densities are likely to continue to increase. Within the counties,there were also profound differences in wells by zip code. For example, in 2011, 31 zip codeshad no wells, but 17 zip codes had at least 100 wells.
Increases in Active Wells Are Associated with Increases in InpatientPrevalence RatesGiven the rapid increase in wells, we reasoned that increases in wells were associated withchanges in inpatient prevalence rates. Of the 67 zip codes examined in the three counties, totalinpatient counts from 2007 to 2011 were 92,805. There was marked variation in inpatient prev-alence rates across zip codes. Specifically, one zip code had a much higher combined inpatientrate as compared with others as shown in Fig 3. Fig 3 also shows that, within each zip code, thecontribution by year was comparable, suggesting that within each zip code, the inpatient ratesare relatively stable from 2007–2011 Indeed, the average overall inpatient prevalence rates for2007–2011 are, respectively, 15.18, 15.30, 14.86, 14.00, 14.25. This indicates that on average,zip code overall inpatient prevalence rates were relatively stable or possibly declining from2007 to 2011, which mirrors national trends [22]. Fig 4 shows how in 2007, 91% (61/67) of zipcodes had no wells. However, by 2011, only 46% (31/67) of zip codes had no wells while 54% ofzip codes had least 1 well. Notably, many zip codes had a large number of wells by 2011. 28%(19/67) of zip codes had greater than 0.79 wells/km2, which equates to 79 wells for every 100km2. Importantly, Fig 4 corresponds to the quantile analysis.
To further understand health consequences by disease category, we modeled the 25 top spe-cific medical categories and total inpatients, investigating the association between number ofwells and inpatient prevalence rates and the association between well density and inpatientprevalence rates. Only cardiology inpatient prevalence rates were significantly associated withnumber of wells, taking into account our Bonferroni correction (p<0.00096) as shown inTable 4. While other medical categories did not strictly meet the Bonferroni correction bound-ary, a positive association of well number with inpatient prevalence rates within dermatology,neonatology, neurology, oncology, and urology was also evident. Cardiology and neurologyinpatient prevalence rates were also significantly associated with well density as shown inTable 5. Furthermore, these results suggest an almost monotonic increase in the impact of welldensity on cardiology inpatient prevalence rates, considering how the risk ratio increases mov-ing from quantiles (Q1wells to Q2wells to Q3wells). Evidence also suggests that well densitywas positively associated within the medical categories of dermatology, endocrine, neurology,oncology, urology, as well as overall inpatient prevalence rates (p =< 0.05). Furthermore, forboth sets of analyses, the year variable is significantly and negatively associated with inpatientprevalence rates, within the medical categories of gynecology and orthopedics.
In both the number of wells analyses and the well density quantile analyses, cardiology inpa-tient prevalence rates were significantly associated with wells. Under the quantile analyses,
Hydraulic Fracturing and Hospitalization Use
PLOS ONE | DOI:10.1371/journal.pone.0131093 July 15, 2015 9 / 18

Fig 2. Gas production (histogram) linearly tracked with well number (open circles) from 2007–2011.
doi:10.1371/journal.pone.0131093.g002
Hydraulic Fracturing and Hospitalization Use
PLOS ONE | DOI:10.1371/journal.pone.0131093 July 15, 2015 10 / 18

neurology inpatient prevalence rates were also significantly associated with well density. Also,both sets of analyses show evidence that dermatology, neurology, oncology, and urology inpa-tient prevalence rates were positively associated with wells. While only the number of wellsanalyses showed evidence of a positive association between wells and neonatology inpatientprevalence rates, our findings are consistent with other reports suggesting that such illnessesare linked with hydro-fracking [12].
A quadratic association between number of wells and inpatient prevalence rates was alsoexplored. A quadratic relationship seemed to fit the data better than a linear relationshipbetween number of wells and inpatient prevalence rates, within the ophthalmology and neurol-ogy categories, where the p-value for the quadratic number of wells term was, respectively, 0.04
Fig 3. Total inpatient rates by zip code. Total inpatient prevalence rates by zip code. From 2007 to 2011, within a zip code, inpatient prevalence rates arerelatively stable.
doi:10.1371/journal.pone.0131093.g003
Hydraulic Fracturing and Hospitalization Use
PLOS ONE | DOI:10.1371/journal.pone.0131093 July 15, 2015 11 / 18

and 0.004. However, these did not meet the Bonferroni threshold. Furthermore, given Table 3and the sparsity of ophthalmology inpatient prevalence rates (first three quartiles have no inpa-tient prevalence rates), it seems unlikely that inference is valid for the ophthalmology models.Given this weak evidence of a quadratic association, results for the quadratic number of wellsmodels are not shown.
In our analysis, one particular zip code had extremely high inpatient prevalence rates com-pared to other zip codes. Thus, a sensitivity analysis was performed (data not shown). This zipcode is located within Wayne County and had no active wells from 2007 to 2011. Removal ofthis zip code from the analysis had little effect on either the number of wells or the quantileanalyses, and there was no change in inference and the estimated risk ratios. Next, a zip code inBradford had extremely high wells/km2 in 2010 and 2011, 16.9 wells/km2 and 23.4 wells/km2,respectively. Consequently, we explored both sets of analyses without this zip code to
Fig 4. Well density (quantiles) by year.Number of zip codes by well density (quantiles) is presented for each year. In 2007, the majority of zip codes haveno wells, but by 2011, the majority of zip codes have at least 1 well.
doi:10.1371/journal.pone.0131093.g004
Hydraulic Fracturing and Hospitalization Use
PLOS ONE | DOI:10.1371/journal.pone.0131093 July 15, 2015 12 / 18

determine whether removal of this zip code changed inference. Like the first sensitivity analy-sis, removal of the Bradford zip code had little effect on inference.
DiscussionWe posit that larger numbers of active hydraulic fracturing wells would increase inpatientprevalence rates over time due in part to increases in potential toxicant exposure and stressresponses in residents evoked by increases in the hydraulic fracturing work force and dieselengine use. We recognize that a five-year observation period may limit our ability to discern adirect impact on health in the surrounding community but may offer an opportunity to assesshospital utilization rates over time. We examined over 95,000 inpatient records, and thus ourstudy, to our knowledge, represents the most comprehensive one to date to address the healthimpact of UGOD.
Our data suggests that some but not all medical categories were associated with increases innumber of wells, along with increases in well density. Specifically, cardiology inpatient preva-lence rates were significantly associated with number of wells and well density, while neurologyinpatient prevalence rates were significantly associated with well density. We are struck by thefinding that these differences were observable within a short period of time from 2007–2011.
Table 4. Poisson Fixed Effects Models: Number of Wells per Zip Code per Year.
Wells RR (p-value) Year RR (p-value)
Inpatient total 1.0003 (0.076) 0.984 (0.128)
Cardiology 1.0007 (0.0007) 0.966 (0.029)
Dermatology 1.0010 (0.039) 0.977 (0.345)
Endocrine 1.0008 (0.086) 0.963 (0.316)
Gastroenterology 1.0003 (0.338) 0.992 (0.749)
General medicine 1.0002 (0.574) 1.037 (0.022)
Generals surgery 1.0000 (0.849) 1.104 (0.213)
Gynecology 1.0002 (0.708) 0.860 (<0.0001)
Hematology 0.9997 (0.657) 1.023 (0.616)
Neonatology 1.0014 (0.018) 0.959 (0.125)
Nephrology 0.9998 (0.461) 1.025 (0.250)
Neurology 1.0006 (0.037) 1.001 (0.948)
Normal newborns 1.0000 (0.969) 0.963 (0.030)
Ob/delivery 1.0002 (0.411) 0.968 (0.411)
Oncology 1.0015 (0.004) 0.956 (0.081)
Ophthalmology 1.0010 (0.593) 1.084 (0.255)
Orthopedics 0.9993 (0.011) 0.970 (<0.0001)
Other/ob 1.0003 (0.727) 0.899 (0.007)
Otolaryngology 1.0000 (0.982) 0.978 (0.614)
Psych/drug abuse 1.0004 (0.073) 1.035 (0.006)
Pulmonary 1.0000 (0.850) 0.989 (0.482)
Rheumatology 1.0014 (0.043) 0.961 (0.227)
thoracic surgery 1.0011 (0.100) 0.989 (0.708)
Trauma 1.0008 (0.174) 1.021 (0.505)
Urology 1.0010 (0.012) 0.983 (0.464)
Vascular surgery 0.9997 (0.539) 0.948 (0.024)
Note: RR = Risk ratio
doi:10.1371/journal.pone.0131093.t004
Hydraulic Fracturing and Hospitalization Use
PLOS ONE | DOI:10.1371/journal.pone.0131093 July 15, 2015 13 / 18

We show that from 2011–2013 (Fig 2) the number of active wells continues to rise exponen-tially. Although we do not have health care utilization data for 2012–2013, if our findings per-sisted into 2012–2013, it is possible that the association between cardiology inpatientprevalence rates and wells could only become stronger as a result of the increased number ofwells (relative to 2007–2011).
The precise cause for the increase in inpatient prevalence rates within specific medical cate-gories remains unknown. Given that our modeling approach cannot account for within zipcode demographic changes over the study period, it is possible that some increases were due toan increased influx of subjects to a zip code. Since the inpatient prevalence rates were deter-mined for subjects who resided within a zip code, transient UGOD workers whose address wasnot local were excluded. Thus, our data potentially may underestimate hospital use thatexcluded those who were not Pennsylvania residents. Further, our data were partitioned intoactive wells but it is impossible to associate a specific toxicant exposure to an increase in a spe-cific disease category requiring hospitalization. Intriguingly, our findings partially supportthose of other studies performed in Colorado. Colburn et al. observed that more than 75% ofthe chemicals used during natural gas operations may affect skin and respiratory systems, aswell as other organs [23]. Another study in Colorado also supports our findings in
Table 5. Poisson Fixed Effects Models: Quantile Analysis of Wells/km2.
Q1 Wells RR (p-value) Q2 Wells RR (p-value) Q3 Wells RR (p-value) Wald Test of all Q Wells = 0 Year RR (p-value)
Inpatient total 0.979 (0.475) 1.069 (0.044) 1.108 (0.041) P = 0.0058 0.977 (0.013)
Cardiology 1.021 (0.667) 1.142 (0.018) 1.27 (0.001) P = 0.0008 0.957 (0.004)
Dermatology 1.051 (0.572) 1.108 (0.429) 1.454 (0.013) P = 0.0329 0.972 (0.329)
Endocrine 0.975 (0.862) 1.228 (0.045) 1.391 (0.029) P = 0.0068 0.942 (0.039)
Gastroenterology 0.943 (0.369) 1.12 (0.168) 1.105 (0.364) P = 0.1101 0.98 (0.406)
General medicine 0.911 (0.234) 0.993 (0.931) 0.985 (0.872) P = 0.6373 1.037 (0.006)
Generals surgery 0.875 (0.011) 0.921 (0.228) 0.944 (0.424) P = 0.0669 1.015 (0.157)
Gynecology 0.887 (0.300) 0.938 (0.606) 0.967 (0.849) P = 0.7549 0.865 (<0.0001)
Hematology 1.202 (0.365) 1.21 (0.320) 1.221 (0.429) P = 0.7145 0.993 (0.868)
Neonatology 0.994 (0.975) 1.301 (0.152) 1.527 (0.100) P = 0.0745 0.95 (0.052)
Nephrology 1.115 (0.203) 1.143 (0.227) 1.151 (0.211) P = 0.5566 1.004 (0.871)
Neurology 0.922 (0.344) 1.157 (0.048) 1.188 (0.062) P = 0.0003 0.99 (0.542)
Normal newborns 0.949 (0.481) 0.978 (0.764) 0.964 (0.731) P = 0.8980 0.965 (0.064)
Ob/delivery 0.958 (0.524) 1.028 (0.670) 1.029 (0.749) P = 0.4219 0.956 (0.002)
Oncology 1.217 (0.144) 1.415 (0.028) 1.815 (0.002) P = 0.0166 0.938 (0.022)
Ophthalmology 0.717 (0.381) 1.014 (0.976) 1.116 (0.836) P = 0.5215 1.099 (0.263)
Orthopedics 0.996 (0.940) 0.981 (0.740) 0.875 (0.130) P = 0.3591 0.963 (<0.0001)
Other/ob 0.966 (0.885) 1.176 (0.451) 1.264 (0.502) P = 0.7209 0.879 (0.001)
Otolaryngology 1.052 (0.744) 1.194 (0.412) 1.004 (0.988) P = 0.5564 0.966 (0.527)
Psych/drug abuse 0.944 (0.307) 0.927 (0.293) 1.13 (0.145) P = 0.0535 1.039 (0.008)
Pulmonary 1.05 (0.267) 1.097 (0.202) 1.067 (0.572) P = 0.3050 0.981 (0.306)
Rheumatology 1.091 (0.601) 1.432 (0.159) 1.866 (0.034) P = 0.0774 0.94 (0.067)
Thoracic surgery 0.872 (0.391) 1.151 (0.470) 1.13 (0.654) P = 0.0903 0.987 (0.751)
Trauma 0.997 (0.987) 1.057 (0.761) 1.265 (0.222) P = 0.4373 1.02 (0.562)
Urology 0.827 (0.117) 1.105 (0.462) 1.24 (0.215) P = 0.0334 0.977 (0.339)
Vascular surgery 1.103 (0.488) 1.052 (0.788) 0.966 (0.857) P = 0.8116 0.946 (0.030)
Note: RR = Risk ratio
doi:10.1371/journal.pone.0131093.t005
Hydraulic Fracturing and Hospitalization Use
PLOS ONE | DOI:10.1371/journal.pone.0131093 July 15, 2015 14 / 18

neonatology. McKenzie et al. estimate that being within 10 miles of a gas well significantlyincreased the odds of having a congenital heart defect by 1.3 as well as the odds of having neu-ral tube defects by two-fold, compared to not being within 10 miles of a gas well [12]. A recentstudy by Lanki et al. determined that living close to busy traffic was associated with increasedC-reactive protein (CRP) concentrations, which is a known risk factor for cardiovascular dis-eases [24]. This supports our results for cardiology, given the increased truck traffic that comeswith increased hydro-fracking activity.
Despite our findings that hospitalization use and active well number are directly associatedwithin specific medical categories, there are limitations to our study. Our study examined a rel-atively short time interval. Whether our findings will be validated over longer periods of obser-vation remains unclear. To have any association within a brief time frame may forebodegreater negative health effects over time. Furthermore, with our limited time frame and data,the functional relationship for the association between well density and inpatient prevalencerates was heavily dependent on many extreme values, which make up less than 1% of the totalobservations. This motivated the quantile analysis. However, there are clear disadvantages tothis approach. By partitioning a continuous variable, we inherently lose information. Further-more, while we can make inference on moving among quantile levels, we cannot make infer-ence for specific increases in well density. The quantile levels were also somewhat arbitrary,characterized as no wells/km2, a “low” amount of wells/km2, a “medium amount of wells/km2,and a “high” amount of wells/km2. Another possible limitation is that our analyses only consid-ered a zip code “exposed” to wells if there were wells within that specific zip code. A zip codewith no wells, however, could neighbor another zip code that has many wells. Accordingly, theassociation between wells and inpatient prevalence rates may be underestimated. Future workwill incorporate a spatial aspect, such that the proximity to exposure (wells) is better addressed.Another limitation is that this study, given that we use hospital discharge data, does not includeany information on morbidity or mortality. However, a future study that assesses the associa-tion between morbidity/mortality and wells would be interesting to explore.
Despite these limitations, our findings may have a significant impact on the consequencesof UGOD on health care delivery and policy. For the number of wells analyses, it is useful toconsider specific increases in wells, given that the risk ratio associated with the number of wellspredictor is in terms of a one unit increase in number of wells. Specifically, consider an increaseof 25 wells, which is the observed mean number of wells from our data. For example, if somezip code had an additional 25 wells, we would expect cardiology inpatient prevalence rates toincrease by 2% for that zip code. Considering the quantile analyses, if a zip code went fromhaving zero wells to having greater than 0.79 wells/km2 (79 wells for each 100 km2), we wouldexpect cardiology inpatient prevalence rates to increase by 27% for that zip code. If a zip codewent from having no wells to having between 0.17 to 0.79 wells/km2, we then would expect a14% increase in cardiology inpatient prevalence rates for that zip code. Notably, 18 zip codeshad greater than 0.79 wells/km2, primarily in 2010 and 2011, indicating that each of these zipcodes could have had an excess of 27% in cardiology inpatient prevalence rates for each yearthey had greater than 0.79 wells/km2. Furthermore, while dermatology and neonatology werenot strictly significant after using a Bonferroni correction, there is evidence that dermatologyand neonatology inpatient prevalence rates were also positively associated with wells. From thenumber of wells analyses, if a zip code had an additional 25 wells, we would expect dermatologyand neonatology inpatient prevalence rates to increase by 3% and 4%, respectively. Similarly,from the quantile analyses, if a zip code went from having no wells to having greater than 0.79wells/km2, we would expect dermatology inpatient prevalence rates to increase by 45% for thatzip code.
Hydraulic Fracturing and Hospitalization Use
PLOS ONE | DOI:10.1371/journal.pone.0131093 July 15, 2015 15 / 18

For most medical categories and overall, given the non-significant year risk ratios fromTables 4 and 5, inpatient prevalence rates remained relatively stable between 2007 and 2011.However, within the medical categories of gynecology and orthopedics, inpatient prevalencerates are expected to decrease each year by around 13–14% and 3–4%, respectively. Despitethis surprising result, it is unclear why gynecology and orthopedics inpatient prevalence ratesare decreasing each year. It is unlikely that these decreasing rates are related to the increasedhydro-fracking activity.
To put into the context the potential burden of hydro-fracking on cardiology hospitaliza-tions, consider the zip codes which exceeded 0.79 wells/km2 (Q3wells). In total, from 2007 to2011, three zip codes had>0.79 wells/km2 in 2009, 10 zip codes had >0.79 wells/km2 in2010, and 18 zip codes had>0.79 wells/km2 in 2011. Some zip codes had>0.79 wells/km2 inmultiple years, and in total, there were 18 unique zip codes that achieved>0.79 wells/km2 atleast once. Of these 31 year/zip code observations, the mean cardiology inpatient prevalencerate was 2.17, the mean number of cardiology inpatient visits was 44.74, and the mean popu-lation was 2190. Given the model results from Table 5, if these same observations had nowells, we would have expected the mean cardiology inpatient prevalence rate to be 2.17/1.27 = 1.71. Thus, the expected mean number of cardiology inpatient visits, assuming themean population, would be 1.71�2190/100 = 37.46. However, this is a slight simplification,since each zip code has a different population. We omit the zip code specific populationsto preserve zip code anonymity, but when using zip code specific populations, the expectedmean number of cardiology inpatient visits, if these zip codes had no wells, would be 35.23.This means that on average, for any year that a zip code exceeded 0.79 wells/km2, wewould expect an excess of 44.74–35.23 = 9.51 cardiology inpatient visits, compared to ifthere were no wells. Note that this excess is for a single zip code for a single year in whichthe zip code exceeded 0.79 wells/km2 (this occurred 31 times). A similar exercise shows thatfor zip codes in the Q2wells range (36 observations total), we would expect on average anexcess of 8.13 cardiology inpatient rates. This again is for a single zip code for a single yearin which the zip code had>0.168 wells/km2 but�0.79 wells/km2. However, from themodel results in Table 5, zip codes with >1 well are in general expected to have increasedcardiology inpatient prevalence rates, relative to having no wells. With an inpatient stay cost-ing on average $30K, this poses a significant economic health burden to the Commonwealthof PA.
In summary, hydraulic fracturing as determined by well number or density had a significantassociation with cardiology inpatient prevalence rates, while well density had a significant associ-ation with neurology inpatient prevalence rates. While the clinical significance of the associationremains to be shown, UGOD has just begun in Pennsylvania, and thus observing a significantassociation over this short time is remarkable. Further studies are warranted to compare toxicantexposure to number of wells and inpatient and outpatient studies. Our study also supports theconcept that health care utilization should be factored into the value (costs and benefits) ofhydraulic fracturing over time.
Supporting InformationS1 Table. ICD-9 diagnosis codes and MSDRGs used in this study. These data are partitionedinto three tabs: ICD-9 diagnosis codes, MSDRGs and MSDRG product lines included.(XLSX)
Hydraulic Fracturing and Hospitalization Use
PLOS ONE | DOI:10.1371/journal.pone.0131093 July 15, 2015 16 / 18

Author ContributionsConceived and designed the experiments: TJ GLGMH PS TMP KJP RAP. Performed theexperiments: TJ GLGMN SC BYMSMH PS NF TMP JR KJP RAP. Analyzed the data: TJGLGMN SC BYMS NF TMP JR KJP RAP. Contributed reagents/materials/analysis tools: TJGLGMN SC BYMSMH PS NF TMP JR KJP RAP. Wrote the paper: TJ GLGMN SC BYMSMH PS NF TMP JR KJP RAP.
References1. IER (2012) U.S. LeadsWorld in Natural Gas Production from Hydraulic Fracturing. Available: http://
instituteforenergyresearch.org/analysis/u-s-leads-world-in-natural-gas-production-from-hydraulic-fracturing/#_edn1.
2. EIA (2014) EIA. Annual Energy Outlook 2014. Available: http://www.eia.gov/forecasts/aeo/mt_naturalgas.cfm.
3. Lampe DJ, Stolz JF. Current perspectives on unconventional shale gas extxraction in the Appalachianbasin. J Environ Sci Health. 2015; 50: 434–446.
4. Schnoor JL. Shale gas and hydrofracking. Environ Sci Technol. 2012; 46: 4686. doi: 10.1021/es3011767 PMID: 22480196
5. Earthworks. Earthworks Hydraulic Fracturing 101. Available: http://www.earthworksaction.org/issues/detail/hydraulic_fracturing_101#.VSP49PnF98E.
6. EPA (2014) The Process of Hydraulic Fracturing. Available: http://www2.epa.gov/hydraulicfracturing/process-hydraulic-fracturing.
7. Jackson RB, Vengosha A, Darraha TH, Warnera NR. Increased stray gas abundance in a subset ofdrinking water wells near Marcellus shale gas extraction. Proc Natl Acad Sci USA. 2013; 110: 11250–11255. doi: 10.1073/pnas.1221635110 PMID: 23798404
8. Gross SA, Avens HJ, Banducci AM, Sahmel J, Panko JM, Tvermoes BE. Analysis of BTEX groundwa-ter concenrations from surface spills associated with hydraulic fracturing operations. J Air Waste Man-age Assoc. 2013; 63: 424–432.
9. Warner NR, Christie CA, Jackson RB, Vengosh A. Impacts of shale gas wastewater disposal on waterquality in western Pennsylvania. Environ Sci Technol. 2013; 47: 11849–11857. doi: 10.1021/es402165b PMID: 24087919
10. Adgate JL, Goldstein BD, McKenzie LM. Potential public health hazards, exposures and health effectsfrom unconventional natural gas development. Environ Sci Technol. 2014; 48: 8307–8320. doi: 10.1021/es404621d PMID: 24564405
11. Macy PG, Breech R, Chernaik M, Cox C, Larson D, Thomas D, et al. Air concentrations of volatile com-pounds near oil and gas production: a community-based exploratory study. Environmental Health.2014; 13: 82. doi: 10.1186/1476-069X-13-82 PMID: 25355625
12. McKenzie LM, Guo R, Witter RZ, Savitz DA, Newman LS, Adgate JL. Birth outcomes and maternal resi-dential proximity to natural gas development in rural Colorado. Environ Health Perspect. 2014; 122:412–417. doi: 10.1289/ehp.1306722 PMID: 24474681
13. McKenzie LM, Witter RZ, Newman LS, Adgate JL. Human health risk assessment of air emissions fromdevelopment of unconventional natural gas resources. Sci Total Environ. 2012; 424: 79–87. doi: 10.1016/j.scitotenv.2012.02.018 PMID: 22444058
14. Penning TM, Breysse PN, Gray K, Howarth M, Yan B. Environmental Health Research Recommenda-tions from the Inter-Environmental Health Sciences Core Center Working Group on UnconventionalNatural Gas Drilling Operations. Environ Health Perspect. 2014; 122: 1155–1159. doi: 10.1289/ehp.1408207 PMID: 25036093
15. Rabinowitz PM, Slizovskiy IB, Lamers V, Trufan SJ, Holford TR, Dziura JD, et al. Proximity to naturalgas wells and reported health status: Results of a household survey in Washington County, Pennsylva-nia. Environ Health Perspect. 2014: Advance Publication 10 September 2014, http://dx.doi.org/2010.1289/ehp.1307732.
16. PA Department of Environmental Protection (2013). Marcellus Shale Development. Available: http://www.elibrary.dep.state.pa.us/dsweb/Get/Document-97683/0100-FS-DEP4217.pdf
17. PA Department of Environmental Protection (2013). 2013 Oil and Gas Annual Report. Available: http://www.portal.state.pa.us/portal/server.pt/community/annual_report/21786
18. MarcellusGas.Org www.marcellusgas.org—Information related to Pennsylvania deep gas well activity.
19. USGovernment (2010). 2010 Census Data. Available: http://www.census.gov/2010census/data/.
Hydraulic Fracturing and Hospitalization Use
PLOS ONE | DOI:10.1371/journal.pone.0131093 July 15, 2015 17 / 18

20. PA Departent of Environmental Protection (2014). PA DEP Oil & Gas ReportingWebsite. Available:https://www.paoilandgasreporting.state.pa.us/publicreports/Modules/DataExports/DataExports.aspx.Pennsylvania Department of Environmental Protection.
21. Wooldridge JM. Distribution-free estimation of some nonlinear panel data models. Journal of Econo-metrics. 1999; 20: 77–97.
22. Bernstein AB, Hing E, Moss AJ, Allen KF, Siller AB, Tiggle RB. (2003) Health Care in America: Trendsin Utilization. In: U.S. Department of Health and Human Services CfDCaP, National Center for HealthStatistics, editor. Hyattsville, Maryland: National Center for Health Statistics.
23. Colburn T, Kwiatkowski C, Schultz K, Bachran M. Natural gas operations from a public health perspec-tive. Hum Ecol Risk Assess. 2011; 17: 1039–1056.
24. Lanki T, Hampel R, Tittanen P, Andrich S, Beelen R, Brunekreef B, et al. Air pollution from road trafficand systemic inflammation in adults: a cross-sectional analysis in the European ESCAPE Project. Envi-ron Health Perspect. 2015, Advance Publication 27 March 2015.
Hydraulic Fracturing and Hospitalization Use
PLOS ONE | DOI:10.1371/journal.pone.0131093 July 15, 2015 18 / 18