studytraffic - shaker heights, ohioshakeronline.com/assets/downloads/city-plans/shaker...
TRANSCRIPT

TR
AFFIC
STU
DY
Warrensville/Van A
ken Transit-Oriented D
evelopment Plan
2008C
ity of Shaker Heights

Final Report
Warrensville/Van A
ken Transit-Oriented D
evelopment Plan
H City of Shaker H
eights
April 28, 2008
Traffic Study
APPEN
DIX

Shaker Heights TOD Study
Page ES-1
Executive Sumary
URS, as part of the Planning Partnership Team, has been retained by the City of Shaker Heights to prepare a transit-oriented development (TOD) plan and traffic study for the Warrensville/Van Aken rapid transit station and surrounding commercial district. The overall project goal is to improve the existing arterial road system and transform the existing commercial district into a vibrant, mixed-use downtown for Shaker Heights. This will be accomplished through:
• a realigned intersection and arterial street layout; • creation of an intermodal transportation center for light rail/ bus/ automobile/
pedestrian transfers; • enhanced economic development opportunities; and • improved pedestrian and bike-friendly access and site amenities.
The purpose of this study is to evaluate the traffic impact of a variety of transportation network alternatives as input into the selection of a preferred concept. Various roadway network alternatives and RTA alignments have been analyzed and recommendations have been made to mitigate the anticipated impacts of the proposed development, maximize the ingress/egress to the site and enhance pedestrian and vehicular safety. The proposed development is to be located on the northwest corner of the intersection of Chagrin Boulevard and Warrensville Center Road in Shaker Heights, Ohio and for the purposes of the traffic study, was considered to consist of 160,000 ft2 of retail, 250,000 ft2 of offices, and 500 dwelling units of apartments. Since there is currently retail development at this location, it is assumed that the 160,000 ft2 of retail is already “captured” in the existing traffic counts and as such will not be added to the total trip generation results. The Opening Day year is assumed to be 2008, and the Design Year (i.e. full build out) is assumed to be 2028. The study area for this study includes the following intersections:
• Chagrin Boulevard/Lynnfield Road • Chagrin Boulevard/Norwood Road • Chagrin Boulevard/Lomond Boulevard/Farnsleigh Road • Chagrin Boulevard/Warrensville Center Road • Chagrin Boulevard/Helen Road • Chagrin Boulevard/Colton Road • Warrensville Center Road/Scottsdale Boulevard • Warrensville Center Road/Norwood Road • Warrensville Center Road/Office Max Drive • Warrensville Center Road/Farnsleigh Road • Van Aken Boulevard/Farnsleigh Road • Lomond Boulevard/Sussex Road

Shaker Heights TOD Study
Page ES-2
Traffic counts were performed at the study intersections. These traffic volumes collected by URS were used in the analysis until Alternative 2 was selected as the favored option. That data was provided to NOACA to update their Regional Traffic Model. Using that data, NOACA prepared volume scenarios for the No-Build and Alternative 2 scenarios. The volumes provided by NOACA were used in the analysis of these scenarios. The NOACA No-Build volumes are slightly lower than the original URS volumes. The Build volumes are also slightly lower than the original volumes with the exception of the through traffic on Warrensville Center and to a lesser extent the eastbound volumes on Van Aken. The NOACA model takes a more regional look at the effects of cutting off Van Aken and Northfield. We assumed that traffic would divert to other routes but the NOACA model used larger scale diversions. The traffic model prepared by NOACA has redistributed some of the traffic to other parallel arterials outside the study area of this project. This redistribution of traffic is based on the changes to the region's roadway system, including the proposed network changes contained within this plan. Based on the NOACA volumes, there is not an identified road that will absorb the bulk of the redirected traffic. The model, knowing trip origins and destinations, will distribute traffic to a variety of alternate routes based on the changes to the roadway system. Some traffic may not even enter this area. Others will use one of the many parallel east-west or north-south arterials. This study presents existing and projected traffic data, a determination of traffic to be generated by the proposed development and an analysis of projected traffic conditions. Opening Day and Design Year AM and PM peak hour conditions have been addressed for this analysis because they represent the busiest hours of the day. Recommendations will be presented regarding roadway improvements required to achieve safe and efficient traffic access and reasonable levels of service. This report assessed four different transportation network alternatives with the purpose of determining which configuration would support the redevelopment of the study area. Of the four scenarios tested, the favored option is presented in Exhibit EX-1. This alternative:
• Can support the significant redevelopment of the site with a mix of residential, office and retail space.
• Will enhance safety of the Warrensville / Chagrin intersection by greatly reducing the number of conflict points within the intersection.
• Will enhance pedestrian accessibility by reducing the Warrensville / Chagrin intersection to a normal 4-legged intersection with crosswalk on all for legs.
• Creates an opportunity for an improved intermodal facility at the end of RTA’s Blue Line.
• Protects for the expansion of the Blue Line in accordance with RTA’s Long Term Plans.
As presented in this study, without improvements to the roadway network, levels of service will be unacceptable. Even without the proposed development, the intersection of

Shaker Heights TOD Study
Page ES-3
Warrensville Center/Chagrin Boulevard/Van Aken Boulevard/Northfield Road is operating at a LOS E in the AM peak hour and a LOS F in the PM peak hour. The proposed changes to this intersection will improve the LOS. By eliminating Van Aken Boulevard and Northfield Road, this intersection is anticipated to operate at a LOS C in both the AM and PM peak hours. The following table presents the LOS and ADT for both No-Build and Build scenarios for the major intersections in the study.
No-Build Build LOS LOS
Location ADT
AM PM ADT
AM PM 1 Warrensville Center Road/ Farnsleigh Road 24,730 B B 23,280 C C 2 Chagrin Boulevard/ Warrensville Center Road 45,141 B B 37,810 C C 3 Van Aken Boulevard/ Farnsleigh Road 19,689 E F 11,950 C B
As shown in the table, there will be slight decreases in the ADT for the Warrensville/ Farnsleigh and Van Aken/Farnsleigh intersections but there will be a significant decrease in the ADT for the Warrensville/Chagrin intersection. The future ADT will be lower because of the road closures. The Warrensville/Chagrin intersection has a much lower ADT because it has two less roads entering the intersection. Some of the traffic from those closed roads will still make their way through the intersection but much of it will redirect out of the study area. The slight LOS decrease for the Warrensville/Farnsleigh and Van Aken/Farnsleigh intersections primarily due to the diversion of the traffic caused by the road closures. A LOS C at these locations in peak hours is still desirable. In trade for the change in LOS at those intersections, the Warrensville/Chagrin intersection will see a substantial increase in LOS. The result will be a “drivable” roadway system that will improve safety and provide capacity needed to support the proposed redevelopment area. Neighborhood traffic infiltration was investigated, specifically looking at “cut-through” traffic. The traffic in the neighborhoods includes the locals, drivers avoiding congestion and drivers avoiding difficult turns. The City of Shaker Heights has already implemented many controls around the local neighborhoods to deter cut-through traffic. Turn restrictions, both permanent and by time of day, have already been installed. Our traffic counts indicate that there are not a significant amount of drivers who cut thorough the neighborhoods from a capacity standpoint. The intersections that we studied all are operating at an acceptable level of service. To further deter drivers from cutting through the neighborhoods, they have to “want” to stay on the main roads. The improvements to the Chagrin/Warrensville intersection are anticipated to serve that purpose. Currently there are turn restrictions that don’t allow drivers to make certain left turns at this intersection. Those restrictions will be eliminated and all turns will be permitted at the intersection. The level of service at this intersection will be improved. Drivers who avoid this intersection due to the heavy congestion will not need to

Shaker Heights TOD Study
Page ES-4
cut through the neighborhoods to avoid traffic. The fastest and best way will be to travel through this intersection. The NOACA volumes did not address the internal intersections of the neighborhoods. Their volumes primarily dealt with the main roadways. The simulation software, VISSIM, was used to model the traffic flows in the area. The models use the traffic volumes that were originally developed by URS which are slightly higher than the volumes developed by NOACA and represent a more conservative representation of traffic flows. The number of lanes was established using the higher volumes. These models/videos were developed prior to NOACA submitting their traffic volumes. The NOACA volumes were tested in Synchro to confirm that the lane recommendations are still valid. Again, this would be a conservative view since the lanes presented satisfy both NOACA's and the URS volumes. The Alternate 2 lane usage modification in the study area is depicted in Exhibit ES-2.
Shaker Heights TOD Study
Page ES-5
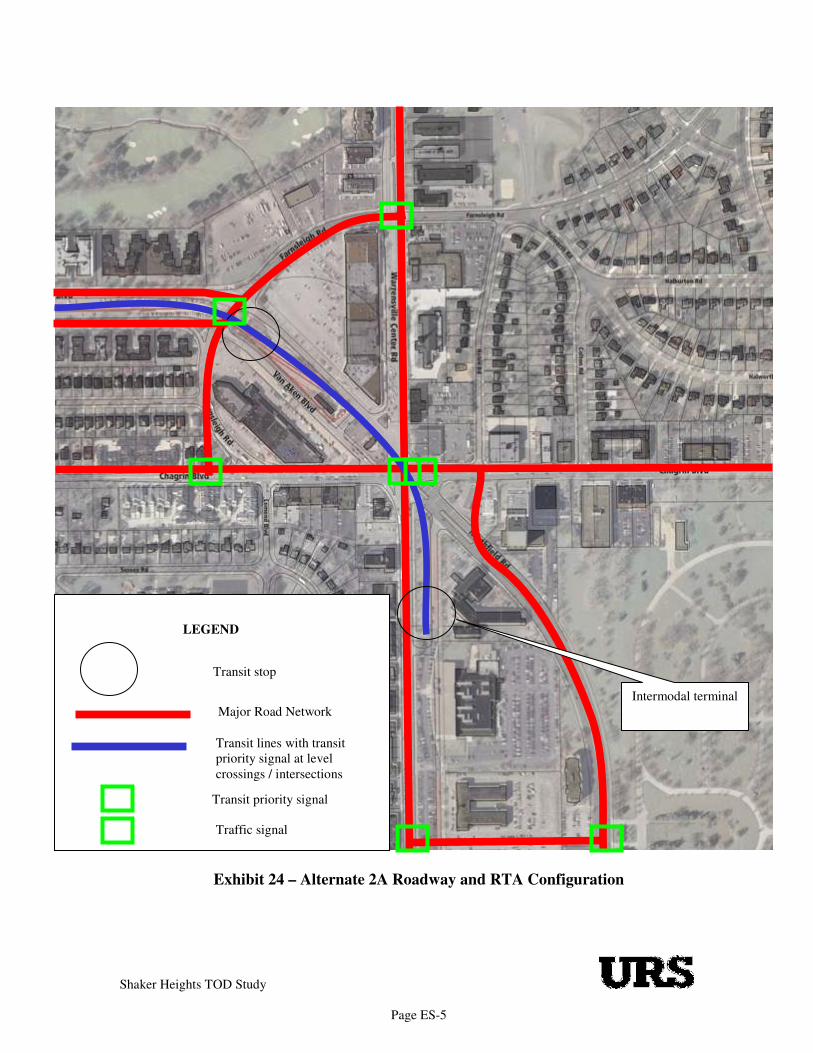
Exhibit 24 – Alternate 2A Roadway and RTA Configuration
Intermodal terminal
Transit stop
Major Road Network
Transit lines with transit priority signal at level crossings / intersections
Transit priority signal
LEGEND
Traffic signal


Shaker Heights TOD Study
Page i
Table of Contents 1.0 Introduction.............................................................................................................1
1.1 Site Location .........................................................................................................1 1.2 Study Area ............................................................................................................1 1.3 Proposed Site Development..................................................................................1 1.4 Study Scope ..........................................................................................................2 Exhibit 1 –Location Map...................................................................................................3
2.0 Existing Roadways ..................................................................................................4 2.1 Existing Roadways................................................................................................4 2.2 Crash History ........................................................................................................5
3.0 Existing Traffic Conditions....................................................................................6 3.1 Existing Traffic Volumes......................................................................................6 3.2 Design Year No-Build Traffic Volumes...............................................................6 3.3 Rating System for Roadway Adequacy ................................................................6
Table 3.2 - Level of Service Criteria for Unsignalized Intersections.............................7 3.5 Design Year No-Build Capacity Analysis ............................................................8
Table 3.3 – Design Year No-Build Signalized Capacity Analysis ................................8 Table 3.4 – Design Year No-Build Un-Signalized Capacity Analysis ..........................8
Exhibit 2 – Opening Day No-Build (AM)[PM] Peak Hour Volumes...............................9 Exhibit 3 – Design Year No-Build (AM)[PM] Peak Hour Volumes ..............................10 Exhibit 4 – Level of Service Definitions .........................................................................11 Exhibit 5 – Design Year No-Build (AM)[PM] Levels of Service...................................12
4.0 Anticipated Traffic Conditions............................................................................13 4.1 Network Options.................................................................................................13
Table 4.1 – Network Options Summary.......................................................................13 4.2 No-Build Traffic Volumes..................................................................................14 4.3 Site Traffic Generation .......................................................................................14
Table 4.2 – Trip Generation Table ...............................................................................14 4.4 Site Trip Distribution ..........................................................................................14 4.6 Design Year Diverted Trips ................................................................................15 4.7 Design Year Full Build Traffic Volumes............................................................15 4.8 Design Year Alternate 1 Build Traffic Conditions .............................................15
Table 4.3 – Design Year Alternate 1 Signalized Capacity Analysis Results ...............15 Table 4.4 – Design Year Alternate 1 Un-Signalized Capacity Analysis Results.........16
4.9 Design Year Alternate 2 Build Traffic Conditions .............................................16 Table 4.5 – Design Year Alternate 2 Signalized Capacity Analysis Results ...............17 Table 4.6 – Design Year Alternate 2 Un-Signalized Capacity Analysis Results.........17
4.10 Design Year Alternate 3 Build Traffic Conditions .............................................18 Exhibit 6 – Alternate 1 Roadway and RTA Configuration .............................................19 Exhibit 7 – Alternate 2A Roadway and RTA Configuration ..........................................20 Exhibit 8 – Alternate 2B Roadway and RTA Configuration...........................................21 Exhibit 9 – Alternate 3 Roadway and RTA Configuration .............................................22 Exhibit 10 – Opening Day Alternate 1 (AM)[PM] Peak Hour Volumes ........................23 Exhibit 11 – Design Year Alternate 1 (AM)[PM] Peak Hour Volumes .........................24 Exhibit 12 – Opening Day Alternate 2 (AM)[PM] Peak Hour Volumes ........................25 Exhibit 13 – Design Year Alternate 2 (AM)[PM] Peak Hour Volumes .........................26 Exhibit 14 – Alternate 1 (Enter)[Exit] Development Distribution ..................................27

Shaker Heights TOD Study
Page ii
Exhibit 15 – Alternate 2 (Enter)[Exit] Development Distribution ..................................28 Exhibit 16 – Alternate 1 (AM)[PM] Development Trips ................................................29 Exhibit 17 – Alternate 2 (AM)[PM] Development Trips ................................................30 Exhibit 18 – Alternate 1 (AM)[PM] Diverted Trips........................................................31 Exhibit 19 – Alternate 2 (AM)[PM] Diverted Trips........................................................32 Exhibit 20 – Design Year Alternate 1 (AM)[PM] Full Build Volumes ..........................33 Exhibit 21 – Design Year Alternate 2 (AM)[PM] Full Build Volumes ..........................34 Exhibit 22 – Design Year Alternate 1 (AM)[PM] Build Levels of Service ....................35 Exhibit 23 – Design Year Alternate 2 (AM)[PM] Build Levels of Service ....................36
5.0 VISSIM Analysis...................................................................................................37 5.1 Model Components.............................................................................................37 5.2 Base Map ............................................................................................................37 5.3 Highway Network...............................................................................................37 5.4 Traffic Control ....................................................................................................37 5.5 Traffic Composition............................................................................................37 5.6 Traffic Volumes and Routing Decisions.............................................................38 5.7 RTA Alignment A...............................................................................................38 5.8 RTA Alignment B...............................................................................................38 5.9 RTA Analysis Results.........................................................................................38
Table 5.1 – Design Year Alternate 2 – RTA Alignment A..........................................38 Table 5.2 – Design Year Alternate 2 – RTA Alignment B ..........................................38
6.0 Conclusions............................................................................................................39 Exhibit 24 – Alternate 2A Roadway and RTA Configuration ........................................42 Exhibit 25 – Alternate 2B Roadway and RTA Configuration.........................................43
APPENDICES Appendix A – Crash History Appendix B – Raw Traffic Counts Appendix C – Growth Rate Data Appendix D – Design Year No-Build Capacity Analysis Appendix E – Trip Generation Data Appendix F – Trip Distribution Data Appendix G – Design Year Alternate 1 Capacity Analysis Appendix H – Design Year Alternate 2 Capacity Analysis Appendix I – Design Year Alternate 3 Capacity Analysis Appendix J – Rail Alignment VISSIM Analysis

Section 1 Introduction

Shaker Heights TOD Study
Page 1
1.0 Introduction
URS as part of the Planning Partnership Team has been retained by the City of Shaker Heights to prepare a transit-oriented development (TOD) plan and traffic study for the Warrensville/Van Aken rapid transit station and surrounding commercial district. The overall project goal is to improve the existing arterial road system and transform the existing commercial district into a vibrant, mixed-use downtown for Shaker Heights. This will be accomplished through:
• a realigned intersection and arterial street layout; • creation of an intermodal transportation center for light rail/ bus/ automobile/
pedestrian transfers; • enhanced economic development opportunities; and • improved pedestrian and bike-friendly access and site amenities.
The purpose of this study is to evaluate the traffic impact of a variety of transportation network alternatives as input into the selection of a preferred concept. Various roadway network alternatives and RTA alignments will be analyzed and recommendations made to mitigate the anticipated impacts of the proposed development, maximize the ingress/egress to the site and enhance pedestrian and vehicular safety.
1.1 Site Location The proposed development is to be located on the northwest corner of the intersection of Chagrin Boulevard and Warrensville Center Road in Shaker Heights, Ohio. Exhibit 1 presents a site location map for this project. 1.2 Study Area The study area for this study includes the following intersections:
• Chagrin Boulevard/Lynnfield Road • Chagrin Boulevard/Norwood Road • Chagrin Boulevard/Lomond Boulevard/Farnsleigh Road • Chagrin Boulevard/Warrensville Center Road • Chagrin Boulevard/Helen Road • Chagrin Boulevard/Colton Road • Warrensville Center Road/Scottsdale Boulevard • Warrensville Center Road/Norwood Road • Warrensville Center Road/Office Max Drive • Warrensville Center Road/Farnsleigh Road • Van Aken Boulevard/Farnsleigh Road • Lomond Boulevard/Sussex Road 1.3 Proposed Site Development For use in the generation of traffic volumes, the proposed development was considered to consist of 160,000 ft2 of retail, 250,000 ft2 of offices, and 500 dwelling units of apartments.

Shaker Heights TOD Study
Page 2
Since there is currently retail development at this location, it is assumed that the 160,000 ft2 of retail is already “captured” in the existing traffic counts and as such will not be added to the total trip generation results. For the purposes of this study, it was assumed that development related traffic will access the network at the Van Aken Boulevard/Farnsleigh Road intersection. It is expected that with the final development concept, multiple access point will more evenly distribute traffic onto the network. For study purposes, the Opening Day year is assumed to be 2008, and the Design Year (i.e. full build out) is assumed to be 2028. 1.4 Study Scope This study presents existing and projected traffic data, a determination of traffic to be generated by the proposed development and an analysis of projected traffic conditions. Opening Day and Design Year AM and PM peak hour conditions have been addressed for this analysis because they represent the busiest hours of the day. Recommendations will be presented regarding roadway improvements required to achieve safe and efficient traffic access and reasonable levels of service. The study area and scope of the study have been established by representatives of the City of Shaker Heights. Traffic counts were performed at the study intersections and provided to NOACA to update their Regional Traffic Model for the No-Build and Alternative 2 scenarios. The volumes provided by NOACA were used in the analysis of these scenarios.


Section 2 Existing Roadways

Shaker Heights TOD Study
Page 4
2.0 Existing Roadways
This section of the report describes the physical characteristics of the roadway system in the vicinity of the proposed development. 2.1 Existing Roadways Chagrin Boulevard is a two-lane, east-west, minor arterial west of Warrensville Center Road. It is a four-lane, east-west, principle arterial east of Warrensville Center Road and a minor arterial west of Warrensville Center Road. Chagrin Boulevard has a posted speed limit of 35 miles per hour (mph) and carries an average daily traffic volume (ADT) of approximately 10,500. Warrensville Center Road is a four-lane, north-south, minor arterial south of Chagrin Boulevard. It is a four-lane, north-south, principle arterial north of Chagrin Boulevard. Warrensville Center Road has a posted speed limit of 35 mph and carries an ADT of approximately 22,800. Van Aken Boulevard is a four-lane, median divided, northwest-southeast, principle arterial that ends at the Chagrin Boulevard/Warrensville Center Road intersection on the northwest approach. Van Aken Boulevard has a posted speed limit of 35 mph and carries an ADT of approximately 16,500. Northfield Road (SR 8) is a four-lane, median divided, north-south, principle arterial that ends at the Chagrin Boulevard/Warrensville Center Road intersection on the southeast approach. Northfield Road has a posted speed limit is 35 mph and carries an ADT of approximately 13,500. Farnsleigh Road is a four-lane, semi-circular, local street northwest of the Chagrin Boulevard/Warrensville Center Road intersection. Farnsleigh Road has a posted speed limit of 35 mph and carries an ADT of approximately 5,000. Lomond Boulevard is a two-lane, north-south, local street that intersects on the south side of Chagrin Boulevard and is about 600 feet west of Warrensville Center Road. Lomond Boulevard has a posted speed limit is 25 mph and carries an average ADT of approximately 5,000 at Chagrin Boulevard. Sussex Road is a two-lane, east-west, local street that intersects with Lomond Boulevard, just south of Chagrin Boulevard. Sussex Road has a posted speed limit is 25 mph and carries an ADT of approximately 3,000. Norwood Road is a two-lane, northwest-southeast, local street that intersects with Chagrin Boulevard from the south and Warrensville Center Road from the east. Norwood Road has a posted speed limit is 25 mph and carries an ADT of approximately 1,100 at Chagrin Boulevard and 2,800 at Warrensville Center Road.

Shaker Heights TOD Study
Page 5
Lynnfield Road is a two-lane, north-south, median divided, local street that intersects with Chagrin Boulevard. Lynnfield Road has a posted speed limit is 25 mph and carries an ADT of approximately 1,800. Helen Road is a two-lane, southbound, one-way local street that intersects with Chagrin Boulevard about 350 feet east of Warrensville Center Road. Helen Road has a posted speed limit is 25 mph and carries an ADT of approximately 300. Colton Road is a two-lane, north-south local street that intersects with Chagrin Boulevard about 800 feet east of Warrensville Center Road. Colton Road has a posted speed limit is 25 mph and carries an ADT of approximately 400. Office Max Drive is a two-lane, east-west drive that intersects with Warrensville Center Road about 1300 feet south of Chagrin Boulevard. The drive serves as access to a few office buildings. The Office Max Drive carries an ADT of approximately 1,150. Scottsdale Boulevard is a two-lane, east-west local street that intersects with Warrensville Center Road about 2500 feet south of Chagrin Boulevard. The drive serves as access to a few office buildings. Scottsdale Boulevard has a posted speed limit is 25 mph and carries an ADT of approximately 2,100. 2.2 Crash History Within the center of the study area, Warrensville Center Road, Chagrin Boulevard, Northfield Road and Van Aken Boulevard all meet a single, six-legged intersection. This intersection is ranked at #263 in ODOT’s 2006 Hot Spot Non-Freeway List (2004-2006) for the entire state. Also, this intersection is ranked as the 11th highest collision intersection in the county with 34 crashes found in the 2005 Accident Report produced by NOACA dated June, 2007. Interestingly, 14 (or 41%) of the accidents at this intersection were of the side-swipe passing crash type. It is likely that the high frequency of side-swipe passing crashes here is due to the complex, multiple lane turning movements required to be made by drivers. This is also an indication that the current intersection geometry and operation is confusing to drivers and is probably a contributing factor to the accident history at this location. The excerpts of these two crash reports are presented in Appendix A. The City of Shaker Heights Police Department ranks the top ten most dangerous intersections in the City based on the total number of traffic collisions at each intersection. Three of the intersections in the TOD study area are on that list. Between 1997 and 2007, over 40% of all intersection collisions in the top ten, occurred at one of the study intersections.
Rank Intersection Crashes (1997 – 2007) 1. Warrensville/Van Aken/Chagrin/Northfield 474 2. Fairmount/Warrensville 247 3. Chagrin/Lee 227 4. Fairmount/Fairmount Circle 227 5. Farnsleigh/Van Aken 211 6. Lee/Van Aken 209 7. Lee/Shaker 182 8. Green/Shaker 176 9. Shaker/Warrensville 176 10. Fairmount/Green 141

Section 3 Existing Traffic Conditions

Shaker Heights TOD Study
Page 6
3.0 Existing Traffic Conditions
Prior to analyzing projected traffic conditions, it is appropriate to assess existing traffic operations within the study area. This chapter presents information regarding existing traffic conditions including traffic count data, traffic control and levels of service. 3.1 Existing Traffic Volumes URS Corporation performed detailed traffic movement counts at the following intersections: • Chagrin Boulevard/Lynnfield Road • Chagrin Boulevard/Norwood Road • Chagrin Boulevard/Lomond Boulevard/Farnsleigh Road • Chagrin Boulevard/Warrensville Center Road • Chagrin Boulevard/Helen Road • Chagrin Boulevard/Colton Road • Warrensville Center Road/Scottsdale Boulevard • Warrensville Center Road/Norwood Road • Warrensville Center Road/Office Max Drive • Warrensville Center Road/Farnsleigh Road • Van Aken Boulevard/Farnsleigh Road • Lomond Boulevard/Sussex Road The raw traffic counts are presented in Appendix B. The study area’s existing traffic volumes were balanced and then summarized in Exhibit 2. 3.2 Design Year No-Build Traffic Volumes The City of Shaker Heights provided URS traffic studies that provide data back to 1981. These old studies were used to derive an average growth rate of 0.4%1 in the study area. This growth rate was applied linearly over twenty years to arrive at the Design Year of 2028. The Design Year No-Build traffic summary is presented in Exhibit 3. The supporting data for the growth rate is presented in Appendix C. 3.3 Rating System for Roadway Adequacy Roadway adequacy in this traffic study refers to the ability of the roads, intersections and traffic control to process traffic demand. This concept is measured through conducting capacity analysis at major intersections. The intersection capacity analysis techniques outlined in the Highway Capacity Manual2 were used to analyze the adequacy of the intersections within the study area. These 1 Subject to confirmation from NOACA 2 "Highway Capacity Manual, 2000", Transportation Research Board, National Research Council, Washington, DC.
Shaker Heights TOD Study
Page 7
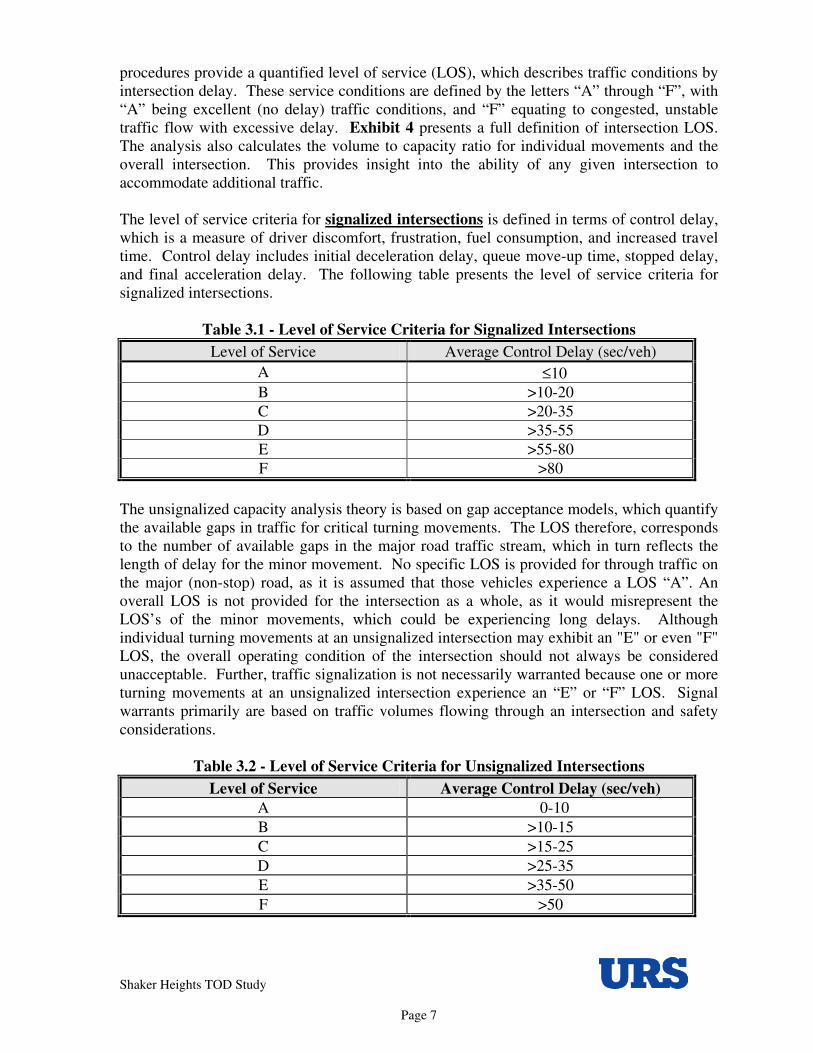
procedures provide a quantified level of service (LOS), which describes traffic conditions by intersection delay. These service conditions are defined by the letters “A” through “F”, with “A” being excellent (no delay) traffic conditions, and “F” equating to congested, unstable traffic flow with excessive delay. Exhibit 4 presents a full definition of intersection LOS. The analysis also calculates the volume to capacity ratio for individual movements and the overall intersection. This provides insight into the ability of any given intersection to accommodate additional traffic. The level of service criteria for signalized intersections is defined in terms of control delay, which is a measure of driver discomfort, frustration, fuel consumption, and increased travel time. Control delay includes initial deceleration delay, queue move-up time, stopped delay, and final acceleration delay. The following table presents the level of service criteria for signalized intersections.
Table 3.1 - Level of Service Criteria for Signalized Intersections Level of Service Average Control Delay (sec/veh)
A ≤10 B >10-20 C >20-35 D >35-55 E >55-80 F >80
The unsignalized capacity analysis theory is based on gap acceptance models, which quantify the available gaps in traffic for critical turning movements. The LOS therefore, corresponds to the number of available gaps in the major road traffic stream, which in turn reflects the length of delay for the minor movement. No specific LOS is provided for through traffic on the major (non-stop) road, as it is assumed that those vehicles experience a LOS “A”. An overall LOS is not provided for the intersection as a whole, as it would misrepresent the LOS’s of the minor movements, which could be experiencing long delays. Although individual turning movements at an unsignalized intersection may exhibit an "E" or even "F" LOS, the overall operating condition of the intersection should not always be considered unacceptable. Further, traffic signalization is not necessarily warranted because one or more turning movements at an unsignalized intersection experience an “E” or “F” LOS. Signal warrants primarily are based on traffic volumes flowing through an intersection and safety considerations.
Table 3.2 - Level of Service Criteria for Unsignalized Intersections Level of Service Average Control Delay (sec/veh)
A 0-10 B >10-15 C >15-25 D >25-35 E >35-50 F >50

Shaker Heights TOD Study
Page 8
3.5 Design Year No-Build Capacity Analysis The software package Synchro 53 was used to analyze the levels of service for this study. The Design Year No-Build A.M. and P.M. peak hour volumes were analyzed for the study area. Lane usage and LOS for the Design Year No-Build traffic conditions are summarized in Exhibit 5 and Table 3.3. It is important to note that this analysis is considered the No-Build analysis from which a comparison will be made assuming the development is built. The capacity analysis worksheets for the base traffic conditions are provided in Appendix D.
Table 3.3 – Design Year No-Build Signalized Capacity Analysis
AM Overall PM Overall Location LOS V/C LOS V/C
Warrensville Center Road/Farnsleigh Road B 0.69 C 0.78 Chagrin Boulevard/Warrensville Center Road E 0.90 F 1.14 Warrensville Center Road/Office Max Drive A 0.29 A 0.54 Warrensville Center Road/Norwood Road A 0.80 A 0.61 Van Aken Boulevard/Farnsleigh Road B 0.53 B 0.59 Chagrin Boulevard/Norwood Road C 0.80 B 0.87 Chagrin Boulevard/Lomond Boulevard/Farnsleigh C 0.80 D 0.95
Table 3.4 – Design Year No-Build Un-Signalized Capacity Analysis AM Worst Movement
PM Worst Movement
Location
LOS V/C LOS V/C Warrensville Center Road/Scottsdale Boulevard F 0.27 F 0.55 Chagrin Boulevard/Lynnfield Road D 0.37 F 0.65 Chagrin Boulevard/Helen Road D 0.31 F 0.46 Lomond Boulevard/Sussex Road A 0.15 A 0.31 Chagrin Boulevard/Colton Road D 0.40 F 0.55
The No-Build scenario analyzes the existing roadway network, assuming no additional development, and a general background growth rate of 0.4% was applied to the entire roadway network. The No-Build analysis shows that the Chagrin Boulevard/Warrensville Center Road intersection experiences significant delays. This six legged intersection is near capacity now in 2008 and will likely continue to degrade over the next 20 years if no roadway or traffic control improvements are made here. Significant capacity improvements at the Chagrin Boulevard/Warrensville Center Road intersection are required to allow for future development in the study area. Despite the Chagrin Boulevard/Warrensville Center Road intersection’s poor LOS results, most of the other peripheral signalized intersections perform reasonably well under future traffic loads; however, side street traffic at stop sign controlled intersections will continue to experience long delays.
3 Synchro 5, Traffic Signal Coordination Software, Trafficware, 2001.


Shaker Heights TOD Study
Page 11
Exhibit 4 – Level of Service Definitions

Section 4 Anticipated Traffic Conditions

Shaker Heights TOD Study
Page 13
4.0 Anticipated Traffic Conditions An evaluation of anticipated traffic volumes on the surrounding roadway network requires an estimation of future site-generated traffic volumes superimposed onto projected local traffic volumes. These combined traffic volumes are used to test the adequacy of the adjacent roadway network under a number of alternative transportation network scenarios. This chapter summarizes and presents the methodologies used to determine the anticipated traffic volumes associated with the proposed development. 4.1 Network Options A total of four alternative transportation networks were tested.
Table 4.1 – Network Options Summary Network Option Road Configuration RTA Configuration Existing Blue Line Terminal Alternate 1 (Exhibit 6)
Van Aken is deleted in between Farnsleigh and the Chagrin/Warrensville Intersection Farnsleigh is realigned to intersect with Chagrin at 90 degrees
As is – Warrensville station continues to operate as the terminus
Extend Blue line on diagonal Alternate 2A (Exhibit 7)
Same as alternative above with Farnsleigh realigned to intersect with Chagrin at 90 degrees Northfield is realigned to intersect with Chagrin opposite Helen (partial access only). In addition, a new east-west road connects Northfield to Warrensville, to the south of Chagrin
Farnsleigh Station is relocated to the east of Farnsleigh RTA Blue line is extended diagonally through the Chagrin / Warrensville intersection and a new intermodal station is created in the southeast quadrant of the Warrensville / Chagrin intersection.
Extend Blue Line along Warrensville Alternate 2B (Exhibit 8)
Same as alternative above Relocate the existing station and track to the east side of Warrensville with a future extension into the southeast quadrant of the Warrensville / Chagrin intersection.
Extend Van Aken to Warrensville Alternate 3 (Exhibit 9)
Same as alternative above with Van Aken extended straight through to a new signalized intersection on Warrensville, approximately 400 feet south of Farnsleigh
Same as alternative above

Shaker Heights TOD Study
Page 14
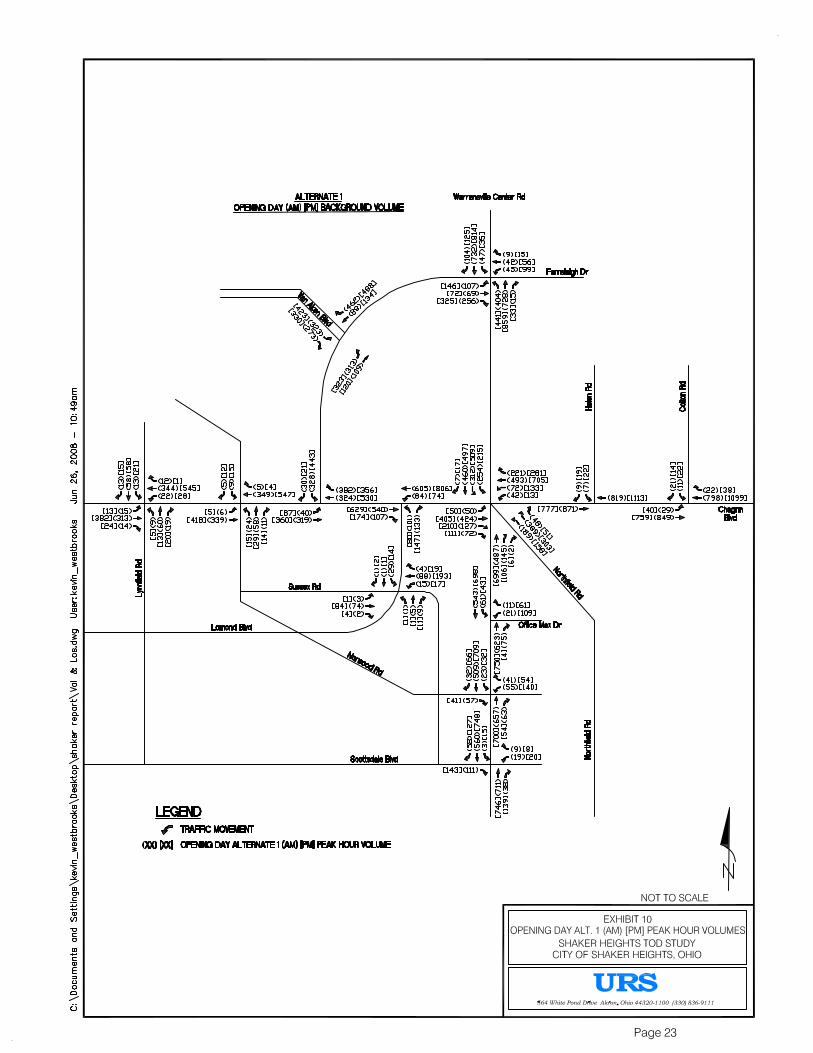
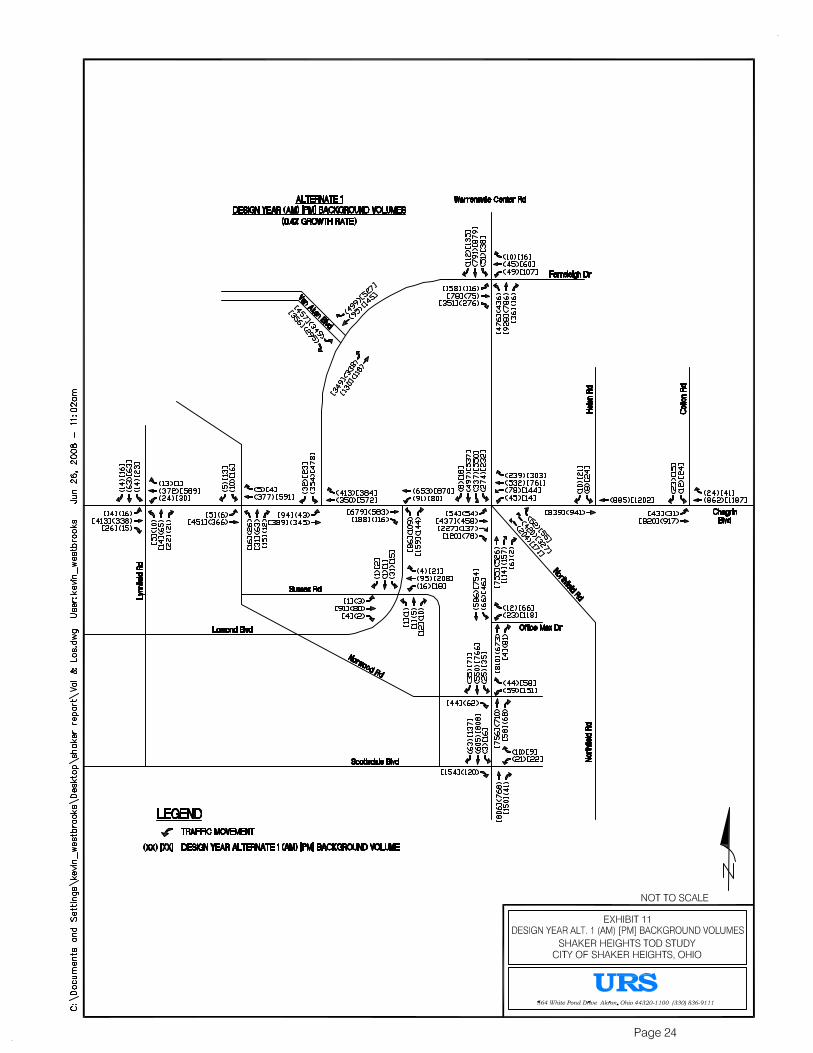
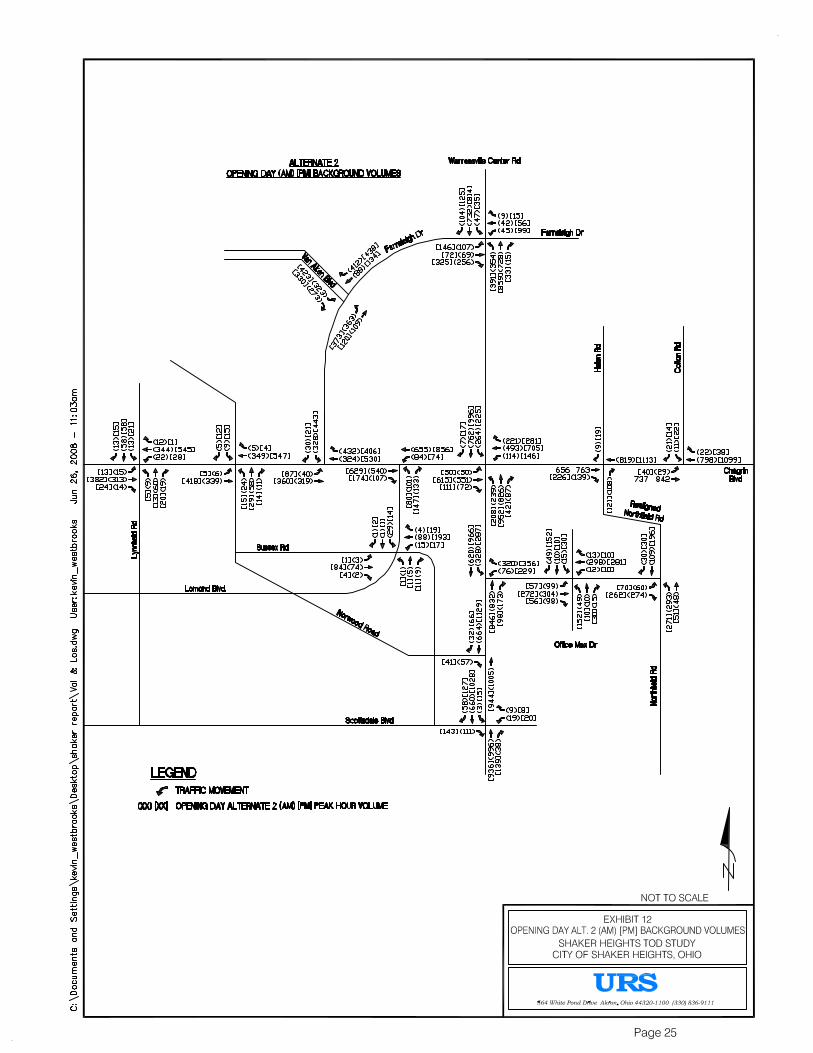
4.2 No-Build Traffic Volumes The traffic volumes for the No-Build conditions have been re-directed and re-distributed to reflect the Alternate 1 roadway network configuration. The Opening Day and Design Year Alternate 1 peak hour volumes are presented in Exhibits 10 and 11, respectively. The traffic volumes for the No-Build conditions have been re-directed and re-distributed to reflect the Alternate 2 roadway network configuration. The Opening Day and Design Year Alternate 2 peak hour volumes are presented in Exhibits 12 and 13, respectively. 4.3 Site Traffic Generation The trip-generation rates for the new development were calculated by following the methodologies and guidelines outlined in the Institute of Transportation Engineers’ (ITE) Trip Generation, 7th Edition4 manual. The proposed development is anticipated to consist of 160,000 ft2 of retail, 250,000 ft2 of offices, and 500 dwelling units (DU) of apartments. Since there is currently retail development at this location that will be demolished and rebuilt, this study assumes that the 160,000 ft2 of new retail will already be captured in the existing traffic counts and as such will not be added to the total trip generation results. Additionally, due to the mixed use of the development there is some internal capture that will likely occur. The trip generation internal capture rate worksheet is presented in Appendix E, and the generation rates in the table presented below take this internal capture rate into account:
Table 4.2 – Trip Generation Table AM Peak PM Peak Development ITE
Code Size
Enter Exit Enter Exit High Rise Apartments 222 500 DU 38 113 45 20
General Office Building 710 250k ft2 344 47 51 291 Shopping Center* 820 160k ft2 - - - -
Total 382 160 96 310 * - Since the existing development has 160,000 square feet of shopping center, the new shopping center traffic is assumed to already be included in the background traffic volumes. 4.4 Site Trip Distribution Following the procedures outlined in the Trip Generation Handbook5, distribution patterns were generated for the development drives and intersections using the existing traffic counts, general demographics of the area and engineering judgment as a guide. The year 2000 population data was obtained from the US Census Bureau (http://www.census.gov/). A three mile ring was used to develop the trip distribution pattern; the ring was split into zones to estimate what likely path(s) the generated traffic would take to reach the site. The census data and the traffic distribution model are presented in Appendix F.
4 “Trip Generation, 7th Edition”, Institute of Transportation Engineers, 2003. 5 “Trip Generation Handbook”, Institute of Transportation Engineers, 2001.

Shaker Heights TOD Study
Page 15
The Alternate 1 and Alternate 2 development distribution patterns are presented in Exhibits 14 and 15, respectively. The Alternate 1 and Alternate 2 development trips are presented in Exhibits 16 and 17, respectively. 4.6 Design Year Diverted Trips It is anticipated that major changes to network connections will result in through traffic selecting alternative routes through the study area. This redistribution of traffic for Alternatives 1 and 2 have been considered in our travel demand forecasts and are presented in Exhibits 18 and 19, respectively. 4.7 Design Year Full Build Traffic Volumes The Design Year No-Build traffic volumes have been combined with the development trips and diverted trips to arrive at the Design Year Alternate 1 and Alternate 2 full build volumes which are presented in Exhibits 20 and 21, respectively. 4.8 Design Year Alternate 1 Build Traffic Conditions The Design Year Alternate 1 full build A.M. and P.M. peak hour volumes were analyzed for this system of intersections. The full build traffic volumes include the background traffic grown to the year Design Year, traffic generated by the proposed development and the traffic re-routed throughout the roadway network due to capacity constraints. The Design Year Alternate 1 full build levels of service (LOS) are presented in Exhibit 22 and summarized in Tables 4.3 and 4.4. The capacity analysis worksheets for the Design Year Alternate 1 traffic conditions are provided in Appendix G.
Table 4.3 – Design Year Alternate 1 Signalized Capacity Analysis Results AM Overall PM Overall
Location LOS V/C LOS V/C Warrensville Center Road/Farnsleigh Road C 0.89 C 0.94 Chagrin Boulevard/Warrensville Center Road E 0.94 E 1.03 Warrensville Center Road/Office Max Drive A 0.29 A 0.54 Warrensville Center Road/Norwood Road C 0.36 B 0.61 Van Aken Boulevard/Farnsleigh Road B 0.81 C 0.87 Chagrin Boulevard/Norwood Road C 0.82 B 0.85 Chagrin Boulevard/Farnsleigh Road C 0.72 C 0.74

Shaker Heights TOD Study
Page 16
Table 4.4 – Design Year Alternate 1 Un-Signalized Capacity Analysis Results AM Worst Movement
PM Worst Movement
Location
LOS V/C LOS V/C Warrensville Center Road/Scottsdale Boulevard F 0.36 F 0.63 Chagrin Boulevard/Lynnfield Road D 0.41 F 0.70 Chagrin Boulevard/Helen Road D 0.31 F 0.50 Lomond Boulevard/Sussex Road A 0.18 A 0.34 Chagrin Boulevard/Colton Road D 0.39 F 0.61 Chagrin Boulevard/Lomond Boulevard C 0.46 C 0.48
The Alternate 1 scenario is essentially unchanged from the No-Build scenario except the Van Aken Boulevard link between Farnsleigh Road and Warrensville Center Road is removed and Farnsleigh Road is re-aligned to intersect perpendicularly with Chagrin Boulevard. The signal timing on the Farnsleigh Road at Warrensville Center Road is currently split phased, but due to the proposed lane modifications and new traffic patterns at this intersection, the split timing has been removed, and the phasing and lane usage has been modified to provide a Farnsleigh Road left-turn phase. The Alternate 2 lane usage modification in the study area is depicted in Exhibit 22. The background traffic has been grown by a 0.4% growth rate and the additional anticipated development traffic has been applied to the roadway network. Even though the roadway network has been loaded with development traffic, levels of service under this alternative remain largely unchanged versus the No-Build scenario. There is a slight improvement of traffic operations at the Chagrin Boulevard/Warrenville Center Road intersection due to the Van Aken Boulevard leg being removed; however, it is still operating at a LOS of E. 4.9 Design Year Alternate 2 Build Traffic Conditions The Design Year Alternate 2 full build A.M. and P.M. peak hour volumes were analyzed for this system of intersections. The full build traffic volumes were calculated from NOACA’s Regional Traffic Model. URS provided NOACA with current traffic counts at the study intersections to update their model. The NOACA model was modified to represent the roadway layout of Alternate 2 in order to take a regional look at the impact of the changes being proposed. NOACA provided URS with 2030 ADT data. K (peak hour) & D (direction) factors were used to convert the ADT’s to A.M. and P.M. peak hour traffic data to be used for capacity analysis. The K & D factors were derived from nine hour traffic counts performed by URS, which are presented in Appendix A. The Design Year Alternate 2 full build A.M. and P.M. peak hour volumes were analyzed for this system of intersections. The Design Year Alternate 2 full build levels of service are presented in Exhibit 23 and summarized in Tables 4.5 and 4.6. The capacity analysis worksheets for the Design Year Alternate 2 traffic conditions are provided in Appendix H.

Shaker Heights TOD Study
Page 17
Table 4.5 – Design Year Alternate 2 Signalized Capacity Analysis Results AM Overall PM Overall
Location LOS V/C LOS V/C Warrensville Center Road/Farnsleigh Road C 0.81 C 0.64 Chagrin Boulevard/Warrensville Center Road C/C* 0.77 C/C* 0.78 Warrensville Center Road/Office Max Drive A 0.69 B 0.86 Van Aken Boulevard/Farnsleigh Road C 0.65 B 0.66 Warrensville Center Road/Norwood Road B 0.74 B 0.84 Chagrin Boulevard/Norwood Road A 0.20 A 0.39 Chagrin Boulevard/Farnsleigh Road A 0.66 B 0.78 Chagrin Boulevard/Lomond Boulevard A 0.42 B 0.80
* - See Section 5 for a discussion of how the various the RTA alternatives were analyzed.
Table 4.6 – Design Year Alternate 2 Un-Signalized Capacity Analysis Results AM Worst Movement
PM Worst Movement
Location
LOS V/C LOS V/C Warrensville Center Road/Scottsdale Boulevard D 0.16 E 0.19 Chagrin Boulevard/Lynnfield Road E 0.47 F 0.70 Chagrin Boulevard/Helen Road B* 0.28 B* 0.24 Lomond Boulevard/Sussex Road A 0.19 B 0.45 Chagrin Boulevard/Colton Road C 0.41 F 0.59
* - This intersection has been assumed to operate as a right-in/right-out intersection in this scenario. The Alternate 2 scenario includes all of the improvements of Alternate 1 with a few additional network changes. First, the Northfield Road/SR 8 leg at the Chagrin Boulevard/Warrensville Center Road intersection has been removed and re-aligned to intersect perpendicular with Chagrin Boulevard across from Helen Road. Second, it is assumed that a road will be build that will connect Northfield Road with Warrensville Road, south of Chagrin Boulevard somewhere near the old Office Max/University Hospital buildings. This connection will allow motorists who would normally utilize Northfield Road to continue to have access to it. Also, it is assumed that as part of this connection a frontage road would be built that could connect some of the numerous drives along Warrensville Center Road and focus them into one access point at the Office Max Drive. This access management will eliminate unnecessary, mid-block congestion along Warrensville Center Road. Because of the frontage road, the east approach of Norwood Road to Warrensville Center Road could be removed, and the traffic signal replaced with a stop sign. The Alternate 2 lane usage modification in the study area is depicted in Exhibit 23. Even though the roadway network has been loaded with development traffic, levels of service under this alternative remain largely unchanged versus the No-Build scenario. However, now that the Van Aken Boulevard and Northfield Road legs are removed from the Chagrin Boulevard/Warrenville Center Road intersection, the traffic operations here have improved to a LOS of C even with transit preemption every 5 minutes. Also, the turning movements become more conventional and less confusing; and as such, safety should improve at this intersection.

Shaker Heights TOD Study
Page 18
4.10 Design Year Alternate 3 Build Traffic Conditions Alternative 3 would extend Van Aken Boulevard, along with the Rail line, through the proposed development and intersect with Warrensville Center Road about 450 feet south of Farnsleigh Road. This connection would be a one way road with traffic moving towards Warrensville Center Road. Also, Farnsleigh Road from Van Aken Boulevard to Warrensville Center Road would be converted into a one way road, with traffic moving away from Warrensville Center Road. Preliminary analysis of Alternative 3 was performed, and it was quickly determined that this alternative is less than ideal for a few reasons. First, the addition of another traffic signal in close proximity to two other signals would likely further contribute to traffic congestion and safety concerns along the Warrensville Center Road corridor. Also, this connection would segregate the northern and southern portions of the development and act as an impediment to pedestrian traffic. Initial Synchro analysis shows that the northbound 95th percentile queue length at Farsnleigh Road is estimated to be 433 feet and the southbound 95th percentile queue length at the new Van Aken Boulevard/Warrensville Center Road intersection is 423 feet. These queue lengths indicate that occasionally traffic would back up into the adjacent intersections. During peak hours of the day, these traffic queues would likely interfere with the signal operations of the adjacent intersections. For all of these reasons, no further analysis of this alternative was considered. The capacity analysis summarizing these queue length results is presented in Appendix I.

Shaker Heights TOD Study
Page 19
Intermodal terminal
Transit stop
Major Road Network
Transit lines with transit priority signal at level crossings / intersections
Transit priority signal
LEGEND
Traffic signal
Exhibit 6 – Alternate 1 Roadway and RTA Configuration

Shaker Heights TOD Study
Page 20
Exhibit 7 – Alternate 2A Roadway and RTA Configuration
Intermodal terminal
Transit stop
Major Road Network
Transit lines with transit priority signal at level crossings / intersections
Transit priority signal
LEGEND
Traffic signal

Shaker Heights TOD Study
Page 21
Exhibit 8 – Alternate 2B Roadway and RTA Configuration
Intermodal terminal
Transit stop
Major Road Network
Transit lines with transit priority signal at level crossings / intersections
Transit priority signal
LEGEND
Traffic signal

Shaker Heights TOD Study
Page 22
Exhibit 9 – Alternate 3 Roadway and RTA Configuration
Transit stop
Major Road Network
Transit lines with transit priority signal at level crossings / intersections
Transit priority signal
LEGEND
Intermodal terminal
Traffic signal


Section 5 VISSIM Analysis

Shaker Heights TOD Study
Page 37
5.0 VISSIM Analysis VISSIM is a microscopic traffic flow simulation model based on car following and lane change logic. VISSIM can analyze vehicular traffic including bus/tram, pedestrian and bicycle operations under constraints such as lane configuration, traffic composition, traffic signals, and bus/tram stops. VISSIM does not follow the conventional link/node modeling system, but utilizes a link/connector system that enables complex geometry to be modeled. The link/connector system also permits different traffic controls (signal, yield or stop) to be utilized anywhere in the model. Therefore, it is the most appropriate tool for the evaluation of the combination of complex geometry and traffic controls (yield, stop and traffic signal) operations that exist within the study area. 5.1 Model Components A VISSIM model consists of the following basic components:
• Base map • Highway network (links and connectors) • Traffic control (signals, stop signs, speed limits, and priority rules) • Traffic composition • Traffic volumes and routing decisions
5.2 Base Map Base maps were created for each of the analyzed scenarios. They where created in AutoCAD and exported to raster files for use in building the VISSIM model. The base map provides a basic underlying framework to place the VISSIM network on top of and finally produce a video file that clearly depicts the proposed roadway network. 5.3 Highway Network The VISSIM roadway network consists of placing links and connectors aligned with the lanes shown on the base map. The default urban link type was used throughout the study area. 5.4 Traffic Control Signal timings were obtained from Synchro and applied to the VISSIM model. Stop signs were placed on the side streets where necessary. Speed limits were placed based on the existing speed limits in the study area. Reduced speeds were then used for all turning movements to slow down the traffic as it makes turns. Priority rules are placed to simulate traffic yielding to the right-of-way, including pedestrians and other vehicular traffic. 5.5 Traffic Composition
Using the traffic counts as a guide, the VISSIM model was created using a traffic composition of 98% passenger vehicles 1.5% heavy vehicles, and 0.5% busses.

Shaker Heights TOD Study
Page 38
5.6 Traffic Volumes and Routing Decisions The VISSIM models use the traffic volumes that were originally developed by URS which are slightly higher than the volumes developed by NOACA and represent a more conservative representation of traffic flows. The number of lanes was established using the higher volumes. These models/videos were developed prior to NOACA submitting their traffic volumes. The NOACA volumes were tested in Synchro to confirm that the lane recommendations are still valid. Again, this would be a conservative view since the lanes presented satisfy both NOACA's and the URS volumes. The RTA line in this area typically has a headway of 10 minutes during the peak hours. However, since the RTA line terminates in the study area, the actual headway for study purposes is assumed to half the normal headway, or 5 minutes. 5.7 RTA Alignment A The first RTA alignment continues on the same path as the existing route except, rather than terminating northwest of the Chagrin Boulevard/Warrensville Center Road intersection, it crosses the intersection diagonally and terminates on the southeast quadrant. 5.8 RTA Alignment B The second RTA alignment extends from the Van Aken Boulevard/Farnsleigh Road intersection and intersects perpendicular with Warrensville Center Road. The RTA alignment then curves to the south, follows Warrensville Center Road, crosses Chagrin Boulevard, and terminates on the southeast quadrant of the Warrensville Center Road/ Chagrin Boulevard intersection. 5.9 RTA Analysis Results Both possible RTA alignments have been analyzed using VISSIM under the Design Year Alternative 2 roadway network. The VISSIM analysis of the Chagrin Boulevard/Warrensville Center Road intersection and RTA alignments are depicted on Exhibit 23. The raw VISSIM analysis is located in Appendix J.
Table 5.1 – Design Year Alternate 2 – RTA Alignment A
Location
AM Overall LOS
PM Overall LOS
Chagrin Boulevard/Warrensville Center Road C C
Table 5.2 – Design Year Alternate 2 – RTA Alignment B
Location AM Overall
LOS PM Overall
LOS Chagrin Boulevard/Warrensville Center Road C C Warrensville Center Road/Northern Rail Crossing A A

Section 6 Conclusions

Shaker Heights TOD Study
Page 39
6.0 Conclusions URS as part of the Planning Partnership Team has been retained by the City of Shaker Heights to prepare a transit-oriented development (TOD) plan and traffic study for the Warrensville/Van Aken rapid transit station and surrounding commercial district. The overall project goal is to improve the existing arterial road system and transform the existing commercial district into a vibrant, mixed-use downtown for Shaker Heights. This report assessed four different transportation network alternatives with the purpose of determining which configuration would support the redevelopment of the study area. Of the four scenarios tested, only two resulted in acceptable road and transit operations as illustrated in Exhibits 24 and 25. Both alternatives:
• Can support the significant redevelopment of the site with a mix of residential, office and retail space.
• Will enhance safety of the Warrensville / Chagrin intersection by greatly reducing the number of conflict points within the intersection.
• Will enhance pedestrian accessibility by reducing the Warrensville / Chagrin intersection to a normal 4-legged intersection with crosswalk on all for legs.
• Creates an opportunity for an improved intermodal facility at the end of RTA’s Blue Line.
• Protects for the expansion of the Blue Line in accordance with RTA’s Long Term Plans.
As presented in this study, without improvements to the roadway network, levels of service will be unacceptable. Even without the proposed development, the intersection of Warrensville Center/Chagrin Boulevard/Van Aken Boulevard/Northfield Road is operating at a LOS E in the AM peak hour and a LOS F in the PM peak hour. The proposed changes to this intersection will improve the LOS. By eliminating Van Aken Boulevard and Northfield Road, this intersection is anticipated to operate at a LOS C in both the AM and PM peak hours. The following table presents the LOS and ADT for both No-Build and Build scenarios for the major intersections in the study.
No-Build Build LOS LOS
Location ADT
AM PM ADT
AM PM 1 Warrensville Center Road/ Farnsleigh Road 24,730 B B 23,280 C C 2 Chagrin Boulevard/ Warrensville Center Road 45,141 B B 37,810 C C 3 Van Aken Boulevard/ Farnsleigh Road 19,689 E F 11,950 C B
As shown in the table, there will be slight decreases in the ADT for the Warrensville/ Farnsleigh and Van Aken/Farnsleigh intersections but there will be a significant decrease in the ADT for the Warrensville/Chagrin intersection. The future ADT will be lower because of the road closures. The Warrensville/Chagrin intersection has a much lower ADT because
Shaker Heights TOD Study
Page 40
it has two less roads entering the intersection. Some of the traffic from those closed roads will still make their way through the intersection but much of it will redirect out of the study area. The slight LOS decrease for the Warrensville/Farnsleigh and Van Aken/Farnsleigh intersections primarily due to the diversion of the traffic caused by the road closures. A LOS C at these locations in peak hours is still desirable. In trade for the change in LOS at those intersections, the Warrensville/Chagrin intersection will see a substantial increase in LOS. The result will be a “drivable” roadway system that will improve safety and provide capacity needed to support the proposed redevelopment area. The final selection of the preferred transportation network will be based on a number of transportation and non-transportation criteria including:
• Transportation o Ridership Potential
• Existing population / employment within ½ mile of stations • Proposed population / employment within ½ mile of stations
o Intermodal opportunities • Bus terminal of sufficient size/capacity to serve feeder routes • Parking / Kiss-N-Ride facilities
o Impact on traffic • Level of service (am/pm) of Chagrin / Warrensville intersection • Pedestrian accommodation • Opportunities for improvements in NW quadrant of Chagrin /
Warrensville • Opportunities within block and along major arterials of Warrensville
and Chagrin • Land Use / Development
o Compatibility with TOD concept plans o Opportunity to integrate stations into development
• Cost o Estimated capital cost for transit and road network improvements o Opportunity for external funding
Prior to the implementation of any development concept, additional analysis, either as part of this assignment, or subsequent studies must be undertaken including:
• Develop a pedestrian plan – The success of a TOD development is directly related to the pedestrian realm within and leading to the site. Urban design guidelines can advise on appropriate, attractive pedestrian oriented development. The development of safe crossings of major roads may affect the final transportation network configuration.
• Development access points – The level of development intensity will depend on how the local roads and access to parking areas interrelate. Site specific access on a development block-by-block basis will be required to confirm the safe and efficient movement of traffic.
Shaker Heights TOD Study
Page 41
• EIS in support major transportation initiatives – Future environmental planning efforts will be required and may consider alternative networks and may result in refinements to the concepts tabled within this report.
• Development of a retail strategy – The current retail serves the local community. As part of the development plan, the type and regional draw of the retail component could appreciably change the findings of this report. This will depend on the type and amount of actual retail proposed as part of any future development. Future development applications should address how the retail will affect the transportation system.

Shaker Heights TOD Study
Page 42
Exhibit 24 – Alternate 2A Roadway and RTA Configuration
Intermodal terminal
Transit stop
Major Road Network
Transit lines with transit priority signal at level crossings / intersections
Transit priority signal
LEGEND
Traffic signal

Shaker Heights TOD Study
Page 43
Exhibit 25 – Alternate 2B Roadway and RTA Configuration
Intermodal terminal
Transit stop
Major Road Network
Transit lines with transit priority signal at level crossings / intersections
Transit priority signal
LEGEND
Traffic signal
