subcommittee on materials 2016 annual meeting – · pdf file2016 annual meeting –...
TRANSCRIPT

Tech Section 2b Page 1 of 4
SUBCOMMITTEE ON MATERIALS 2016 Annual Meeting – Greenville, SC
Thursday, August 4, 2016 10:15 am-12:00 pm EST TECHNICAL SECTION 2b
Asphalts
I. Call to Order and Opening Remarks
II. Roll Call
Voting Members Blackburn Lyndi Alabama Tedford Darin Nevada Burch Paul Arizona Boisvert Denis New Hampshire Schiebel Bill Colorado Sheehy Eileen New Jersey Connery James Connecticut Streeter Donald New York State Khan Wasi DC Peoples Christopher North Carolina Bukowski John FHWA Lane Becca Ontario Nash Tanya Florida Mullis Cole Oregon Wu Peter Georgia Ramirez Timothy Pennsylvania Shishido Eric Hawaii Byrne Michael Rhode Island Mann Justan Illinois Egan Brian Tennessee Kreider Richard Kansas Hazlett Darren Texas Myers Allen Kentucky Andrus Scott Utah Bradbury Richard Maine Ahearn William Vermont Barot Sejal Maryland Bailey William Virginia Grieco John Massachusetts Farley Paul West Virginia Strizich Matt Montana Paye Barry Wisconsin Non-Voting Members Rothblatt Evan AASHTO Arasteh Michael FHWA Johnson Brian AMRL Smith Michael FHWA Knake Maria AMRL Harman Tom FHWA Lutz Robert AMRL Akisetty Chandra Maryland Lenker Steven AMRL Gallivan Victor Gallivan Consulting
Inc. Aschenbrener Tim FHWA
III. Approval of Technical Section MinutesRequest discussion and approval of Mid-Year minutes from February 17, 2016 webinar meeting.

Tech Section 2b Page 2 of 4
IV. Old BusinessA. SOM Ballot Items
ITEM 42 - SOM ballot item to revise M 320 to base PAV temperatures on climate when switching grades due to traffic or blending with other asphalt (RAP/RAS). See Appendix D-4 (pages 50-55) for the proposed standard and page 4 of the 2015 minutes for discussion and motion. 45 Affirmative, 0 negative, 7 No Vote. Comments from Kentucky, Massachusetts, and Oklahoma stating that footnote f is confusing. See Attachment #2 for some other potential wording. The Chair tried to propose wording to help eliminate the confusion. She also tried to add a table to help make it clearer. From Mid-year meeting, Lyndi will work on another revision to clear this up. She will email her revision out to the technical section to get comments before sending it to ballot.
B. TS Ballots TS 2b-16-01 – See Attachment #1 for all comments. ITEM 1 - Revise M 320, Performance-Graded Asphalt Binder, to add Note 4 to allow for extended binder grades. See attached marked up standard. 25 Affirmative, 0 Negative, 7 No Vote. Discuss comments from Kansas and Pennsylvania.
Kansas Department of Transportation (Richard E. Kreider) ([email protected])
I suggest using the active verb tense:
Note 4—Grades outside of Table 1 or Table 2 are sometimes specified. Specify a high, low, and intermediate temperature if specified grades are beyond those listed in Table 1 or Table 2. Specify the high and low temperature grade in 6 °C increments for consistency with the PG grading system.
(RAB)
Pennsylvania Department of Transportation (Timothy L Ramirez) ([email protected])
Affirmative with Comments: 1. The note addresses the issue without adding tothe tables; however, one has to assume that the grades outside the tables are following the same specification criteria or criteria trends as the grades that are in the table. A trend would be the PAV residue criteria for DSR and the 3 degree differences as the high temp grade changes. Suggest adding a sentence to the note that states something like, "The same criteria shown in Table 1 and Table 2 will apply to the grade that is outside the grades shown in Table 1 and Table 2 except the criteria will be determined at the high, low, and intermediate temperatures that are specifically specified."
ITEM 2 - Delete TP 78, Detecting the Presence of Phosphorus in Asphalt Binder. TP 78 is nearing the end of its life as a provisional standard. During the mid-year webinar, there was no support for adopting TP 78 as a full standard. This ballot item is to gauge the TS 2b interest in this standard. 22 Affirmative, 3 Negative, 7 No Vote. New Hampshire, Pennsylvania, and Vermont voted negative and expressed interest. Discuss moving TP 78 forward as a full standard.

Tech Section 2b Page 3 of 4
ITEM 3 - Adopt a new provisional standard entitled, "Performance-Graded Asphalt Binder for Surface Treatments". This standard was developed for TXDOT. Attached is the proposed standard and two presentations giving background information. 24 Affirmative, 1 Negative, 7 No Vote. Comments from Maryland, New Hampshire, New York, and Tennessee (Negative).
TS2b-16-02 (See Attachment #2) ITEM 1 - Adopt as a provisional test method, "Determining the Fracture Energy Density of Asphalt Binder Using the Binder Fracture Energy (BFE) Test". This test method was developed in research conducted for Florida DOT. Florida DOT has requested that TS 2b consider adoption of this test method to encourage further use and research into the test method. In addition to the proposed test method, a presentation is attached from the April 18th TS 2b Webinar. The presentation gives background information on the development of the test method. 26 Affirmative, 1 Negative, 5 No Vote. Comments were received from Virginia, Pennsylvania, Georgia, Kansas, Maine, Ontario, and Texas. New York voted negative and provided extensive comments, see Attachment #2. All comments were forwarded back to Florida for review and revisions as appropriate.
C. Task Force Reports Task Force 15-01 (T 48) – Task Force members are Eileen Sheehy (New Jersey) (Chair), Maria Knake (AMRL), Bill Bailey (Virginia), Jerry Peterson (Texas), and Ron Horner (North Dakota). Task Force to consider rewrite of T 48. The task force provided a draft specification for consideration. See Attachment #3.
Task Force 15-02 (M 320) – Task force was formed to explore the issue of extending the range of PG grades in M 320 for specialty uses. Members of the task force are Eileen Sheehy (New Jersey) (Chair), John D’Angelo (consultant), Jesus Sandoval-Gil (Arizona), Ala Mohseni (Pavement Systems), and Bill Bailey (Virginia). The task force provided revised wording that was balloted in TS 2b 2016-1. The item passed, but Lyndi was going to review the wording one more time.
Task Force 16-01 - Review ETG recommendations for elastic response, T 350, and M 332.Tanya Nash(FL), Eileen Sheehy (NJ), Barry Paye(WI), and Matt Corrigan(FHWA). Tanya left FFDOT. New task force leadership is needed to revitalize this task force. See the 2016 Mid-Year meeting minutes for details.
V. New Business A. Research Proposals
Brian Egan has graciously volunteer to be our Research Liaison. 1. 20-7 RPS
• Nevada has submitted a proposal entitled, “Effect of Elevation on Rolling Thin FilmOven Aging of Asphalt Binders”. The main research objective is to provide astandardized method for adjusting RTFO times based on elevation. See Attachment#4
2. Full NCHRP RPSB. AMRL/CCRL - Observations from Assessments? C. NCHRP Issues D. Correspondence, calls, meetings

Tech Section 2b Page 4 of 4
• Email from Brian Johnson, AMRL, forwarding information from Karl Zipf, Delaware DOT –Procedure for checking the TFO/PAV pans for excessive warping, see Attachment #5
• Email from Brian Johnson, AMRL, forwarding information from Karl Zipf, Delaware DOT –Procedure for checking the TFO/PAV pans for excessive warping, see Attachment #6
• T 240 and T 315 questions from Kathy Sokol, see Attachment #7.E. Presentation by Industry/Academia
• Asphalt Institute REOB Guidance Document – Mike Anderson, Director of Research andLaboratory Services, Asphalt Institute
F. Proposed New Standards G. Proposed New Task Forces H. Standards Requiring Reconfirmation I. SOM Ballot Items (including any ASTM changes/equivalencies)
VI. Open Discussion
VII. Adjourn

AASHTO Electronic Balloting System
Ballot Detail Report
Ballot Detail
Ballot Number: SOM_TS2B-16-01
Ballot Name: SOM_TS2B-16-01
Ballot Introduction: Technical Section 2b ballot for modifying one standard, deleting one standard, andadopting one standard.
Ballot Manager: Eileen C. Sheehy
Ballot Start Date: 4/1/2016
Ballot Due Date: 4/22/2016
SOM_TS2B-16-01
Item Number: 1 Description: Revise M 320, Performance-Graded Asphalt Binder, to add Note 4 to allow for
extended binder grades. See attached marked up standard.
Attachment(s): M 320 extended grades.docx
Decisions: Affirmative: 25 of 32 Negative: 0 of 32 No Vote: 7 of 32
Agency (Individual Name) Decision
Kansas Department of Transportation (Richard E. Kreider) ([email protected])
I suggest using the active verb tense:
Note 4—Grades outside of Table 1 or Table 2 are sometimes specified. Specify a high, low, and intermediate temperature if specified grades are beyond those listed in Table 1 or Table 2. Specify the high and low temperature grade in 6 °C increments for consistency with the PG grading system.
(RAB)
Affirmative
Maryland Department of Transportation (Chandra K Akisetty) ([email protected])
It is good to open up the specification for extended grading. We want to refer all tests conduct at 88-22 to same standards of binder testing (include temperature and frequency etc..) to compare the results.
Pennsylvania Department of Transportation (Timothy L Ramirez) ([email protected])
Affirmative with Comments: 1. The note addresses the issue without adding tothe tables; however, one has to assume that the grades outside the tables are following the same
Affirmative
Tech Section 2b Agenda Page 5 of 49

specification criteria or criteria trends as the grades that are in the table. A trend would be the PAV residue criteria for DSR and the 3 degree differences as the high temp grade changes. Suggest adding a sentence to the note that states something like, "The same criteria shown in Table 1 and Table 2 will apply to the grade that is outside the grades shown in Table 1 and Table 2 except the criteria will be determined at the high, low, and intermediate temperatures that are specifically specified."
Item Number: 2 Description: Delete TP 78, Detecting the Presence of Phosphorus in Asphalt Binder. TP 78 is
nearing the end of its life as a provisional standard. During the mid-year webinar, there was no support for adopting TP 78 as a full standard. This ballot item is to gauge the TS 2b interest in this standard.
Attachment(s): tp 078.docx
Decisions: Affirmative: 22 of 32 Negative: 3 of 32 No Vote: 7 of 32
Agency (Individual Name) Decision
New Hampshire Department of Transportation (Denis M. Boisvert) ([email protected])
Although this procedure is qualitative, it is relatively simple and quick while not requiring expensive equipment. Detecting Phosphorus in PPA, REOB, or other future modifiers may still have value.
Negative
Pennsylvania Department of Transportation (Timothy L Ramirez) ([email protected])
Negative with comments: 1. I did not support at the mid-year web meetingas my agency has not used this standard; however, I do see the potential value in maintaining it for forensic or verification testing/analysis even though it may result in a false positive. If PPA is used as a catalyst or a cross-linking enhancer for a polymer modifier and an agency wants to verify the PPA is there, I assume this test will verify the presence of the PPA. 2. If I am a lone negative, I will withdraw it, as Ican always go back and use this TP 78-09 (2013) version.
Negative
Vermont Agency of Transportation (William E. Ahearn) ([email protected])
The standard provided a means to reliably characterize the use of phosphorus based modification. Although industry compliance with modification rules has improved making the method less important, it remains a useful standard.
Any agency in need of an immediate method to asceratin unreported modification by phophorus compunds will need a method to do so. Altho an Agency may apply an obsolete standard TP85, there is an implication that the method is not good as evidenced by discontinuance over full standard adoption.
This issue may be addressed at the time of the
Negative
Tech Section 2b Agenda Page 6 of 49

motion by including the phrase "Discontinuance of this standard is accomplished for reduced administrative burden without concern for the accuracy or reliability of the method."
Item Number: 3 Description: Adopt a new provisional standard entitled, "Performance-Graded Asphalt Binder
for Surface Treatments". This standard was developed for TXDOT. Attached is the proposed standard and two presentations giving background information.
Attachment(s): MP SPG.docx DOC Meeting - June 2015 - SPG Update.pptx TxDOT_SPG_Oct2015_Revise.pdf
Decisions: Affirmative: 24 of 32 Negative: 1 of 32 No Vote: 7 of 32
Agency (Individual Name) Decision
Kansas Department of Transportation (Richard E. Kreider) ([email protected])
Change the grades in 4.1 to match what's in Table 1.
(RAB)
Affirmative
Maryland Department of Transportation (Chandra K Akisetty) ([email protected])
1. It’s a great study and will help agencies tomaintain consistency for their binders for surface treatments. NCHRP 09-50 is doing nationwide study on same project, we don’t know whether TxDOT took their input. It’s worth waiting for their recommendations before adopting into AASHTO (just a thought).
2. Why is this study referring to TP5 for shearstrains when T 315 is in existence?
Maryland Department of Transportation (Sejal Barot) ([email protected])
1. It’s a great study and will help agencies tomaintain consistency for their binders for surface treatments. NCHRP 09-50 is doing nationwide study on same project, we don’t know whether TxDOT took their input. It’s worth waiting for their recommendations before adopting into AASHTO (just a thought).
2. Why is this study referring to TP5 for shearstrains when T 315 is in existence?
Affirmative
New Hampshire Department of Transportation (Denis M. Boisvert) ([email protected])
Not sure if additional considerations might be necessary for extreme climates that differ from that of Texas.
Affirmative
New York State Department of Transportation (Robert A Burnett) ([email protected])
3 degree increments for the binder grading seems unnecessary. Why was -13 dropped from the table for a high temp of 73? What about grades for northern states with lower temps?
Affirmative
Tech Section 2b Agenda Page 7 of 49

If M320 needs the new Note 4, it seems this spec needs it too.
4.1 - Neither of the grades listed as examples are in Table 1.
Tennessee Department of Transportation (Brian K. Egan) ([email protected])
At this time, this provision should be a State specific standard and not a National standard. The SPG tables are only reflective of one (maybe a few states) and do not address all the climatic temperatures around the county/Canada or the use of modified binders and/or emulsions used for surface treatments.
Negative
Wisconsin Department of Transportation (Barry C Paye) ([email protected])
Will monitor for use and adoption by other states. Affirmative
Tech Section 2b Agenda Page 8 of 49

Attachment #2
Item Number:
Description:
Affirmative: 26 of 32
Negative: 1 of 32
No Vote: 5 of 32
Agency (Individual Name) Decision1. MSCR test is currently deemed a "gold standard" for binder test to distinguish modified asphalt and unmodified binderproperties. Has BEF test been compared with MSCR test? Or has BEF results been correlated to MSCR results?
2. Have any binder service history/field performance data been collected from the asphalt pavement with high BEF value andfrom the asphalt pavement with low BEF value?No correlations to field performance from what I have read. It does appear to identify modified binders and looks encouraging if some field verification could be developed.
Under section 5. the loading rate is noted from 100-900 mm/min. In the procedure they state to run the test at 500 mm/min. Is the comment in section 5 needed?The Apparatus states a load cell capable of measuring 100lbs. I would specify the strength load cell needs to be. As a high strength load cell can't measure 100lbs accurately.
6.2 - if only running at 500 mm/min, why the need to run at other rates? This shouldn't be a requirement unless needed. Ok, in the procedure it does state that if two successive tests are run, then re-run the test at a different rate until it passes. This sounds kind of fishy as they state in their research that the rate didn't matter.
Ballot Name: TS2B-16-02
AASHTO Electronic Balloting System
Ballot Detail Report
Ballot Detail
Ballot Number: SOM_TS2B-16-02
Ballot Start Date: 04/25/2016
Ballot Due Date: 05/16/2016
Standard Testing Method for Binder Fracture Energy...BFE Test Webninar.pdf
TS2b-16-02
Affirmative
Kansas Department of Transportation (Richard E Kreider) ([email protected])
Affirmative
1
Adopt as a provisional test method, “Determining the Fracture Energy Density of Asphalt Binder Using the Binder Fracture Energy (BFE) Test”. This test method was developed in research conducted for Florida DOT. Florida DOT has requested that TS 2b consider adoption of this test method to encourage further use and research into the test method. In addition to the proposed test method, a presentation is attached from the April 18th TS 2b Webinar. The presentation gives background information on the development of the test method.
Attachment(s):
Decisions:
Georgia Department of Transportation (Peter Wu) ([email protected])
Tech Section 2b Agenda Page 9 of 49

They state the end tab the sample adhere to can be aluminum, I assume they tested this as the pictures show a plastic material and not aluminum. (CWL)
Reference Documents: I believe AASHTO T40 is superseded by AASHTO R66.
Numbering sequence in Section 9 needs to be corrected: 9.1.2 should be 9.2.1.
10.3 states "Place the molds and the end tab assembly in the oven at the same temperature used to heat the asphalt binder for no more than 3 minutes." I suggest changing to a time range, such as "at least 2 but no more than 3 minutes" or similar.
11.3.1: Suggest changing "binder recovered from old field cores." to "binder recovered from aged pavement" or "oxidized pavement."As written, the "Significance and Use" section tells us how they arrived at test temperature and displacement rate, but doesn’t say why the test is significant or useful. The test measures fracture energy density, why is that important to know? How do I use the results in a meaningful way?1.1.1. "Specimen molds could be manufactured from aluminum".[rt1] [rt1]What else could they be manufactured from? Is there a specific designation for the materials? Ex. diagram for loading head specifically says 300 series stainless steel or 6061-T6 aluminum.aluminum molds. [rt1] [rt1]What do you use for release agent if molds made from something other than aluminum? (6.4.1 indicates other materials are possible)Comments:
General Direct metric translations such as 448 N in section 6.2.2 or 163 degrees C in section 10.2 imply accuracy beyond what is desired or required. Should be rounded appropriately.
10.3 Reference to paper clip should be changed to binder clip or foldover clip. Paper clip implies typical paper clip.
11.1 What is a good test result? Should suggest or define basis of good/bad identification. Non-repeatable? Standard deviation? Range? End tab separation?
15 Data interpretation is very complicated, should have software or calculation layout provided.
17.1.5 Peak load should not be in lbs, should be metric
Affirmative with comments:
1. From webinar slides and Figures 16 in the standard, this test appears to capture different true stress vs. true strainrelationships for the different types of indicated binders (unmodified, rubber modified, SBS modified, and hybrid binders). It is recommended that the TS-2b keep aware of who uses this provisional standard, if it's adopted, and their results with relation to field performance to allow for comprehensive consideration of this standard in the future for full adoption.
2. In Section 4.4, at end of 1st sentence, revise from "binder" to "binders".
3. In Section 5.2, 2nd sentence, revise from "0 ºC and 30 ºC" to "0 ºC to 30 ºC".
4. In Section 5.3, 1st sentence, revise from "is found" to "was found".
5. In Section 6.4.2, revise from "mental rings" to "metal rings".
6. In Section 6.4.3, consider eliminating this subsection as it is similar to Section 7.3. Section 7.3 is written better.Alternatively, fully replace the text of Section 6.4.3 with the text of Section 7.3 and then delete the text in Section 7.3 so this text is only in one location.7. In Section 6, consider adding a subsection 6.4.4 with text "Binder Clips - paper binder clips for securing the mold assemblyconsisting of side plates, bottom plate, and end tabs.8. In Section 6, consider adding a subsection 6.4.5 with text "Trim knife - a straight edged trimming tool, such as a puttyknife, for trimming the molded test specimen of excess asphalt binder after pouring the test specimen."
9. In Figure 6-3-A, revise Note 2 from "X.X=±0.6(0.03)" to "X.X=±0.8(0.03)". Current tolerance is inconsistent with samedimensional tolerances in Figures 6-1, 6-2 and 6-4 and is inconsistent with the indicated equivalent tolerance for inches of "(0.03)".
Maine Department of Transportation (Richard L Bradbury) ([email protected])
Affirmative
New York State Department of Transportation (Robert A Burnett) ([email protected])
Negative
Ontario Ministry Of Transportation (Becca Lane) ([email protected])
Affirmative
Pennsylvania Department of Transportation (Timothy L Ramirez) ([email protected])
Affirmative
Tech Section 2b Agenda Page 10 of 49

10. In Figure 6-3-B, revise Note 2 from "X.X=±0.6(0.03)" to "X.X=±0.8(0.03)". Revise for same reason given in comment#9 above.11. In Section 7.3, consider comments noted above in comment #6.
12. In Section 8, revise from "and required safety procedures" to "and safety procedures required" to be consistent with thefirst part of same sentence regarding the order of words where "laboratory safety procedures required" is used.
13. In Section 10.2, last sentence, add a comma after the word "process".
14. In Section 10.3, 5th sentence, revise from "paper clips" to "binder clips" as what is shown in Figure 10-2 is not atraditional paper clip, but these are more commonly referred to as "binder clips".15. In Section 10.6, 1st sentence, revise from "straightedge" to "trim knife".
16. In Section 10.6, next to last sentence, revise from "hot knife" to "hot trim knife".
17. In Section 10.7 last sentence, revise from "that same" to "that the same" for better readability.
18. Figure 10-1 is not referenced in any part of the text. Consider referencing Figure 10-1 somewhere in the text, possibly inSection 10.8 or other appropriate Section.19. In Section 11.2.1, 3rd sentence, which begins "Prior to running...", it is not clear what this sentence is trying to convey byindicating the specimen should be suspended in a vertical position. Perhaps is their a specific time that it should be suspended? Or, is the suspended specimen related to the next sentence which begins "Bending must be avoided..."? Otherwise, it seems obvious that the test specimen will be suspended vertically especially by Figure 9-1.
20. In Section 11.2.1, last sentence, revise from "in as short time" to "in as short of a time" for better readability.
21. In Section 14.1, 2nd sentence, consider revising from "mineral spirit cleaner" to "mineral spirit solvent" for consistencywith Section 7.4 where it refers to "solvent" with mineral spirits being considered as a solvent.
22. In Section 14.1, last sentence, revise from "grease on film" to "grease or film".
23. In Section 15.1, next to last sentence, revise from "area occur, which make" to "area occurs, which makes" for betterreadability.24. In Section 15.1, last sentence, revise from "Consequently, data" to "Consequently, a data" for better readability.
25. In Section 15.1.5, 3rd sentence, shouldn't "Length L" be "Length Lpeak" for consistency between the text and Figure 15-3b?26. In Figure 15-3 c, revise the figure labels from "L" to "L1" and from "A" to A1" to be consistent with the text in Section15.1.5, 3rd sentence where it refers to "Length L1" and "(Figure 15-3 c)".27. In Section 15.1.6, Equation (1), and Equation (1)'s Where definitions, this equation's parameters and definitions do notmatch up cleanly with the Length and Area dimensional labels "L0", "Lpeak", "L", and "A0", "Apeak" and "A" in Figures 15-3 a, b, and c. Revise either the Figures 15-3 a, b, and c and/or Equation (1)'s parameters so that the equation and definitions match and are consistent with Figures 15-3 a, b, and c.
28. In Section 15.1.7, Equation (2) and Equation (2)'s Where definitions and Equation (3) and Equation (3)'s Wheredefinitions, these equation's parameters and definitions do not match up cleanly with the Length and Area dimensional labels "L0", "Lpeak", "L", and "A0", "Apeak" and "A" in Figures 15-3 a, b, and c. Revise the Figure 15-3 a, b, and c and/or the Equation (2) and Equation (3) parameters so that the equations and definitions match and are consistent with Figures 15-3 a, b, and c.29. In Section 16.1, 7th line from top, revise from "failure occur at much" to "failure occurs at much" for better readability.
30. Add Section 18 - PRECISION AND BIAS with text to indicate if P&B estimates are available or not.
31. Add Section 19 - KEYWORDS with text providing appropriate key words for this standard. Perhaps "asphalt binder,fracture, fracture energy density".32. Add Section 20 - REFERENCES and list any research reports providing information about the development of this test andprocedure.
We don't have any plans to use this, but we do not object to adopting it as a provisional standard. Texas Department of Transportation (Darren Hazlett) ([email protected])
Affirmative
Tech Section 2b Agenda Page 11 of 49

• Figures are confusing because it's hard to distinguish the parts from the dimension lines; I suggest a heavier line weight for the parts for clarity. • The apparatus does not describe the load frame as necessarily vertical, but the figures and Section 9.1.1 talk about the upper andlower head. Either a) the apparatus needs to be identified as required vertical, or b) "fixed head" and "cross head" should be used instead of lower and upper head.
• Section 9.2 wants a "friction value" but it's very vague on what is actually measured and recorded. It's also not explained where thisis used in the data interpretation; in fact the word "friction" doesn't occur again in the document. Also 9.2.2 is incorrectly numbered 9.1.2.
• Data interpretation: Too much explanation! Give plain instruction on how to calculate the results of the test. More background canbe included in an appendix.
• Section 16 should be in an appendix.
• Although the test may have been developed for PG binder that have been RTFO and PAV aged, (and any precision and biasstatement may only apply to this treatment) this is a measurement of a fundamental property, and there is no need to restrict its use to this specific aging condition.
15.1.2 and 15.1.3 It might be better to have equations in the body of the text (not in the graph)?
15.1.6. please, specify the units for A & L.
Virginia Department of Transportation (William R Bailey) ([email protected])
Affirmative
Tech Section 2b Agenda Page 12 of 49

Standard Method of Test for
Flash and Fire Points of Asphalt Binder by Cleveland Open Cup
AASHTO Designation: T 48-06 (2015)XX ASTM Designation: D92-05a
American Association of State Highway and Transportation Officials 444 North Capitol Street N.W., Suite 249 Washington, D.C. 20001
Tech Section 2b Agenda Page 13 of 49

Standard Method of Test for
Flash and Fire Points of Asphalt Binder by Cleveland Open Cup
AASHTO Designation: T 48-06 (2015)XX ASTM Designation: D92-05a
1. SCOPE
1.1. This method covers the procedure for the determination of flash point of asphalt binder by the Cleveland open-cup apparatus.
1.2. This test method is applicable to asphalt binder with flash point between 80°C (175°F) and 400°C (750°F)
Note 1—Specifications commonly designate the Tag Open-Cup method (T 79) for asphalt binders and cutback asphalts having flash points below 93°C (200°F).
1.3. The values stated in SI units are to be regarded as the standard.
1.4. This test may involve hazardous materials, operations, and equipment. This test does not purport to address all of the safety concerns associated with its use. It is the responsibility of the user to establish appropriate safety and health practices and determine the applicability of regulatory limitations prior to use.
2. REFERENCED DOCUMENTS
2.1. AASHTO Standard: R 18, Establishing and Implementing a Quality Management System for Construction
Materials Testing Laboratories R 66, Sampling Asphalt Materials T 79, Flash Point with Tag Open-Cup Apparatus for Use with Material Having a Flash Point
Less Than 93°C (200°F)
2.2. ASTM Standard: C670, Standard Practice for Preparing Precision and Bias Statements for Test Methods for
Construction Materials E1, Standard Specification for ASTM Liquid-in-Glass Thermometers E220, Standard Test Method for Calibration of Thermocouples By Comparison Techniques E644, Standard Test Methods for Testing Industrial Resistance Thermometers
Tech Section 2b Agenda Page 14 of 49

3. SUMMARY OF TEST METHOD
3.1. The sample is placed in the tester and heated rapidly to begin with then at a slow rate. A small test flame is passed at a uniform rate in a level plane across the cup at specified intervals. The flash point is the lowest temperature at which application of the test flame causes the vapor at the surface of the liquid to flash.
4. APPARATUS
4.1. Cleveland Open-Cup Tester—Consisting of the following parts. The parts must conform to the dimensions shown and have the additional characteristics as noted. (See Figure 1.) The Cleveland Open Cup Tester may be manual or automated. If automated, the flash point instrument shall perform the test in accordance with Section 7.
Replace the dimensions in Figure 1 with the following: Millimeters Inches
Min Max Min Max A—Diameter 3.8 5.4 0.15 0.21 B—Radius 152 nominal 6 nominal C—Diameter 1.6 5.0 0.06 0.20 D 5.0 0.20 E 6.4, approximately 0.25, approximately F—Diameter 0.8 nominal 0.031 nominal
Figure 1 – Cleveland Open Cup Apparatus
Tech Section 2b Agenda Page 15 of 49

Replace the dimensions in Figure 2 with the following: Millimeters Inches
Min Max Min Max A 6.4, nominal 0.25, nominal B 0.5 1.0 0.020 0.039 C 6.4, nominal 0.25, nominal D—Diameter 54.5 56.5 2.15 2.22 E—Diameter 69.5 70.5 2.736 2.776 F—Diameter 150, nominal 6, nominal
Figure 2 – Heating Plate
Replace the dimensions in Figure 3 with the dimensions below. Do not include a dimension “G” as shown in Figure 3. However, include a dimension for the thickness of the flange of the test cup that is not included in Figure 3. This dimension for the thickness of the flange shall be designated “K” with the dimensional requirements as in the following table:
Tech Section 2b Agenda Page 16 of 49

Millimeters Inches
Min Max Min Max A 67.5 69 2.658 2.717 B 62.5 64.0 2.46 2.52 C 2.8 3.6 0.11 0.14 D—Radius 4, approximately 0.16, approximately E 32.5 34 1.280 1.339 F 9 10 0.354 0.394 G 1.8 3.4 0.07 0.13 H 2.8 3.6 0.11 0.14 I 67 70 2.638 2.756 J 97 101 3.8 4.0 K 1.8 3.4 0.07 0.13
Figure 3 – Cleveland Open Cup
4.1.1. Test cup-cup made of brass or other metal of similar conductivity conforming to Figure 3. The cup may be equipped with a handle.
4.1.2. Heating Plate-plate that ensures the heat is evenly distributed over the bottom of the test cup and that extraneous heating to other surfaces is minimized. See Figure 2 for plate dimensions.
4.1.3. Heat Source—Gas burner or electric heater centered under the opening of the heating plate with no local overheating. If using a gas burner, protect the flame from drafts using suitable shields that do not project above the top of the heating plate.
4.1.4. Thermometer Holder—Supplied with the tester. It shall support the thermometer firmly in a vertical position.
4.1.5. Heating Plate Holder-Support to hold the heating plate level and steady.
1.1.1.4.1.6. A1.3 Ignition Source Applicator—The device for applying the test flame may be of any suitable design, but the tip shall be 1.6 to 5.0 mm (0.06 to 0.20 in.) in diameter at the end and the orifice shall have an approximate diameter of 0.8 mm (0.031 in.). The device for applying the test flame shall be so mounted to permit automatic duplication of the sweep of the test flame, the radius of swing being not less than 150 mm (6 in.) and the center of the orifice moving in a plane not more than 2.5 mm (0.10 in.) above the cup. A bead having a diameter of 3.8 to 5.4 mm (0.15 to 0.21 in.) shall be mounted in a convenient position on the apparatus so the size of the test flame can be compared to it.
4.2. Thermometer—An ASTM 11C (11F) thermometer as prescribed in ASTM E1 with an accuracy of 0.2°C (0.5°F). The thermometer shall be calibrated according to the requirements specified in R 18. This thermometer shall be used to make all temperature measurements required by this method.
4.2.1. The test thermometer may be replaced with an alternative thermometric device, provided the following requirements are met:
4.2.1.1. The thermometric device shall be mounted in the same position as the test thermometer it replaces.
4.2.1.2. The thermometric device shall (1) have a maximum scale error no greater than that of the test thermometer it replaces, (2) be capable of indicating temperature within 0.1°C (0.2°F), and (3) have the same temperature response.
Tech Section 2b Agenda Page 17 of 49

4.2.1.3. The thermometric device shall be standardized at the interval specified in R 18. Guidance for performing the standardization is given in ASTM E220 or E644.
1.2.4.3. A1.7 Filling Level Gauge(optional)—A device to aid in the proper adjustment of the sample level in the cup. It may be made of suitable metal with at least one projection, but preferably two for adjusting the sample level in the test cup to 9 to 10 mm (0.35 to 0.39 in.) below the top edge of the cup. A hole 0.8 mm (0.031 in.) in diameter, the center of which is located not more than 2.5 mm (0.10 in.) above the bottom edge of the gauge, shall be provided for use in checking the center position of the orifice of the test flame applicator with respect to the rim of the cup. (Figure 4 shows a suitable version.)
Figure 4—Filling Level Gauge
5. CALIBRATION AND STANDARDIZATION
5.1. The thermometer or thermometric device shall be standardized at the interval specified in R 18.
5.2. The performance of the apparatus shall be verified at least once per year by determining the flash point of a known reference material. Run the test according to Section 7 on a Certified Flash Point Material. The Certified Flash Point Material shall have test results for T 48 or for ASTM D92. To be considered acceptable, the flash point shall be within ±8.0°C (±14.4°F) of the certified test result. If the test result is out of tolerance, check the apparatus for compliance with Section 4 and rerun with a new sample.
Tech Section 2b Agenda Page 18 of 49

6. ASSEMBLY AND PREPARATION OF APPARATUS
6.1. The Cleveland open-cup tester shall be placed in a firm and level position on a solid, vibration-free table in a draft-free hood or flash room, or well toward the back of a draft shield. The top of the tester shall be shielded from strong light so that the flash may be easily seen.
6.2. The temperature measuring device shall be positioned with the bottom of the device being 6.4 ± 1.0 mm (0.25 ± 0.04 in) above the bottom of the test cup and approximately half way between the center and the inside edge of the test cup on the side opposite the test flame applicator mounting position.
6.3. Follow manufacturer’s instructions for setting up the manual or the automated apparatus for operation. Set the automated tester to run the test in accordance with Section 7.3.
7. PROCEDURE
7.1. Obtain the asphalt binder sample according to R 66. Heat the sample in its container with a loosely fitted cover in an oven not to exceed 163°C (325°F) for the minimum time necessary to ensure that the sample is completely fluid. Manually stir the sample but avoid incorporating air bubbles.
7.2. Fill the cup with material to be tested to the filling mark 9 – 10 mm (0.35 – 0.39 in.) below the rim of the cup. If the filling level gauge is used, fill the cup until the level of material just touches the pointers of the leveling device. Note 2—The test sample should be at least 50°C (90°F) below the anticipated flash point. Note 4—The sample cup may be filled away from the apparatus provided the thermometer is preset with the cup in place and the sample level is correct at the beginning of the test. A shim 6.4-mm (0.25-in.) thick is useful in obtaining the correction distance from the bottom of the bulb to the bottom of the cup.
7.3. Manual Flash Point Testing
7.3.1. Light the test flame, and adjust it to a diameter of 3.8 to 5.4 mm (0.15 to 0.21 in.).
1.2.1.7.3.2. For testing of a sample for which the expected flash point temperature is known, Aapply heat initially at such a rate that the temperature indicated by the temperature-measuring device increases 10 to 20°C (18 to 36°F)/min. When the test specimen temperature is approximately 506°C (1090°F) below the expected flash point, decrease the heat so that the rate of temperature rise during the last 28°C (50°F) before the flash point is 4 to 710°C (7 to 1318°F)/min.
7.3.3. At approximately 28°C (50°F) below the anticipated flash point and at successive 2°C (5°F) intervals, pass the ignition taper across the sample in a continuous motion so that the time consumed for each pass is 1 s. The center of the test flame must move in a horizontal plane not more than 2.5 mm (0.10 in.) above the plane of the upper edge of the cup and pass in one direction only. At the time of the next test flame application, pass the test flame in the opposite direction of the preceding application.
Note 5: If a surface film forms on the sample, it is recommended that the film be moved to the side using a paperclip or spatula prior to application of the test flame.
7.3.4. From 28°C (50°F) below the anticipated flash point to the end of the test, take care to avoid disturbing the vapors in the test cup.
Tech Section 2b Agenda Page 19 of 49

7.3.5. If a foam persists during that last 28°C (50°F) temperature rise below the anticipated flash point, end the test and disregard the results.
7.3.6. For testing of a sample for which the expected flash point temperature is not known, heat the sample to the temperature used for pouring in Section 7.1. Continue heating the test specimen at 4 to 710°C (7 to 1318°F)/min and testing the material every 2°C (5°F) as described in Section 11.1.57.3.2 until the flash point is obtained.
7.3.7. Record, as the observed flash point, the temperature read on the thermometer at the time the test flame application causes a distinct flash in the interior of the test cup.
Note 5—The application of the test flame may cause a halo or enlargement of the test flame. This is not considered the flash point. A large flame that propagates on the surface denotes that the flash point has been reached.
7.4. Automated Flash Point Testing
7.4.1. If necessary, light the test flame, and adjust it to a diameter of 3.8 to 5.4 mm (0.15 to 0.21 in.).
Note 6: Some automated apparatus can light and adjust the test flame automatically, and some automated apparatusi pass the test flame in one single direction.
7.4.2. Start the automated apparatus according to the manufacturer’s instructions. The automated apparatus shall conduct the procedure as required in Section 7.3.
7.4.3. Record, as the flash point, the temperature read on the thermometer at the time the test flame application causes a distinct flash in the interior of the test cup.
8. CALCULATIONS
8.1. Observe and record the ambient barometric pressure in the laboratory at the time of the test. If the barometric pressure varies form 101.3 kPa (760 mm Hg), calculate the corrected flash point as follows:
Corrected flash point (°C) = C + 0.25 (101.3 – A) (1) Corrected flash point (°F) = F + 0.06 (760 – B) (2) Corrected flash point (°C) = C + 0.033 (760 – B) (3)
where: C = observed flash point, °C, F = observed flash point, °F, A = ambient barometric pressure, mm HG, and B = ambient barometric pressure, kPa.
9. REPORT
9.1. Report the corrected flash point, in degrees Celsius or Fahrenheit, as the “Cleveland Open-Cup Flash Point”. Report flash point to the nearest whole number.
Tech Section 2b Agenda Page 20 of 49

2.10. PRECISION AND BIAS
2.1.10.1. 14.1 Precision—Criteria for judging the acceptability of test results for the flash point of asphalt binders obtained by this method are given in Table 1. Criteria for judging the acceptability of fire point test results can be found in ASTM D92.
2.1.1.10.1.1. 14.1.1 Single-Operator Precision (Repeatability)—The figures in Column 2 of Table 1 are the standard deviations that have been found to be appropriate for the conditions of test described in Column 1. Two results obtained in the same laboratory, by the same operator using the same equipment, in the shortest practical period of time, should not be considered suspect unless the difference in the two results exceeds the values given in Table 1, Column 3.
2.1.2.10.1.2. 14.1.2 Multilaboratory Precision (Reproducibility)—The figures in Column 2 of Table 1 are the standard deviations that have been found to be appropriate for the conditions of test described in Column 1. Two results submitted by two different operators testing the same material in different laboratories shall not be considered suspect unless the difference in the two results exceeds the values given in Table 1, Column 3.
Table 1—Precision Estimates Acceptable Standard Deviation
Range of Two Results
Condition (1s)a (d2s)a
Single-Operator Precision:
Flash Point (°C) 3 8
Multilaboratory Precision:
Flash Point (°C) 10 28 a These values represent the 1s and d2s limits described in ASTM Practice C670.
Note: The precision estimates for Flash Point given in Table 1 are based on the analysis of test results from eight pairs of AMRL proficiency samples. The data analyzed consisted of results from 98 to 148 laboratories for each of the eight pairs of samples. The analysis included four binder grades: PG 52-34, PG 64-16, PG 64-22, and PG 70-22. Average flash points ranged from 268.5 to 353.5°C. The details of the analysis are in the final report for NCHRP Project No. 9-26, Phase 3.
2.2.10.2. 14.2 Bias—The procedure of this test method has no bias because flash point and fire point can be defined only in terms of this test method.
11. KEYWORDS
11.1. Asphalt binder; Cleveland Open Cup; flash point
Tech Section 2b Agenda Page 21 of 49
NCHRP 20-7 Proposed Research Needs Statement
SOM Technical Section 2b - Asphalts
Lyndi Blackburn, Chair
April 28, 2016
TITLE Effect of Elevation on Rolling Thin Film Oven Aging of Asphalt Binders
BACKGROUND / NEEDS STATEMENT Laboratories at elevations greater than 4000 feet consistently demonstrate lower aging than labs located
below 4000 feet. This results in higher penetration values, lower viscosities, lower residue DSR values,
lower creep recovery values, and higher Jnr values (mass change does not appear to be affected). It results
in low AMRL proficiency sample scores, poor correlation in cooperative testing such as with the WCTG,
and problems correlating with other state labs, asphalt suppliers and private testers. The existing theory is
that the lower oxygen content available at higher elevations results in lower oxidative aging of the
asphalt. This effect is evident by evaluation of existing data such as AMRL proficiency samples and
WCTG cooperative samples. A report by the Modified Asphalt Research Center at the University of
Wisconsin-Madison reviewed existing WCTG data. Their conclusions stated that elevation was a factor
affecting reproducibility of PG testing and that the current RTFO procedure needed to be refined to take
into account elevation of the laboratory.
A Technical Section 2b AASHTO T 240 Task Force examined this issue back in 2010 and recommended
a change in the test procedure to address this issue. This change would have allowing longer aging times
for high elevation labs. The task force proposal was accepted by technical section ballot. However,
Technical Section 2b endorsed additional research to further study the aging issue. To date, funding for
this research has yet to be approved.
RESEARCH OBJECTIVE Perform research to provide a standardized method for adjusting RTFO times based on elevation. This
would eliminate the inconsistencies obtained in test results obtained from labs with different elevations.
This concept is in use already in other tests – AASHTO T48 Flash and Fire Points by Cleveland Open
Cup, T78 Distillation of Cutback Asphalt Products, and R28 Accelerated Aging of Asphalt Binder Using
a Pressurized Aging Vessel - where corrections are made due to elevation and barometric pressure
differences.
WORK TASKS Collect existing data from AMRL proficiency samples and WCTG samples to corroborate the 4000 foot
elevation threshold.
Develop a work plan to determine RTFO aging times needed at high elevations to produce test results
comparable to lower elevations. Obtain various binders of various PG grades and suppliers, unmodified
and modified. Identify suitable AMRL certified labs which cover different altitudes to conduct the
testing. Labs at low elevations will provide baseline results, while labs at higher elevations will test using
multiple RTFO aging times to provide comparison data. This could possibly be done through the existing
Western Cooperative Test Group using their monthly comparative samples distributed for testing.
Attachment #4
Tech Section 2b Agenda Page 22 of 49

Analyze the test data to produce a standardized method for adjusting RTFO aging times based on
elevation.
Write a proposed revision to the existing test procedure, AASHTO T 240, to incorporate this new method.
URGENCY This problem has been apparent for years, before the introduction of PG asphalts. The difference was that
with viscosity-graded asphalt cements there was only a maximum on the residue viscosity. Therefore
insufficient aging only made it easier to pass the specification. However, this has changed with the
advent of PG asphalts. Now incomplete aging can result in failing the minimum residue DSR and creep
recovery specification as well as the maximum Jnr. Thus, this issue has taken on a new significance,
beyond the problem of low ARML scores and correlation issues. Incomplete aging in the RTFO due to
higher elevations can result in incorrectly failing test results, monetary damages, removal of materials,
and the possibility of lawsuits. Even though only high elevation states and labs are affected, the results
can be significant. It is an issue that has been ignored and needs to be addressed.
FUNDING REQUESTED AND TIME REQUIRED It is estimated that this research will take 12 months to complete and will require $99,000.
CONTACT PERSON Darin Tedford, Chief Materials Engineer, Nevada Department of Transportation
1263 S. Stewart St. Carson City, NV 89712
(775)888-7520
(775)888-7501
Tech Section 2b Agenda Page 23 of 49
RTFO Aging Variability with Elevation WCTG
1
Effect of Laboratory Elevation on Binder Aging using
the Rolling Thin Film Oven (RTFO)
Raul Velasquez
Dan Swiertz
Hussain Bahia
Modified Asphalt Research Center (MARC)
University of Wisconsin-Madison
January 2013
Tech Section 2b Agenda Page 24 of 49

RTFO Aging Variability with Elevation WCTG
2
Abstract
The effect of laboratory elevation on the use of the Rolling Thin Film Oven Test (RTFO) to
simulate short term aging of asphalt binders is discussed in detail in this report. Rheological
measurements (i.e., │G*│ and ) of 14 binders before and after RTFO aging collected in
laboratories located at different elevations (i.e., between 25-30 labs) were used to determine the
significance of lab altitude on RTFO aging of commonly used binders. The comprehensive
database of rheological properties of binders was developed and currently maintained by the
collaborative effort between the Western Cooperative Test Group (WCTG), the Rocky Mountain
Asphalt User-Produce Group (RMAUPG), and the Modified Asphalt Research Center (MARC)
at the University of Wisconsin-Madison.
Visual and statistical analysis of more than 340 measuring points indicate that elevation of the
laboratory has a statistically significant impact on RTFO aging of binders and thus can be one of
the factors affecting reproducibility of Performance Grading (PG) testing between high (e.g.,
6000 ft) and lower (e.g., 0 ft) elevation labs. It was observed that this elevation sensitivity of
RTFO aging is binder dependent. The aging ratio, [G*/sin @ RTFO] / [G*/sin @ Original],
of some binders are independent of the elevation and barometric pressure of the laboratory.
Averages for the rate of change of G*/sin after RTFO and the aging ratio as function of
elevation presented in this study can be used to assess the importance of elevation when
performing PG grading of binders.
Introduction
Unique to asphalt materials is that its mechanical properties depend on both time and ambient
conditions (Figure 1). Asphalt pavements demonstrate significant change in physical and
mechanical properties over time, and between regions as result of material aging characteristics.
In addition to time and location, the aging characteristics of an asphalt binder are source specific
[1]. The aging process of asphalt binders imparts certain performance based implications on the
pavement, often times in a negative fashion [2].
Figure 1. Schematic of Change of Asphalt Mechanical Properties as Function of Time.
Tech Section 2b Agenda Page 25 of 49

RTFO Aging Variability with Elevation WCTG
3
Aging can be identified as the change in physical and mechanical properties with time due to
changes in chemical composition. In general, four mechanisms exist by which asphalt binder
ages in service [1, 2]:
Volatilization,
Oxidation,
Steric hardening,
Physical hardening
It is important to note that both steric hardening and physical hardening are the result of physical
change in chemical structure, not change in composition; they can be thought of as molecular
rearrangement as opposed to molecular alteration [3]. Steric and physical hardening are therefore
reversible with the addition of heat or mechanical work. Only oxidation and volatilization results
in compositional changes and thus are irreversible. Oxidative aging affect both the molecular
structure and the molecular interaction of the binder which are crude oil source dependent [1].
Any change of asphalt chemistry and composition due to aging results in a significant change in
its mechanical performance. Asphalt binder aging varies widely and it is not only a function of
binder source but also temperature, depth in the pavement, mixture type, permeability, and
aggregate type, among other factors [1].
In general, aging results in harder, more brittle asphalts binders. Increased elasticity in asphalt
binder is also observed after oxidation (Figure 2) [2]. Field and lab aging results in distortions of
the rheological master curve as shown in Figure 2. This figure shows how │G*│ and changes
for asphalt binders aged for varying temperature and lengths of time [1]. Figure 2 indicates that
aging causes an increase in the complex modulus, and a decrease in the phase angle. The
complex modulus is proportional to the asphalt binder stiffness; as a result of aging thus the
material becomes less deformable. This effect is desirable for rutting but detrimental for fatigue
and thermal cracking performance.
Figure 2. Effects of Aging on Rheological Behavior of Asphalt Binders [2]
Tech Section 2b Agenda Page 26 of 49

RTFO Aging Variability with Elevation WCTG
4
Aging of asphalt pavements in service can be divided into two broad categories (Figure 1):
1. Short term (Plant)
2. Long term (Field)
Short term aging is defined as the effect of the high temperatures used in manufacturing, hot
mixing, placement, and compaction on the asphalt binder. In general, volatilization is considered
the primary agent of short term aging, although significant and rapid oxidation occurs as well
[1]. Characteristic of short term aging is a high rate of increase in viscosity and/or stiffness with
relatively little time (see Figure 1). Long term aging is defined as the service life aging
associated primarily with oxidation reactions [1]. Molecules in the pavement react with
environmental oxygen over time, stiffening the pavement over its service life. Characteristic of
long term aging is a slowly diminishing rate of increase in viscosity and stiffness over time
(Figure 1).
To take into account aging in the selection of paving materials, accelerated aging procedures
have been developed to mimic field conditions. Two methods are commonly available to
practitioners to simulate aging of asphalt binders: oven and pressure aging. Oven tests rely on
high temperatures and thin films for aging, resulting in high volatile loss and high oxidation
rates. Pressure aging makes use of oxidation through forced physical diffusion, as oxygen is
forced into an asphalt film by increasing ambient pressure. In general, oven tests such as the
Rolling Thin Film Oven Test (Figure 3) are used to simulate short term aging whereas pressure
aging are used for estimating long term aging [1].
Figure 3. Rolling Thin Film Oven Test (RTFOT) to Simulate Short Term Aging.
The aim of short term laboratory aging is to simulate the effect that the production and mixing
process has on the rheological properties of asphalt binder. During production and mixing,
asphalt is exposed to high temperatures, and experiences rapid oxidation and volatilization.
Asphalt binders that oxidize too rapidly may become too stiff in a relatively short service time.
Tech Section 2b Agenda Page 27 of 49

RTFO Aging Variability with Elevation WCTG
5
Short term aging relies on high temperature and air flow over thin films to simulate this stage of
aging [1, 2].
The Rolling Thin Film Oven Test (RTFOT) was developed in the early 1960’s to simulate the
aging that occurs during mixing. The RTFOT uses thin films and cylindrical bottles that are
continuously rotating (Figure 3) to uniformly age the binder. RTFO testing is conducted at 163°C for 85 minutes. The RTFO is currently an ASTM as well as an AASHTO standard and it
is required for Superpave PG grading of asphalt binders.
As part of regular round robin testing for the Western Cooperative Test Group (WCTG),
laboratories at high elevations (i.e. greater than 4000 ft) have consistently reported lower values
of │G*│/sin for RTFO aged samples. Variation of the rheological properties of binders before
RTFO aging between participant laboratories has been minimal and thus raises the question of
the effect of lab elevation and barometric pressure on the RTFO aging procedure. There are a
significant number of labs in the Rocky Mountain Asphalt User-Produce Group (RMAUPG) and
WCTG at high altitudes (e.g., 17) and thus the need to investigate this issue. Preliminary analysis
of data collected shows that the cause of variation among laboratories is attributable to
insufficient RTFO aging. Based on statistical analysis of a comprehensive data set, this study
discusses possible methods to address this lab altitude issue.
WCTG Round Robin Database
Collaborative efforts between the Western Cooperative Test Group (WCTG), the Rocky
Mountain Asphalt User-Produce Group (RMAUPG), and UWM have led to the development of
a comprehensive database of asphalt binder and mixture testing performance that can be used for
validation and evaluation of current (PG) and new technologies (PG+). This database is
populated with WCTG’s round robin binder testing program and with new testing methods
developed as part of the Asphalt Research Consortium (ARC).
The database includes information on binder performance using current PG specification, PG-
Plus and new technologies (e.g., Linear Amplitude Sweep, Single Edge-Notch Bending, etc).
The participation in monthly testing for the database is on a volunteer basis and thus the number
of participating labs varies from month to month as shown in Figure 4. Approximately 40
laboratories around the United States are helping run the tests and collecting relevant data. The
binder grades available in the database represent commonly used grades used in field projects.
Tech Section 2b Agenda Page 28 of 49

RTFO Aging Variability with Elevation WCTG
6
Figure 4. Reporting Laboratories in WCTG-RMAUPG-UWM Database.
The PG and PG+ test procedures included in the database are:
1. Rotational viscosity, 1 and 20 rpm (unaged)
2. │G*│ and phase angle () (unaged, RTFO, PAV)
3. │G*│ / sin (unaged and RTFO)
4. │G*│ sin at high PG temp. (PAV)
5. Toughness and tenacity (unaged)
6. Ductility (unaged, RTFO)
7. Loss on heating (RTFO)
8. Elongation recovery (RTFO)
9. BBR stiffness and m-value at 1 and 24 hrs. conditioning time (PAV)
10. Non-recoverable creep compliance (Jnr) at three stress levels (0.1, 3.2, 10 kPa) and two
temperatures (RTFO)
11. Percent difference in Jnr at three stress levels (0.1, 3.2, 10 kPa) and two temperatures
(RTFO)
12. Percent recovery in MSCR (%R)
13. Direct tension, failure stress and failure strain (PAV)
14. Linear Amplitude Sweep (LAS)
15. Single Edge Notch Beam (SENB)
This database has been subjected to significant changes over the past two years after feedback
from WCTG users. A screen shot showing some of the fields in the database is presented in
Figure 5. In the database, basic statistics are calculated for each test method as indicated in
Figure 6. The statistical summary can be used to evaluate reproducibility and issues in current
and newly developed testing methods. Furthermore, outliers in the database are considered in the
statistical analysis as shown in Figure 7. The database also shows available precision statements
to determine potential reproducibility issues with an existing testing method.
0
10
20
30
40
50
60
50
65
07
50
85
09
51
05
11
51
25
13
51
45
15
51
65
17
51
85
19
52
05
21
52
25
23
52
45
25
52
65
27
52
85
29
53
05
31
53
2Nu
mb
er o
f La
bs
Rep
ort
ing
Binder Sample Number
Tech Section 2b Agenda Page 29 of 49

RTFO Aging Variability with Elevation WCTG
7
Figure 5. WCTG Database.
Figure 6. Example of Database Basic Statistical Analysis.
Tech Section 2b Agenda Page 30 of 49

RTFO Aging Variability with Elevation WCTG
8
Figure 7. Considering Outliers and Method Precision in Database.
Information in the database can be used to determine factors affecting variability of standard PG
and newly developed PG+ tests and to propose possible solutions to address this variability. For
example, Figure 8 shows the fluctuation of the variation of Percent Recovery (i.e., %R) from the
Multiple Stress Creep and Recovery Test (MSCR) with time. Earlier tested samples (e.g., 511A-
523A) showed significantly higher inter-laboratory variation in comparison to recently tested
binders (e.g., 528A-532A). This reduction in variation is the result of continuous feedback
between WCTG laboratories and the administrators of the database. Significant improvements on
the MSCR test procedure and calculation method have been implemented after using information
in this database.
Figure 8. Coefficient of Variation for %R in MSCR Test at 3.2 kPa and High PG
Temperature.
0%
10%
20%
30%
40%
50%
60%
70%
506
A
507
A
508
A
509
A
511
A
512
A
513
A
514
A
515
A
516
A
517
A
518
A
519
A
520
A
521
A
522
A
523
A
524
A
525
A
526
A
527
A
528
A
529
A
530
A
531
A
532
A
CO
V
Sample ID
Tech Section 2b Agenda Page 31 of 49

RTFO Aging Variability with Elevation WCTG
9
Effect of Lab Elevation on RTFO Aging
Dynamic Shear Rheometer (DSR) measurements before and after RTFO aging of 14 different
asphalt binders obtained in different laboratories (i.e., 25-30) were used to visually and
statistically assess the impact of lab elevation of RTFO aging. The following parameters are used
as dependent variables for the analysis:
│G*│/sin after RTFO
Aging Ratio = │G*│/sin @ RTFO / │G*│/sin @ Original
Users of the database report elevation, barometric pressure, air flow rate, aging temperature and
aging time for the RTFO test. However, only elevation and barometric pressure values change
among the participant laboratories. Furthermore, there is a power law relation between elevation
and barometric pressure as indicated in Figure 9 and thus only elevation and binder type are used
in subsequent analysis of the RTFO aging data.
Figure 9. Relation between Atmospheric Pressure and Elevation
(http://www.engineeringtoolbox.com/air-altitude-pressure-d_462.html)
Figure 10 shows the relation between aging ratio and lab elevation for all 14 binders tested. A
total of 344 points indicate a poor correlation between aging index and elevation. Generally, it is
observed as expected that as elevation increases the aging ratio decreases. Oxidative aging is a
diffusion-reaction process which is highly influenced by the environmental conditions including
temperature (i.e., constant between labs) and pressure (different between labs). It is expected that
at higher pressure (i.e., low elevation), rate of aging increases in comparison to lower pressure
conditions (i.e., high elevation).
Tech Section 2b Agenda Page 32 of 49

RTFO Aging Variability with Elevation WCTG
10
Figure 10. Aging ratio as function of elevation for all 14 binders (344 measurements).
Figure 11 shows the relation between aging ratio and the PG grade of the binders tested. Overall
as PG high limit increases the aging ratio decreases. An interesting observation in Figure 11 is
that as the distance between the high and low PG limit increases, the spreading of the aging ratio
values increases and thus the aging susceptibility of these binders with the same PG grade can be
very different.
Figure 11. Aging Ratio as Function of (a) PG High Temperature Limit and (b) PG High
minus PG Low Temperature Limit.
The basic statistics (e.g., average, standard deviation, median, etc) for the aging ratio and
elevation are presented in Table 1. As it can be seen, a wide variety of aging susceptible binders
are used in this study (i.e., aging index varies from 1.22 to 3.41) as well as laboratories located in
very different elevations (i.e., elevation varies between 0 to 6775 ft).
0.0
0.5
1.0
1.5
2.0
2.5
3.0
3.5
4.0
0 2000 4000 6000 8000
RTF
O/
Ori
gin
al -
Agi
ng
rati
o
Elevation (ft)
0.0
1.0
2.0
3.0
4.0
60 65 70 75 80
RTF
O/
Ori
gin
al -
Agi
ng
Rat
io
Superpave PG High Limit
0.0
1.0
2.0
3.0
4.0
90 95 100 105
RTF
O/
Ori
gin
al -
Agi
ng
Rat
io
Superpave PG High - PG Low
Tech Section 2b Agenda Page 33 of 49

RTFO Aging Variability with Elevation WCTG
11
Table 1. Basic Statistics for Aging Ratio and Elevation.
Variable N Average Std Dev Minimum Median Maximum
Aging Ratio 344 2.00 0.33 1.22 2.01 3.41
Elevation (ft) 344 3023.1 2090.4 0 3657 6755
PG HL 344 70.86 4.87 64 70 76
PG HL-LL 344 98.21 5.01 92 98 104
PG LL 344 -27.36 3.87 -34 -28 -22
The correlation matrix for the variables presented in Table 1 was calculated and only statistically
significant correlations are presented in Table 2 (i.e., R > 2/ ). Table 2 shows that elevation
and binder type have a significant effect on the aging ratio of the studied binders.
Table 2. Correlation between Aging Ratio and Elevation and PG High Temperature Limit.
R Aging Ratio
Elevation (ft) -0.1829
PG HL -0.1303
Linear regression was performed using aging index as dependent variable and elevation and
binder type as independent variables. Binder type was considered as a factor/dummy variable
(i.e., not numerical). The R2 of the linear regression model is 0.76 and the summary of the
significance of the model is presented in Table 3. Table 4 shows the ANOVA for the
independent variables used in the model. As it can be seen both elevation and binder type are
statistically significant when predicting aging ratio.
Table 3. Analysis of Variance (ANOVA) of Linear Regression Model.
Source df SS MS F p-value
Regression 14 27.63 1.97 74.53 0.00
Residual 329 8.71 0.02
Table 4. Change in Residual Sum Squares (RSS) for fitting each term last.
Predictor F p-value
Elevation 59.16 0.00
Binder Type 76.73 0.00
Visual inspection of the relation between aging parameters and elevation confirm the results
obtained from statistical analysis. Figure 12 shows the relation between │G*│/sin after RTFO
and (a) elevation and (b) barometric pressure for selected binders. It can be seen that aging
susceptibility is binder specific and that the effect of elevation and barometric pressure also
depends on the binder type.
Tech Section 2b Agenda Page 34 of 49

RTFO Aging Variability with Elevation WCTG
12
Figure 12. │G*│/sin as Function of (a) Elevation and (b) Barometric Pressure for
Selected Binders.
Figure 13 shows how the aging ratio is affected by lab elevation and barometric pressure.
Similarly to the observations in Figure 12, the significance of lab altitude depends on the binder
type. For example, Figure 13 indicates that the aging index for binder 529A is not affected by
elevation. It is important to note that the average aging index for binder 529A is on the lower
side of the binders tested and thus it is less susceptible to aging.
R² = 0.2664
R² = 0.493
R² = 0.2961
0.0
0.5
1.0
1.5
2.0
2.5
3.0
3.5
4.0
4.5
0 2000 4000 6000 8000
G*/
Sin
(
kPa)
- R
TFO
Lab Elevation (ft)
529A 523A 526A
R² = 0.1635
R² = 0.1186
R² = 0.073
0.0
0.5
1.0
1.5
2.0
2.5
3.0
3.5
4.0
4.5
20 25 30 35
G*
/Sin
(
kPa)
- R
TFO
Barometric Pressure (in Hg)
529A 523A 526A
Tech Section 2b Agenda Page 35 of 49
RTFO Aging Variability with Elevation WCTG
13
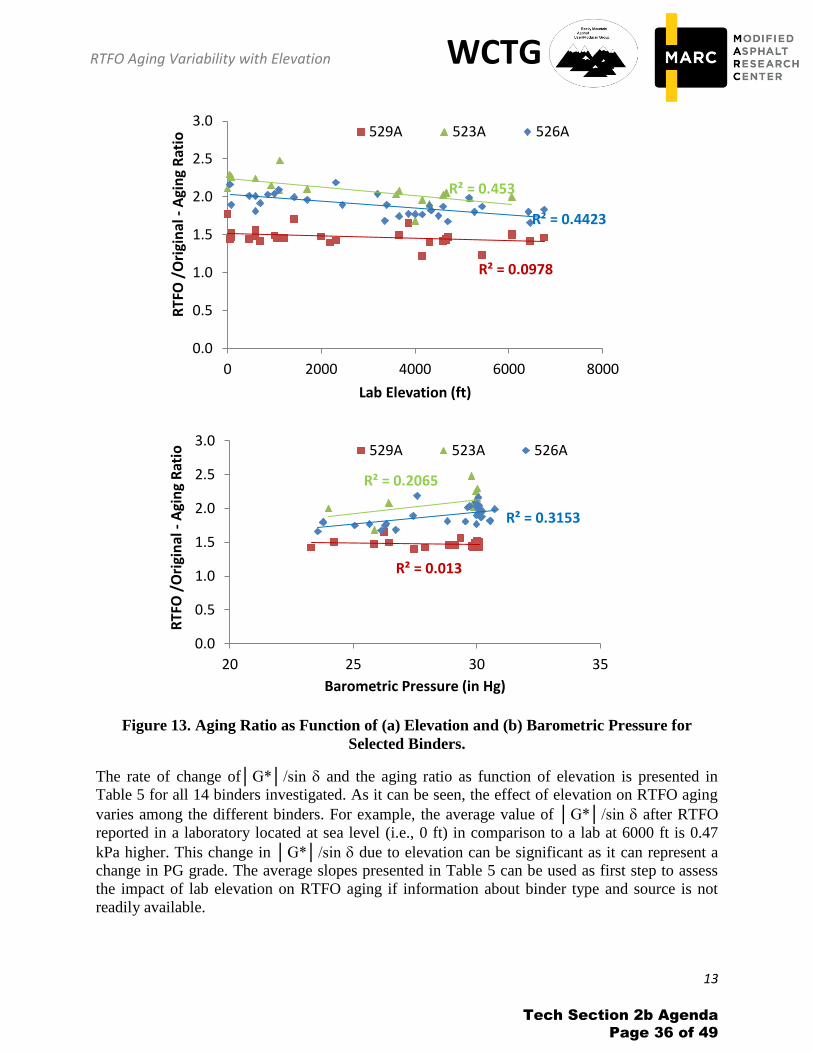
Figure 13. Aging Ratio as Function of (a) Elevation and (b) Barometric Pressure for
Selected Binders.
The rate of change of│G*│/sin and the aging ratio as function of elevation is presented in
Table 5 for all 14 binders investigated. As it can be seen, the effect of elevation on RTFO aging
varies among the different binders. For example, the average value of │G*│/sin after RTFO
reported in a laboratory located at sea level (i.e., 0 ft) in comparison to a lab at 6000 ft is 0.47
kPa higher. This change in │G*│/sin due to elevation can be significant as it can represent a
change in PG grade. The average slopes presented in Table 5 can be used as first step to assess
the impact of lab elevation on RTFO aging if information about binder type and source is not
readily available.
R² = 0.0978
R² = 0.453
R² = 0.4423
0.0
0.5
1.0
1.5
2.0
2.5
3.0
0 2000 4000 6000 8000
RTF
O /
Ori
gin
al -
Agi
ng
Rat
io
Lab Elevation (ft)
529A 523A 526A
R² = 0.013
R² = 0.2065
R² = 0.3153
0.0
0.5
1.0
1.5
2.0
2.5
3.0
20 25 30 35
RTF
O /
Ori
gin
al -
Agi
ng
Rat
io
Barometric Pressure (in Hg)
529A 523A 526A
Tech Section 2b Agenda Page 36 of 49

RTFO Aging Variability with Elevation WCTG
14
Table 5. Summary of Correlations and Rate of Change of │G*│/sin and Aging Ratio as
Function of Elevation.
Binder
G*/sin - RTFO RTFO / Original (Aging Ratio)
Slope (kPa/ft) R2
Change/6000ft
(kPa) Slope (1/ft) R
2 Change/6000ft (-)
519A -3.15E-05 0.1 -0.19 -3.13E-05 0.15 -0.19
520A -2.00E-05 0.02 -0.12 -1.93E-05 0.02 -0.12
521A -1.64E-05 0.02 -0.1 -1.79E-05 0.05 -0.11
522A -6.19E-05 0.28 -0.37 -3.38E-05 0.22 -0.2
523A -7.83E-05 0.49 -0.47 -5.61E-05 0.45 -0.34
524A -1.08E-04 0.3 -0.65 -4.81E-05 0.3 -0.29
525A -4.58E-05 0.09 -0.27 -2.23E-05 0.04 -0.13
526A -6.46E-05 0.3 -0.39 -4.44E-05 0.44 -0.27
527A -4.65E-05 0.18 -0.28 -3.68E-05 0.24 -0.22
528A -5.68E-05 0.26 -0.34 -4.00E-05 0.3 -0.24
529A -6.19E-05 0.27 -0.37 -1.45E-05 0.1 -0.09
530A -4.67E-05 0.13 -0.28 -3.37E-05 0.25 -0.2
531A -2.75E-05 0.16 -0.17 -1.10E-05 0.2 -0.07
532A -7.43E-05 0.36 -0.45 -5.60E-05 0.3 -0.34
Average -5.29E-05 0.21 -0.32 -3.32E-05 0.22 -0.2
Conclusions and Recommendations
The effect of laboratory elevation on the use of the Rolling Thin Film Oven Test (RTFO) to
simulate short term aging of asphalt binders was investigated in this study using visual and
statistical analysis. A total of 344 rheological measurements of 14 binders obtained from
laboratories located at different elevations (i.e., between 25-30 labs) were used to determine the
significance of lab altitude on RTFO aging. Statistical analysis using linear regression indicates
that elevation and binder type have a significant impact on the RTFO aging process. This result
is consistent to what it is found in the literature as rate of aging is affected by both the diffusion-
reaction process and the chemical reaction products. Based on the analysis of the results reported
in the WCTG database, the following conclusions can be drawn:
Elevation can be one of the factors affecting reproducibility of Performance Grading
(PG) testing between high (e.g., 6000 ft) and lower (e.g., 0 ft) elevation labs.
The RTFO sensitivity to elevation is binder dependent. The aging ratio, [G*/sin @
RTFO] / [G*/sin @ Original], of some binders are independent of the elevation and
barometric pressure of the laboratory.
Tech Section 2b Agenda Page 37 of 49

RTFO Aging Variability with Elevation WCTG
15
Averages for the rate of change in │G*│/sin after RTFO and the aging ratio as function
of elevation reported in Table 5 can be used to assess the importance of elevation when
performing PG grading of binders and/or to compare rheological measurements between
labs located at different elevations.
Analysis presented in this study can be used to refine current RTFO procedure (e.g.,
adjusting aging time) to take into account elevation of the laboratory and to reduce
current PG testing variability.
References
1. Swiertz, D., Asphalt Aging Characteristics- Rheological Implications and Laboratory
Techniques, Internal Report, Modified Asphalt Research Center (MARC)-University of
Wisconsin-Madison, 2010.
2. Bahia, H. U., & Anderson, D. A., The Pressure Aging Vessel (PAV): A Test to Simulate
Rheological Changes Due to Field Aging. Physical Properties of Asphalt Cement
Binders: ASTM STP 1241, pp. 67‐89, 1995.
3. Jones, D. R., & Kennedy, T. W., The Asphalt Model: Results of the SHRP Research
Program. Austin: SHRP A‐001 Draft Report, 1992.
Tech Section 2b Agenda Page 38 of 49

From: Brian Johnson <[email protected]>Sent: Monday, March 7, 2016 12:46 PMTo: Blackburn, LyndiSubject: FW: Suggestion from Delaware DOT on the TFO pansAttachments: T179 & R28 Pans FB-2016.pdf
Lyndi,
We were given some information from Karl Zipf of Delaware DOT about how to check the TFO/PAV pans for excessive warping. Maria passed this along to the Binder ETG for potential inclusion in one of the next ballots for R28.
Karl also sent me a revision idea for T201, T202, and R18 related to checking timers. Hopefully we can go over them at the next 2b meeting in Greenville.
Regards,Brian J. JohnsonAASHTO Accreditation Program Supervisor4441 Buckeystown PikeSuite AFrederick, MD 21704
Email: [email protected]: 240-436-4820Mobile: 240-575-8651www.amrl.net
Attachment #5
Tech Section 2b Agenda Page 39 of 49

Tech Section 2b Agenda Page 40 of 49

Tech Section 2b Agenda Page 41 of 49

Tech Section 2b Agenda Page 42 of 49

Tech Section 2b Agenda Page 43 of 49

From: Brian Johnson <[email protected]>Sent: Monday, March 7, 2016 2:23 PMTo: Blackburn, LyndiSubject: FW: T201 -202 TimersAttachments: T201 & T202 Timers.pdf
Here is the other one on timers. He is suggesting 6 months for timers that are not quartz and 12 months for quartz timers. I will add this to the R 18 tables if 2b likes this idea. The TS might only allow quartz after seeing his example at the back.
Brian
From: Zipf, Karl (DelDOT) [mailto:[email protected]] Sent: Tuesday, March 1, 2016 3:50 PMTo: Brian Johnson Subject: T201 -202 Timers
Brian,
I will make it easier for you. I had started to put together a letter outlining the situation and a solution to you. I got side tracked with the accreditation issues. I have now dug it out, took a pair of pictures and finished assembly. I think it is coherent, or at least more so than a string of e-mails.
I would state in R18 that timers are ‘quartz timers’ to remove all doubt.
Sincerely,
Karl
Attachment #6
Tech Section 2b Agenda Page 44 of 49

Tech Section 2b Agenda Page 45 of 49

Tech Section 2b Agenda Page 46 of 49

Tech Section 2b Agenda Page 47 of 49

1
Blackburn, Lyndi
From: Maria Knake <[email protected]>Sent: Thursday, March 31, 2016 1:18 PMTo: Sheehy, Eileen; Blackburn, LyndiCc: Sokol, Kathy L; John Malusky; Ben Sade; Brian JohnsonSubject: T240 and T315 Questions
Hi Eileen and Lyndi,
Kathy Sokol asked a couple of questions of AMRL that are stumping us, and probably need to be addressed by TS 2b.
When using Table 2 of T240 to determine precision estimates, it seems that the single operator precision isgreater than the multilaboratory precision if your mass loss is below 0.45%. ASTM actually has differentequations for precision based on whether or not the mass change is above or below 0.1%. Perhaps AASHTOshould consider a similar approach? We could look as some PSP data and assist with this if need be. At the veryleast there should be a statement that the multi lab precision could be larger than single operator if a mass lossof 0.45% is obtained. Here is a little snippet from the Excel Spreadsheet we used to look at this:
X Single Multi Single Greater Than
Multi?
0.01 0.006463 0.002928 True
0.02 0.006826 0.004293 True
0.03 0.007189 0.005658 True
0.04 0.007552 0.007023 True
0.041 0.007588 0.00716 True
0.044 0.007697 0.007569 True
0.045 0.007734 0.007706 True
0.046 0.00777 0.007842 False
0.048 0.007842 0.008115 False
0.05 0.007915 0.008388 False
0.06 0.008278 0.009753 False
0.07 0.008641 0.011118 False
0.08 0.009004 0.012483 False
0.09 0.009367 0.013848 False
0.1 0.00973 0.015213 False
0.11 0.010093 0.016578 False
Also, the AMRL data used to develop the precision statements in AASHTO is quite old. We have newer data wecould provide if you would be interested updated statements.
Moving on to T315: According to section 12 Interpretation of Results, 12.1 states: “It’s not necessary togenerate such sweeps during normal specification testing; however, such plots are useful for verifying the limitsof the linear region”.
X1.8.1 states: “If the measurement was performed in the nonlinear range of the material, the results obtainedunder the standard will be considered as invalid for grading according to M 320.
Kathy asks “we have not been performing strain sweeps based on the statement in 12.1, i.e. that it is notnecessary for spec testing. Should we be doing this regularly? Otherwise how does one know if their results arein the linear region? And, then how can we state that a product meets M320 spec requirements?” The
Attachment #7
Tech Section 2b Agenda Page 48 of 49

2
statement in X1.8.1 is non‐mandatory information (in the Appendix), but Kathy still makes a good point. I think this probably deserves some great discussion within TS 2b.
Thank you, ‐Maria Maria Knake Program Manager, Laboratory Assessment Program Phone: 240‐436‐4804 E‐mail: [email protected] AASHTO Materials Reference Laboratory (AMRL) 4441 Buckeystown Pike Suite A Frederick, MD 21704‐7507 www.amrl.net
Tech Section 2b Agenda Page 49 of 49