subject: submittal of 2015 annual environmental … · marc stevens; deq sherrie mathison, yamhill...
TRANSCRIPT

RIVERBEND LANDFILL COMPANY
13469 SW Highway 18 McMinnville, OR 97128 (503) 472-8788 (503) 434-9770 Fax
April 28, 2016
Mr. Bob Schwarz
Oregon Department of Environmental Quality
Eastern Region
400 E. Scenic Drive, Suite 307
The Dalles, Oregon 97058
SUBJECT: Submittal of 2015 Annual Environmental Monitoring Report Riverbed Landfill Solid Waste Disposal Site Permit (SWDP) No. 345 Yamhill County, Oregon Dear Mr. Schwarz: Please find enclosed two copies of the 2015 annual environmental monitoring report (AEMR) for the Riverbend Landfill (RL), prepared by SCS Engineers (SCS), of Portland, Oregon at the request of Riverbend Landfill Company (RLC). This AEMR presents and evaluates the environmental monitoring performed at RL in 2015, consistent with the following:
SWDP 345 issued to RLC from the Oregon Department of Environmental Quality (DEQ) on December 3, 1999 and addenda to the SWDP.
The DEQ-approved updated environmental monitoring plan (EMP) dated December 2014.
Additionally, appended to this AEMR includes a copy of the RL 2015 poplar tree farm monitoring report. Please contact me (602) 757-3352 if you have any questions related to the contents of the AEMR. Sincerely,
James L. Denson, Jr. PNW/BC Environmental Protection Manager Enclosure – RL’s 2015 AEMR (hardcopy and electronic) Cc (w/enclosure): Bill Mason, DEQ
Marc Stevens; DEQ Sherrie Mathison, Yamhill County
Tim Watson, WM

2015 Annual Environmental Monitoring Report
Rive rbend Landf i l l McMinnv i l l e , Oregon
Prepared for:
Riverbend Landfill Company
13469 SW Highway 18 McMinnville, Oregon 97128
(503) 472-8788
Prepared by:
S C S E N G I N E E R S 15940 SW 72nd Avenue
Portland, OR 97224 (503) 639-9201
April 28, 2016 File No. 04208022.16
Offices Nationwide
www.scsengineers.com


P r e p a r e d f o r R i v e r b e n d L a n d f i l l C o m p a n y
R i v e r b e n d L a n d f i l l i i 0 4 2 0 8 0 2 2 . 1 6 2 0 1 5 A n n u a l E n v i r o n m e n t a l M o n i t o r i n g R e p o r t
T a b l e o f C o n t e n t s Section Page List of Tables ............................................................................................................................................. iii List of Figures ............................................................................................................................................. iv List of Appendices ............................................................................................................................................ iv Acronyms and Abbreviations .......................................................................................................................... vi Executive Summary ......................................................................................................................................... viii
Results and Conclusions ....................................................................................................................... viii 1.0 Introduction .............................................................................................................................................. 1
1.1 Terms of Reference ........................................................................................................... 1 1.2 Site Description .................................................................................................................. 1 1.3 Significant 2015 Activities ............................................................................................... 2 1.4 Supplemental Information Provided in Report ............................................................ 3
2.0 Hydrogeologic Setting .......................................................................................................................... 4 2.1 Hydrogeology ................................................................................................................... 4
2.1.1 Upper (Shallow) Silt-Clay Water-Bearing Zone ........................................................ 4 2.1.2 Lower (Deep) Sand-Gravel Water-Bearing Zone ..................................................... 5
3.0 Environmental Monitoring Networks and Schedules ........................................................................ 6 3.1 Groundwater Monitoring Network and Schedule ...................................................... 6 3.2 Surface Water Monitoring Network and Schedule .................................................... 7 3.3 Leachate Management System Monitoring Network and Schedule ........................ 7 3.4 Landfill Gas Monitoring Network and Schedule ......................................................... 8
4.0 Field Procedures .................................................................................................................................... 9 4.1 Groundwater ..................................................................................................................... 9 4.2 Surface Water ............................................................................................................... 10 4.3 Leachate Management Systems .................................................................................. 10 4.4 Landfill Gas..................................................................................................................... 10 4.5 Field Quality Assurance/Quality Control Procedures ............................................. 10
5.0 Laboratory Methods............................................................................................................................ 11 5.1 Analytical Parameters for Environmental Samples .................................................. 11 5.2 Laboratory Quality Assurance/Quality Control Procedures and Results ............ 11
6.0 Monitoring Results and Data Evaluation .......................................................................................... 12 6.1 Groundwater Elevations and Gradients .................................................................... 12
6.1.1 Shallow (Silt-Clay) WBZ ............................................................................................... 12 6.1.2 Deep (Sand-Gravel) WBZ ........................................................................................... 12 6.1.3 Vertical Hydraulic Gradients ....................................................................................... 13
6.2 Groundwater Analytical Results .................................................................................. 13 6.2.1 Evaluation of Groundwater Analytical Results ......................................................... 13 6.2.2 Analytical Results for Compliance Well Groundwater Samples ........................... 14 6.2.3 Analytical Results for Detection Well Groundwater Samples ............................... 15
P r e p a r e d f o r R i v e r b e n d L a n d f i l l C o m p a n y
R i v e r b e n d L a n d f i l l i i i 0 4 2 0 8 0 2 2 . 1 6 2 0 1 5 A n n u a l E n v i r o n m e n t a l M o n i t o r i n g R e p o r t
T a b l e o f C o n t e n t s ( c o n t i n u e d ) Section Page
6.2.4 Geochemical Diagrams ................................................................................................. 17 6.3 Surface Water Analytical Results ............................................................................... 17 6.4 Landfill Gas Monitoring ................................................................................................ 18
7.0 Operational and Performance Monitoring Results of Leachate Management System ........... 19 7.1 Operation and Maintenance of Leachate Management Systems ........................ 19 7.2 LCRS and Landfill LDS Pumping System Performance Results ............................... 19
7.2.1 LCRS and LDS Pumping Volumes ................................................................................. 19 7.2.2 Leachate Management ................................................................................................. 20
7.3 LCRS Leachate and Landfill LDS Liquid Analytical Results ..................................... 20 7.4 Leachate Pond and LDS Liquid Analytical Results ................................................... 21
8.0 References ............................................................................................................................................. 23
L i s t o f T a b l e s
Table 3-1 Groundwater Monitoring Network Construction Information
Table 3-2 2015 Groundwater, Surface Water, and Leachate Management System Monitoring Schedule
Table 5-1 2015 Analytical Parameter Schedule for Groundwater Monitoring
Table 5-2 2015 Analytical Parameter Schedule for Surface Water Monitoring
Table 5-3 2015 Analytical Parameter Schedule for Leachate Management Systems Monitoring
Table 5-4 Cation-Anion Balances for 2015 Laboratory Analytical Data
Table 6-1 Comparison of the 2015 Groundwater Elevations and Vertical Gradients in Monitoring Well Pairs (Shallow and Deep Water-Bearing Zones)
Table 6-2 Comparison of Statistical and Prescriptive Concentration Limits with 2015 Semiannual Compliance Groundwater Analytical Results
Table 6-3 Summary of Statistical Trend Analysis Based on 2015 and Historical Groundwater Analytical Results
Table 6-4 VOCs Detected in Groundwater Samples Collected from MW-5A
Table 6-5 Field Parameters in Surface Water Samples
Table 6-6 Anions and Cations in Surface Water Samples
Table 6-7 Laboratory Indicator Parameters in Surface Water Samples
Table 6-8 Supplemental Parameters in Surface Water Samples

P r e p a r e d f o r R i v e r b e n d L a n d f i l l C o m p a n y
R i v e r b e n d L a n d f i l l i v 0 4 2 0 8 0 2 2 . 1 6 2 0 1 5 A n n u a l E n v i r o n m e n t a l M o n i t o r i n g R e p o r t
L i s t o f T a b l e s ( c o n t i n u e d )
Table 6-9 2015 and Historical Landfill Gas Monitoring Data
Table 7-1 Summary of the 2015 Monthly Liquid Pumping and Disposal Volumes of Leachate and LDS Liquids
Table 7-2 VOCs Detected in Landfill Module Leachate and LDS Liquid Samples
L i s t o f F i g u r e s
Figure 1-1 Site Location Map
Figure 1-2 Monitoring Locations and Site Map
Figure 6-1 Shallow Water-Bearing Zone Potentiometric Surface Contours (May 5, 2015)
Figure 6-2 Deep Water-Bearing Zone Potentiometric Surface Contours (May 5, 2015)
Figure 6-3 Shallow Water-Bearing Zone Potentiometric Surface Contours (November 10, 2015)
Figure 6-4 Deep Water-Bearing Zone Potentiometric Surface Contours (November 10, 2015)
Figure 6-5 VOCs Detected in Groundwater Samples Collected from MW-5A
Figure 6-6 Piper (Trilinear) Diagram of MW-5A Groundwater and Sump 1/5 P Leachate
Figure 6-7 Stiff Diagram of MW-5A Groundwater and Sump 1/5 P Leachate
Figure 7-1 Piper (Trilinear) Diagram of 2015 Shallow Groundwater, LCRS, and LDS Samples
Figure 7-2 Piper (Trilinear) Diagram of 2015 Leachate Pond, LDS Liquid, and Nearby Monitoring Well Groundwater Samples
L i s t o f A p p e n d i c e s
Appendices listed below are provided in hard copy and in electronic format on the compact disc (CD) attached to this report:
Appendix A Historical Groundwater Elevation Data (including Hydrographs), and Field Water Quality Monitoring Results for Groundwater and Leachate Management System Samples
Appendix F Geochemical Diagrams (Piper [Trilinear] and Stiff Plots) for Groundwater and Leachate Management System Samples

P r e p a r e d f o r R i v e r b e n d L a n d f i l l C o m p a n y
R i v e r b e n d L a n d f i l l v 0 4 2 0 8 0 2 2 . 1 6 2 0 1 5 A n n u a l E n v i r o n m e n t a l M o n i t o r i n g R e p o r t
L i s t o f A p p e n d i c e s ( c o n t i n u e d )
Appendices listed below are only provided in electronic format on the compact disc (CD) attached to this report:
Appendix B Field Documentation
Appendix C 2015 Laboratory Analytical Reports (Including Chain-of-Custody Forms, Cation-Anion Balance Data, and Laboratory QA/QC Documentation) for Groundwater and Leachate Management System Samples
Appendix D Results of Field and Laboratory QA/QC Review
Appendix E Time-Concentration Graphs of 2015 and Historical Groundwater and Leachate Management System Samples Analytical Data
Appendix G 2015 Poplar Tree Farm Monitoring Report

P r e p a r e d f o r R i v e r b e n d L a n d f i l l C o m p a n y
R i v e r b e n d L a n d f i l l v i 0 4 2 0 8 0 2 2 . 1 6 2 0 1 5 A n n u a l E n v i r o n m e n t a l M o n i t o r i n g R e p o r t
A C R O N Y M S A N D A B B R E V I A T I O N S
AEMR annual environmental monitoring report Alexin Alexin Analytical Laboratories, Inc. Ca calcium CD compact disk Cl chloride COC chain of custody DEQ Oregon Department of Environmental Quality DO dissolved oxygen EMP environmental monitoring plan Fe iron FSDS field sampling data sheet ft/ft feet per foot ft/yr feet per year gal/acre/day gallons-per-acre-per-day GCCS gas collection and control system GEM CES LandTec GEMTM 2000 or 5000 Landfill Gas Analyzer HCO3 bicarbonate alkalinity K potassium LCRS leachate collection and removal system LDS secondary leak detection system LEL lower explosive limit LFG landfill gas LMS leachate management system Mg magnesium mg/L milligrams per liter Mn manganese MSE mechanically stabilized earthen Na sodium NGQGL numerical groundwater quality guidance levels NPDES National Pollutant Discharge Elimination System ORELAP Oregon Environmental Laboratory Accreditation Program ORP oxidation-reduction potential PQL practical quantitation limit QA/QC quality assurance/quality control SCS SCS Engineers RL Riverbend Landfill RLC Riverbend Landfill Company SM Standard Methods SO4 sulfate SSL site-specific concentration limit S.U. standard units SWDP solid waste disposal site permit

P r e p a r e d f o r R i v e r b e n d L a n d f i l l C o m p a n y
R i v e r b e n d L a n d f i l l v i i 0 4 2 0 8 0 2 2 . 1 6 2 0 1 5 A n n u a l E n v i r o n m e n t a l M o n i t o r i n g R e p o r t
A C R O N Y M S A N D A B B R E V I A T I O N S ( C O N T I N U E D )
TestAmerica TestAmerica Laboratories, Inc. TDS total dissolved solids TICs tentatively identified compounds TOC total organic carbon TSS total suspended solids USEPA U.S. Environmental Protection Agency VOC volatile organic compound WBZ water-bearing zone WM Waste Management

P r e p a r e d f o r R i v e r b e n d L a n d f i l l C o m p a n y
R i v e r b e n d L a n d f i l l v i i i 0 4 2 0 8 0 2 2 . 1 6 2 0 1 5 A n n u a l E n v i r o n m e n t a l M o n i t o r i n g R e p o r t
E X E C U T I V E S U M M A R Y
This 2015 annual environmental monitoring report (AEMR) presents and evaluates monitoring data for groundwater, surface water, leachate management system (LMS) liquids (leachate and secondary leak detection system [LDS] liquids), and landfill gas (LFG) collected during 2015 at Riverbend Landfill (RL) in Yamhill County, Oregon. Monitoring and reporting were performed in 2015 consistent with the requirements of (1) RL’s solid waste disposal site permit (SWDP) 345, issued by the Oregon Department of Environmental Quality (DEQ) on December 3, 1999, and subsequent addenda, and (2) RL’s approved environmental monitoring plan (SCS Engineers [SCS], 2014).
R e s u l t s a n d C o n c l u s i o n s
Compliance Well Groundwater Quality
Analytical results for the groundwater samples collected in 2015 from the site’s compliance monitoring well network did not indicate a potential change in water quality related to a release from the facility. Volatile organic compounds (VOCs) were not detected in compliance well groundwater samples in 2015. The concentrations of three or more site-specific inorganic parameters were not detected above their respective statistically-derived concentration limits in any groundwater samples collected from a single compliance well during a semiannual monitoring event in 2015.
MW-5A and MW-5B Groundwater Quality
Low-level concentrations of three VOCs (chlorobenzene, 1,4-dichlorobenzene, and cis-1,2-dichloroethene) were detected in groundwater samples collected from detection monitoring well MW-5A in 2015, consistent with previous results. Results of the remedial investigation performed in 1993 demonstrated that LFG is the source of VOCs impacting groundwater in the shallow water-bearing zone (WBZ) in the MW-5A area. The concentrations of VOCs detected historically in MW-5A have significantly decreased in response to active LFG collection at RL. VOCs were not detected in the groundwater sample collected in 2015 from detection well MW-5B (located adjacent to MW-5A and screened in the deep WBZ) or in compliance wells located hydraulically downgradient of MW-5A, consistent with historical results.
Consistent with the recommendation in the 2014 AEMR (SCS, 2015a), MW-5A inorganic groundwater quality was further evaluated in 2015 in response to an increasing trend identified for field conductivity. Results of the evaluation of MW-5A groundwater indicate that the inorganic groundwater quality, similar to its organic (i.e., VOCs) signature, is localized in the shallow WBZ near MW-5A and the source of the increase in conductivity is not related to leachate. Data supporting this conclusion include (1) the geochemical signature of MW-5A groundwater and Module 1/5 leachate are distinctly different, (2) conductivity measured in well MW-5B is consistent with historical data and does not show an increasing trend, and (3) no change in groundwater quality has been identified in MW-12A groundwater located hydraulically downgradient of MW-5A along the site’s compliance boundary.

P r e p a r e d f o r R i v e r b e n d L a n d f i l l C o m p a n y
R i v e r b e n d L a n d f i l l i x 0 4 2 0 8 0 2 2 . 1 6 2 0 1 5 A n n u a l E n v i r o n m e n t a l M o n i t o r i n g R e p o r t
Groundwater Quality in Poplar Tree Farm Detection Wells and Piezometers
Analytical results of samples collected in 2015 from detection wells MW-19A and MW-20A located downgradient of the south and north poplar tree farm areas, respectively, are consistent with historical trends and continued to show localized changes in the shallow WBZ at these locations. However, it appears that the suspension of leachate irrigation in the poplar tree farm areas implemented in 2013 in response to water-quality changes in MW-20A groundwater (CH2M Hill, 2013) are beginning to show some recent positive effects in water quality, including the following: (1) stabilized or decreasing concentrations trends for Ca, Cl, Mg and Na in MW-19A groundwater and (2) decreasing or stabilized concentration trends for ammonia, Fe, Mg, and Mn in MW-20A groundwater. It should also be noted that no changes in groundwater quality were observed in the samples collected from MW-20B screened in the deeper sand-gravel WBZ adjacent to MW-20A, consistent with historical results.
As part of a continued evaluation of the groundwater quality in the vicinity of MW-20A, RLC installed a supplemental piezometer (P-07A) in February 2012 approximately 300 feet south of MW-20A. Laboratory results of groundwater samples collected from P-07A in 2015 (and since 2012) indicate that Cl concentrations were significantly lower than recent Cl concentrations detected in MW-20A groundwater. Additionally, none of the other increasing concentration trends previously identified in MW-20A groundwater were identified in P-07A groundwater, consistent with previous results (see Table 6-3).
Landfill Leachate Management Systems
The 2015 pumping volume data continued to show that the small volumes of liquids detected in and pumped from the LDSs (compared to the volumes pumped from the associated primary leachate collection and removal systems [LCRS]) are not attributed to leachate leakage through the primary liner systems. Analytical results of liquid samples collected from the LCRSs and LDSs in 2015 are generally consistent with historical results. VOCs were not detected in liquid samples collected from the LDS sumps (Sumps 4/5S, 6/7S, and 8S).
First-time liquid samples collected from the LCRS 9 P and LDS 9 S sumps in May 2015 showed detections of VOCs in both samples that are likely attributed, in part, to the recent construction of Module 9. The VOCs detected at the highest concentrations (MEK, acetone, and toluene) are chemicals typically found in primers and adhesives used for constructing the components of the module liner system. It is expected that the VOCs detected in liquid from the LDS 9 S sump will attenuate relatively quickly.
Leachate Pond and Leachate Pond Secondary Detection System
Analytical results of liquid samples collected from the leachate pond and pond LDS in 2015 showed similarities in their ionic chemistries, consistent with previous data. Consistent with results of an assessment performed in 2013 (Wallis Engineering, 2013), the 2015 pumping data indicate that leachate from the primary liner system is being transmitted at relatively low volumes into the leachate pond LDS. The volume of liquid pumped from the leachate pond LDS in 2015 showed a pronounced decrease compared to 2014.
The analytical results of groundwater samples collected in the vicinity of the leachate pond (i.e., from wells MW-14A/B, MW-21A/B, and MW-22A) did not show any changes in groundwater quality. The
P r e p a r e d f o r R i v e r b e n d L a n d f i l l C o m p a n y
R i v e r b e n d L a n d f i l l x 0 4 2 0 8 0 2 2 . 1 6 2 0 1 5 A n n u a l E n v i r o n m e n t a l M o n i t o r i n g R e p o r t
results indicate that liquids in the pond LDS are being effectively contained and removed, and that these liquids have not affected groundwater quality in the area near the leachate pond.
LFG Monitoring Results
Quarterly LFG monitoring performed in 2015 did not detect methane in the perimeter (compliance) LFG monitoring probes or in any facility structures above regulatory compliance levels. The 2015 compliance LFG monitoring results indicate RL’s management of the facility’s LFG collection and control system has been effective at preventing lateral LFG migration in the subsurface at the compliance boundary and into facility structures.

P r e p a r e d f o r R i v e r b e n d L a n d f i l l C o m p a n y
R i v e r b e n d L a n d f i l l 1 0 4 2 0 8 0 2 2 . 1 6 2 0 1 5 A n n u a l E n v i r o n m e n t a l M o n i t o r i n g R e p o r t
1 .0 INTRODUCT ION
1 . 1 T E R M S O F R E F E R E N C E
This annual environmental monitoring report (AEMR), prepared by SCS Engineers (SCS), in Portland, Oregon, on behalf of Riverbend Landfill Company (RLC), presents and evaluates monitoring data for groundwater, surface water, leachate management system (LMS) liquids, and landfill gas (LFG) collected during 2015 at Riverbend Landfill (RL) in Yamhill County, Oregon (Figure 1-1). The 2015 monitoring and reporting were consistent with the requirements in (1) RL’s solid waste disposal site permit (SWDP) 345, issued by the Oregon Department of Environmental Quality (DEQ) on December 3, and 1999 subsequent addenda, and (2) RL’s DEQ-approved environmental monitoring plan (EMP; SCS Engineers [SCS], 2014).
SCS performed the 2015 compliance monitoring activities for groundwater, surface water, leachate management system liquids, and LFG. RL personnel performed management of the leachate management system in 2015. TestAmerica Laboratories (TestAmerica) in Denver, Colorado, analyzed all groundwater, surface water, LMS liquid samples collected in 2015, except for the surface water sample bacteria analysis (E. coli and fecal coliform) which was performed by Alexin Analytical Laboratories, Inc. (Alexin) in Tigard, Oregon.
Stormwater discharge monitoring was conducted in 2015 under the provisions of RL’s National Pollutant Discharge Elimination System (NPDES) Permit 1200-Z and RL’s stormwater pollution control plan. The 2014-2015 (July 1, 2014 to June 30, 2015) stormwater discharge monitoring results were reported to the DEQ in July 2015 (SCS, 2015b). Consequently, these results are not presented or discussed in this report.
1 . 2 S I T E D E S C R I P T I O N
RL is located approximately three miles southwest of McMinnville, Oregon, in Yamhill County (Figure 1-1). RL is owned and operated by RLC and is permitted by the DEQ to receive municipal solid waste and approved special waste.
The RL property is over 500 acres. Encompassed within the landfill site is the active landfill and ancillary facilities, north and south poplar tree farms and an RV park west to southwest of the landfill, and undeveloped land south of the landfill extending to the South Yamhill River (see Figure 1-2). Agricultural land surrounds the landfill site.
The development of the permitted landfill has generally progressed from west to east. The nine constructed modules (Modules 1 through 9) cover approximately 87 acres (see Figure 1-2). The north and south poplar tree farm areas occupy approximately 43 acres.

P r e p a r e d f o r R i v e r b e n d L a n d f i l l C o m p a n y
R i v e r b e n d L a n d f i l l 2 0 4 2 0 8 0 2 2 . 1 6 2 0 1 5 A n n u a l E n v i r o n m e n t a l M o n i t o r i n g R e p o r t
1 . 3 S I G N I F I C A N T 2 0 1 5 A C T I V I T I E S
Significant site and monitoring activities performed at RL in 2015 not discussed elsewhere in this report include the following:
• Submitted the 2014 AEMR (SCS, 2015a) to the DEQ in April 2015. The DEQ approved the 2014 AEMR in a letter dated June 9, 2015 and noted that (1) the 2014 AEMR documented compliance with RL’s EMP and the SWDP and (2) monitoring results did not indicate any significant change in groundwater quality at the compliance wells during 2014 (DEQ, 2015c).
• Initiated annual sampling and analysis in May 2015 of leachate and secondary liquid from recently constructed Module 9 (Sump 9 P and 9 S).
• Performed soil monitoring activities related to former leachate management activities in the poplar tree farm areas. A report of the soil monitoring and leachate management activities in the poplar tree farm areas is provided as an attachment to this 2015 AEMR (CH2M Hill, 2015).
• Decommissioned water supply well MB-2 in July 2015 consistent with a work plan dated June 10, 2015 (GSI, 2015a). The DEQ approved the work plan in an email communication dated June 25, 2015 (DEQ, 2015d). A report documenting the decommissioning activities (GSI, 2015b) was submitted to the DEQ in August 2015.
• Installed monitoring well pair MW-25A/B in July 2015 to evaluate groundwater conditions in the area generally downgradient (southeast) of former on-site production well MB-2 that was decommissioned from June 29 through July 2, 2015. The installations were performed consistent with a work plan dated June 9, 2015 (SCS, 2015d) that was approved by the DEQ in an email communication dated June 25, 2015 (DEQ, 2015d). A report documenting the drilling and installation activities of MW-25A/B was submitted to the DEQ (SCS, 2015g). The DEQ approved the installation report in an email communication dated August 24, 2015 (DEQ, 2015e). Results of the groundwater quality evaluation indicated that groundwater in wells MW-25A/B were similar to other upgradient (background) monitoring wells and did not identify any environmental impacts (SCS, 2015i).
• Performed a Hydrogeologic Site Characterization (HSC) in support of a Permit Modification Application for the Module 11 expansion consistent with work plans dated February 13 and April 23, 2015 (SCS, 2015a and 2015b) that were approved by the DEQ (DEQ, 2015a and 2015b). A report documenting the HSC dated August 13, 2015 was submitted to the DEQ (SCS, 2015f). A revised version of the report was submitted to the DEQ on September 18, 2015 (SCS, 2015h) that addressed the DEQ’s review comments of the August 2015 version documented in an email communication dated August 26, 2015 (DEQ, 2015f).

P r e p a r e d f o r R i v e r b e n d L a n d f i l l C o m p a n y
R i v e r b e n d L a n d f i l l 3 0 4 2 0 8 0 2 2 . 1 6 2 0 1 5 A n n u a l E n v i r o n m e n t a l M o n i t o r i n g R e p o r t
• Completed construction of the Phase 1B portion of the mechanically stabilized earthen (MSE) berm (along the west side of the existing landfill) in October 2015.
• Performed routine inspections of the MSE berm in 2015. No maintenance or inspection issues were identified in 2015 (Geosyntec, 2016).
• Completed expansion of the gas collection and control system (GCCS) in December 2015 by installing and constructing a series of new vertical gas collection wells to enhance LFG collection.
1 . 4 S U P P L E M E N T A L I N F O R M A T I O N P R O V I D E D I N R E P O R T
The following supporting documentation is provided in the report appendices:
• Appendix A: Historical groundwater and surface water elevations (including hydrographs), and field water-quality monitoring results for groundwater and LMS samples.
• Appendix B (included on attached compact disc [CD]): Field documentation, including groundwater elevation survey forms, field sampling data sheets (FSDSs), site inspection checklists, and field report forms.
• Appendix C (included on attached CD): Laboratory analytical reports, including chain-of-custody (COC) forms, cation-anion balance data, and laboratory quality assurance/quality control (QA/QC) documentation for groundwater, surface water, LMS samples collected in 2015. Additionally, Appendix C includes a copy of the TestAmerica’s Oregon Environmental Laboratory Accreditation Program (ORELAP) certification.
• Appendix D (included on attached CD): Results of the field and laboratory QA/QC review.
• Appendix E (included on attached CD): Time-concentration graphs of 2015 and historical groundwater and leachate management system samples analytical data.
• Appendix F: Geochemical diagrams (Piper [Trilinear] and Stiff Plots) for groundwater and LMS samples.
• Appendix G: 2015 Poplar Tree Farm Monitoring Report.
The CD provided with this AEMR also includes (1) the historical analytical database for groundwater, surface water, and LMS samples in a searchable (Excel) format, and (2) a complete electronic version of this 2015 AEMR.

P r e p a r e d f o r R i v e r b e n d L a n d f i l l C o m p a n y
R i v e r b e n d L a n d f i l l 4 0 4 2 0 8 0 2 2 . 1 6 2 0 1 5 A n n u a l E n v i r o n m e n t a l M o n i t o r i n g R e p o r t
2 .0 HYDROGEOLOGIC SETT ING
Numerous local and regional hydrogeologic investigations have been performed in the vicinity of RL. In general, the investigations included interpreting topographic maps, drilling soil borings, installing monitoring wells and piezometers, conducting geophysical investigations, collecting and analyzing soil, groundwater and leachate samples, and analyzing aquifer hydraulic parameters. These studies provide the foundation for hydrogeologic interpretations and the technical basis for the environmental monitoring program at RL.
Most of the interpretive information on the site’s geology was obtained from previous RL studies, in particular the additional hydrogeologic investigation conducted by EMCON (1994). Other geologic information was collected during drilling of the boreholes for compliance monitoring well pairs MW-12A/B through MW-16A/B (EMCON, 1995, 1996), compliance monitoring well pair MW-21A/B (CH2M Hill, 2000), and six detection monitoring wells MW-17A, MW-18A, MW-18B, MW-19A, MW-20A, and MW-20B (CH2M Hill, 2000) used to monitor the new poplar tree farm area in the southwest part of the site.
2 . 1 H Y D R O G E O L O G Y
For the purposes of environmental monitoring at RL, groundwater occurs in two water-bearing zones (WBZs): (1) upper (shallow) silt-clay alluvial deposits (both the Willamette Silt and the late-Quaternary alluvium) comprised predominantly of bedded silts, clays, clayey silts and silty clays, and (2) lower (deep) sand-gravel deposits. The Pliocene-age sand-gravel deposits overlay the Eocene bedrock deposits, are predominantly laterally continuous unit, and consist mostly of sandy gravels and gravelly sands, with localized interbeds of clayey and silty gravels and clay and silt lenses.
Groundwater elevations measured in site groundwater monitoring wells and piezometers since January 1993 have been used to evaluate the hydraulic parameters and flow characteristics of both WBZs. A description of these two WBZ based on interpretive information collected as part of previous hydrogeologic investigations (EMCON, 1994, 1995, and 1996) and (CH2M Hill, 2000) and groundwater monitoring (elevations and chemistry) performed since 1994 are provided below.
2 . 1 . 1 U p p e r ( S h a l l o w ) S i l t - C l a y W a t e r - B e a r i n g Z o n e
Across most of RL, the groundwater flow direction and gradient in the upper shallow WBZ show minor seasonal and spatial variability, typically in response to variations in seasonal precipitation patterns. The direction of groundwater flow in the upper shallow WBZ is typically south-southeast, toward the South Yamhill River. In the extreme southwestern portion of the site, groundwater flow is predominantly toward the east. The historical seasonal range of groundwater gradients is generally from 0.005 to 0.01 foot per foot (ft/ft). Average groundwater flow velocities in the shallow WBZ generally range from 0.1 to 24.2 feet per year (ft/yr).
Historical groundwater level data for monitoring wells, screened in the upper shallow WBZ near the South Yamhill River, indicate that temporal fluctuations of approximately 10 to 15 feet occur. Generally, groundwater elevations measured in those wells are typically higher than the river elevation, indicating that groundwater in the upper silt-clay WBZ discharges to the river. This

P r e p a r e d f o r R i v e r b e n d L a n d f i l l C o m p a n y
R i v e r b e n d L a n d f i l l 5 0 4 2 0 8 0 2 2 . 1 6 2 0 1 5 A n n u a l E n v i r o n m e n t a l M o n i t o r i n g R e p o r t
relationship between the South Yamhill River and groundwater indicates that the South Yamhill River acts as a hydraulic boundary to groundwater flow in the shallow WBZ.
2 . 1 . 2 L o w e r ( D e e p ) S a n d - G r a v e l W a t e r - B e a r i n g Z o n e
The groundwater flow direction and gradient in the deep WBZ do not vary significantly as a result of seasonal changes in precipitation. In most areas of RL, groundwater flows toward the southeast, in the direction of the South Yamhill River, and shifts southward as it approaches the river. The historical seasonal range of groundwater gradients is generally from 0.0088 to 0.012 ft/ft. The average groundwater flow velocity in the deep WBZ has been estimated to be about 124 ft/yr.
Interpretation of RL stratigraphic information indicates that the deep WBZ does not receive direct recharge from precipitation in the vicinity of RL due to the presence of the overlying shallow WBZ, which has a relatively low hydraulic conductivity. Furthermore, because the lower sand-gravel stratigraphic unit partially transects the river, the river most likely represents a hydraulic barrier for groundwater in the lower sand-gravel zone. Historically, groundwater elevations measured in wells screened in the lower sand-gravel WBZ near the South Yamhill River were consistently higher than the river elevation. The differences in elevation suggest that groundwater in the lower sand-gravel WBZ was discharging to the river during those time periods.
RL has a production well designated as PW-1, located near the facility entrance. The well is completed in and pumps water from the deep WBZ. There is another production well (MB-1) on the former Bernard property on the east side of the RL entrance that is also active. During the dry season, when PW-1 and MB-1 are used most frequently, groundwater elevations in the deep WBZ are affected in the northwest corner of RL by production well pumping.

P r e p a r e d f o r R i v e r b e n d L a n d f i l l C o m p a n y
R i v e r b e n d L a n d f i l l 6 0 4 2 0 8 0 2 2 . 1 6 2 0 1 5 A n n u a l E n v i r o n m e n t a l M o n i t o r i n g R e p o r t
3 .0 ENV IRONMENTAL MONITOR ING NETWORKS AND SCHEDULES
3 . 1 G R O U N D W A T E R M O N I T O R I N G N E T W O R K A N D S CHE DUL E
The groundwater monitoring network at RL is shown in Figure 1-2. Monitoring well and piezometer construction information is summarized in Table 3-1. Each sampled compliance and detection monitoring well is equipped with a dedicated QED bladder pump that has an intake approximately in the middle of the well screen interval. The wells and piezometers labeled “A” are screened in the upper silt-clay unit, and those labeled “B” are screened in the lower sand-gravel unit, except for the designations of MW-1A and MW-1B, which are reversed. Wells and piezometers with no designation (e.g., MW-2, P-01) are screened in the upper silt-clay unit.
The 2015 semiannual and annual groundwater monitoring schedule is summarized in Table 3-2 and included the following activities:
• Compliance monitoring wells: MW-12A/B, MW-14A/B, MW-15A/B, MW-16A/B, and MW-21A/B were monitored semiannually in May and November 2015.1
• Detection monitoring wells: Well pair MW-5A/B was monitored for volatile organic compound (VOC) concentrations in groundwater attributed to past LFG effects (EMCON, 1993). Detection well MW-5A was sampled semiannually in May and November 2015 and detection well MW-5B was sampled annually in May 2015.
• Poplar tree farm detection monitoring wells: MW-19A and MW-20A were monitored semiannually in May and November 2015, and MW-20B was monitored annually in May 2015 (see Figure 1-2). These wells monitor groundwater quality downgradient of the south and north poplar tree farm areas, respectively. Additional water-quality monitoring was performed in May 2015 in piezometers P-05A, P-06A, and P-07A located in and near the north poplar tree farm area.
• Detection monitoring well downgradient of leachate pond: MW-22A was monitored annually in December 2015 to monitor groundwater in the shallow WBZ south (downgradient) of the leachate pond.2
1 Monitoring wells MW-14A, MW-15A, and MW-16A could not be sampled during the scheduled Fall (November) 2015
monitoring event because insufficient volume of water was present in each well casing to allow for purging and sampling. These wells were sampled on December 28, 2015 when sufficient water was available for purging and sampling.
2 Monitoring well MW-22A could not be sampled during the Spring event because there was insufficient water present in the well casing to allow for purging and sampling. Well MW-22A was sampled on December 28, 2015 when sufficient water was available for purging and sampling.
P r e p a r e d f o r R i v e r b e n d L a n d f i l l C o m p a n y
R i v e r b e n d L a n d f i l l 7 0 4 2 0 8 0 2 2 . 1 6 2 0 1 5 A n n u a l E n v i r o n m e n t a l M o n i t o r i n g R e p o r t
• Groundwater elevation monitoring wells and piezometers: Groundwater elevations were monitored semiannually in May and November 2015 in the compliance and detection monitoring wells listed above, and in monitoring wells (and well pairs) MW-1A/B, MW-2, MW-3A/B, MW-4A/B, MW-6A/B, MW-9A/B(R), MW-22B, and MW-23A/B, newly installed MW-25A/B (November event only), and piezometers MW-24, P-01, P-02, P-03, SA-BH-1, SA-BH-3, SA-BH-5, SA-BH-6, and GT-10-12. Groundwater elevations were also measured in RL production well PW-1.
3 . 2 S U R F A C E W AT E R MON I T OR ING NE T WORK AND SCHE DUL E
Surface water quality samples were collected from the South Yamhill River adjacent to the landfill property in May 2015 at the following locations (see Figure 1-2):
• SYR SW-1 located upstream of the RL operations.
• SYR SW-2 located downstream of the RL operations and near the Unnamed Creek that runs along the eastern property boundary of RL.
3 . 3 L E A C H A T E M A N A G E M E N T S Y S T E M M O N I T O R I N G N E T W O R K A N D S C H E D U L E
The LMS monitoring network at RL is shown in Figure 1-2 and includes leachate collection and removal systems (LCRSs) and secondary leak detection systems (LDSs). The LCRSs remove leachate from the landfill modules and convey the leachate to a double-lined collection pond for treatment and disposal. The LDSs provide containment below the primary LCRSs.
Leachate in Modules 1 through 5 drains to a primary leachate sump, with dual side-slope risers on the south side of Module 4. The sump is equipped with a pump that discharges leachate to a header leading to the south side of the leachate pond. Leachate in Modules 6 and 7 drains to a primary leachate sump, with a side-slope riser on the south side of the modules. The sump is equipped with a pump that discharges to a separate leachate header leading to the south side of the leachate pond. Leachate in Module 8 drains to a primary leachate sump, with a side-slope riser on the north side of the module. This sump is equipped with a pump that discharges into a 4-inch header shared with Module 7, which discharges into the east side of the leachate pond. Leachate in Module 9 drains to a primary leachate sump, with a side-slope riser on the west side of the module. This sump is equipped with two primary pumps that discharge into a header, which discharges into the east side of the leachate pond.
Modules 4 and 5 were constructed with an LDS that drains to a secondary containment sump, with a side-slope riser below the primary leachate sump in Module 4. Modules 6 and 7 were also constructed with an LDS that drains to a secondary sump, with a side-slope riser below the primary leachate sump in Module 6. Modules 8 and 9 were constructed with LDSs that drains to a secondary sump, with a side-slope riser, below their primary leachate sumps in Module 8 and 9, respectively. The Modules 4/5, 6/7, 8, and 9 LDS sumps are equipped with pumps that convey any liquid in them to their corresponding primary leachate sumps.

P r e p a r e d f o r R i v e r b e n d L a n d f i l l C o m p a n y
R i v e r b e n d L a n d f i l l 8 0 4 2 0 8 0 2 2 . 1 6 2 0 1 5 A n n u a l E n v i r o n m e n t a l M o n i t o r i n g R e p o r t
The 2015 leachate and LDS monitoring schedule is summarized in Table 3-2 and included collecting and analyzing the following samples:
• Liquid from the leachate pond and the pond LDS semiannually in May3 and November 2015.
• Leachate from the Modules 1/5, 6/7, 8, and 94 LCRS sumps annually in May 2015.
• Liquid from the Modules 4/5, 6/7, 8, and 9 LDS sumps annually in May 2015.
3 . 4 L A N D F I L L G A S M O N I T O R I N G N E T W O R K A N D S C H E D U L E
The LFG monitoring network at RL is shown in Figure 1-2. LFG compliance monitoring is performed to determine whether explosive gases are migrating from the landfill into facility structures or beyond RL’s property boundary. Monitoring of the compliance LFG monitoring probes and facility structures were performed quarterly in 2015 by SCS at the following locations:
• Compliance boundary LFG probes: CGP-09R, CGP-10R, CGP-11, CGP-12, CGP-13, and CGP-14.
• Facility structures: office building, scale house, maintenance building, operations building, and the landfill gas to energy building.
To supplement the six compliance LFG probes, there are six performance LFG probes (PGP-01 [dual completion], PGP-02 [dual completion], PGP-03, PGP-04, PGP-06, and PGP-08R) designed to monitor the performance of the facility’s GCCS. These performance probes are located adjacent to the facility waste cells (Modules 1, 2, 3, and 8) (see Figure 1-2) and are not used for compliance LFG monitoring and reporting purposes.
3 The leachate pond and LDS were sampled on May 11, 2015. Replacement samples were collected on May 26, 2015 for
total suspended solids (TSS) analysis only because the original TSS analyses were performed past the analytical holding time.
4 Annual sampling of leachate and LDS liquid from the recently constructed Module 9 was initiated during the Spring (May) 2015 monitoring event.

P r e p a r e d f o r R i v e r b e n d L a n d f i l l C o m p a n y
R i v e r b e n d L a n d f i l l 9 0 4 2 0 8 0 2 2 . 1 6 2 0 1 5 A n n u a l E n v i r o n m e n t a l M o n i t o r i n g R e p o r t
4 .0 F I E LD PROCEDURES
4 . 1 G R O U N D W A T E R
During each semiannual groundwater monitoring event before groundwater sampling began, depth-to-groundwater levels in the site monitoring wells and piezometers were measured using an electronic water-level probe. The 2015 and historical depth-to-groundwater measurements and groundwater elevation data are summarized in Appendix A (Table A-1).
Compliance and detection wells were purged and sampled using dedicated QED bladder pumping systems. Piezometers P-05A, P-06A, and P-07A which are not fitted with dedicated bladder pumps were purged and sampled using a non-dedicated peristaltic pump. Compliance and detection monitoring wells (and piezometers) screened in the shallow WBZ were sampled using the traditional purging technique (i.e., purging of at least three casing volumes). Compliance and detection monitoring wells screened in the lower (sand and gravel) WBZ were sampled using the low-flow purging and sampling technique, as described below.
When traditional purging method was used, each well was purged of at least three casing volumes (unless the well purged dry). Purged groundwater was discharged through a flow-through cell to facilitate measuring field water quality parameters. At a minimum, after each casing volume was purged, water quality parameters (temperature, pH, specific conductance, oxidation-reduction potential [ORP], and dissolved oxygen [DO] content) were measured and recorded on an FSDS (provided in Appendix B). Groundwater in each well was sampled after at least three casing volumes were purged (unless the well purged dry) and the water quality parameters (temperature, specific conductance, and DO content) had stabilized to within 10 percent of the previous measurement and pH had stabilized to within 0.3 standard units (S.U.). There is no stabilization requirement for ORP. After the parameters stabilized, representative groundwater samples were collected directly from the dedicated pump discharge tubing and into laboratory-supplied containers. For wells that were purged dry, groundwater samples are collected after the well has either recovered to 90 percent of its original water level or within a 24-hour period.
When low-flow sampling techniques were used, groundwater was discharged through a flow-through cell, and field-measured water quality parameters (temperature, pH, specific conductance, ORP, and DO content) were recorded at approximately 0.1 to 0.25-gallon intervals. The field-measured water quality parameters were collected at intervals that allows for fresh groundwater to fill the flow-through cell between each measurement. Purge rates were maintained at approximately 400 milliliters per minute or less, and groundwater levels were maintained within 0.3 feet of their initial water level measurement. Groundwater samples were collected once water quality parameters stabilized to within the following purge completion standards: pH ±0.1 S.U., temperature ±1.0 degrees Celsius, specific conductance ±5 percent, and DO ±0.5 milligrams per liter (mg/L).
The cumulative volume of groundwater purged and the temperature, pH, specific conductance, ORP, and DO values were recorded on an FSDS after each measurement (see Appendix B). The condition of wells, piezometers, and the surrounding area were noted on the landfill inspection checklist forms (see Appendix B). All wells were in good condition, secure, and easily accessible.

P r e p a r e d f o r R i v e r b e n d L a n d f i l l C o m p a n y
R i v e r b e n d L a n d f i l l 1 0 0 4 2 0 8 0 2 2 . 1 6 2 0 1 5 A n n u a l E n v i r o n m e n t a l M o n i t o r i n g R e p o r t
4 . 2 S U R F A C E W A T E R
Surface water quality samples were collected at SYR SW-1 and SYR SW-2 by dipping the laboratory-supplied sample bottles into the surface water and allowing the bottles to fill gently.
4 . 3 L E A C H A T E M A N A G E M E N T S Y S T E M S
Liquid samples from the LCRS and LDS sumps were collected using the dedicated submersible pumps installed in each sump’s riser pipe. Sample bottles were filled directly from the submersible pump discharge lines. Leachate grab samples were collected from the leachate pond by lowering a non-dedicated, single-use disposable polyvinyl chloride bailer into the leachate pond at four locations. The leachate pond grab samples were then composited, and the composite leachate pond samples were used to fill the sample bottles.
Field parameters (temperature, pH, specific conductance, ORP, and DO) were measured during sampling of each LCRS and LDS sump and recorded on FSDSs (provided in Appendix B). Table A-3 (Appendix A) summarizes historical and 2015 results for the field-measured water quality parameters (temperature, pH, specific conductance, DO, and ORP) in liquid samples collected from the leachate and secondary LDSs at RL.
4 . 4 L A N D F I L L G A S
LFG concentrations (i.e., methane) were measured in RL’s LFG monitoring probes and facility structures using a CES LandTec GEM™ 2000 or 5000 landfill gas analyzer (GEM). The probes were purged using the internal pump in the GEM for a minimum of one minute before LFG concentrations were recorded. The facility structures were monitored for LFG using the GEM in potentially confined areas where air movement may be restricted. At each of these locations, LFG concentrations were recorded after the GEM was allowed to operate for at least one minute. LFG was also monitored in facility structures using dedicated continuous methane monitoring devices.
4 . 5 F I E L D Q U A L I T Y A S S U R A N C E / Q U A L I T Y C O N T R O L P R O C E D U R E S
All environmental and QA/QC samples were packed in coolers with wet ice and sent by overnight courier to TestAmerica in Denver, Colorado for analysis, except for the surface water samples collected for fecal coliform and E. coli analyses which were submitted to Alexin in Tigard, Oregon. The samples shipped and delivered to TestAmerica and Alexin, respectively, arrived at acceptable temperatures and in good condition.
Field QA/QC procedures included (1) collecting at least one field blank and one field duplicate sample for each day of sampling or for every ten samples, which ever was more frequent, and (2) carrying laboratory-supplied trip blanks into the field and submitting the trip blanks with VOC samples to the laboratory for the days VOCs samples were collected in the field. Analytical laboratory reports and copies of COC forms and laboratory analytical request forms are provided in Appendix C (included on the attached CD).

P r e p a r e d f o r R i v e r b e n d L a n d f i l l C o m p a n y
R i v e r b e n d L a n d f i l l 1 1 0 4 2 0 8 0 2 2 . 1 6 2 0 1 5 A n n u a l E n v i r o n m e n t a l M o n i t o r i n g R e p o r t
5 .0 LABORATORY METHODS
This section summarizes the laboratory methods and analyses performed in 2015. Copies of the laboratory reports are provided in Appendix C of this report included on the attached CD. A copy of TestAmerica’s ORELAP certification is provided in Appendix C (included on the attached CD).
5 . 1 A N A L Y T I C A L P A R A M E T E R S F O R E N V I R O N M E N T A L S A M P L E S
Consistent with the site’s EMP (SCS, 2014b), the 2015 environmental monitoring samples were analyzed as follows:
• Groundwater samples were analyzed for the parameters as summarized in Table 5-1.
• Surface water samples collected from the South Yamhill River were analyzed for the parameters summarized in Table 5-2.
• LCRS and LDS liquid samples were analyzed for the parameters summarized in Table 5-3.
5 . 2 L A B O R A T O R Y Q U A L I T Y A S S U R A N C E / Q U A L I T Y C O N T R O L P R O C E D U R E S A N D R E S U L T S
Laboratory QA/QC procedures included analyzing surrogate spikes, method blanks, laboratory control samples, duplicates, matrix spikes, and matrix spike duplicates. Laboratory QA/QC procedures also included calculating cation-anion balances. The laboratory QA/QC results are included with the laboratory reports (provided in Appendix C on the attached CD).
Laboratory data and QA/QC procedures were reviewed by SCS to determine whether the data met applicable USEPA quality control requirements. The reviews were consistent with applicable portions of U.S. Environmental Protection Agency (USEPA) procedures (USEPA, 1999 and 2004), with appropriate laboratory and method-specific guidelines (USEPA, 1983 and 1986; SM, 1992) and in general accordance with the procedures outlined in the EMP (SCS, 2014b). TestAmerica incorporated comments on the laboratory data quality review in the QA/QC narrative of each final laboratory report (provided in Appendix C on the attached CD). The SCS QA/QC reviews of the analytical data indicated that the data were acceptable for their intended use. The results of the laboratory results QA/QC reviews performed by SCS are provided in electronic format in Appendix D (included on the attached CD).
The cation-anion balance calculations are provided with the laboratory reports in Appendix C and summarized in Table 5-4. The 2015 groundwater, surface water, and LMS sample cation-anion balances were 10 percent or less.
Consistent with the SWDP and the EMP, TestAmerica performed a library search for tentatively identified compounds (TICs) during the Method 8260 VOC scan. The TICs are presented in the laboratory reports (provided in Appendix C on the attached CD).

P r e p a r e d f o r R i v e r b e n d L a n d f i l l C o m p a n y
R i v e r b e n d L a n d f i l l 1 2 0 4 2 0 8 0 2 2 . 1 6 2 0 1 5 A n n u a l E n v i r o n m e n t a l M o n i t o r i n g R e p o r t
6 .0 MONITOR ING RESULTS AND DATA EVALUAT ION
6 . 1 G R O U N D W A T E R E L E V A T I O N S A N D G R A D I E N T S
Historical depth-to-groundwater measurements and groundwater elevation data, including data collected in May and November 2015, are provided in Appendix A (see Table A-1); hydrographs for each well are also provided in Appendix A. The depth-to-groundwater levels measured during each semiannual monitoring event were converted to groundwater elevations. The groundwater elevations were plotted on the site map and contoured to depict the groundwater potentiometric surface of the shallow and deep WBZs (see Figures 6-1 through 6-4).
6 . 1 . 1 S h a l l o w ( S i l t - C l a y ) W B Z
The 2015 shallow WBZ groundwater potentiometric elevation and gradient data were generally consistent with historical data and showed the following:
• The groundwater flow direction in the shallow WBZ was generally south to southeast, toward the South Yamhill River (see Figures 6-1 and 6-3).
• Groundwater elevations measured in the western and southwestern portion of the site showed that (1) the groundwater flow was more towards the east-southeast (see Figures 6-1 and 6-3), and (2) both the flow direction and hydraulic gradient are influenced by the South Yamhill River.
• The groundwater elevations measured in piezometer P-07A are typically higher than elevations measured in nearby monitoring wells and piezometers resulting in a localized groundwater elevation high centered on this piezometer (see Figure 6-1).
• Horizontal hydraulic gradients in the shallow WBZ in 2015 ranged from approximately 0.003 to 0.10 ft/ft, which were generally consistent with historical results. The highest gradients occurred in the southwest section of the site between MW-19A and the South Yamhill River.
6 . 1 . 2 D e e p ( S a n d - G r a v e l ) W B Z
The 2015 deep WBZ groundwater potentiometric elevation and gradient data were generally consistent with historical data and showed the following:
• In most areas of RL, groundwater in the deep WBZ flowed generally south to more southeasterly in the eastern portion of the site (see Figures 6-2 and 6-4). The flow direction was more southerly as groundwater approaches the South Yamhill River in the area of wells MW-12B, MW-14B, MW-15B, MW-22B, and MW-23B.
• Horizontal hydraulic gradients in the deep WBZ in 2015 ranged from 0.006 to 0.031 ft/ft. Typically, the gradient is steeper in the southwestern portion of the site where the deep WBZ is thinner.

P r e p a r e d f o r R i v e r b e n d L a n d f i l l C o m p a n y
R i v e r b e n d L a n d f i l l 1 3 0 4 2 0 8 0 2 2 . 1 6 2 0 1 5 A n n u a l E n v i r o n m e n t a l M o n i t o r i n g R e p o r t
6 . 1 . 3 V e r t i c a l H y d r a u l i c G r a d i e n t s
Trends in water level elevations between the upper and lower WBZs (exhibited by adjacent piezometers and monitoring well pairs) are generally similar, with periods of high and low elevations occurring at the same time of the year. Based on semiannual monitoring data, the highest water levels in the shallow and deep WBZs typically occur in the spring, while the lowest elevations occur in the fall. The fluctuations are directly influenced by precipitation. Although seasonal trends are similar in the two WBZs, the magnitude of the water level fluctuations are variable indicating a low degree of hydraulic connection between the upper and lower WBZs.
The 2015 monitoring well pair groundwater elevation data typically show higher water levels in the shallow WBZ than those in the deep WBZ, indicating downward vertical hydraulic gradients (see Table 6-15). For monitoring well pairs MW-9A/BR and MW-14A/B, the 2015 groundwater elevation data showed slight reversals in vertical gradients (upward hydraulic gradients) between the two WBZs during both monitoring events. A slight upward vertical gradient also occurred during the Fall (November) monitoring event in well pair MW-16A/B (see Table 6-1).
6 . 2 G R O U N D W A T E R A N A L Y T I C A L R E S U L T S
6 . 2 . 1 E v a l u a t i o n o f G r o u n d w a t e r A n a l y t i c a l R e s u l t s
Analytical results of the 2015 groundwater samples collected from the site compliance wells (MW-12A/B, MW-14A/B, MW-15A/B, MW-16A/B, and MW-21A/B) were evaluated to determine whether a potentially significant change in water quality occurred based on the following criteria, consistent with RL’s EMP (SCS, 2014b):
• Detection of one or more VOCs above a practical quantitation limit (PQL) analyzed using USEPA Method 8260B. Since VOCs typically do not occur naturally in groundwater, any VOC detected and verified (i.e., confirmed during a subsequent resampling event) at a concentration above the PQL would be considered a change in groundwater quality.
• Confirmed detections of three or more inorganic (non-hazardous) parameters at concentrations (as verified by resampling if necessary) above their respective statistically-derived site-specific limits (SSLs) in a sample collected from a site compliance well during a routine monitoring event. Well-specific SSLs for total organic carbon (TOC), total dissolved solids (TDS), bicarbonate (HCO3), chloride (Cl), sulfate (SO4), dissolved magnesium (Mg), dissolved potassium (K), and dissolved sodium (Na) are specified in the EMP (SCS, 2014b) and summarized in Table 6-2.
Additionally, statistical trend analysis was performed on the 2015 and historical inorganic parameter data using the Sen’s Test method and the computer software program DUMPStat®. The analysis was conducted on analytical data collected from the compliance wells and detection wells/piezometers MW-19A, MW-20A, MW-20B, MW-22A, P-05A, P-06A, and P-07A. Statistically significant 5 Table 6-1 includes data for well pairs MW-1B/A, MW-3A/B, MW-4A/B, MW-5A/B, MW-6A/B, MW-9A/B,
MW-10A/B, MW-12A/B, MW-14A/B, MW-15A/B, MW-16A/B, MW-18A/B, MW-20A/B, MW-21A/B, MW-22A/B, MW-23A/B, and MW-25A/B.

P r e p a r e d f o r R i v e r b e n d L a n d f i l l C o m p a n y
R i v e r b e n d L a n d f i l l 1 4 0 4 2 0 8 0 2 2 . 1 6 2 0 1 5 A n n u a l E n v i r o n m e n t a l M o n i t o r i n g R e p o r t
concentration trends in groundwater collected from these site compliance and detection wells using the 2015 and historical data set are summarized in Table 6-3, and the trend graphs are provided in Appendix E (included on the attached CD).
6 . 2 . 2 A n a l y t i c a l R e s u l t s f o r C o m p l i a n c e W e l l G r o u n d w a t e r S a m p l e s
Laboratory analysis of the compliance groundwater samples collected in 2015 did not identify a potentially significant change in groundwater quality attributed to a leachate release from the facility at RL’s compliance boundary. Analytical results supporting this conclusion are:
• VOCs were not detected in groundwater samples collected from the site compliance wells in 2015, consistent with historical results.
• Three or more inorganic parameters were not detected at concentrations above their respective SSLs in a single compliance monitoring well during a single monitoring event (see Table 6-2).
Other notable results based on evaluation of the analytical results for compliance well groundwater samples collected in 2015 include the following:
• Field water quality parameter values were generally consistent with historical values and trends (see Appendix A, Table A-2). The field-measured pH values were below the secondary standard range of 6.5 to 8.5 S.U. in groundwater samples collected in one or both of the Spring (May) and Fall (November/December) semiannual events from wells MW-12A, MW-14A, MW-14B (May only), MW-15A, MW-15B (May only), MW-16A, and MW-21A. Shallow groundwater collected from site monitoring wells (and piezometers) screened in the silt-clay WBZ has been shown to have an intrinsic pH that is often below 6.5 S.U. (USA Waste, Inc., 1997). The DEQ agreed with this conclusion (DEQ, 1998).
• The following parameters were detected at concentrations above their SSLs in groundwater samples collected in 2015 from the compliance wells noted below (see Table 6-2):
Na in MW-12A groundwater (May and November 2015 samples).
Na in MW-14A groundwater (November 2015 sample only).
• Statistical trend analysis results of the 2015 and historical compliance well groundwater analytical data were generally consistent with previous results (see Table 6-3 and time-concentration graphs provided in Appendix E), with three newly identified decreasing statistical trends noted below.
Decreasing concentration trends for Mg and dissolved manganese (Mn) in MW-16A groundwater.
Decreasing concentration trend for TDS MW-16B groundwater.

P r e p a r e d f o r R i v e r b e n d L a n d f i l l C o m p a n y
R i v e r b e n d L a n d f i l l 1 5 0 4 2 0 8 0 2 2 . 1 6 2 0 1 5 A n n u a l E n v i r o n m e n t a l M o n i t o r i n g R e p o r t
• No order-of-magnitude increase in parameter concentrations or anomalous data were identified in groundwater analytical data collected in 2015 (see time-concentration graphs provided in Appendix E).
• Fe, Mn, and TDS were detected at concentrations above their secondary groundwater quality standards (i.e., Oregon numerical groundwater quality guidance levels [NGQGLs]) of 0.3, 0.05, and 500 mg/L, respectively, in groundwater samples collected from the site compliance wells listed below during the May and/or November/December 2015 monitoring events:
Dissolved Fe in groundwater from wells MW-12B, MW-14B, MW-15A (December only), and MW-21B.
Dissolved Mn in groundwater from wells MW-12B, MW-14A (May only), MW-14B, MW-15B, MW-16A, MW-16B, and MW-21B.
TDS in groundwater samples from wells MW-12B (November only) and MW-16B.
The Fe and Mn concentrations that are above the secondary standard in groundwater samples collected in 2015 were consistent with historical concentrations (see Appendix E) previously reported to the DEQ. The results of an informal preliminary assessment (IPA) conducted in 2001 concluded that the elevated Fe and Mn concentrations in groundwater samples were attributable to natural variation in groundwater chemistry and reflective of background groundwater conditions (HWA Geosciences, Inc., 2001). This conclusion is further supported by Fe and Mn analytical results obtained for upgradient monitoring wells sampled as part of the 5-year comprehensive monitoring event performed in April 2013 (SCS, 2014a) that showed levels above the secondary NGQGLs.
6 . 2 . 3 A n a l y t i c a l R e s u l t s f o r D e t e c t i o n W e l l G r o u n d w a t e r S a m p l e s
6.2.3.1 Detection Wells MW-5A and MW-5B Low concentrations of three VOCs (chlorobenzene, 1,4-dichlorobenzene, and cis-1,2-dichloroethene) were detected in samples collected in May and November 2015 from well MW-5A at concentrations that were generally consistent with recent results (see Table 6-4). VOCs were not detected in the groundwater sample collected from detection well MW-5B (located adjacent to MW-5A and screened in the deep WBZ) in 2015 or in groundwater collected from compliance monitoring wells located hydraulically downgradient of MW-5A.
Results of the remedial investigation performed in 1993 (EMCON, 1993) demonstrated that LFG is the source of VOCs impacting shallow groundwater in the MW-5A area. The concentrations of VOCs detected historically in MW-5A have significantly decreased since impacts were first identified in the early 1990s (see Figure 6-5). Additionally, the number of VOCs detected over time in MW-5A groundwater has decreased substantially since 1997, including the recent decrease in benzene concentrations to below the PQL since 2010 (see Table 6-4 and Figure 6-5). These trends indicate that active LFG collection and control continues to be effective at (1) reducing VOC concentrations in

P r e p a r e d f o r R i v e r b e n d L a n d f i l l C o m p a n y
R i v e r b e n d L a n d f i l l 1 6 0 4 2 0 8 0 2 2 . 1 6 2 0 1 5 A n n u a l E n v i r o n m e n t a l M o n i t o r i n g R e p o r t
shallow groundwater near MW-5A and (2) mitigating the lateral migration of VOCs, as noted by the DEQ (DEQ, 2001).
Consistent with the recommendation in the 2014 AEMR (SCS, 2015), MW-5A inorganic groundwater quality was further evaluated in 2015 in response to an increasing trend identified for field conductivity (see Appendix, Table A-2). This evaluation included non-routine (i.e., not required by the EMP) sampling and analysis of select dissolved cations and anions of the May 2015 groundwater sample collected from MW-5A to allow for geochemical analysis. Results of the evaluation of detection well MW-5A groundwater indicate that the inorganic groundwater quality is localized in the shallow WBZ near MW-5A and the source of the increase in conductivity is not related to leachate. Data that support this conclusion include the following:
• The ionic chemistry of MW-5A groundwater and Module 1/5 leachate (Sump 1/5 P), which is the leachate sump located nearest to MW-5A, collected in May 2015 are distinctly different. The ionic signature of Sump 1/5 P leachate is characterized by significantly higher Na and lower Ca composition, and to a lesser extent higher HCO3 and lower Cl, than MW-5A groundwater (see Piper [trilinear] diagram shown in Figure 6-6). Additionally, Sump 1/5 P leachate has significantly higher parameter concentrations than MW-5A groundwater (see Stiff diagrams show in Figure 6-7).
• Field conductivity measured in detection well MW-5B (located adjacent to MW-5A and screened in the deep WBZ) is consistent with historical data and does not show an increasing trend (see Appendix A, Table A-2).
• No change in groundwater quality, as prescribed by the EMP, has been identified in MW-12A groundwater located hydraulically downgradient of MW-5A along the site’s compliance boundary.
6.2.3.2 Poplar Tree Farm Detection Wells and Piezometers Notable results based on evaluation of the analytical results for groundwater samples collected in 2015 (and historically) from detection wells (MW-19A, MW-20A, and MW-20B) and piezometers (P-05A, P-06A, and P-07A) installed to monitor the poplar tree farm areas include the following:
• No VOCs were detected in detection wells MW-19A, MW-20A, and MW-20B.6
• No order-of-magnitude increase in parameter concentrations or anomalous data were identified in the 2015 groundwater analytical data (see time-concentration graphs provided in Appendix E).
• Statistical trend analysis results of the 2015 and historical detection wells and piezometers groundwater analytical data were generally consistent with previous results (see Table 6-3 and time-concentration graphs provided in Appendix E), except for a newly identified increasing trend for TOC in MW-20A groundwater.
6 VOCs are not required by the site’s EMP to be analyzed in piezometer P-05A, P-06A, and P-07A groundwater samples.

P r e p a r e d f o r R i v e r b e n d L a n d f i l l C o m p a n y
R i v e r b e n d L a n d f i l l 1 7 0 4 2 0 8 0 2 2 . 1 6 2 0 1 5 A n n u a l E n v i r o n m e n t a l M o n i t o r i n g R e p o r t
• Consistent with historical results previously reported to the DEQ, Cl, Fe (November only), Mn, and TDS were detected at concentrations above their NGQGLs of 250, 0.3, and 0.05, and 500 mg/L, respectively, in MW-20A groundwater samples collected in 2015.
• Fe (November only) and Mn were detected at concentrations above their NGQGLs of 0.3 and 0.05 mg/L, respectively, in MW-19A groundwater samples collected in 2015, consistent with historical results previously reported to the DEQ.
• Consistent with results previously reported to the DEQ, Mn was detected at a concentration above its NGQGL of 0.05 mg/L in the MW-20B groundwater sample collected in May 2015.
Analytical results of samples collected in 2015 from detection wells MW-19A and MW-20A located downgradient of the south and north poplar tree farm areas, respectively, are consistent with historical trends and continued to show localized changes in the shallow WBZ at these locations. However, it appears that the suspension of leachate irrigation in the poplar tree farm areas implemented in 2013 in response to water-quality changes in MW-20A groundwater (CH2M Hill, 2013) are beginning to show some recent positive effects of water quality, including the following: (1) stabilized or decreasing concentrations trends for Ca, Cl, Mg and Na in MW-19A groundwater and (2) decreasing or stabilized concentration trends for ammonia, Fe, Mg, and Mn in MW-20A groundwater.
As part of a continued evaluation of the groundwater quality in the vicinity of MW-20A, RLC installed a supplemental piezometer (P-07A) in February 2012 approximately 300 feet south of MW-20A. Laboratory results of groundwater samples collected from P-07A in 2015 (and since 2012) indicate that Cl concentrations were significantly lower than recent Cl concentrations detected in MW-20A groundwater. Additionally, none of the other increasing concentration trends previously identified in MW-20A groundwater were identified in P-07A groundwater, consistent with previous results (see Table 6-3).
6 . 2 . 4 G e o c h e m i c a l D i a g r a m s
Piper (trilinear) and Stiff diagrams showing the relative concentrations of the common cations and anions in groundwater samples collected in 2015 from the site compliance wells and poplar tree farm area detection wells, along with historic results, are provided in Appendix F. The ionic chemistry of groundwater samples collected in 2015 is generally consistent with historical results, except for MW-15A and MW-22A groundwater samples collected in December 2015 and the MW-16A groundwater sample collected in May 2015, which had slightly higher Na content.
6 . 3 S U R F A C E W A T E R A N A L Y T I C A L R E S U L T S
The analytical results of the South Yamhill River surface water samples collected in 2015 showed uniformity in the concentrations of water quality parameters in samples collected both upstream and downstream of RL.
Laboratory reports for the surface water samples collected from the South Yamhill River in May 2015 are provided in electronic format in Appendix C (included on the attached CD). Field water-quality

P r e p a r e d f o r R i v e r b e n d L a n d f i l l C o m p a n y
R i v e r b e n d L a n d f i l l 1 8 0 4 2 0 8 0 2 2 . 1 6 2 0 1 5 A n n u a l E n v i r o n m e n t a l M o n i t o r i n g R e p o r t
parameters and laboratory analytical results of the inorganic parameters in the surface water samples collected in May 2015 are summarized in Tables 6-5 through 6-8.
6 . 4 L A N D F I L L G A S M O N I T O R I N G
The 2015 and historical (since 1997) compliance boundary LFG probe and facility structure monitoring data are summarized in Table 6-9. LFG monitoring performed in 2015 did not detect methane in any perimeter (compliance) LFG probes (CGP-09R, CGP-10R, CGP-11, CGP-12, CGP-13, and CGP-14) at or above the GEM detection limit of 0.1 percent which is below the regulatory limit of 5 percent by volume (i.e., lower explosive limit [LEL] of methane).
Methane was also not detected at or above the GEM detection limit of 0.1 percent in any facility structures (office, scale building, maintenance building, operations building, and landfill gas to energy building) during quarterly monitoring events in 2015. These results are below the regulatory limit of 1.25 percent (i.e., 25 percent of the LEL of methane).

P r e p a r e d f o r R i v e r b e n d L a n d f i l l C o m p a n y
R i v e r b e n d L a n d f i l l 1 9 0 4 2 0 8 0 2 2 . 1 6 2 0 1 5 A n n u a l E n v i r o n m e n t a l M o n i t o r i n g R e p o r t
7 .0 OPERAT IONAL AND PERFORMANCE MONITOR ING RESULTS OF L EACHATE MANAGEMENT SYSTEM
This section presents operational and performance monitoring results for RL’s LMS to meet the requirements of Sections 17.5 and 17.6 of the SWDP for submitting an annual leachate treatment report. Portions of the requirements listed in Sections 17.5 and 17.6 of the SWDP were presented in the 2015 Poplar Tree Farm Monitoring technical memorandum (CH2M Hill, 2015).
7 . 1 O P E R A T I O N A N D M A I N T E N A N C E O F L E A C H A T E M A N A G E M E N T S Y S T E M S
Other than routine operations and maintenance of RL’s LMS, no performance issues were identified in 2015. The following includes the notable maintenance activities completed to the LMS in 2015:
• Replaced the Module 8 LCRS pump (8 P).
• Replaced the Modules 6/7 LDS pump (6/7 S).
• Re-routed the leachate discharge pipe from Module 4/5.
• The Module 8D LCRS cleanouts were cleaned (jetted/vacuumed).
7 . 2 L C R S A N D L A N D F I L L L D S P U M P I N G S Y S T E M P E R F O R M A N C E R E S U L T S
7 . 2 . 1 L C R S a n d L D S P u m p i n g V o l u m e s
The monthly and annual leachate and LDS liquid pumping volume data are summarized in Table 7-1. Notable results based on these data include the following:
• The total volume of leachate collected by RL’s LMS was 19.3 million gallons.
• Monthly leachate pumping volumes from RL’s combined LCRSs ranged from 574,799 gallons in October to 3,746,723 gallons in December.
• The total volume of liquid pumped from the landfill LDS sumps was 204,224 gallons, and from the leachate pond LDS sump was 110,394 gallons.
• The highest volume of liquid from the landfill module LDS sumps was pumped from Sump 4/5S, with significantly less volumes from Sump 6/7S, Sump 8S, and Sump 9S.
In terms of gallons-per-acre-per-day (gal/acre/day), the approximate quantities of liquid generated in 2015 from the LDSs for Modules 6/7 (2.3 to 6.4 gal/acre/day) and Module 8 (less than 1 to 2.7 gal/acre/day) are consistently low. New Module 9 shows greater variability (0.0 to 19 gal/acre/day). For the Modules 4/5 LDS, the data show greater variability and consistently higher inflows ranging from 7.7 to 53.6 gal/acre/day. The data from LDSs also indicate seasonality, with relatively higher
P r e p a r e d f o r R i v e r b e n d L a n d f i l l C o m p a n y
R i v e r b e n d L a n d f i l l 2 0 0 4 2 0 8 0 2 2 . 1 6 2 0 1 5 A n n u a l E n v i r o n m e n t a l M o n i t o r i n g R e p o r t
flows coinciding with seasonal high groundwater levels in the Winter and Spring, and relatively lower flows during low groundwater conditions in the Summer. As discussed further in Section 7.3, these results further support the historical conclusion that the liquids detected in and pumped from RL’s landfill LDSs are associated with groundwater intrusion and not leakage through the primary liner system.
7 . 2 . 2 L e a c h a t e M a n a g e m e n t
In recent years, leachate stored in the leachate pond was either (1) pumped to the poplar tree farm drip irrigation system for beneficial reuse, or (2) transported offsite by haul trucks to various offsite, permitted wastewater treatment facilities. The poplar tree farm did not receive any irrigation of landfill leachate in 2015 (CH2M Hill, 2015) and was irrigated exclusively by precipitation since 2013. As a result, all landfill leachate generated at RL in 2015 was managed by collection, storage, evaporation, and truck-haul to offsite, permitted wastewater treatment facilities.
The truck haul program removed approximately 39.5 million gallons of leachate from the site in 2015, which included liquids collected from RL’s GCCS.
7 . 3 L C R S L E A C H A T E A N D L A N D F I L L L D S L I Q U I D A N A L Y T I C A L R E S U L T S
Laboratory reports for liquid samples collected from the LCRS and LDS sumps in May 2015 are provided in Appendix C (included on the attached CD). Time-concentrations graphs presenting the 2015 and historical analytical results for LCRS and LDS samples are provided in Appendix E. Notable results based on evaluation of the May 2015 LCRS and LDS analytical data are described below:
• No VOCs were detected in liquid samples collected from the LDS Sumps 4/5 S, 6/7 S, and 8S (see Table 7-2).
• Consistent with historical results, acetone and 2-butanone (MEK) were detected at the highest concentrations in leachate samples from the 1/5 P, 6/7 P, and 8 P (see Table 7-2). Other VOCs detected in one or more of the leachate samples included benzene, ethylbenzene, toluene, total xylenes, 1,2,4-trimethylbenzene, 1,3,5-trimethylbenzene, 1,4-dichlorobenzene, cis-1,2-dichloroethene, isopropylbenzene, styrene, 4-isopropylbenzene, naphthalene, and 4-methyl-2-pentanone.
• First-time liquid samples collected from the LCRS 9 P and LDS 9 S sumps in May 2015 showed detections of VOCs in both samples that are likely attributed, in part, to the recent construction of Module 9. The VOCs detected at elevated concentrations in 9 P leachate (MEK, acetone, and toluene) are chemicals typically found in primers and adhesives used for constructing the components of the module liner system. Low-levels of acetone and toluene, along with 1,1-dichloroethane and 1,2-dichloroethane, were detected in the liquid sample collected from the LDS 9 S sump. Based on SCS’s experience, it is expected that the VOCs detected in liquid from the LDS 9 S sump will attenuate relatively quickly.

P r e p a r e d f o r R i v e r b e n d L a n d f i l l C o m p a n y
R i v e r b e n d L a n d f i l l 2 1 0 4 2 0 8 0 2 2 . 1 6 2 0 1 5 A n n u a l E n v i r o n m e n t a l M o n i t o r i n g R e p o r t
• The ionic chemistries of leachate samples collected from the Modules 1/5, 6/7, 8, and 9 P LCRS sumps was different to varying degrees than the ionic chemistries of liquid samples collected from their associated LDS sumps (see Piper [trilinear] and Stiff diagrams provided in Appendix F). The most pronounced difference was in the ionic chemistries between leachate and LDS samples collected from Module 1/5. In general, leachate samples collected from the LCRS sumps are characterized by significantly higher Cl and Na composition (relative to the other ionic species) than the LDS samples. The Stiff diagrams for the leachate and LDS liquid samples collected in May 2015 clearly illustrate the significantly higher parameter concentrations in site leachate compared with samples collected from the associated LDS sumps (see Appendix F).
Based on the 2015 liquid pumping data, the limited volume of liquids observed in and pumped from RL’s secondary LDS sumps (compared to leachate volumes) are not attributed to potential leachate leakage through the primary liner systems. Instead, these liquids are likely a result from inward gradients from the underlying groundwater, i.e., limited quantities of groundwater that enter the LDSs and are removed by pumping. Analytical results supporting this finding include the following:
• None of the VOCs detected in leachate samples collected from the LCRS sumps were detected in comparative liquid samples collected during the same monitoring event from the LDS sumps associated with the same waste modules (except for liquid samples collected from the newly constructed Module 9 P and S sumps as previously noted above).
• The inorganic chemistries of leachate and LDS liquid samples are distinctly different. Leachate impacts to LDS liquids would be expected to affect the inorganic chemistry of LDS liquids, such that there would be a closer correlation in inorganic chemistries for both media.
• The geochemical compositions of liquid samples collected from the LDS sumps are either very similar to or closely aligned with the chemistry of groundwater samples collected from the shallow WBZ compliance monitoring wells (see Figure 7-1).
7 . 4 L E A C H A T E P O N D A N D L D S L I Q U I D A N A L Y T I C A L R E S U L T S
Laboratory reports for liquid samples collected from the leachate pond and the pond LDS sump in May and November 2015 are provided in Appendix C (included on the attached CD). Time-concentration graphs presenting the 2015 and historical analytical results for the leachate pond and LDS samples are provided in Appendix E. Notable results based on an evaluation of the 2015 leachate pond and pond LDS sump analytical data include the following:
• VOCs detected in leachate pond samples collected in 2015 were acetone and MEK at relatively high concentrations, consistent with previous results. Low concentrations 2-hexanone, 4-methyl-2-pentanone, acetone, benzene, and toluene were detected in one or both of the LDS liquid samples collected in May and November 2015 (see Table 7-2).

P r e p a r e d f o r R i v e r b e n d L a n d f i l l C o m p a n y
R i v e r b e n d L a n d f i l l 2 2 0 4 2 0 8 0 2 2 . 1 6 2 0 1 5 A n n u a l E n v i r o n m e n t a l M o n i t o r i n g R e p o r t
• The ionic chemistries of the leachate pond and the pond LDS liquid samples collected in 2015 were generally similar (see Piper diagram provided in Appendix F). The samples are characterized by significantly higher Na and HCO3 concentrations relative to the other ionic species. The Stiff diagrams for the leachate pond and pond LDS liquid samples also illustrate the similarities in chemistry and parameter concentrations between the pond leachate and pond LDS samples, except for the November 2015 leachate pond sample which shows higher concentrations of HCO3, Cl, and Na (see Appendix F).
The above results indicate that leachate from the primary liner system continues to be transmitted at relatively low volumes into the leachate pond LDS, consistent with the findings of an assessment of the leachate pond and LDS (Wallis Engineering, 2013). It should be noted that the volume of liquid pumped from the leachate pond LDS in 2015 showed a pronounced decrease compared to 2014.
The geochemical evaluation of the analytical results of groundwater samples collected in the vicinity of the leachate pond (i.e., wells MW-14A/B, MW-21A/B, and MW-22A) did not indicate any potential mixing with leachate pond or pond LDS liquid (e.g., Cl enrichment) (see Figure 7-2). Additionally, no changes in groundwater quality were identified in groundwater samples collected from these wells in 2015 (e.g., no VOCs detected). These results suggest that containment and management of the liquid detected in the pond LDS was effective at preventing impacts to groundwater quality in the area near the leachate pond.
P r e p a r e d f o r R i v e r b e n d L a n d f i l l C o m p a n y
R i v e r b e n d L a n d f i l l 2 3 0 4 2 0 8 0 2 2 . 1 6 2 0 1 5 A n n u a l E n v i r o n m e n t a l M o n i t o r i n g R e p o r t
8 .0 REFERENCES
CH2M Hill, 2000, Technical memorandum (re: installation of eight new monitoring wells at Riverbend Landfill) to G. Duvendack, Riverbend Landfill, from B. Long, CH2M Hill, Portland, Oregon, November 21.
CH2M Hill, 2013, 2013 Technical memorandum (2013 Poplar Tree Farm Monitoring, Riverbend Landfill), prepared for Waste Management, by CH2M Hill, Portland, Oregon, December 20.
CH2M Hill, 2015, Technical memorandum (2015 Poplar Tree Farm Monitoring, Riverbend Landfill), prepared for Waste Management, by CH2M Hill, Portland, Oregon, December 22.
EMCON, 1993, Remedial investigation, Riverbend Landfill, Yamhill County, Oregon, prepared for Riverbend Landfill Co., Inc., by EMCON Northwest, Inc., Portland, Oregon, October 1.
EMCON, 1994, Additional hydrogeologic investigation, Riverbend Landfill, Yamhill County, Oregon, prepared for Riverbend Landfill Co., Inc., McMinnville, Oregon, by EMCON Northwest, Inc., Portland, Oregon, July 29.
EMCON, 1995, Letter (re: Riverbend Landfill, installation of monitoring wells MW-12A and MW-12B) to D. Wilson, Riverbend Landfill Company, Inc., McMinnville, Oregon, from L. Caruso and C. Fanshier, EMCON, Portland, Oregon, August 22.
EMCON, 1996, Installation of new compliance boundary monitoring wells and decommissioning of monitoring wells MW-8A and MW-8B, EMCON, Portland, Oregon.
Geosyntec, 2016, 2015 Annual Geotechnical Monitoring Report, prepared for Riverbend Landfill Company, McMinnville, Oregon, by Geosyntec, January 28.
GSI Water Solutions, Inc., 2015a, Technical Memorandum, Riverbend Landfill Water Supply Well MB-2 Decommissioning Work Plan, prepared for Riverbend Landfill Company, McMinnville, Oregon, by GSI Water Solutions, Inc., Portland, Oregon, June 10.
GSI Water Solutions, Inc., 2015b, Technical Memorandum, Former Water Supply Well MB-2 Decommissioning, Riverbend Landfill, McMinnville, Oregon, prepared for Riverbend Landfill Company, McMinnville, Oregon, by GSI Water Solutions, Inc., Portland, Oregon, August 19.
HWA GeoSciences, Inc., 2001, Letter (re: informal preliminary assessment to address water quality issues in MW-12B, Riverbend Landfill), to R. North, Waste Management, Inc., Portland, Oregon, from L. Caruso and K. Mathiot, HWA, Lake Oswego, Oregon, April 13.
Oregon Department of Environmental Quality (DEQ), 1998, Letter (re: response to preliminary assessment at Riverbend Landfill) to R. North, Riverbend Landfill Co., Inc., USA Waste, from C. Donaldson, DEQ, Salem, Oregon, February 27.
Oregon Department of Environmental Quality (DEQ), 2001, Letter (re: review of 2000 annual environmental monitoring report and well decommissioning report, Riverbend Landfill) to D. Wilson, Riverbend Landfill, McMinnville, Oregon, from R. S. Barrows, DEQ, Salem, Oregon, June 26.

P r e p a r e d f o r R i v e r b e n d L a n d f i l l C o m p a n y
R i v e r b e n d L a n d f i l l 2 4 0 4 2 0 8 0 2 2 . 1 6 2 0 1 5 A n n u a l E n v i r o n m e n t a l M o n i t o r i n g R e p o r t
Oregon Department of Environmental Quality, 2015a, Letter (re: Work Plan for Hydrogeologic Site Characterization – Module 11 Expansion, Yamhill County SWDP #345), to F. Willmann, Waste Management, Bainbridge Island, Washington, from A. Eldridge, DEQ, The Dalles, Oregon, April 14.
Oregon Department of Environmental Quality, 2015b, Email (re: Riverbend Landfill: Revised Work Plan for Module 11 Site Characterization), to F. Willmann, Waste Management, Portland, Oregon, and L. Caruso, SCS Engineers, Portland, Oregon, from B. Schwarz, DEQ, The Dalles, Oregon, May 18.
Oregon Department of Environmental Quality, 2015c, Letter (re: 2014 Riverbend Annual Environmental Monitoring Report, Yamhill County SWDP #345), to F. Willmann, Waste Management, Portland, Oregon, from B. Schwarz, DEQ, The Dalles, Oregon, June 9.
Oregon Department of Environmental Quality, 2015d, Email (re: Work Plans for Riverbend), to L. Caruso, SCS Engineers, Portland, Oregon, from B. Schwarz, DEQ, The Dalles, Oregon, June 25.
Oregon Department of Environmental Quality, 2015e, Email (re: Installation Report for Wells MW-25A and MW-25B), to Tim Watson, Riverbend Landfill Company, McMinnville, Oregon, from B. Schwarz, DEQ, The Dalles, Oregon, August 24.
Oregon Department of Environmental Quality, 2015f, Email (re: Hydrogeo Site Characterization Report), to T. Watson and M. Verwiel, Riverbend Landfill Company, M. Verwiel, and L. Caruso, SCS Engineers, Portland, Oregon, from B. Schwarz, DEQ, The Dalles, Oregon, August 26.
SCS Engineers, 2014a, 2013 Annual Environmental Monitoring Report, Riverbend Landfill, McMinnville, Oregon, prepared for Riverbend Landfill Company, McMinnville, Oregon, by SCS Engineers, Portland, Oregon, April 29.
SCS Engineers, 2014b, Environmental Monitoring Plan, Riverbend Landfill, McMinnville, Oregon, prepared for Riverbend Landfill Company, McMinnville, Oregon, by SCS Engineers, Portland, Oregon, December 2.
SCS Engineers, 2015a, Work Plan for Hydrogeologic Site Characterization in Support of Module 11 Expansion Permit, Riverbend Landfill, McMinnville, Oregon, prepared for Riverbend Landfill Company, McMinnville, Oregon, by SCS Engineers, Portland, Oregon, February 13.
SCS Engineers, 2015b, Work Plan for Hydrogeologic Site Characterization in Support of Module 11 Expansion Permit (Revised), Riverbend Landfill, McMinnville, Oregon, prepared for Riverbend Landfill Company, McMinnville, Oregon, by SCS Engineers, Portland, Oregon, February 13.
SCS Engineers, 2015c, 2014 Annual Environmental Monitoring Report, Riverbend Landfill, McMinnville, Oregon, prepared for Riverbend Landfill Company, McMinnville, Oregon, by SCS Engineers, Portland, Oregon, April 29.
SCS Engineers, 2015d, Work Plan to Install and Sample Groundwater Monitoring Well Pair MW-25A and MW-25B, Riverbend Landfill, McMinnville, Oregon, prepared by Riverbend Landfill Company, McMinnville, Oregon, by SCS Engineers, Portland, Oregon, June 10.
SCS Engineers, 2015e, 2014-2015 National Pollutant Discharge Elimination System Annual Stormwater Discharge Monitoring Report, Riverbend Landfill Company, Riverbend Landfill, DEQ Permit No. 1200-Z, File No. 106959, prepared for Riverbend Landfill Company, McMinnville, Oregon, by SCS Engineers, Portland, Oregon, July 29.

P r e p a r e d f o r R i v e r b e n d L a n d f i l l C o m p a n y
R i v e r b e n d L a n d f i l l 2 5 0 4 2 0 8 0 2 2 . 1 6 2 0 1 5 A n n u a l E n v i r o n m e n t a l M o n i t o r i n g R e p o r t
SCS Engineers, 2015f, Hydrogeologic Site Characterization Report in Support of Permit Modification Application for Module 11 Expansion, Riverbend Landfill, McMinnville, Oregon, prepared for Riverbend Landfill Company, McMinnville, Oregon, by SCS Engineers, Portland, Oregon, September 18.
SCS Engineers, 2015g, Report of Groundwater Monitoring Well Pair MW-25A and MW-25B Installation and Well Development, Riverbend Landfill, McMinnville, Oregon, prepared for Riverbend Landfill Company, McMinnville, Oregon, by SCS Engineers, Portland, Oregon, August 20.
SCS Engineers, 2015h, Hydrogeologic Site Characterization Report in Support of Permit Modification Application for Module 11 Expansion, Riverbend Landfill, McMinnville, Oregon, prepared for Riverbend Landfill Company, McMinnville, Oregon, by SCS Engineers, Portland, Oregon, September 18.
SCS Engineers, 2015i, Report of New Monitoring Well Pair MW-25A/MW-25B Groundwater Sampling and Evaluation, Riverbend Landfill, McMinnville, Oregon, prepared for Riverbend Landfill Company, McMinnville, Oregon, by SCS Engineers, Portland, Oregon, October 27.
Standard Methods, 1992, Standard methods for the examination of water and wastewater, 18th edition.
U.S. Environmental Protection Agency (USEPA), 1983, Methods for chemical analysis of water and wastes, EPA-600/4-79-020, March 1983 and subsequent revisions.
U.S. Environmental Protection Agency (USEPA), 1986, Test methods for evaluating solid waste: physical/chemical methods, USEPA, Office of Solid Waste and Emergency Response, EPA-530/SW-846, September (update 1, July 1992; update 2a, August 1993; update 2, September 1994; update 2b, January 1995).
U.S. Environmental Protection Agency, 1999 (USEPA), USEPA contract laboratory program, national functional guidelines for organic data review, USEPA, Office of Emergency and Remedial Response, EPA 540/R-99/008, October.
U.S. Environmental Protection Agency (USEPA), 2004, USEPA contract laboratory program, national functional guidelines for inorganic data review, USEPA, Office of Emergency and Remedial Response, EPA 540/R-04-004, October.
USA Waste, Inc., 1997, Preliminary assessment report, Riverbend Landfill, Yamhill County, Oregon, prepared for Riverbend Landfill Co., Inc., by USA Waste, Inc., San Rafael, California, December 30.
Wallis Engineering (Wallis), 2013, Memorandum (Re: Riverbend Landfill – Leachate Pond Secondary Leak Detection Sump and Riser Investigation Summary), prepared for Waste Management, Portland, Oregon, by Wallis, Vancouver, Washington, May 22.

P r e p a r e d f o r R i v e r b e n d L a n d f i l l C o m p a n y
R i v e r b e n d L a n d f i l l 0 4 2 0 8 0 2 2 . 1 6 2 0 1 5 A n n u a l E n v i r o n m e n t a l M o n i t o r i n g R e p o r t
T A B L E S

Table 3-1Groundwater Monitoring Network Construction Information
Riverbend Landfill
Table 3-1 Page 1 of 2SCS Engineers
11:59 AM, 4/26/2016
Hydro- Well Sand Wellstratigraphic Date Ground TOC Boring Boring Well Screen Pack Seal
Well Unit Installation Elevationa Elevationa Depth Diameter Diameter Interval Interval IntervalDesignation Screened Completed Eastingsa Northingsa (ft-msl) (ft-msl) (ft-bgs) (inches) (inches) (ft-bgs) (ft-bgs) (ft-bgs)
Monitoring WellsMW-1A Sand-Gravel 6-Sep-89 3999.9 4210.2 153.40 155.30 61.5 10 2 50.0 to 60.0 48.0 to 61.5 3.0 to 48.0MW-1B Silt-Clay 8-Sep-89 4001.1 4214.5 153.40 155.00 26.5 10 2 15.0 to 25.0 13.0 to 26.5 3.0 to 13.0MW-2 Silt-Clay 26-Jan-81 5123.7 4126.2 146.30 148.30 40.0 NA 2 NA NA NAMW-5A Silt-Clay 8-Sep-92 5490.7 2069.0 132.00 138.73 28.0 10 2 18.0 to 28.0 16.0 to 28.0 3.0 to 16.0MW-5B Sand-Gravel 9-Mar-92 5481.2 2073.1 132.80 138.88 44.7 10 2 42.0 to 45.0 40.0 to 45.0 3.0 to 40.0MW-9A Silt-Clay 21-Oct-93 6486.5 3663.2 128.10 128.42 24.5 8 2 14.3 to 23.8 27.0 to 40.0 2.0 to 11.0MW-9BR Sand-Gravel 24-Aug-94 5903.2 3760.8 124.76 127.40 36.5 10 2 28.2 to 33.7 27.0 to 37.5 2.0 to 26.0MW-10A Silt-Clay 28-Oct-93 3501.0 3805.0 150.75 153.21 28.3 8 2 17.3 to 26.8 14.0 to 28.3 2.2 to 14.0MW-10B Sand-Gravel 27-Oct-93 3492.5 3795.5 150.76 152.87 69.0 10 2 44.3 to 53.8 40.9 to 55.3 2.0 to 40.9MW-12A Silt-Clay 19-Jul-95 5650.8 1676.5 123.80 126.00 25.5 10 2 15.3 to 24.8 12.0 to 25.5 0.5 to 15.3MW-12B Sand-Gravel 19-Jul-95 5643.6 1676.5 124.00 126.54 49.9 10 2 34.3 to 43.8 31.0 to 45.0 0.5 to 31.0MW-14A Silt-Clay 16-Oct-96 4863.8 1652.6 118.80 121.87 21.0 10 2 10.7 to 20.2 7.8 to 21.0 2.2 to 7.8MW-14B Sand-Gravel 15-Oct-96 4854.1 1653.7 119.10 123.32 42.0 10 2 31.7 to 41.2 2.85 to 42.0 2.2 to 28.5MW-15A Silt-Clay 21-Oct-96 6385.5 2209.1 126.00 130.07 22.8 10 2 12.5 to 22.0 10.0 to 22.8 2.0 to 10.0MW-15B Sand-Gravel 21-Oct-96 6393.5 2214.7 126.00 129.73 44.0 10 2 33.2 to 42.7 30.2 to 44.0 2.0 to 30.2MW-16A Silt-Clay 23-Oct-96 7010.7 2675.6 126.30 128.89 23.5 10 2 13.5 to 23.0 11.0 to 23.5 1.5 to 11.0MW-16B Sand-Gravel 23-Oct-96 7004.3 2670.7 126.30 128.95 45.0 10 2 34.8 to 44.3 31.6 to 45.0 2.0 to 31.6MW-17A Silt-Clay 26-Sep-00 1221.4 1431.4 151.12 153.83 24.5 10 2 14.0 to 24.0 11.5 to 24.5 0.5 to 11.5MW-18A Silt-Clay 26-Sep-00 2612.9 2938.0 146.77 148.77 26.0 10 2 13.5 to 23.5 11.0 to 24.0 0.5 to 11.0MW-18B Sand-Gravel 26-Sep-00 2621.6 2931.1 146.58 148.57 62.0 10 2 47.0 to 53.0 45.0 to 53.0 0.5 to 45.0MW-19A Silt-Clay 27-Sep-00 2537.0 1437.0 149.05 151.27 30.0 10 2 18.0 to 28.0 18 .5 to 28.5 0.5 to 16.5MW-20A Silt-Clay 26-Sep-00 3776.2 2490.1 127.20 129.92 21.0 10 2 10.0 to 20.0 8.5 to 21.0 0.5 to 8.5MW-20B Sand-Gravel 26-Sep-00 3759.5 2491.2 127.10 129.72 40.0 10 2 29.0 to 34.0 26.5 to 95.3 0.5 to 26.5MW-21A Silt-Clay 26-Sep-00 4645.5 1945.3 116.18 120.02 13.0 10 2 8.0 to 13.0 7.0 to 23.0 0.5 to 7.0MW-21B Sand-Gravel 26-Sep-00 4631.3 1941.6 116.56 119.53 34.0 10 2 21.0 to 26.0 18.5 to 27.0 0.5 to 18.5MW-22A Silt-Clay 23-Sep-10 4105.3 1578.5 123.50 125.38 22.5 10 2 10.0 to 20.0 8.0 to 21.0 2.0 to 8.0MW-22B Sand-Gravel 23-Sep-10 4110.8 1584.6 123.50 125.43 38.0 10 2 27.0 to 37.0 25.0 to 38.0 2.0 to 25.0MW-23A Silt-Clay 18-Aug-10 3281.9 1515.9 129.00 131.79 28.0 10 2 16.0 to 26.0 14.0 to 28.0 2.0 to 14.0MW-23B Sand-Gravel 17-Aug-10 3290.0 1516.5 129.00 131.60 42.0 10 2 36.5 to 41.5 34.5 to 42.0 2.0 to 34.5MW-24A Silt-Clay 20-Aug-10 2140.0 984.2 147.50 149.93 26.0 10 2 15.0 to 25.0 13.0 to 26.0 2.0 to 13.0MW-25A Silt-Clay 22-Jul-15 4218.8 4114.0 153.0 155.62 26.6 6 2 15.0 to 25.0 13.0 to 26.6 2.0 to 13.0MW-25B Sand-Gravel 22-Jul-15 4208.3 4114.6 152.8 155.54 90.0 6 and 7 2 75.0 to 85.0 73.0 to 86.0 2.0 to 73.0PiezometersMW-3A Silt-Clay 23-Jun-93 4430.9 2493.9 138.20 140.81 35.0 8 2 24.0 to 34.0 21.0 to 35.0 2.2 to 21.0MW-3B Sand-Gravel 28-Jun-93 4415.6 2496.3 137.80 140.57 63.5 10 2 45.0 to 55.0 42.0 to 56.0 36.8 to 42.0MW-4A Silt-Clay 25-May-93 4798.0 2238.7 139.46 142.31 36.0 8 2 26.0 to 36.0 22.5 to 36.0 2.0 to 22.5MW-4B Sand-Gravel 10-Jun-93 4805.5 2239.4 139.24 141.81 72.0 10 2 52.0 to 62.0 49.0 to 63.0 47.0 to 49.0MW-6A Silt-Clay 24-May-93 6043.5 2437.7 127.00 128.95 22.5 8 2 11.5 to 21.5 8.5 to 22.5 2.0 to 8.5MW-6B Sand-Gravel 9-Jun-93 6054.4 2443.0 127.00 128.59 56.0 8 2 36.0 to 46.0 34.2 to 47.0 2.5 to 34.2P-01 Silt-Clay 21-Dec-92 5482.1 2038.3 123.20 125.93 19.0 8 2 8.0 to 18.0 5.9 to 19.0 2.0 to 5.9P-02 Silt-Clay 22-Dec-92 5498.5 1994.0 121.10 123.88 18.0 8 2 6.8 to 16.8 5.0 to 18.0 1.0 to 5.0P-03 Silt-Clay 23-Jun-93 5601.9 1754.2 120.90 123.63 19.5 8 2 9.0 to 19.0 7.3 to 19.5 2.0 to 9.3P-05A Silt-Clay 13-Oct-05 3612.4 2875.1 138.60 140.74 20.0 3.5 1 9.7 to 19.5 7.5 to 20.0 0.5 to 7.5P-06A Silt-Clay 13-Oct-05 3363.7 2566.2 129.30 131.58 20.0 3.5 1 9.7 to 19.5 7.5 to 20.0 0.5 to 7.5P-07A Silt-Clay 3-Feb-12 3804.2 2168.8 145.70 147.90 31.0 10 2 16.0 to 26.0 14.0 to 26.5 2.0 to 14.0
GT10-1 Silt-Clay 10-Sep-10 3444.2 3211.7 143.80 145.56 66.5 5.9 2 15.0 to 25.0 13.0 to 30.0 2.0 to 13.0/ 30.0 to 65.0
GT10-11 Silt-Clay 9-Sep-10 2518.1 1781.3 149.30 150.08 61.0 5.9 2 15.0 to 25.0 13.0 to 30.0 2.0 to 13.0 / 30.0 to 60.0
GT10-12 Silt-Clay 14-Sep-10 1736.5 1971.4 150.60 152.41 55.0 5.9 2 15.0 to 25.0 13.0 to 30.0 2.0 to 13.0/ 30.0 to 65.0
SA-BH-1 Silt-Clay 24-Aug-10 716.6 3175.5 152.80 155.21 23.0 10 2 12.0 to 22.0 10.0 to 23.0 2.0 to 10.0
SA-BH-3 Silt-Clay 24-Aug-10 813.1 1679.7 152.80 155.07 26.5 10 2 12.0 to 22.0 10.0 to 23.5 2.0 to 10/ 23.5 to 25.0
SA-BH-5 Silt-Clay 23-Aug-10 1773.0 586.9 148.60 151.01 28.5 10 2 18.0 to 28.0 15.5 to 28.5 2.0 to 15.5SA-BH-6 Silt-Clay 29-Sep-10 2895.0 597.7 123.80 125.93 25.0 10 2 14.0 to 24.0 12.0 to 25.0 2.0 to 12.0

Table 3-1Groundwater Monitoring Network Construction Information
Riverbend Landfill
Table 3-1 Page 2 of 2SCS Engineers
11:59 AM, 4/26/2016
Hydro- Well Sand Wellstratigraphic Date Ground TOC Boring Boring Well Screen Pack Seal
Well Unit Installation Elevationa Elevationa Depth Diameter Diameter Interval Interval IntervalDesignation Screened Completed Eastingsa Northingsa (ft-msl) (ft-msl) (ft-bgs) (inches) (inches) (ft-bgs) (ft-bgs) (ft-bgs)
Decommissioned Monitoring Wells and PiezometersMW-7Ab Silt-Clay 26-May-93 4359.8 3103.9 146.70 149.56 32.5 8 2 16.0 to 26.0 13.0 to 27.0 2.5 to 13.0
MW-7Bb Sand-Gravel 17-Jun-93 4369.0 3105.4 146.50 149.34 82.6 8 2 49.0 to 59.0 47.2 to 60.0 2.0 to 47.2
MW-8Ac Silt-Clay 20-Oct-93 6779.1 2982.3 124.10 126.01 24.5 8 2 13.3 to 22.8 10.2 to 23.5 3.0 to 10.2
MW-8Bc Sand-Gravel 25-Oct-93 6770.7 2979.2 124.30 126.81 49.5 8 2 29.3 to 38.8 27.0 to 40.0 2.0 to 27.0
MW-11Ad Silt-Clay 21-Oct-93 5340.9 3362.8 143.10 146.33 29.0 8 2 16.3 to 25.8 13.0 to 27.0 2.0 to 13.0
MW-11Bd Sand-Gravel 2-Nov-93 5330.6 3357.7 143.10 146.25 73.8 10 2 41.3 to 50.8 38.1 to 51.7 2.0 to 38.1
MW-13Ae Silt-Clay 17-Oct-96 4341.2 2093.9 146.60 149.66 44.0 10 2 33.7 to 43.2 31.5 to 44.0 2.0 to 31.5
MW-13Be Sand-Gravel 17-Oct-96 4348.6 2089.7 146.50 149.45 65.5 10 2 55.2 to 64.7 52.1 to 65.5 2.0 to 52.1
P-04Af Silt-Clay 28-Oct-93 4067.0 2530.1 139.00 141.15 32.5 8 2 19.3 to 28.8 15.9 to 29.8 2.0 to 15.9
P-04Bf Sand-Gravel 10-Nov-93 4078.5 2531.9 139.00 141.65 75.8 10 2 42.3 to 51.8 39.0 to 52.4 2.0 to 39.0NOTE: NA = not available; TOC = top of casing; ft-msl = feet mean sea level; ft-bgs = feet below ground surface.a All monitoring wells and piezometers were re-surveyed in July 2013.
b MW-7A and MW-7B were decommissioned in June 2009 to accommodate construction of landfill Module 8D.
c MW-8A and MW-8B were decommissioned between May 1996 when these wells were last sampled and March 1997 when the Modules 6 and 7 were constructed. Wells MW-8A and MW-8B were
decommissioned to accommodate construction of Modules 6 and 7. d
MW-11A and MW-11B were decommissioned in May 2012 to accommodate construction of landfill Module 8A. e MW-13A and MW-13B were decommissioned in May 2001 to accommodate construction of the leachate pond.
f P-04A and P-04B were decommissioned in June 2013 to accommodate construction of the mechanically stabilized earthen (MSE) berm.
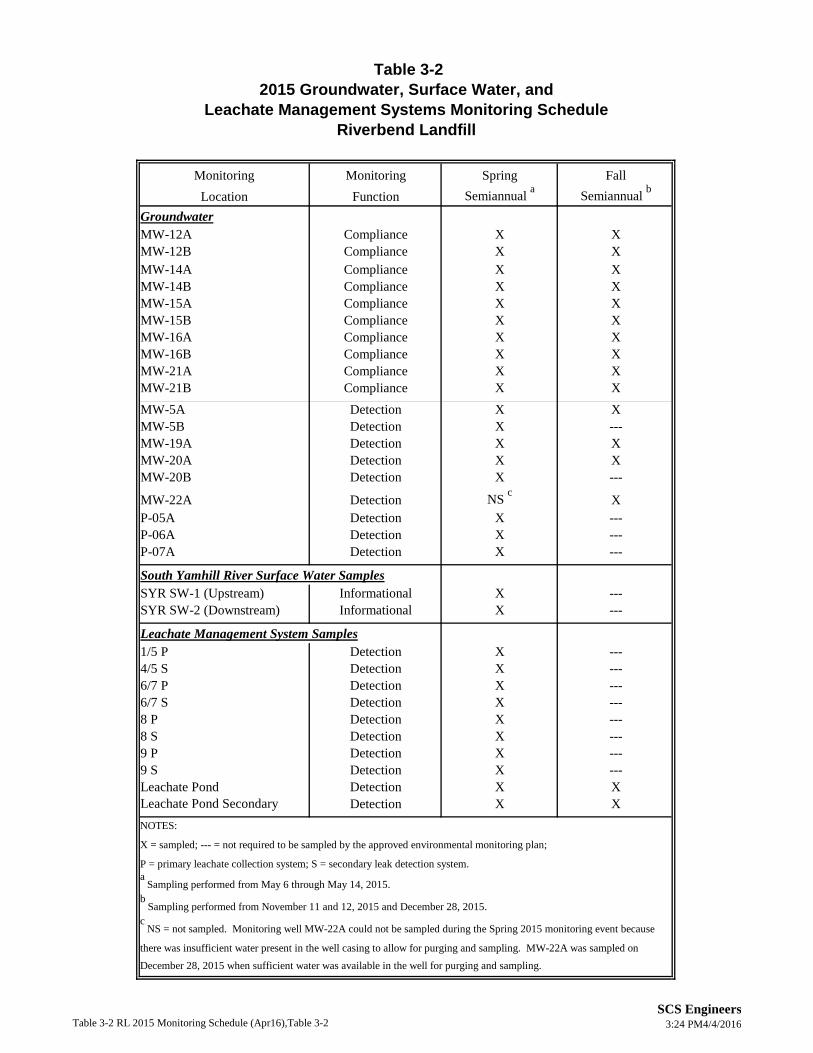
Table 3-22015 Groundwater, Surface Water, and
Leachate Management Systems Monitoring ScheduleRiverbend Landfill
Table 3-2 RL 2015 Monitoring Schedule (Apr16),Table 3-2SCS Engineers
3:24 PM4/4/2016
Monitoring Monitoring Spring FallLocation Function Semiannual a Semiannual b
GroundwaterMW-12A Compliance X XMW-12B Compliance X XMW-14A Compliance X XMW-14B Compliance X XMW-15A Compliance X XMW-15B Compliance X XMW-16A Compliance X XMW-16B Compliance X XMW-21A Compliance X XMW-21B Compliance X XMW-5A Detection X XMW-5B Detection X ---MW-19A Detection X XMW-20A Detection X XMW-20B Detection X ---
MW-22A Detection NS c XP-05A Detection X ---P-06A Detection X ---P-07A Detection X ---
South Yamhill River Surface Water SamplesSYR SW-1 (Upstream) Informational X ---SYR SW-2 (Downstream) Informational X ---
Leachate Management System Samples1/5 P Detection X ---4/5 S Detection X ---6/7 P Detection X ---6/7 S Detection X ---8 P Detection X ---8 S Detection X ---9 P Detection X ---9 S Detection X ---Leachate Pond Detection X XLeachate Pond Secondary Detection X XNOTES:
X = sampled; --- = not required to be sampled by the approved environmental monitoring plan;
P = primary leachate collection system; S = secondary leak detection system.a Sampling performed from May 6 through May 14, 2015.b Sampling performed from November 11 and 12, 2015 and December 28, 2015.c NS = not sampled. Monitoring well MW-22A could not be sampled during the Spring 2015 monitoring event because
there was insufficient water present in the well casing to allow for purging and sampling. MW-22A was sampled on December 28, 2015 when sufficient water was available in the well for purging and sampling.

Table 5-12015 Analytical Parameter Schedule
for Groundwater MonitoringRiverbend Landfill
Table 5-1 RL 2015 Groundwater Analytical Program (Apr16)SCS Engineers
4/4/20163:26 PM
Silt-Clay WBZd Sand-Gravel WBZe
Parameter (Shallow "A" Wells) (Deep "B" Wells)Group 1a: Field Indicators
Specific Conductance X XDissolved Oxygen X XpH X XOxidation-Reduction Potential X XTemperature X X
Group 1b: Laboratory IndicatorsTotal Organic Carbon X XTotal Dissolved Solids X X
Group 2a: AnionsAmmonia X XBicarbonate X XChloride X XNitrate+Nitrite X XSulfate X X
Group 2a: CationsCalcium X XIron X XMagnesium X XManganese X XPotassium X XSodium X X
Group 3: Volatile Organic Compounds (VOCs) f
VOCs Xg Xg
NOTE: WBZ = water-bearing zone; X = parameter analyzed as part of the routine semiannual or annual monitoring event; a
b
c
d
e
f
g
Annual and Semiannual Monitoringa, b, c
Semiannual monitoring events were performed in the second quarter (Spring) from May 6 through 14, 2015 and in fourth quarter (Fall) on November 11 and 12, and December 28, 2015. The annual monitoring event was performed in the Spring event except for MW-22A which was sampled on December 28, 2015 because there was insufficient water present in the well casing to allow for purging and sampling during the scheduled Spring and Fall events.
Field duplicate samples were collected once per day or once every 10 samples whichever is most frequent.
Field blank samples were collected once per day or once every 10 samples whichever is most frequent.
Includes the following semiannual (1) compliance monitoring wells MW-12A, MW-14A, MW-15A, MW-16A, and MW-21A and (2) detection monitoring wells MW-19A and MW-20A. Piezometers P-05A, P-06A, and P-07A were sampled annually for indicator parameters, anions, and cations in the second quarter (Spring) event. Detection well MW-22A was sampled annually in the fourth quarter (Fall) event. Includes the following semiannual compliance monitoring wells: MW-12B, MW-14B, MW-15B, MW-16B, and MW-21B. Detection monitoring well MW-20B was sampled annually in the second quarter (Spring) event.
All VOCs include a library search to identify any unknown compounds.Detection monitoring well MW-5A was sampled for VOCs semiannually in the second (Spring) and fourth (Fall) quarters and MW-5B was sampled for VOCs annually in the second quarter (Spring) 2015. Additionally, MW-5A was sampled for select anions and cations during the Spring event for informational purposes.

Table 5-22015 Analytical Parameter Schedule for the
South Yamhill River Surface Water MonitoringRiverbend Landfill
Table 5-2 RL 2015 SYR Surface Water Analytical Program (Apr16)SCS Engineers3/24/20161:13 PM
SYR SW-1 SYR SW-2Parameter (Upstream) (Downstream)
Group 1a: Field Indicators bX X
Group 1b: Laboratory and Supplemental IndicatorsTotal Alkalinity X XTotal Hardness (as CaCO3) X XLaboratory pH X XSpecific Conductance X XChemical Oxygen Demand X XBiological Oxygen Demand X XFecal Coliform X XE. coli X XTotal Kjeldahl Nitrogen X XTotal Organic Halogens X XTotal Phosphorus X XOrthophosphate X XTotal Organic Carbon X XTotal Dissolved Solids X XTotal Suspended Solids X X
Group 2a: AnionsAmmonia X XBicarbonate X XCarbonate X XChloride X XNitrate+Nitrite X XSilicon X XSulfate X X
Group 2a: CationsCalcium X XIron X XMagnesium X XManganese X XPotassium X XSodium X X
Group 3: Volatile Organic Compounds (VOCs) c
VOCs X XNOTE: SYR = South Yamhill River; X = parameter analyzed. a
b
cAll VOCs include a library search to identify any unknown compounds.
Annual Monitoringa
Annual monitoring was performed in the second quarter (Spring) on May 11, 2015.Field indicators include: pH, temperature, specific conductance, dissolved oxygen, and oxidation-reduction potential.

Table 5-32015 Analytical Parameter Schedule for
Leachate Management Systems MonitoringRiverbend Landfill
Table 5-3 RL 2015 LMS Analytical Program (Apr16)SCS Engineers3/24/20161:25 PM
Semiannual Annual LCRS Parameter Leachate Pond and LPS and Secondary Sumpsb
Group 1a: Field Indicators c X XGroup 1b: Laboratory Indicators
Total Alkalinity X XTotal Hardness ( as CaCO3) X XLaboratory pH X XSpecific Conductance X XChemical Oxygen Demand X XTotal Kjeldahl Nitrogen X ---Total Organic Carbon X XTotal Dissolved Solids X XTotal Suspended Solids X X
Group 2a: AnionsAmmonia X XBicarbonate X XCarbonate X XChloride X XNitrate+Nitrite X XSilicon X XSulfate X X
Group 2a: CationsCalcium X XIron X XMagnesium X XManganese X XPotassium X XSodium X X
Group 2b: Trace Metals (Total) d X X
Group 3: Volatile Organic Compounds (VOCs) e
VOCs X XNOTE: LPS = leachate pond secondary; LCRS = leachate collection and removal system; X = parameter analyzed; --- parameter not required. a
b
c
d
e
Group 2b trace metals include: antimony, arsenic, barium, beryllium, cadmium, chromium, cobalt, copper, lead, nickel, selenium, silver, thallium, vanadium, and zinc.
All VOCs include a library search to identify any unknown compounds.
Annual and Semiannual Monitoringa
Semiannual monitoring events were performed in the second quarter (Spring) on May 11, 2015 and in fourth quarter (Fall) on November 11, 2015.
Field indicators include: pH, temperature, specific conductance, dissolved oxygen, and oxidation-reduction potential.
Sump monitoring locations include: 1/5 P, 4/5 S, 6/7 P, 6/7 S, 8 P, and 8S.

Table 5-4Cation-Anion Balances for
2015 Laboratory Analytical DataRiverbend Landfill
Table 5-4 RL 2015 Ion Balances (Apr16) Table 5-4SCS Engineers
4/4/2016 3:28 PM
Spring FallSample Event Event
Location (%) (%)GroundwaterMW-12A 1.9 3.5MW-12B 0.96 -1.5MW-14A 0.94 1.1MW-14B -3.7 1.8MW-15A 0.05 5.3MW-15B 1.3 3.2MW-16A 7.5 3.7MW-16B 1.2 -0.63MW-19A -1.6 2.7MW-20A -4.1 3.1MW-20B 0.98 ---MW-21A -0.21 2.7MW-21B 3.1 1.6
MW-22A NS a 0.79
Surface Water SamplesSYR SW-1 (Upstream) 1.3 ---SYR SW-2 (Downstream) 0.64 ---
Leachate Management System Liquid Samples1/5 P 10 ---4/5 S 1.5 ---6/7 P 10 ---6/7 S 2.3 ---8 P -0.013 ---8 S 3.1 ---9 P 4.8 ---9 S 3.7 ---Leachate Pond 4.7 10Leachate Pond Secondary 8.9 7.0NOTE: --- = not required to be sampled during monitoring event.a NS = not sampled. Monitoring well MW-22A could not be sampled during the Spring 2015 monitoring event because there was insufficient water available in the well casing to allowfor purging and sampling. MW-22A was sampled on December 28, 2015 when sufficient water was available in the well casing for purging and sampling.Cation/anion balance data included in laboratory reports (see attached compact disc).

Table 6-1Comparison of 2015 Groundwater Elevations and
Vertical Gradients in Monitoring Well Pairs(Shallow and Deep Water Bearing Zones)
Riverbend Landfill
Table 6-1 Page 1 of 2SCS Engineers
4/1/20163:45 PM
GroundwaterSample Elevation Gradient
Location Date (feet-msl) (feet)MW-1B (Shallow) 15-May-15 147.20 19.40MW-1A (Deep) 15-May-15 127.80 (Downward)MW-1B (Shallow) 10-Nov-15 146.90 24.50MW-1A (Deep) 10-Nov-15 122.40 (Downward)MW-3A (Shallow) 15-May-15 122.40 1.35MW-3B (Deep) 15-May-15 121.05 (Downward)MW-3A (Shallow) 10-Nov-15 122.10 5.03MW-3B (Deep) 10-Nov-15 117.07 (Downward)MW-4A (Shallow) 15-May-15 115.36 1.49MW-4B (Deep) 15-May-15 113.87 (Downward)MW-4A (Shallow) 10-Nov-15 113.96 3.65MW-4B (Deep) 10-Nov-15 110.31 (Downward)MW-5A (Shallow) 15-May-15 117.50 8.01MW-5B (Deep) 15-May-15 109.49 (Downward)MW-5A (Shallow) 10-Nov-15 119.56 13.66MW-5B (Deep) 10-Nov-15 105.90 (Downward)MW-6A (Shallow) 15-May-15 119.75 6.55MW-6B (Deep) 15-May-15 113.20 (Downward)MW-6A (Shallow) 10-Nov-15 122.07 14.13MW-6B (Deep) 10-Nov-15 107.94 (Downward)MW-9A (Shallow) 15-May-15 119.12 -5.44MW-9BR (Deep) 15-May-15 124.56 (Upward)MW-9A (Shallow) 10-Nov-15 113.73 -7.25MW-9BR (Deep) 10-Nov-15 120.98 (Upward)MW-10A (Shallow) 15-May-15 145.22 13.56MW-10B (Deep) 15-May-15 131.66 (Downward)MW-10A (Shallow) 10-Nov-15 134.71 8.40MW-10B (Deep) 10-Nov-15 126.31 (Downward)MW-12A (Shallow) 15-May-15 111.10 4.48MW-12B (Deep) 15-May-15 106.62 (Downward)MW-12A (Shallow) 10-Nov-15 109.79 6.56MW-12B (Deep) 10-Nov-15 103.23 (Downward)MW-14A (Shallow) 15-May-15 104.55 -0.22MW-14B (Deep) 15-May-15 104.77 (Upward)MW-14A (Shallow) 10-Nov-15 100.27 -1.72MW-14B (Deep) 10-Nov-15 101.99 (Upward)MW-15A (Shallow) 15-May-15 120.18 8.46MW-15B (Deep) 15-May-15 111.72 (Downward)MW-15A (Shallow) 10-Nov-15 107.80 1.97MW-15B (Deep) 10-Nov-15 105.83 (Downward)MW-16A (Shallow) 15-May-15 112.75 0.32MW-16B (Deep) 15-May-15 112.43 (Downward)MW-16A (Shallow) 10-Nov-15 107.04 -0.54MW-16B (Deep) 10-Nov-15 107.58 (Upward)

Table 6-1Comparison of 2015 Groundwater Elevations and
Vertical Gradients in Monitoring Well Pairs(Shallow and Deep Water Bearing Zones)
Riverbend Landfill
Table 6-1 Page 2 of 2SCS Engineers
4/1/20163:45 PM
GroundwaterSample Elevation Gradient
Location Date (feet-msl) (feet)MW-18A (Shallow) 15-May-15 134.97 3.27MW-18B (Deep) 15-May-15 131.70 (Downward)MW-18A (Shallow) 10-Nov-15 132.72 6.77MW-18B (Deep) 10-Nov-15 125.95 (Downward)MW-20A (Shallow) 15-May-15 125.08 0.54MW-20B (Deep) 15-May-15 124.54 (Downward)MW-20A (Shallow) 10-Nov-15 121.32 1.25MW-20B (Deep) 10-Nov-15 120.07 (Downward)MW-21A (Shallow) 15-May-15 109.88 0.41MW-21B (Deep) 15-May-15 109.47 (Downward)MW-21A (Shallow) 10-Nov-15 106.17 0.07MW-21B (Deep) 10-Nov-15 106.10 (Downward)MW-22A (Shallow) 15-May-15 105.09 0.58MW-22B (Deep) 15-May-15 104.51 (Downward)MW-22A (Shallow) 10-Nov-15 103.18 1.20MW-22B (Deep) 10-Nov-15 101.98 (Downward)MW-23A (Shallow) 15-May-15 114.37 10.58MW-23B (Deep) 15-May-15 103.79 (Downward)MW-23A (Shallow) 10-Nov-15 110.74 9.44MW-23B (Deep) 10-Nov-15 101.30 (Downward)MW-25A (Shallow) 10-Nov-15 147.02 25.69MW-25B (Deep) 10-Nov-15 121.33 (Downward) NOTE: feet-msl = feet mean sea level.

Table 6-2Comparison of Statistical and Prescriptive Concentration Limits
with 2014 Semiannual Compliance Groundwater Analytical ResultsRiverbend Landfill
Table 6-2 RL 2015 Comparison to Concentration Limits (Apr16)SCS Engineers3/29/20163:37 PM
PSCL AL SSLsTotal Total
Vinyl Bicarbonate Magnesium Potassium Sodium Dissolved OrganicChloridea Alkalinity Chloride Dissolved Dissolved Dissolved Sulfate Solids Carbon
(mg/L) VOCsb (mg/L) (mg/L) (mg/L) (mg/L) (mg/L) (mg/L) (mg/L) (mg/L)
MW-12A Concentration Limits 0.002 (see Note 1) 81.3 63.4 11.5 1.20 21.8 --- 240 3.2MW-12A May 2015 Results 0.001 U NDs 70 35 8.8 0.68 22 --- 200 1.4MW-12A November 2015 Results 0.001 U NDs 68 32 8.8 0.83 22 --- 170 1.9
MW-12B Concentration Limits 0.002 (see Note 1) 291 --- 38.8 1.27 67.8 6.8 1,020 1.9MW-12B May 2015 Results 0.001 U NDs 230 --- 25 0.75 41 1.1 480 1.4DUP May 2015 Results 0.001 U NDs 240 --- 24 0.71 39 1.1 490 1.3MW-12B November 2015 Results 0.001 U NDs 270 --- 24 0.71 47 1.0 U 520 1.3MW-14A Concentration Limits 0.002 (see Note 1) 148 33.4 16.5 0.85 15.6 --- 282 3.1MW-14A May 2015 Results 0.001 U NDs 140 17 16 0.50 U 13 --- 220 1.0 UMW-14A December 2015 Results 0.001 U NDs 100 6.7 11 0.50 U 13 --- 180 1.0 UMW-14B Concentration Limits 0.002 (see Note 1) 230 --- 16.1 0.85 43.0 16.8 329 3.2MW-14B May 2015 Results 0.001 U NDs 190 --- 16 0.60 22 2.1 270 2.0MW-14B November 2015 Results 0.001 U NDs 230 --- 14 0.61 45 4.0 310 1.4MW-15A Concentration Limits 0.002 (see Note 1) 135 19.5 12.7 1.00 29.5 --- 349 2.2MW-15A May 2015 Results 0.001 U NDs 31 6.7 3.1 0.50 U 23 --- 150 1.3MW-15A December 2015 Results 0.001 U NDs 34 3.4 2.2 0.50 U 23 --- 170 1.5
MW-15B Concentration Limits 0.002 (see Note 1) 372 --- 36.3 0.68 42.2 10.7 543 2.1MW-15B May 2015 Results 0.001 U NDs 320 --- 30 0.50 U 39 2.2 390 1.0 UMW-15B November 2015 Results 0.001 U NDs 330 --- 31 0.50 U 39 2.1 400 1.0 UDUP November 2015 Results 0.001 U NDs 350 --- 29 0.50 U 39 2.1 400 1.0 UMW-16A Concentration Limits 0.002 (see Note 1) 460 14.8 32.0 0.88 59.6 --- 505 5.2MW-16A May 2015 Results 0.001 U NDs 100 8.7 8.0 0.50 U 37 --- 170 1.6MW-16A December 2015 Results 0.001 U NDs 140 9.4 12 0.50 U 37 --- 220 1.9DUP December 2015 Results 0.001 U NDs 150 9.5 12 0.50 U 37 --- 220 2.0MW-16B Concentration Limits 0.002 (see Note 1) 388 --- 44.2 0.93 81.6 8.6 771 2.8MW-16B May 2015 Results 0.001 U NDs 370 --- 34 0.50 U 71 3.6 550 1.4MW-16B November 2015 Results 0.001 U NDs 370 --- 37 0.61 74 4.1 590 1.4
MW-21A Concentration Limits 0.002 (see Note 1) 211 16.0 19.9 0.91 60.9 --- 446 4.7MW-21A May 2015 Results 0.001 U NDs 140 6.7 13 0.50 U 18 --- 200 1.2MW-21A November 2015 Results 0.001 U NDs 150 8.3 14 0.50 U 19 --- 220 1.5
MW-21B Concentration Limits 0.002 (see Note 1) 325 --- 26.4 1.40 46.6 21.7 372 5.9MW-21B May 2015 Results 0.001 U NDs 260 --- 22 0.56 36 2.7 300 2.6DUP May 2015 Results 0.001 U NDs 250 --- 22 0.50 U 37 2.8 310 2.6MW-21B November 2015 Results 0.001 U NDs 270 --- 20 0.66 37 3.2 320 3.2NOTE:mg/L = milligrams per liter; --- = not applicable; Dup = field duplicate sample.; --- not applicable; U = not detected at or above the practical quantitation limit (PQL); NDs = no detections.Bold denotes a concentration above a concentration limit.Note 1: Detection of a volatile organic compound (VOC) above the laboratory derived PQL.PSCL: Permit-Specific Concentration Limit; a concentration above of a single PSCL not previously reported and explained to the DEQ will trigger verification resampling.
Verification of a results above a PSCL would require follow-up actions, consistent with Section 11.5.3 of this Environmental Monitoring Plan (EMP). AL: Action Limit; a concentration above a single AL not previously reported and explained to the DEQ will trigger verification resampling. Verification of a results above an AL
would require follow-up actions, consistent with Section 11.5.3 of this EMP.SSL: Site-Specific Limit; concentrations above three or more SSLs in a single compliance monitoring well during a monitoring event not previously reported and explained to the
DEQ will trigger verification resampling. Verification of three or more concentrations above SSL would require follow-up actions consistent with Section 11.5.3 of this EMP. a
PSCL for vinyl chloride in all compliance wells established at the numerical groundwater quality reference level (NGWQRL) of 0.002 mg/L (specified in Table 2 of the Oregon Administrative Rule [OAR] 340-40).
b VOCs by U.S. Environmental Protection Agency (EPA) Method 8260B and 8011 except for vinyl chloride which was defined as a PSCL.
MonitoringWell

Table 6-3Statistical Trend Analysis Results Based on 2015
and Historical Groundwater Analytical Results Riverbend Landfill
Table 6-3 RL 2015 Summary of Significant Trends (Apr16)Table 6-3 SCS Engineers12:32 PM, 4/4/2016
Ammonia Total TotalSampling Bicarbonate as Dissolved Dissolved Dissolved Dissolved Nirate+ Dissolved Dissolved OrganicLocation Alkalinity Nitrogen Calcium Chloride Iron Magnesium Manganese Nitrite Sodium Sulfate Solids Carbon
Compliance WellsMW-12A Increasing --- Increasing --- --- Increasing --- Increasing Increasing --- --- ---
MW-12B --- Increasing Decreasing Decreasing Increasing Decreasing Increasing --- Decreasing --- Decreasing ---
MW-14A Increasing --- --- Increasing --- --- --- --- --- Decreasing --- ---
MW-14B Increasing Decreasing Increasing Increasing Decreasing Increasing --- --- Increasing --- Increasing ---
MW-15A Decreasing --- Decreasing Decreasing --- Decreasing --- --- --- --- --- ---
MW-15B --- --- Decreasing Decreasing --- Decreasing --- --- --- Decreasing Decreasing ---
MW-16A Decreasing --- Decreasing --- --- Decreasing Decreasing --- Decreasing --- Decreasing ---
MW-16B --- --- Decreasing --- --- --- --- --- --- Decreasing Decreasing ---
MW-21A --- --- --- Decreasing --- --- --- --- Decreasing Decreasing Decreasing ---
MW-21B --- --- --- --- --- --- --- --- Increasing Decreasing --- ---
Detection Wells and Piezometers
MW-19A Decreasing --- Increasing Increasing Decreasing Increasing Decreasing --- Increasing --- Increasing ---
MW-20A --- Increasing Increasing Increasing Increasing Increasing Increasing --- Increasing Decreasing Increasing Increasing
MW-20B --- Increasing --- --- --- --- --- --- --- --- --- ---
MW-22A --- --- --- Decreasing --- --- --- --- --- --- --- ---
P-05A --- --- Increasing Increasing --- Increasing --- --- Increasing Decreasing Increasing ---
P-06A --- --- --- --- --- --- --- --- --- --- --- ---
P-07A --- --- --- --- --- --- Decreasing --- --- --- --- ---NOTE:--- = no statistical trend identified by DUMPStat. Indicates new trend identified in 2015 compared to 2014 and historical data.

Table 6-4Volatile Organic Compounds Detected in Groundwater Samples Collected from MW-5A (µg/L)
Riverbend Landfill
Table 6-4 RL MW-5A Historical VOC Detections (Apr16)Table 6-4 Page 1 of 2SCS Engineers2:45 PM3/29/2016
1,1-Di- Tetra- Tri- 1,4-Di- cis-1,2- Dichloro- trans-1,2-Sample Sample Chloro- Chloro- chloro- Methylene chloro- chloro- Vinyl Total chloro- Dichloro- difluoro- Dichloro-
Location Date Benzene benzene ethane ethane Chloride ethene Toluene ethene chloride Xylenes benzene ethene methane etheneMW-5A 17-Mar-94 3.6 0.5 U 5.4 51 1.0 U 14 0.5 U 40 28 0.8 0.5 U 200 2.6 1.6 0.5 UMW-5A (Dup) 17-Mar-94 3.8 0.5 U 5.6 47 1.0 U 14 0.5 U 38 28 0.8 0.5 U 190 2.6 1.9 0.5 UMW-5A 15-Jun-94 3.0 0.5 U 5.2 63 1.0 U 8.2 0.5 U 50 16 0.5 U 0.5 U 230 0.6 1.2 0.5 UMW-5A (Dup) 15-Jun-94 3.1 0.5 U 5.4 43 1.0 U 9.6 0.5 U 35 18 0.5 0.5 U 160 0.7 1.3 0.5 UMW-5A 22-Sep-94 2.2 0.5 U 6.3 38 D 1.0 U 2.8 0.5 U 26 13 0.5 U 0.5 U 120 D 0.6 1.5 0.5 UMW-5A (Dup) 22-Sep-94 2.1 0.5 U 6.4 39 D 1.0 U 2.5 0.5 U 25 13 0.5 U 0.5 U 130 D 0.7 0.9 0.5 UMW-5A 9-Dec-94 2.2 0.5 U 2.1 35 1.0 U 2.4 0.5 U 13 13 0.5 0.5 U 170 D 0.5 U 0.9 0.5 UMW-5A (Dup) 9-Dec-94 2.3 0.5 U 2.3 34 1.0 U 2.3 0.5 U 13 13 0.6 0.5 U 170 D 0.5 U 0.9 0.5 UMW-5A 28-Mar-95 1.9 0.5 U 2.0 31 1.0 U 1.0 0.5 U 10 9.8 0.5 U 0.5 U 150 D 0.5 U 0.9 0.5 UMW-5A (Dup) 28-Mar-95 1.8 0.5 U 2.2 31 1.0 U 1.2 0.5 U 11 9.5 0.5 U 0.5 U 150 D 0.5 U 1.3 0.5 UMW-5A 13-Sep-95 2.2 0.5 U 4.0 36 1.0 U 0.5 0.5 U 9.9 12 0.5 U 0.5 U 210 D 0.5 U 1.1 0.5 UMW-5A 24-May-96 1.9 1.0 U 2.3 26 1.0 U 1.0 U 1.0 U 4.2 10 1.0 U 1.0 U 230 E 1.0 U 2.5 0.5 UMW-5A (Dup) 24-May-96 1.9 1.0 U 1.7 24 1.0 U 1.2 1.0 U 10 9.3 1.0 U 1.0 U 200 E 1.0 U 3.7 0.5 UMW-5A 18-Dec-96 3.1 U 2.5 U 5.9 U 20 16 U 10 U 2.5 U 5.0 5.7 10 U 4.3 U 100 6.5 U 4.5 U 0.5 UMW-5A (Dup) 18-Dec-96 3.1 U 2.5 U 5.9 U 19 16 U 10 U 2.5 U 5.1 6.4 10 U 4.3 U 110 6.5 U 4.5 U 0.5 UMW-5A 2-Apr-97 2.4 1.0 U 1.0 U 18 3.3 1.0 U 1.0 U 3.8 10.0 1.0 U 4.9 140 1.0 U 1.0 U 0.5 UMW-5A (Dup) 2-Apr-97 1.7 1.0 U 1.0 U 19 1.0 U 1.0 U 1.0 U 3.1 8.1 1.0 U 3.8 140 1.0 U 1.0 U 0.5 UMW-5A 21-May-97 3.1 U 2.5 U 5.9 U 15 4.1 U 1.2 U 2.5 U 4.0 6.7 10 U 4.3 U 130 6.5 U 4.5 U 0.5 UMW-5A 10-Sep-97 1.0 U 1.0 U 1.0 U 1.0 U 2.9 1.0 U 1.0 U 1.9 5.1 1.0 U 1.0 U 110 1.0 U 1.0 U 0.5 UMW-5A 22-Dec-97 1.2 1.0 U 1.0 U 10 1.0 U 1.0 U 1.0 U 2.7 3.5 1.0 U 1.8 77 1.0 U 1.0 U 0.5 UMW-5A (Dup) 12-Jun-98 1.1 1.0 U 1.0 U 11 1.0 U 1.0 1.0 U 4.5 2.2 1.0 U 2.3 68 1.0 U 1.0 U 0.5 UMW-5A 12-Jun-98 1.2 1.0 U 1.0 U 10 1.0 U 1.0 U 1.0 U 4.1 2.4 1.0 U 2.7 69 1.0 U 1.0 U 0.5 UMW-5A 8-Jan-99 1.1 0.5 J 0.8 8.3 1.0 U 1.1 0.5 U 1.6 2.1 NT 2.4 38 0.5 U 0.5 0.5 UMW-5A 18-Jun-99 2.1 0.98 1.0 7.5 1.1 B 0.5 U 0.5 U 0.5 U 3.6 0.5 U 7.8 49 0.5 U 0.5 U 0.5 UMW-5A 16-Dec-99 1.7 0.77 0.56 5.1 0.5 U 0.5 U 0.5 U 0.5 U 2.6 0.5 U 5.3 38 0.5 U 0.5 U 0.5 UMW-5A (Dup) 16-Dec-99 1.8 0.8 0.66 5.4 0.5 U 0.5 U 0.5 U 0.5 U 2.8 0.5 U 5.8 40 E 0.5 U 0.5 U 0.5 UMW-5A 26-May-00 1.6 0.68 0.5 U 6.3 0.5 U 0.92 0.5 U 2.4 1.2 0.5 U 5.4 33 0.5 U 0.5 U 0.5 UMW-5A 9-Nov-00 1.2 0.93 0.5 U 3.6 0.5 U 0.5 U 0.5 U 0.5 U 1.4 0.5 U 7.6 21 0.5 U 0.5 U 0.5 UMW-5A 25-Apr-01 1.2 0.59 0.5 U 3.3 0.5 U 0.73 0.5 U 1.1 0.96 0.5 U 5.7 20 0.5 U 0.5 U 0.5 UMW-5A 7-Nov-01 1.8 0.79 0.55 3.6 0.5 U 0.5 U 0.82 0.59 0.97 0.5 U 5.2 25 0.5 U 0.5 U 0.5 UMW-5A 15-Apr-02 1.7 0.96 0.5 U 2.8 0.5 U 0.57 0.5 U 0.66 0.62 0.5 U 7.4 18 0.5 U 0.5 U 0.5 UMW-5A 10-Oct-02 1.4 0.5 U 0.55 2.7 1.0 U 0.5 U 0.5 U 0.5 U 0.87 1.0 U 5.6 17 0.5 U 0.5 U 0.5 UMW-5A 14-May-03 1.5 0.95 0.5 U 1.7 1.0 U 0.5 U 0.5 U 0.5 U 0.94 1.0 U 8.0 11 0.5 U 0.5 U 0.5 UMW-5A 20-Nov-03 1.7 1.2 0.5 U 2.1 1.0 U 0.5 U 0.5 U 0.5 U 1.4 1.0 U 7.7 13 0.5 U 0.5 U 0.5 U
1,2-Di-chloro-benzene

Table 6-4Volatile Organic Compounds Detected in Groundwater Samples Collected from MW-5A (µg/L)
Riverbend Landfill
Table 6-4 RL MW-5A Historical VOC Detections (Apr16)Table 6-4 Page 2 of 2SCS Engineers2:45 PM3/29/2016
1,1-Di- Tetra- Tri- 1,4-Di- cis-1,2- Dichloro- trans-1,2-Sample Sample Chloro- Chloro- chloro- Methylene chloro- chloro- Vinyl Total chloro- Dichloro- difluoro- Dichloro-
Location Date Benzene benzene ethane ethane Chloride ethene Toluene ethene chloride Xylenes benzene ethene methane ethene
1,2-Di-chloro-benzene
MW-5A 21-Apr-04 1.2 1.0 0.5 U 1.6 1.0 U 0.5 U 0.05 U 0.5 U 0.77 1.0 U 0.5 U 10 0.5 U 0.5 U 0.5 UMW-5A 11-Nov-04 2.5 2.0 0.5 U 1.0 1.0 U 0.5 U 0.5 U 0.5 U 1.2 1.0 U 12 7.1 0.5 U 0.5 U 0.5 UMW-5A 27-May-05 1.9 3.1 0.5 U 0.94 0.5 U 0.5 U 0.5 U 0.5 U 0.81 1.0 U 18 6.5 0.5 U 0.5 U 0.85MW-5A 26-Oct-05 1.2 1.3 0.5 U 0.85 0.5 U 0.5 U 0.5 U 0.5 U 0.5 U 1.0 U 6.1 6.4 0.5 U 0.5 U 0.5 UMW-5A 12-May-06 1.0 1.6 0.5 U 0.6 0.5 U 0.5 U 0.5 U 0.5 U 0.5 U 1.0 U 7.9 3.7 0.5 U 0.5 U 0.5 UMW-5A 9-Oct-06 0.93 1.4 0.5 U 0.6 0.5 U 0.5 U 0.5 U 0.5 U 0.5 U 1.0 U 6.0 4.1 0.5 U 0.5 U 0.5 UMW-5A 8-May-07 1.3 2.9 2.0 U 1.0 U 5.0 U 1.0 U 1.0 U 1.0 U 1.0 U 2.0 U 9.2 3.5 2.0 U 1.0 U 1.0 UMW-5A 7-Nov-07 1.3 2.7 2.0 U 1.0 U 5.0 U 1.0 U 1.0 U 1.0 U 1.0 U 2.0 U 7.1 4.0 2.0 U 1.0 U 1.0 UMW-5A 22-May-08 1.2 3.0 2.0 U 1.0 U 5.0 U 1.0 U 1.0 U 1.0 U 1.0 U 2.0 U 7.3 3.9 2.0 U 1.0 U 1.0 UMW-5A 12-Nov-08 2.5 6.8 2.0 U 1.0 U 5.0 U 1.0 U 1.0 U 1.0 U 1.0 U 2.0 U 11 4.7 2.0 U 1.0 U 1.0 UMW-5A 6-May-09 2.7 8.4 2.0 U 1.0 U 5.0 U 1.0 U 1.0 U 1.0 U 1.0 U 2.0 U 13 3.6 2.0 U 1.0 U 1.0 UMW-5A 18-Nov-09 1.5 4.8 2.0 U 1.0 U 5.0 U 1.0 U 1.0 U 1.0 U 1.0 U 2.0 U 10 3.2 2.0 U 1.0 U 1.0 UMW-5A 21-Apr-10 1.0 4.5 2.0 U 1.0 U 5.0 U 1.0 U 1.0 U 1.0 U 1.0 U 2.0 U 8.2 2.3 2.0 U 1.0 U 1.0 UMW-5A 6-Oct-10 1.1 3.3 2.0 U 1.0 U 5.0 U 1.0 U 1.0 U 1.0 U 1.0 U 2.0 U 6.0 2.5 2.0 U 1.0 U 1.0 UMW-5A 15-Apr-11 1.0 U 3.1 2.0 U 1.0 U 5.0 U 1.0 U 1.0 U 1.0 U 1.0 U 2.0 U 6.6 2.2 2.0 U 1.0 U 1.0 UMW-5A 2-Nov-11 1.0 U 2.8 2.0 U 1.0 U 5.0 U 1.0 U 1.0 U 1.0 U 1.0 U 2.0 U 5.3 2.4 2.0 U 1.0 U 1.0 UMW-5A 1-May-12 1.0 U 2.5 2.0 U 1.0 U 5.0 U 1.0 U 1.0 U 1.0 U 1.0 U 2.0 U 5.3 1.8 2.0 U 1.0 U 1.0 UMW-5A 15-Nov-12 1.0 U 2.4 2.0 U 1.0 U 5.0 U 1.0 U 1.0 U 1.0 U 1.0 U 2.0 U 5.1 1.5 2.0 U 1.0 U 1.0 UMW-5A (Dup) 15-Nov-12 1.0 U 2.4 2.0 U 1.0 U 5.0 U 1.0 U 1.0 U 1.0 U 1.0 U 2.0 U 5.2 1.5 2.0 U 1.0 U 1.0 UMW-5A 10-Apr-13 1.0 U 2.8 2.0 U 1.0 U 5.0 U 1.0 U 1.0 U 1.0 U 1.0 U 1.0 U 6.4 1.7 2.0 U 1.0 U 1.0 UMW-5A 20-Nov-13 1.0 U 1.8 2.0 U 1.0 U 5.0 U 1.0 U 1.0 U 1.0 U 1.0 U 1.0 U 4.5 1.3 2.0 U 1.0 U 1.0 UMW-5A 30-Apr-14 1.0 U 1.6 2.0 U 1.0 U 5.0 U 1.0 U 1.0 U 1.0 U 1.0 U 2.0 U 3.5 1.1 2.0 U 1.0 U 1.0 UMW-5A 18-Nov-14 1.0 U 2.0 2.0 U 1.0 U 5.0 U 1.0 U 1.0 U 1.0 U 1.0 U 2.0 U 3.6 1.2 2.0 U 1.0 U 1.0 UMW-5A 6-May-15 1.0 U 2.1 2.0 U 1.0 U 5.0 U 1.0 U 1.0 U 1.0 U 1.0 U 2.0 U 4.8 1.3 2.0 U 1.0 U 1.0 UMW-5A 11-Nov-15 1.0 U 3.2 2.0 U 1.0 U 5.0 U 1.0 U 1.0 U 1.0 U 1.0 U 2.0 U 8.5 1.5 2.0 U 1.0 U 1.0 UNOTE: D = compound identified in analysis at secondary dilution; E = estimated value; J = reported values above instrument detection limit and below reporting limit; U = not detected at or above the reporting limit.

Table 6-5Field Parameters in Surface Water Samples
Riverbend Landfill
Table 6-5 Field Parameters in Surface Water Samples (Apr16)SCS Engineers
3/29/2016
Specific DissolvedSample Date pH ORP Conductance Temperature Oxygen
Location Collected (S.U.) (mV) (µS/cm) (oC) (mg/L)
SYR SW-1 (Upstream) 3-May-12 6.46 94.8 82 11.1 11.28SYR SW-1 (Upstream) 17-Apr-13 6.17 153.0 96 8.7 12.13SYR SW-1 (Upstream) 23-May-13 6.96 -70.9 106 14.8 8.81SYR SW-1 (Upstream) 1-May-14 6.74 113.4 90 14.3 9.76SYR SW-1 (Upstream) 11-May-15 7.42 92.3 91 16.5 8.37SYR SW-2 (Downstream) 3-May-12 7.04 65.2 82 11.1 11.28SYR SW-2 (Downstream) 17-Apr-13 5.72 183.8 96 8.2 11.30SYR SW-2 (Downstream) 23-May-13 6.35 -16.0 106 13.8 9.07SYR SW-2 (Downstream) 1-May-14 5.82 160.5 90 14.0 8.98SYR SW-2 (Downstream) 11-May-15 7.58 95.8 85 17.6 7.46NOTE:S.U. = standard pH units; mV = millivolts; µS/cm = microSiemens per centimeter; oC = degrees Celsius; mg/L = milligrams per liter.

Table 6-6Anions and Cations in Surface Water Samples
(mg/L)Riverbend Landfill
Table 6-6 Anions and Cations in Surface Water Samples (Apr16)SCS Engineers
3/29/2016
Sample Date Anions CationsLocation Collected Ammonia Carbonate Bicarbonate Sulfate Chloride
SYR SW-1 (Upstream)a 3-May-12 0.058 0.20 5.0 U 29 4.4 4.8 6.8 0.056 2.5 0.0140 0.50 U 5.3
SYR SW-1 (Upstream)a 17-Apr-13 0.050 U 0.28 5.0 U 27 4.8 5.1 6.9 0.037 2.4 0.0096 0.58 5.3SYR SW-1 (Upstream) 1-May-14 0.050 U 0.36 5.0 U 28 6.2 5.2 6.8 1.100 2.7 0.0220 0.56 5.4SYR SW-1 (Upstream) 11-May-15 0.050 U 0.17 5.0 U 35 4.3 5.4 8.5 0.440 2.8 0.0180 0.50 6.6
SYR SW-2 (Downstream)a 3-May-12 0.050 U 0.23 5.0 U 28 4.6 4.8 6.7 0.038 2.4 0.0120 0.50 U 5.0
SYR SW-2 (Downstream)a 17-Apr-13 0.053 0.30 5.0 U 27 4.8 4.9 6.9 0.035 2.4 0.0094 0.51 5.3SYR SW-2 (Downstream) 1-May-14 0.120 0.43 5.0 U 26 5.1 4.6 6.7 1.200 2.6 0.0240 0.56 5.5SYR SW-2 (Downstream) 11-May-15 0.050 U 0.17 5.0 U 36 4.3 5.5 8.6 0.540 2.8 0.0220 0.51 6.6NOTE:a Consistent with the site's updated environmental monitoring plan, laboratory analysis of dissolved-phase cations were replaced with total in 2014.
mg/L = milligrams per liter; U = not detected at or above the method reporting limit listed
Potassium SodiumNitrate+Nitrite Calcium Iron Magnesium Manganese

Table 6-7Laboratory Indicator Parameters in Surface Water Samples
Riverbend Landfill
Table 6-7 Laboratory Indicator Parameters in Surface Water Samples (Apr16)SCS Engineers
3/29/2016
Laboratory Total Total Chemical Total HardnessLaboratory Specific Dissolved Suspended Oxygen Organic (Dissolved) Total
Sample Date pH Conductance Solids Solids Demand Carbon (as CaCO3) AlkalinityLocation Collected (S.U.) (µmhos/cm) (mg/L) (mg/L) (mg/L) (mg/L) (mg/L) (mg/L)
SYR SW-1 (Upstream) 3-May-12 7.71 80 73 22 10 U 1.3 27 29SYR SW-1 (Upstream) 17-Apr-13 7.49 84 33 9.2 10 U 1.5 34 B 27SYR SW-1 (Upstream) 1-May-14 7.38 86 43 16 11 1.0 U 43 28SYR SW-1 (Upstream) 11-May-15 7.56 120 59 6.8 H 10 U 1.0 53 35SYR SW-2 (Downstream) 3-May-12 7.65 82 68 31 10 U 1.5 27 28SYR SW-2 (Downstream) 17-Apr-13 7.55 83 35 11 10 U 1.5 30 B 27SYR SW-2 (Downstream) 1-May-14 7.36 85 50 18 14 1.0 U 41 26SYR SW-2 (Downstream) 11-May-15 7.67 110 60 17 H 10 U 1.2 56 36NOTE:S.U. = standard pH units; µmhos/cm = micromhos per centimeter; mg/L = milligrams per liter; U = not detected at or above the method reporting limit listed; B = compound was detected in the associated laboratory method blank sample; H = sample was prepped or analyzed past the analytical holding time.

Table 6-8Supplemental Parameters in Surface Water Samples
Riverbend Landfill
Table 6-8 Supplemental Parameters in Surface Water Samples (Apr16)SCS Engineers
3/29/2016
Ortho- Total Organic Sample Date Coliform E. coli Demand Nitrogen phosphate Phosphorus Halogens
Location Collected (MPN/100mL) (MPN/100mL) (mg/L) (mg/L) (mg/L) (mg/L) (mg/L)
SYR SW-1 (Upstream) 3-May-12 300 460 2.4 0.89 0.02 U 0.028 15 USYR SW-1 (Upstream) 17-Apr-13 NS NS 2.0 U 0.50 U 0.02 U 0.020 U 15 USYR SW-1 (Upstream) 23-May-13 365 1,046 NS NS NS NS NSSYR SW-1 (Upstream) 1-May-14 23 41 2.0 U 0.50 U 0.02 U 0.021 15 USYR SW-1 (Upstream) 11-May-15 18 99 2.0 U 0.50 U 0.02 U 0.020 U 17SYR SW-2 (Downstream) 3-May-12 900 260 2.9 0.50 U 0.02 U 0.040 16SYR SW-2 (Downstream) 17-Apr-13 NS NS 2.0 U 0.50 U 0.02 U, H 0.020 U 15 USYR SW-2 (Downstream) 23-May-13 127 435 NS NS NS NS NSSYR SW-2 (Downstream) 1-May-14 33 42 2.0 U 0.50 U 0.02 U 0.021 15 USYR SW-2 (Downstream) 11-May-15 11 40 2.0 U 0.50 U 0.02 U 0.020 U 15 UNOTE:MPN/100mL = most probable number per 100 milliliters; mg/L = milligrams per liter; U = not detected at or above the method reporting limit listed; NS = not sampled for or analyzed; H = sample was prepped or analyzed past the analytical holding time.
Biochemical Total TotalFecal Oxygen Kjeldahl

Table 6-9Summary of Landfill Gas Monitoring Data
Riverbend Landfill
Table 6-9 RL 2015 Landfill Gas Monitoring Data.xlsTable 6-9Page 1 of 26 SCS Engineers
4:15 PM 4/1/2016
Sample Date MethaneLocation Measured (Percent)
Compliance Boundary Landfill Gas ProbesCGP-09R 8-Oct-97 0.1CGP-09R 17-Oct-97 0.0CGP-09R 25-Nov-97 0.0CGP-09R 15-Dec-97 0.0CGP-09R 2-Jan-98 0.0CGP-09R 23-Feb-98 0.0CGP-09R 5-Mar-98 0.0CGP-09R 7-Apr-98 0.0CGP-09R 6-May-98 0.0CGP-09R 5-Jun-98 0.0CGP-09R 7-Jul-98 0.0CGP-09R 4-Aug-98 0.0CGP-09R 8-Sep-98 0.0CGP-09R 13-Oct-98 0.0CGP-09R 10-Nov-98 0.0CGP-09R 9-Dec-98 0.0CGP-09R 5-Jan-99 0.0CGP-09R 4-Feb-99 0.0CGP-09R 5-Mar-99 0.0CGP-09R 7-Apr-99 0.0CGP-09R 13-May-99 0.0CGP-09R 22-Jun-99 0.0CGP-09R 9-Jul-99 0.0CGP-09R 4-Aug-99 0.0CGP-09R 9-Sep-99 0.0CGP-09R 8-Oct-99 0.0CGP-09R 10-Nov-99 0.0CGP-09R 3-Dec-99 0.0CGP-09R 6-Jan-00 0.0CGP-09R 7-Feb-00 0.0CGP-09R 6-Mar-00 0.0CGP-09R 7-Apr-00 0.0CGP-09R 18-May-00 0.0CGP-09R 6-Jun-00 0.0CGP-09R 20-Jul-00 0.0CGP-09R 8-Aug-00 0.0CGP-09R 7-Sep-00 0.0CGP-09R 4-Oct-00 0.0CGP-09R 22-Nov-00 0.0CGP-09R 8-Dec-00 0.0CGP-09R 10-Jan-01 0.0CGP-09R 9-Feb-01 0.0CGP-09R 1-Mar-01 0.0CGP-09R 5-Apr-01 0.0CGP-09R 4-May-01 0.0CGP-09R 7-Jun-01 0.0CGP-09R 12-Jul-01 0.0CGP-09R 7-Aug-01 0.0

Table 6-9Summary of Landfill Gas Monitoring Data
Riverbend Landfill
Table 6-9 RL 2015 Landfill Gas Monitoring Data.xlsTable 6-9Page 2 of 26 SCS Engineers
4:15 PM 4/1/2016
Sample Date MethaneLocation Measured (Percent)
CGP-09R 6-Sep-01 0.0CGP-09R 5-Oct-01 0.0CGP-09R 1-Nov-01 0.0CGP-09R 4-Dec-01 0.0CGP-09R 16-Jan-02 0.0CGP-09R 5-Feb-02 0.0CGP-09R 12-Mar-02 0.0CGP-09R 4-Apr-02 0.0CGP-09R 2-May-02 0.0CGP-09R 4-Jun-02 0.0CGP-09R 5-Jul-02 0.0CGP-09R 6-Aug-02 0.0CGP-09R 5-Sep-02 0.0CGP-09R 10-Oct-02 0.0CGP-09R 7-Nov-02 0.0CGP-09R 3-Dec-02 0.0CGP-09R 9-Jan-03 0.0CGP-09R 5-Feb-03 0.0CGP-09R 13-Mar-03 0.0CGP-09R 3-Apr-03 0.0CGP-09R 2-May-03 0.0CGP-09R 4-Jun-03 0.0CGP-09R 8-Jul-03 0.0CGP-09R 5-Aug-03 0.0CGP-09R 16-Sep-03 0.0CGP-09R 2-Oct-03 0.0CGP-09R 5-Nov-03 0.0CGP-09R 4-Dec-03 0.0CGP-09R 12-Jan-04 0.0CGP-09R 5-Feb-04 0.0CGP-09R 5-Mar-04 0.0CGP-09R 8-Apr-04 0.0CGP-09R 4-May-04 0.0CGP-09R 2-Jun-04 0.0CGP-09R 8-Jul-04 0.0CGP-09R 4-Aug-04 0.0CGP-09R 2-Sep-04 0.0CGP-09R 6-Oct-04 0.0CGP-09R 1-Nov-04 0.0CGP-09R 6-Dec-04 0.0CGP-09R 7-Jan-05 0.0CGP-09R 7-Feb-05 0.0CGP-09R 8-Mar-05 0.0CGP-09R 1-Apr-05 0.0CGP-09R 5-May-05 0.0CGP-09R 10-Jun-05 0.0CGP-09R 1-Jul-05 0.0CGP-09R 4-Aug-05 0.0CGP-09R 2-Sep-05 0.0CGP-09R 3-Oct-05 0.0

Table 6-9Summary of Landfill Gas Monitoring Data
Riverbend Landfill
Table 6-9 RL 2015 Landfill Gas Monitoring Data.xlsTable 6-9Page 3 of 26 SCS Engineers
4:15 PM 4/1/2016
Sample Date MethaneLocation Measured (Percent)
CGP-09R 3-Nov-05 0.0CGP-09R 5-Dec-05 0.0CGP-09R 26-Jan-06 0.0CGP-09R 23-Feb-06 0.0CGP-09R 1-Mar-06 0.0CGP-09R 5-Apr-06 0.0CGP-09R 18-May-06 0.0CGP-09R 2-Jun-06 0.0CGP-09R 7-Jul-06 0.0CGP-09R 1-Aug-06 0.0CGP-09R 12-Sep-06 0.0CGP-09R 3-Oct-06 0.0CGP-09R 16-Nov-06 0.0CGP-09R 12-Dec-06 0.0CGP-09R 17-Jan-07 0.0CGP-09R 7-Feb-07 0.0CGP-09R 2-Mar-07 0.0CGP-09R 3-Apr-07 0.0CGP-09R 3-May-07 0.0CGP-09R 1-Jun-07 0.0CGP-09R 17-Jul-07 0.0CGP-09R 21-Aug-07 0.0CGP-09R 10-Sep-07 0.0CGP-09R 3-Oct-07 0.0CGP-09R 1-Nov-07 0.0CGP-09R 13-Dec-07 0.0CGP-09R 8-Jan-08 0.0CGP-09R 25-Feb-08 0.0CGP-09R 5-Mar-08 0.0CGP-09R 24-Apr-08 0.0CGP-09R 2-May-08 0.0CGP-09R 2-Jun-08 0.0CGP-09R 15-Jul-08 0.0CGP-09R 4-Aug-08 0.0CGP-09R 5-Sep-08 0.0CGP-09R 21-Oct-08 0.0CGP-09R 26-Nov-08 0.0CGP-09R 1-Dec-08 0.0CGP-09R 14-Jan-09 0.0CGP-09R 2-Feb-09 0.2CGP-09R 12-Mar-09 0.0CGP-09R 10-Apr-09 0.0CGP-09R 8-May-09 0.2CGP-09R 8-Jun-09 0.0CGP-09R 24-Jul-09 0.0CGP-09R 17-Aug-09 0.0CGP-09R 24-Sep-09 0.0CGP-09R 12-Oct-09 0.0CGP-09R 10-Nov-09 0.0CGP-09R 28-Dec-09 0.0

Table 6-9Summary of Landfill Gas Monitoring Data
Riverbend Landfill
Table 6-9 RL 2015 Landfill Gas Monitoring Data.xlsTable 6-9Page 4 of 26 SCS Engineers
4:15 PM 4/1/2016
Sample Date MethaneLocation Measured (Percent)
CGP-09R 21-Jan-10 0.0CGP-09R 11-Feb-10 0.0CGP-09R 10-Mar-10 0.0CGP-09R 9-Apr-10 0.0CGP-09R 7-May-10 0.0CGP-09R 2-Jun-10 0.0CGP-09R 9-Jul-10 0.0CGP-09R 4-Aug-10 0.0CGP-09R 14-Sep-10 0.0CGP-09R 11-Oct-10 0.0CGP-09R 5-Nov-10 0.0CGP-09R 8-Dec-10 0.0CGP-09R 10-Jan-11 0.0CGP-09R 17-Feb-11 0.0CGP-09R 10-Mar-11 0.0CGP-09R 30-Mar-11 0.0CGP-09R 21-Apr-11 0.0CGP-09R 4-May-11 0.0CGP-09R 11-May-11 0.0CGP-09R 9-Jun-11 0.0CGP-09R 8-Jul-11 0.0CGP-09R 28-Jul-11 0.0CGP-09R 10-Aug-11 0.0CGP-09R 9-Sep-11 0.0CGP-09R 14-Oct-11 0.0CGP-09R 3-Nov-11 0.0CGP-09R 9-Nov-11 0.0CGP-09R 13-Dec-11 0.0CGP-09R 12-Jan-12 0.0CGP-09R 4-May-12 0.0CGP-09R 23-Aug-12 0.0CGP-09R 15-Nov-12 0.0CGP-09R 21-Mar-13 0.0CGP-09R 12-Apr-13 0.0CGP-09R 12-Jul-13 0.0CGP-09R 25-Oct-13 0.0CGP-09R 13-Mar-14 0.0CGP-09R 2-Jun-14 0.0CGP-09R 31-Jul-14 0.0CGP-09R 15-Dec-14 0.0CGP-09R 4-Mar-15 0.0CGP-09R 14-May-15 0.0CGP-09R 16-Jul-15 0.0CGP-09R 12-Nov-15 0.0CGP-10R 26-Nov-08 0.0CGP-10R 1-Dec-08 0.0CGP-10R 14-Jan-09 0.0CGP-10R 2-Feb-09 0.0CGP-10R 12-Mar-09 0.0CGP-10R 10-Apr-09 0.0

Table 6-9Summary of Landfill Gas Monitoring Data
Riverbend Landfill
Table 6-9 RL 2015 Landfill Gas Monitoring Data.xlsTable 6-9Page 5 of 26 SCS Engineers
4:15 PM 4/1/2016
Sample Date MethaneLocation Measured (Percent)
CGP-10R 8-May-09 0.0CGP-10R 8-Jun-09 0.0CGP-10R 24-Jul-09 0.0CGP-10R 17-Aug-09 0.0CGP-10R 24-Sep-09 0.0CGP-10R 12-Oct-09 0.0CGP-10R 10-Nov-09 0.0CGP-10R 28-Dec-09 0.0CGP-10R 21-Jan-10 0.0CGP-10R 11-Feb-10 0.0CGP-10R 10-Mar-10 0.0CGP-10R 9-Apr-10 0.0CGP-10R 7-May-10 0.0CGP-10R 2-Jun-10 0.0CGP-10R 9-Jul-10 0.0CGP-10R 4-Aug-10 0.0CGP-10R 14-Sep-10 0.0CGP-10R 11-Oct-10 0.0CGP-10R 5-Nov-10 0.0CGP-10R 8-Dec-10 0.0CGP-10R 10-Jan-11 0.0CGP-10R 17-Feb-11 0.0CGP-10R 10-Mar-11 0.0CGP-10R 30-Mar-11 0.0CGP-10R 21-Apr-11 0.0CGP-10R 4-May-11 0.0CGP-10R 11-May-11 0.0CGP-10R 9-Jun-11 0.0CGP-10R 8-Jul-11 0.0CGP-10R 28-Jul-11 0.0CGP-10R 10-Aug-11 0.0CGP-10R 9-Sep-11 0.0CGP-10R 14-Oct-11 0.0CGP-10R 3-Nov-11 0.0CGP-10R 9-Nov-11 0.0CGP-10R 13-Dec-11 0.0CGP-10R 12-Jan-12 0.0CGP-10R 4-May-12 0.0CGP-10R 23-Aug-12 0.0CGP-10R 15-Nov-12 0.0CGP-10R 21-Mar-13 0.0CGP-10R 12-Apr-13 0.0CGP-10R 12-Jul-13 0.0CGP-10R 25-Oct-13 0.0CGP-10R 13-Mar-14 0.0CGP-10R 2-Jun-14 0.0CGP-10R 31-Jul-14 0.0CGP-10R 15-Dec-14 0.0CGP-10R 4-Mar-15 0.0CGP-10R 14-May-15 0.0

Table 6-9Summary of Landfill Gas Monitoring Data
Riverbend Landfill
Table 6-9 RL 2015 Landfill Gas Monitoring Data.xlsTable 6-9Page 6 of 26 SCS Engineers
4:15 PM 4/1/2016
Sample Date MethaneLocation Measured (Percent)
CGP-10R 16-Jul-15 0.0CGP-10R 12-Nov-15 0.0CGP-11 8-Oct-97 0.1CGP-11 17-Oct-97 0.0CGP-11 25-Nov-97 0.0CGP-11 15-Dec-97 0.0CGP-11 2-Jan-98 0.5CGP-11 23-Feb-98 0.0CGP-11 5-Mar-98 0.0CGP-11 7-Apr-98 0.0CGP-11 6-May-98 0.0CGP-11 5-Jun-98 0.0CGP-11 7-Jul-98 0.0CGP-11 4-Aug-98 0.0CGP-11 8-Sep-98 0.0CGP-11 13-Oct-98 0.0CGP-11 10-Nov-98 0.0CGP-11 9-Dec-98 0.0CGP-11 5-Jan-99 0.0CGP-11 4-Feb-99 0.1CGP-11 5-Mar-99 0.0CGP-11 7-Apr-99 0.0CGP-11 13-May-99 0.0CGP-11 22-Jun-99 0.0CGP-11 9-Jul-99 0.0CGP-11 4-Aug-99 0.0CGP-11 9-Sep-99 0.0CGP-11 8-Oct-99 0.0CGP-11 10-Nov-99 0.0CGP-11 3-Dec-99 0.0CGP-11 6-Jan-00 0.0CGP-11 7-Feb-00 0.0CGP-11 6-Mar-00 0.0CGP-11 7-Apr-00 0.0CGP-11 18-May-00 0.0CGP-11 6-Jun-00 0.0CGP-11 20-Jul-00 0.0CGP-11 8-Aug-00 0.0CGP-11 7-Sep-00 0.0CGP-11 4-Oct-00 0.0CGP-11 22-Nov-00 0.0CGP-11 8-Dec-00 0.0CGP-11 10-Jan-01 0.0CGP-11 9-Feb-01 0.0CGP-11 1-Mar-01 0.0CGP-11 5-Apr-01 0.0CGP-11 4-May-01 0.0CGP-11 7-Jun-01 0.0CGP-11 12-Jul-01 0.0CGP-11 7-Aug-01 0.0

Table 6-9Summary of Landfill Gas Monitoring Data
Riverbend Landfill
Table 6-9 RL 2015 Landfill Gas Monitoring Data.xlsTable 6-9Page 7 of 26 SCS Engineers
4:15 PM 4/1/2016
Sample Date MethaneLocation Measured (Percent)
CGP-11 6-Sep-01 0.0CGP-11 5-Oct-01 0.0CGP-11 1-Nov-01 0.0CGP-11 4-Dec-01 0.0CGP-11 16-Jan-02 0.0CGP-11 5-Feb-02 0.0CGP-11 12-Mar-02 0.0CGP-11 4-Apr-02 0.0CGP-11 2-May-02 0.0CGP-11 4-Jun-02 0.0CGP-11 5-Jul-02 0.0CGP-11 6-Aug-02 0.0CGP-11 5-Sep-02 0.0CGP-11 10-Oct-02 0.0CGP-11 7-Nov-02 0.0CGP-11 3-Dec-02 0.0CGP-11 9-Jan-03 0.0CGP-11 5-Feb-03 0.0CGP-11 13-Mar-03 0.0CGP-11 3-Apr-03 0.0CGP-11 2-May-03 0.0CGP-11 4-Jun-03 0.0CGP-11 8-Jul-03 0.0CGP-11 5-Aug-03 0.0CGP-11 16-Sep-03 0.0CGP-11 2-Oct-03 0.0CGP-11 5-Nov-03 0.0CGP-11 4-Dec-03 0.0CGP-11 12-Jan-04 0.0CGP-11 5-Feb-04 0.0CGP-11 5-Mar-04 0.0CGP-11 8-Apr-04 0.0CGP-11 4-May-04 0.0CGP-11 2-Jun-04 0.0CGP-11 8-Jul-04 0.0CGP-11 4-Aug-04 0.0CGP-11 2-Sep-04 0.0CGP-11 6-Oct-04 0.0CGP-11 1-Nov-04 0.0CGP-11 6-Dec-04 0.0CGP-11 7-Jan-05 0.0CGP-11 7-Feb-05 0.0CGP-11 8-Mar-05 0.0CGP-11 1-Apr-05 0.0CGP-11 5-May-05 0.0CGP-11 10-Jun-05 0.0CGP-11 1-Jul-05 0.0CGP-11 4-Aug-05 0.0CGP-11 2-Sep-05 0.0CGP-11 3-Oct-05 0.0

Table 6-9Summary of Landfill Gas Monitoring Data
Riverbend Landfill
Table 6-9 RL 2015 Landfill Gas Monitoring Data.xlsTable 6-9Page 8 of 26 SCS Engineers
4:15 PM 4/1/2016
Sample Date MethaneLocation Measured (Percent)
CGP-11 3-Nov-05 0.0CGP-11 5-Dec-05 0.0CGP-11 26-Jan-06 0.0CGP-11 23-Feb-06 0.0CGP-11 1-Mar-06 0.0CGP-11 5-Apr-06 0.0CGP-11 18-May-06 0.0CGP-11 2-Jun-06 0.0CGP-11 7-Jul-06 0.0CGP-11 1-Aug-06 0.0CGP-11 12-Sep-06 0.0CGP-11 3-Oct-06 0.0CGP-11 16-Nov-06 0.0CGP-11 12-Dec-06 0.0CGP-11 17-Jan-07 0.0CGP-11 7-Feb-07 0.0CGP-11 2-Mar-07 0.0CGP-11 3-Apr-07 0.0CGP-11 3-May-07 0.0CGP-11 1-Jun-07 0.0CGP-11 17-Jul-07 0.0CGP-11 21-Aug-07 0.0CGP-11 10-Sep-07 0.0CGP-11 3-Oct-07 0.0CGP-11 1-Nov-07 0.0CGP-11 13-Dec-07 0.0CGP-11 8-Jan-08 0.0CGP-11 25-Feb-08 0.0CGP-11 5-Mar-08 0.0CGP-11 24-Apr-08 0.0CGP-11 2-May-08 0.0CGP-11 2-Jun-08 0.0CGP-11 15-Jul-08 0.0CGP-11 4-Aug-08 0.0CGP-11 5-Sep-08 0.0CGP-11 21-Oct-08 0.0CGP-11 26-Nov-08 0.0CGP-11 1-Dec-08 0.0CGP-11 14-Jan-09 0.0CGP-11 2-Feb-09 0.0CGP-11 12-Mar-09 0.0CGP-11 10-Apr-09 0.0CGP-11 8-May-09 0.0CGP-11 8-Jun-09 0.0CGP-11 24-Jul-09 0.0CGP-11 17-Aug-09 0.0CGP-11 24-Sep-09 0.0CGP-11 12-Oct-09 0.0CGP-11 10-Nov-09 0.0CGP-11 28-Dec-09 0.0

Table 6-9Summary of Landfill Gas Monitoring Data
Riverbend Landfill
Table 6-9 RL 2015 Landfill Gas Monitoring Data.xlsTable 6-9Page 9 of 26 SCS Engineers
4:15 PM 4/1/2016
Sample Date MethaneLocation Measured (Percent)
CGP-11 21-Jan-10 0.0CGP-11 11-Feb-10 0.0CGP-11 10-Mar-10 0.0CGP-11 9-Apr-10 0.0CGP-11 7-May-10 0.0CGP-11 2-Jun-10 0.0CGP-11 9-Jul-10 0.0CGP-11 4-Aug-10 0.0CGP-11 14-Sep-10 0.0CGP-11 11-Oct-10 0.0CGP-11 5-Nov-10 0.0CGP-11 8-Dec-10 0.0CGP-11 10-Jan-11 0.0CGP-11 17-Feb-11 0.0CGP-11 10-Mar-11 0.0CGP-11 30-Mar-11 0.0CGP-11 21-Apr-11 0.0CGP-11 4-May-11 0.0CGP-11 11-May-11 0.0CGP-11 9-Jun-11 0.0CGP-11 8-Jul-11 0.0CGP-11 28-Jul-11 0.0CGP-11 10-Aug-11 0.0CGP-11 9-Sep-11 0.0CGP-11 14-Oct-11 0.0CGP-11 3-Nov-11 0.0CGP-11 10-Nov-11 0.0CGP-11 13-Dec-11 0.0CGP-11 12-Jan-12 0.0CGP-11 4-May-12 0.0CGP-11 23-Aug-12 0.0CGP-11 15-Nov-12 0.0CGP-11 21-Mar-13 0.0CGP-11 12-Apr-13 0.0CGP-11 12-Jul-13 0.0CGP-11 25-Oct-13 0.0CGP-11 13-Mar-14 0.0CGP-11 2-Jun-14 0.0CGP-11 31-Jul-14 0.0CGP-11 15-Dec-14 0.0CGP-11 4-Mar-15 0.0CGP-11 14-May-15 0.0CGP-11 16-Jul-15 0.0CGP-11 12-Nov-15 0.0CGP-12 8-Oct-97 0.0CGP-12 17-Oct-97 0.0CGP-12 25-Nov-97 0.0CGP-12 15-Dec-97 0.0CGP-12 2-Jan-98 0.0CGP-12 23-Feb-98 0.0
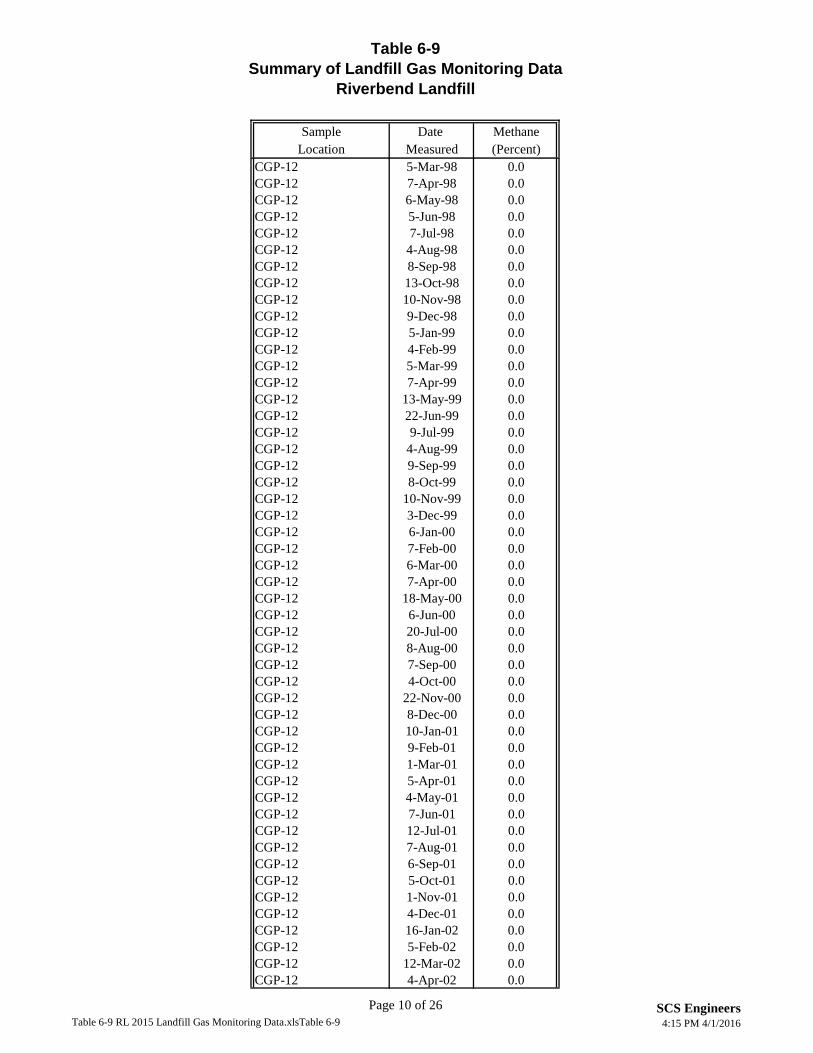
Table 6-9Summary of Landfill Gas Monitoring Data
Riverbend Landfill
Table 6-9 RL 2015 Landfill Gas Monitoring Data.xlsTable 6-9Page 10 of 26 SCS Engineers
4:15 PM 4/1/2016
Sample Date MethaneLocation Measured (Percent)
CGP-12 5-Mar-98 0.0CGP-12 7-Apr-98 0.0CGP-12 6-May-98 0.0CGP-12 5-Jun-98 0.0CGP-12 7-Jul-98 0.0CGP-12 4-Aug-98 0.0CGP-12 8-Sep-98 0.0CGP-12 13-Oct-98 0.0CGP-12 10-Nov-98 0.0CGP-12 9-Dec-98 0.0CGP-12 5-Jan-99 0.0CGP-12 4-Feb-99 0.0CGP-12 5-Mar-99 0.0CGP-12 7-Apr-99 0.0CGP-12 13-May-99 0.0CGP-12 22-Jun-99 0.0CGP-12 9-Jul-99 0.0CGP-12 4-Aug-99 0.0CGP-12 9-Sep-99 0.0CGP-12 8-Oct-99 0.0CGP-12 10-Nov-99 0.0CGP-12 3-Dec-99 0.0CGP-12 6-Jan-00 0.0CGP-12 7-Feb-00 0.0CGP-12 6-Mar-00 0.0CGP-12 7-Apr-00 0.0CGP-12 18-May-00 0.0CGP-12 6-Jun-00 0.0CGP-12 20-Jul-00 0.0CGP-12 8-Aug-00 0.0CGP-12 7-Sep-00 0.0CGP-12 4-Oct-00 0.0CGP-12 22-Nov-00 0.0CGP-12 8-Dec-00 0.0CGP-12 10-Jan-01 0.0CGP-12 9-Feb-01 0.0CGP-12 1-Mar-01 0.0CGP-12 5-Apr-01 0.0CGP-12 4-May-01 0.0CGP-12 7-Jun-01 0.0CGP-12 12-Jul-01 0.0CGP-12 7-Aug-01 0.0CGP-12 6-Sep-01 0.0CGP-12 5-Oct-01 0.0CGP-12 1-Nov-01 0.0CGP-12 4-Dec-01 0.0CGP-12 16-Jan-02 0.0CGP-12 5-Feb-02 0.0CGP-12 12-Mar-02 0.0CGP-12 4-Apr-02 0.0

Table 6-9Summary of Landfill Gas Monitoring Data
Riverbend Landfill
Table 6-9 RL 2015 Landfill Gas Monitoring Data.xlsTable 6-9Page 11 of 26 SCS Engineers
4:15 PM 4/1/2016
Sample Date MethaneLocation Measured (Percent)
CGP-12 2-May-02 0.0CGP-12 4-Jun-02 0.0CGP-12 5-Jul-02 0.0CGP-12 6-Aug-02 0.0CGP-12 5-Sep-02 0.0CGP-12 10-Oct-02 0.0CGP-12 7-Nov-02 0.0CGP-12 3-Dec-02 0.0CGP-12 9-Jan-03 0.0CGP-12 5-Feb-03 0.0CGP-12 13-Mar-03 0.0CGP-12 3-Apr-03 0.0CGP-12 2-May-03 0.0CGP-12 4-Jun-03 0.0CGP-12 8-Jul-03 0.0CGP-12 5-Aug-03 0.0CGP-12 16-Sep-03 0.0CGP-12 2-Oct-03 0.0CGP-12 5-Nov-03 0.0CGP-12 4-Dec-03 0.0CGP-12 12-Jan-04 0.0CGP-12 5-Feb-04 0.0CGP-12 5-Mar-04 0.0CGP-12 8-Apr-04 0.0CGP-12 4-May-04 0.0CGP-12 2-Jun-04 0.0CGP-12 8-Jul-04 0.0CGP-12 4-Aug-04 0.0CGP-12 2-Sep-04 0.0CGP-12 6-Oct-04 0.0CGP-12 1-Nov-04 0.0CGP-12 6-Dec-04 0.0CGP-12 7-Jan-05 0.0CGP-12 7-Feb-05 0.0CGP-12 8-Mar-05 0.0CGP-12 1-Apr-05 0.0CGP-12 5-May-05 0.0CGP-12 10-Jun-05 0.0CGP-12 1-Jul-05 0.0CGP-12 4-Aug-05 0.0CGP-12 2-Sep-05 0.0CGP-12 3-Oct-05 0.0CGP-12 3-Nov-05 0.0CGP-12 5-Dec-05 0.0CGP-12 26-Jan-06 0.0CGP-12 23-Feb-06 0.0CGP-12 1-Mar-06 0.0CGP-12 5-Apr-06 0.0CGP-12 18-May-06 0.0CGP-12 2-Jun-06 0.0

Table 6-9Summary of Landfill Gas Monitoring Data
Riverbend Landfill
Table 6-9 RL 2015 Landfill Gas Monitoring Data.xlsTable 6-9Page 12 of 26 SCS Engineers
4:15 PM 4/1/2016
Sample Date MethaneLocation Measured (Percent)
CGP-12 7-Jul-06 0.0CGP-12 12-Sep-06 0.0CGP-12 3-Oct-06 0.0CGP-12 16-Nov-06 0.0CGP-12 12-Dec-06 0.0CGP-12 17-Jan-07 0.0CGP-12 7-Feb-07 0.0CGP-12 2-Mar-07 0.0CGP-12 3-Apr-07 0.0CGP-12 3-May-07 0.0CGP-12 1-Jun-07 0.0CGP-12 17-Jul-07 0.0CGP-12 21-Aug-07 0.0CGP-12 10-Sep-07 0.0CGP-12 3-Oct-07 0.0CGP-12 1-Nov-07 0.0CGP-12 13-Dec-07 0.0CGP-12 8-Jan-08 0.0CGP-12 25-Feb-08 0.0CGP-12 5-Mar-08 0.0CGP-12 24-Apr-08 0.0CGP-12 2-May-08 0.0CGP-12 2-Jun-08 0.0CGP-12 15-Jul-08 0.0CGP-12 4-Aug-08 0.0CGP-12 5-Sep-08 0.0CGP-12 21-Oct-08 0.0CGP-12 26-Nov-08 0.0CGP-12 1-Dec-08 0.0CGP-12 14-Jan-09 0.0CGP-12 2-Feb-09 0.0CGP-12 12-Mar-09 0.0CGP-12 10-Apr-09 0.0CGP-12 8-May-09 0.0CGP-12 8-Jun-09 0.0CGP-12 24-Jul-09 0.0CGP-12 17-Aug-09 0.0CGP-12 24-Sep-09 0.0CGP-12 12-Oct-09 0.0CGP-12 10-Nov-09 0.0CGP-12 28-Dec-09 0.0CGP-12 21-Jan-10 0.0CGP-12 11-Feb-10 0.0CGP-12 10-Mar-10 0.0CGP-12 9-Apr-10 0.0CGP-12 7-May-10 0.0CGP-12 2-Jun-10 0.0CGP-12 9-Jul-10 0.0CGP-12 4-Aug-10 0.0CGP-12 14-Sep-10 0.0

Table 6-9Summary of Landfill Gas Monitoring Data
Riverbend Landfill
Table 6-9 RL 2015 Landfill Gas Monitoring Data.xlsTable 6-9Page 13 of 26 SCS Engineers
4:15 PM 4/1/2016
Sample Date MethaneLocation Measured (Percent)
CGP-12 11-Oct-10 0.0CGP-12 5-Nov-10 0.0CGP-12 8-Dec-10 0.0CGP-12 10-Jan-11 0.0CGP-12 17-Feb-11 0.0CGP-12 10-Mar-11 0.0CGP-12 30-Mar-11 0.0CGP-12 21-Apr-11 0.0CGP-12 4-May-11 0.0CGP-12 11-May-11 0.0CGP-12 9-Jun-11 0.0CGP-12 8-Jul-11 0.0CGP-12 28-Jul-11 0.0CGP-12 10-Aug-11 0.0CGP-12 9-Sep-11 0.0CGP-12 14-Oct-11 0.0CGP-12 3-Nov-11 0.0CGP-12 10-Nov-11 0.0CGP-12 13-Dec-11 0.0CGP-12 12-Jan-12 0.0CGP-12 4-May-12 0.0CGP-12 23-Aug-12 0.0CGP-12 15-Nov-12 0.0CGP-12 21-Mar-13 0.0CGP-12 12-Apr-13 0.0CGP-12 12-Jul-13 0.0CGP-12 25-Oct-13 0.0CGP-12 13-Mar-14 0.0CGP-12 2-Jun-14 0.0CGP-12 31-Jul-14 0.0CGP-12 15-Dec-14 0.0CGP-12 4-Mar-15 0.0CGP-12 14-May-15 0.0CGP-12 16-Jul-15 0.0CGP-12 12-Nov-15 0.0CGP-13 12-Jul-13 0.0CGP-13 25-Oct-13 0.0CGP-13 13-Mar-14 0.0CGP-13 2-Jun-14 0.0CGP-13 31-Jul-14 0.0CGP-13 15-Dec-14 0.0CGP-13 4-Mar-15 0.0CGP-13 14-May-15 0.0CGP-13 16-Jul-15 0.0CGP-13 12-Nov-15 0.0CGP-14 13-Mar-14 0.0CGP-14 2-Jun-14 0.0CGP-14 31-Jul-14 0.0CGP-14 15-Dec-14 0.0CGP-14 4-Mar-15 0.0

Table 6-9Summary of Landfill Gas Monitoring Data
Riverbend Landfill
Table 6-9 RL 2015 Landfill Gas Monitoring Data.xlsTable 6-9Page 14 of 26 SCS Engineers
4:15 PM 4/1/2016
Sample Date MethaneLocation Measured (Percent)
CGP-14 14-May-15 0.0CGP-14 16-Jul-15 0.0CGP-14 12-Nov-15 0.0
Facility StructuresOffice 8-Oct-97 0.0Office 17-Oct-97 0.0Office 25-Nov-97 0.0Office 15-Dec-97 0.0Office 2-Jan-98 0.0Office 23-Feb-98 0.0Office 5-Mar-98 0.0Office 7-Apr-98 0.0Office 6-May-98 0.0Office 5-Jun-98 0.0Office 7-Jul-98 0.0Office 4-Aug-98 0.0Office 8-Sep-98 0.0Office 13-Oct-98 0.0Office 10-Nov-98 0.0Office 9-Dec-98 0.0Office 5-Jan-99 0.0Office 4-Feb-99 0.0Office 5-Mar-99 0.0Office 7-Apr-99 0.0Office 13-May-99 0.0Office 22-Jun-99 0.0Office 9-Jul-99 0.0Office 4-Aug-99 0.0Office 9-Sep-99 0.0Office 8-Oct-99 0.0Office 10-Nov-99 0.0Office 3-Dec-99 0.0Office 6-Jan-00 0.0Office 7-Feb-00 0.0Office 6-Mar-00 0.0Office 7-Apr-00 0.0Office 18-May-00 0.0Office 6-Jun-00 0.0Office 20-Jul-00 0.0Office 8-Aug-00 0.0Office 7-Sep-00 0.0Office 4-Oct-00 0.0Office 22-Nov-00 0.0Office 8-Dec-00 0.0Office 10-Jan-01 0.0Office 9-Feb-01 0.0Office 1-Mar-01 0.0Office 5-Apr-01 0.0Office 4-May-01 0.0

Table 6-9Summary of Landfill Gas Monitoring Data
Riverbend Landfill
Table 6-9 RL 2015 Landfill Gas Monitoring Data.xlsTable 6-9Page 15 of 26 SCS Engineers
4:15 PM 4/1/2016
Sample Date MethaneLocation Measured (Percent)
Office 7-Jun-01 0.0Office 12-Jul-01 0.0Office 7-Aug-01 0.0Office 6-Sep-01 0.0Office 5-Oct-01 0.0Office 1-Nov-01 0.0Office 4-Dec-01 0.0Office 16-Jan-02 0.0Office 5-Feb-02 0.0Office 12-Mar-02 0.0Office 4-Apr-02 0.0Office 2-May-02 0.0Office 4-Jun-02 0.0Office 5-Jul-02 0.0Office 6-Aug-02 0.0Office 5-Sep-02 0.0Office 10-Oct-02 0.0Office 7-Nov-02 0.0Office 3-Dec-02 0.0Office 9-Jan-03 0.0Office 5-Feb-03 0.0Office 13-Mar-03 0.0Office 3-Apr-03 0.0Office 2-May-03 0.0Office 4-Jun-03 0.0Office 8-Jul-03 0.0Office 5-Aug-03 0.0Office 16-Sep-03 0.0Office 2-Oct-03 0.0Office 5-Nov-03 0.0Office 4-Dec-03 0.0Office 12-Jan-04 0.0Office 5-Feb-04 0.0Office 5-Mar-04 0.0Office 8-Apr-04 0.0Office 4-May-04 0.0Office 2-Jun-04 0.0Office 8-Jul-04 0.0Office 4-Aug-04 0.0Office 2-Sep-04 0.0Office 6-Oct-04 0.0Office 1-Nov-04 0.0Office 6-Dec-04 0.0Office 7-Jan-05 0.0Office 7-Feb-05 0.0Office 8-Mar-05 0.0Office 1-Apr-05 0.0Office 5-May-05 0.0Office 10-Jun-05 0.0Office 1-Jul-05 0.0

Table 6-9Summary of Landfill Gas Monitoring Data
Riverbend Landfill
Table 6-9 RL 2015 Landfill Gas Monitoring Data.xlsTable 6-9Page 16 of 26 SCS Engineers
4:15 PM 4/1/2016
Sample Date MethaneLocation Measured (Percent)
Office 4-Aug-05 0.0Office 2-Sep-05 0.0Office 3-Oct-05 0.0Office 3-Nov-05 0.0Office 5-Dec-05 0.0Office 26-Jan-06 0.0Office 23-Feb-06 0.0Office 1-Mar-06 0.0Office 5-Apr-06 0.0Office 18-May-06 0.0Office 2-Jun-06 0.0Office 7-Jul-06 0.0Office 1-Aug-06 0.0Office 12-Sep-06 0.0Office 3-Oct-06 0.0Office 16-Nov-06 0.0Office 17-Jan-07 0.0Office 7-Feb-07 0.0Office 2-Mar-07 0.0Office 3-Apr-07 0.0Office 3-May-07 0.0Office 1-Jun-07 0.0Office 17-Jul-07 0.0Office 21-Aug-07 0.0Office 10-Sep-07 0.0Office 3-Oct-07 0.0Office 1-Nov-07 0.0Office 13-Dec-07 0.0Office 8-Jan-08 0.0Office 25-Feb-08 0.0Office 5-Mar-08 0.0Office 24-Apr-08 0.0Office 2-May-08 0.0Office 2-Jun-08 0.0Office 15-Jul-08 0.0Office 4-Aug-08 0.0Office 5-Sep-08 0.0Office 21-Oct-08 0.0Office 26-Nov-08 0.0Office 1-Dec-08 0.0Office 14-Jan-09 0.0Office 2-Feb-09 0.0Office 12-Mar-09 0.0Office 10-Apr-09 0.0Office 8-May-09 0.0Office 8-Jun-09 0.0Office 24-Jul-09 0.0Office 17-Aug-09 0.0Office 24-Sep-09 0.0Office 12-Oct-09 0.0

Table 6-9Summary of Landfill Gas Monitoring Data
Riverbend Landfill
Table 6-9 RL 2015 Landfill Gas Monitoring Data.xlsTable 6-9Page 17 of 26 SCS Engineers
4:15 PM 4/1/2016
Sample Date MethaneLocation Measured (Percent)
Office 10-Nov-09 0.0Office 28-Dec-09 0.0Office 21-Jan-10 0.0Office 11-Feb-10 0.0Office 10-Mar-10 0.0Office 9-Apr-10 0.0Office 7-May-10 0.0Office 2-Jun-10 0.0Office 9-Jul-10 0.0Office 4-Aug-10 0.0Office 14-Sep-10 0.0Office 11-Oct-10 0.0Office 5-Nov-10 0.0Office 8-Dec-10 0.0Office 10-Jan-11 0.0Office 17-Feb-11 0.0Office 10-Mar-11 0.0Office 30-Mar-11 0.0Office 21-Apr-11 0.0Office 4-May-11 0.0Office 11-May-11 0.0Office 9-Jun-11 0.0Office 8-Jul-11 0.0Office 28-Jul-11 0.0Office 10-Aug-11 0.0Office 9-Sep-11 0.0Office 14-Oct-11 0.0Office 3-Nov-11 0.0Office 9-Nov-11 0.0Office 13-Dec-11 0.0Office 12-Jan-12 0.0Office 4-May-12 0.0Office 23-Aug-12 0.0Office 15-Nov-12 0.0Office 21-Mar-13 0.0Office 12-Apr-13 0.0Office 12-Jul-13 0.0Office 25-Oct-13 0.0Office 13-Mar-14 0.0Office 2-Jun-14 0.0Office 31-Jul-14 0.0Office 15-Dec-14 0.0Office 4-Mar-15 0.0Office 14-May-15 0.0Office 16-Jul-15 0.0Office 12-Nov-15 0.0Scale House 8-Oct-97 0.0Scale House 17-Oct-97 0.0Scale House 25-Nov-97 0.0Scale House 15-Dec-97 0.0

Table 6-9Summary of Landfill Gas Monitoring Data
Riverbend Landfill
Table 6-9 RL 2015 Landfill Gas Monitoring Data.xlsTable 6-9Page 18 of 26 SCS Engineers
4:15 PM 4/1/2016
Sample Date MethaneLocation Measured (Percent)
Scale House 2-Jan-98 0.0Scale House 23-Feb-98 0.0Scale House 5-Mar-98 0.0Scale House 7-Apr-98 0.0Scale House 6-May-98 0.0Scale House 5-Jun-98 0.0Scale House 7-Jul-98 0.0Scale House 4-Aug-98 0.0Scale House 8-Sep-98 0.0Scale House 13-Oct-98 0.0Scale House 10-Nov-98 0.0Scale House 9-Dec-98 0.0Scale House 5-Jan-99 0.0Scale House 4-Feb-99 0.0Scale House 5-Mar-99 0.0Scale House 7-Apr-99 0.0Scale House 13-May-99 0.0Scale House 22-Jun-99 0.0Scale House 9-Jul-99 0.0Scale House 4-Aug-99 0.0Scale House 9-Sep-99 0.0Scale House 8-Oct-99 0.0Scale House 10-Nov-99 0.0Scale House 3-Dec-99 0.0Scale House 6-Jan-00 0.0Scale House 7-Feb-00 0.0Scale House 6-Mar-00 0.0Scale House 7-Apr-00 0.0Scale House 18-May-00 0.0Scale House 6-Jun-00 0.0Scale House 20-Jul-00 0.0Scale House 8-Aug-00 0.0Scale House 7-Sep-00 0.0Scale House 4-Oct-00 0.0Scale House 22-Nov-00 0.0Scale House 8-Dec-00 0.0Scale House 10-Jan-01 0.0Scale House 9-Feb-01 0.0Scale House 1-Mar-01 0.0Scale House 5-Apr-01 0.0Scale House 4-May-01 0.0Scale House 7-Jun-01 0.0Scale House 12-Jul-01 0.0Scale House 7-Aug-01 0.0Scale House 6-Sep-01 0.0Scale House 5-Oct-01 0.0Scale House 1-Nov-01 0.0Scale House 4-Dec-01 0.0Scale House 16-Jan-02 0.0Scale House 5-Feb-02 0.0

Table 6-9Summary of Landfill Gas Monitoring Data
Riverbend Landfill
Table 6-9 RL 2015 Landfill Gas Monitoring Data.xlsTable 6-9Page 19 of 26 SCS Engineers
4:15 PM 4/1/2016
Sample Date MethaneLocation Measured (Percent)
Scale House 12-Mar-02 0.0Scale House 4-Apr-02 0.0Scale House 2-May-02 0.0Scale House 4-Jun-02 0.0Scale House 5-Jul-02 0.0Scale House 6-Aug-02 0.0Scale House 5-Sep-02 0.0Scale House 10-Oct-02 0.0Scale House 7-Nov-02 0.0Scale House 3-Dec-02 0.0Scale House 9-Jan-03 0.0Scale House 5-Feb-03 0.0Scale House 13-Mar-03 0.0Scale House 3-Apr-03 0.0Scale House 2-May-03 0.0Scale House 4-Jun-03 0.0Scale House 8-Jul-03 0.0Scale House 5-Aug-03 0.0Scale House 16-Sep-03 0.0Scale House 2-Oct-03 0.0Scale House 5-Nov-03 0.0Scale House 4-Dec-03 0.0Scale House 12-Jan-04 0.0Scale House 5-Feb-04 0.0Scale House 5-Mar-04 0.0Scale House 8-Apr-04 0.0Scale House 4-May-04 0.0Scale House 2-Jun-04 0.0Scale House 8-Jul-04 0.0Scale House 4-Aug-04 0.0Scale House 2-Sep-04 0.0Scale House 6-Oct-04 0.0Scale House 1-Nov-04 0.0Scale House 6-Dec-04 0.0Scale House 7-Jan-05 0.0Scale House 7-Feb-05 0.0Scale House 8-Mar-05 0.0Scale House 1-Apr-05 0.0Scale House 5-May-05 0.0Scale House 10-Jun-05 0.0Scale House 1-Jul-05 0.0Scale House 4-Aug-05 0.0Scale House 2-Sep-05 0.0Scale House 3-Oct-05 0.0Scale House 3-Nov-05 0.0Scale House 5-Dec-05 0.0Scale House 26-Jan-06 0.0Scale House 23-Feb-06 0.0Scale House 1-Mar-06 0.0Scale House 5-Apr-06 0.0

Table 6-9Summary of Landfill Gas Monitoring Data
Riverbend Landfill
Table 6-9 RL 2015 Landfill Gas Monitoring Data.xlsTable 6-9Page 20 of 26 SCS Engineers
4:15 PM 4/1/2016
Sample Date MethaneLocation Measured (Percent)
Scale House 18-May-06 0.0Scale House 2-Jun-06 0.0Scale House 7-Jul-06 0.0Scale House 1-Aug-06 0.0Scale House 12-Sep-06 0.0Scale House 3-Oct-06 0.0Scale House 16-Nov-06 0.0Scale House 12-Dec-06 0.0Scale House 17-Jan-07 0.0Scale House 7-Feb-07 0.0Scale House 2-Mar-07 0.0Scale House 3-Apr-07 0.0Scale House 3-May-07 0.0Scale House 1-Jun-07 0.0Scale House 17-Jul-07 0.0Scale House 21-Aug-07 0.0Scale House 10-Sep-07 0.0Scale House 3-Oct-07 0.0Scale House 1-Nov-07 0.0Scale House 13-Dec-07 0.0Scale House 8-Jan-08 0.0Scale House 25-Feb-08 0.0Scale House 5-Mar-08 0.0Scale House 24-Apr-08 0.0Scale House 2-May-08 0.0Scale House 2-Jun-08 0.0Scale House 15-Jul-08 0.0Scale House 4-Aug-08 0.0Scale House 5-Sep-08 0.0Scale House 21-Oct-08 0.0Scale House 26-Nov-08 0.0Scale House 1-Dec-08 0.0Scale House 14-Jan-09 0.0Scale House 2-Feb-09 0.0Scale House 12-Mar-09 0.0Scale House 10-Apr-09 0.0Scale House 8-May-09 0.0Scale House 8-Jun-09 0.0Scale House 24-Jul-09 0.0Scale House 17-Aug-09 0.0Scale House 24-Sep-09 0.0Scale House 12-Oct-09 0.0Scale House 10-Nov-09 0.0Scale House 28-Dec-09 0.0Scale House 21-Jan-10 0.0Scale House 11-Feb-10 0.0Scale House 10-Mar-10 0.0Scale House 9-Apr-10 0.0Scale House 7-May-10 0.0Scale House 2-Jun-10 0.0

Table 6-9Summary of Landfill Gas Monitoring Data
Riverbend Landfill
Table 6-9 RL 2015 Landfill Gas Monitoring Data.xlsTable 6-9Page 21 of 26 SCS Engineers
4:15 PM 4/1/2016
Sample Date MethaneLocation Measured (Percent)
Scale House 9-Jul-10 0.0Scale House 4-Aug-10 0.0Scale House 14-Sep-10 0.0Scale House 11-Oct-10 0.0Scale House 5-Nov-10 0.0Scale House 8-Dec-10 0.0Scale House 10-Jan-11 0.0Scale House 17-Feb-11 0.0Scale House 10-Mar-11 0.0Scale House 30-Mar-11 0.0Scale House 21-Apr-11 0.0Scale House 4-May-11 0.0Scale House 11-May-11 0.0Scale House 9-Jun-11 0.0Scale House 8-Jul-11 0.0Scale House 28-Jul-11 0.0Scale House 10-Aug-11 0.0Scale House 9-Sep-11 0.0Scale House 14-Oct-11 0.0Scale House 3-Nov-11 0.0Scale House 9-Nov-11 0.0Scale House 13-Dec-11 0.0Scale House 12-Jan-12 0.0Scale House 4-May-12 0.0Scale House 23-Aug-12 0.0Scale House 15-Nov-12 0.0Scale House 21-Mar-13 0.0Scale House 12-Apr-13 0.0Scale House 12-Jul-13 0.0Scale House 25-Oct-13 0.0Scale Housea 13-Mar-14 0.0Scale House 2-Jun-14 0.0Scale House 31-Jul-14 0.0Scale House 15-Dec-14 0.0Scale House 4-Mar-15 0.0Scale House 14-May-15 0.0Scale House 16-Jul-15 0.0Scale House 12-Nov-15 0.0Maintenance Building 8-Oct-97 0.0Maintenance Building 17-Oct-97 0.0Maintenance Building 25-Nov-97 0.0Maintenance Building 15-Dec-97 0.0Maintenance Building 2-Jan-98 0.0Maintenance Building 23-Feb-98 0.0Maintenance Building 5-Mar-98 0.0Maintenance Building 7-Apr-98 0.0Maintenance Building 6-May-98 0.0Maintenance Building 5-Jun-98 0.0Maintenance Building 7-Jul-98 0.0

Table 6-9Summary of Landfill Gas Monitoring Data
Riverbend Landfill
Table 6-9 RL 2015 Landfill Gas Monitoring Data.xlsTable 6-9Page 22 of 26 SCS Engineers
4:15 PM 4/1/2016
Sample Date MethaneLocation Measured (Percent)
Maintenance Building 4-Aug-98 0.0Maintenance Building 8-Sep-98 0.0Maintenance Building 13-Oct-98 0.0Maintenance Building 10-Nov-98 0.0Maintenance Building 9-Dec-98 0.0Maintenance Building 5-Jan-99 0.0Maintenance Building 4-Feb-99 0.0Maintenance Building 5-Mar-99 0.0Maintenance Building 7-Apr-99 0.0Maintenance Building 13-May-99 0.0Maintenance Building 22-Jun-99 0.0Maintenance Building 9-Jul-99 0.0Maintenance Building 4-Aug-99 0.0Maintenance Building 9-Sep-99 0.0Maintenance Building 8-Oct-99 0.0Maintenance Building 10-Nov-99 0.0Maintenance Building 3-Dec-99 0.0Maintenance Building 6-Jan-00 0.0Maintenance Building 7-Feb-00 0.0Maintenance Building 6-Mar-00 0.0Maintenance Building 7-Apr-00 0.0Maintenance Building 18-May-00 0.0Maintenance Building 6-Jun-00 0.0Maintenance Building 20-Jul-00 0.0Maintenance Building 8-Aug-00 0.0Maintenance Building 7-Sep-00 0.0Maintenance Building 4-Oct-00 0.0Maintenance Building 22-Nov-00 0.0Maintenance Building 8-Dec-00 0.0Maintenance Building 10-Jan-01 0.0Maintenance Building 9-Feb-01 0.0Maintenance Building 1-Mar-01 0.0Maintenance Building 5-Apr-01 0.0Maintenance Building 4-May-01 0.0Maintenance Building 7-Jun-01 0.0Maintenance Building 12-Jul-01 0.0Maintenance Building 7-Aug-01 0.0Maintenance Building 6-Sep-01 0.0Maintenance Building 5-Oct-01 0.0Maintenance Building 1-Nov-01 0.0Maintenance Building 4-Dec-01 0.0Maintenance Building 16-Jan-02 0.0Maintenance Building 5-Feb-02 0.0Maintenance Building 12-Mar-02 0.0Maintenance Building 4-Apr-02 0.0Maintenance Building 2-May-02 0.0Maintenance Building 4-Jun-02 0.0Maintenance Building 5-Jul-02 0.0Maintenance Building 6-Aug-02 0.0Maintenance Building 5-Sep-02 0.0
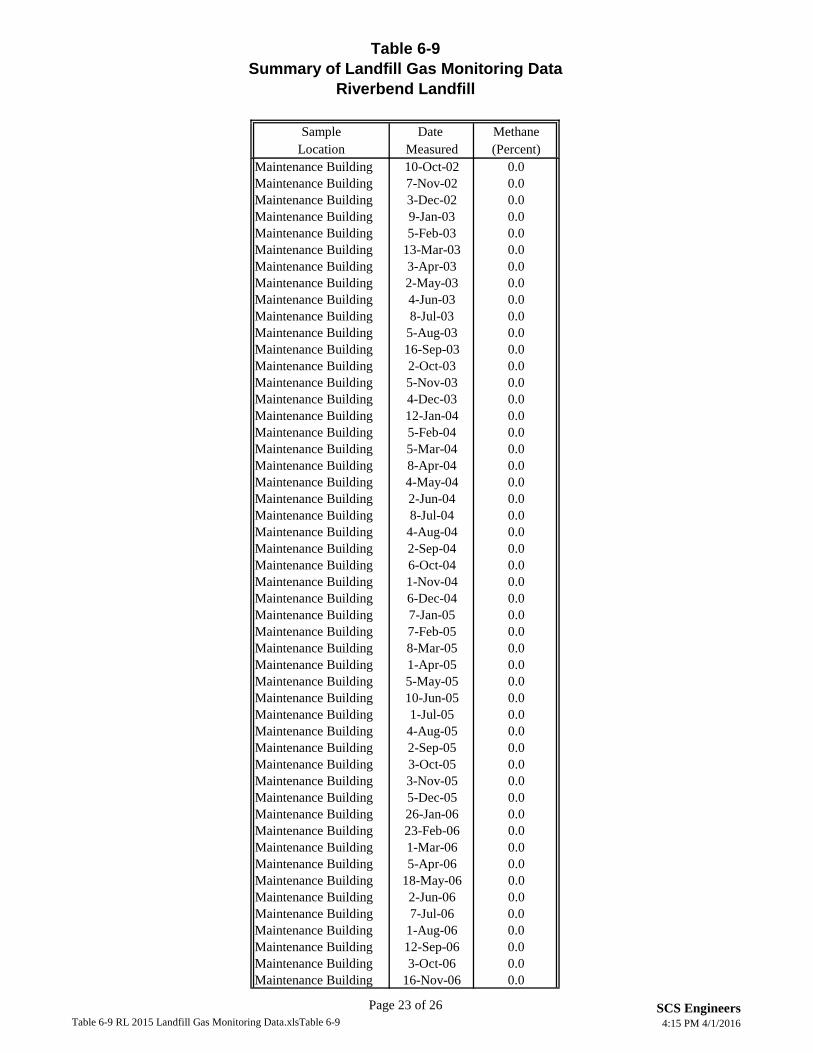
Table 6-9Summary of Landfill Gas Monitoring Data
Riverbend Landfill
Table 6-9 RL 2015 Landfill Gas Monitoring Data.xlsTable 6-9Page 23 of 26 SCS Engineers
4:15 PM 4/1/2016
Sample Date MethaneLocation Measured (Percent)
Maintenance Building 10-Oct-02 0.0Maintenance Building 7-Nov-02 0.0Maintenance Building 3-Dec-02 0.0Maintenance Building 9-Jan-03 0.0Maintenance Building 5-Feb-03 0.0Maintenance Building 13-Mar-03 0.0Maintenance Building 3-Apr-03 0.0Maintenance Building 2-May-03 0.0Maintenance Building 4-Jun-03 0.0Maintenance Building 8-Jul-03 0.0Maintenance Building 5-Aug-03 0.0Maintenance Building 16-Sep-03 0.0Maintenance Building 2-Oct-03 0.0Maintenance Building 5-Nov-03 0.0Maintenance Building 4-Dec-03 0.0Maintenance Building 12-Jan-04 0.0Maintenance Building 5-Feb-04 0.0Maintenance Building 5-Mar-04 0.0Maintenance Building 8-Apr-04 0.0Maintenance Building 4-May-04 0.0Maintenance Building 2-Jun-04 0.0Maintenance Building 8-Jul-04 0.0Maintenance Building 4-Aug-04 0.0Maintenance Building 2-Sep-04 0.0Maintenance Building 6-Oct-04 0.0Maintenance Building 1-Nov-04 0.0Maintenance Building 6-Dec-04 0.0Maintenance Building 7-Jan-05 0.0Maintenance Building 7-Feb-05 0.0Maintenance Building 8-Mar-05 0.0Maintenance Building 1-Apr-05 0.0Maintenance Building 5-May-05 0.0Maintenance Building 10-Jun-05 0.0Maintenance Building 1-Jul-05 0.0Maintenance Building 4-Aug-05 0.0Maintenance Building 2-Sep-05 0.0Maintenance Building 3-Oct-05 0.0Maintenance Building 3-Nov-05 0.0Maintenance Building 5-Dec-05 0.0Maintenance Building 26-Jan-06 0.0Maintenance Building 23-Feb-06 0.0Maintenance Building 1-Mar-06 0.0Maintenance Building 5-Apr-06 0.0Maintenance Building 18-May-06 0.0Maintenance Building 2-Jun-06 0.0Maintenance Building 7-Jul-06 0.0Maintenance Building 1-Aug-06 0.0Maintenance Building 12-Sep-06 0.0Maintenance Building 3-Oct-06 0.0Maintenance Building 16-Nov-06 0.0

Table 6-9Summary of Landfill Gas Monitoring Data
Riverbend Landfill
Table 6-9 RL 2015 Landfill Gas Monitoring Data.xlsTable 6-9Page 24 of 26 SCS Engineers
4:15 PM 4/1/2016
Sample Date MethaneLocation Measured (Percent)
Maintenance Building 12-Dec-06 0.0Maintenance Building 17-Jan-07 0.0Maintenance Building 7-Feb-07 0.0Maintenance Building 2-Mar-07 0.0Maintenance Building 3-Apr-07 0.0Maintenance Building 3-May-07 0.0Maintenance Building 1-Jun-07 0.0Maintenance Building 17-Jul-07 0.0Maintenance Building 21-Aug-07 0.0Maintenance Building 10-Sep-07 0.0Maintenance Building 3-Oct-07 0.0Maintenance Building 1-Nov-07 0.0Maintenance Building 13-Dec-07 0.0Maintenance Building 8-Jan-08 0.0Maintenance Building 25-Feb-08 0.0Maintenance Building 5-Mar-08 0.0Maintenance Building 24-Apr-08 0.0Maintenance Building 2-May-08 0.0Maintenance Building 2-Jun-08 0.0Maintenance Building 15-Jul-08 0.0Maintenance Building 4-Aug-08 0.0Maintenance Building 5-Sep-08 0.0Maintenance Building 21-Oct-08 0.0Maintenance Building 26-Nov-08 0.0Maintenance Building 1-Dec-08 0.0Maintenance Building 14-Jan-09 0.0Maintenance Building 2-Feb-09 0.0Maintenance Building 12-Mar-09 0.0Maintenance Building 10-Apr-09 0.0Maintenance Building 8-May-09 0.0Maintenance Building 8-Jun-09 0.0Maintenance Building 24-Jul-09 0.0Maintenance Building 17-Aug-09 0.0Maintenance Building 24-Sep-09 0.0Maintenance Building 12-Oct-09 0.0Maintenance Building 10-Nov-09 0.0Maintenance Building 28-Dec-09 0.0Maintenance Building 21-Jan-10 0.0Maintenance Building 11-Feb-10 0.0Maintenance Building 10-Mar-10 0.0Maintenance Building 9-Apr-10 0.0Maintenance Building 7-May-10 0.0Maintenance Building 2-Jun-10 0.0Maintenance Building 9-Jul-10 0.0Maintenance Building 4-Aug-10 0.0Maintenance Building 14-Sep-10 0.0Maintenance Building 11-Oct-10 0.0Maintenance Building 5-Nov-10 0.0Maintenance Building 8-Dec-10 0.0Maintenance Building 10-Jan-11 0.0

Table 6-9Summary of Landfill Gas Monitoring Data
Riverbend Landfill
Table 6-9 RL 2015 Landfill Gas Monitoring Data.xlsTable 6-9Page 25 of 26 SCS Engineers
4:15 PM 4/1/2016
Sample Date MethaneLocation Measured (Percent)
Maintenance Building 17-Feb-11 0.0Maintenance Building 10-Mar-11 0.0Maintenance Building 30-Mar-11 0.0Maintenance Building 21-Apr-11 0.0Maintenance Building 4-May-11 0.0Maintenance Building 11-May-11 0.0Maintenance Building 9-Jun-11 0.0Maintenance Building 8-Jul-11 0.0Maintenance Building 28-Jul-11 0.0Maintenance Building 10-Aug-11 0.0Maintenance Building 9-Sep-11 0.0Maintenance Building 14-Oct-11 0.0Maintenance Building 3-Nov-11 0.0Maintenance Building 9-Nov-11 0.0Maintenance Building 13-Dec-11 0.0Maintenance Building 12-Jan-12 0.0Maintenance Building 4-May-12 0.0Maintenance Building 23-Aug-12 0.0Maintenance Building 15-Nov-12 0.0
Maintenance Buildingb 21-Mar-13 0.0Maintenance Building 12-Apr-13 0.0Maintenance Building 12-Jul-13 0.0Maintenance Building 25-Oct-13 0.0Maintenance Building 13-Mar-14 0.0Maintenance Building 2-Jun-14 0.0Maintenance Building 31-Jul-14 0.0Maintenance Building 15-Dec-14 0.0Maintenance Building 4-Mar-15 0.0Maintenance Building 14-May-15 0.0Maintenance Building 16-Jul-15 0.0Maintenance Building 12-Nov-15 0.0LFGTE Plant Building 13-Mar-14 0.0LFGTE Plant Building 2-Jun-14 0.0LFGTE Plant Building 31-Jul-14 0.0LFGTE Plant Building 15-Dec-14 0.0LFGTE Plant Building 4-Mar-15 0.0LFGTE Plant Building 14-May-15 0.0LFGTE Plant Building 16-Jul-15 0.0LFGTE Plant Building 12-Nov-15 0.0

Table 6-9Summary of Landfill Gas Monitoring Data
Riverbend Landfill
Table 6-9 RL 2015 Landfill Gas Monitoring Data.xlsTable 6-9Page 26 of 26 SCS Engineers
4:15 PM 4/1/2016
Sample Date MethaneLocation Measured (Percent)
Operations Building 4-Mar-15 0.0Operations Building 14-May-15 0.0Operations Building 16-Jul-15 0.0Operations Building 12-Nov-15 0.0NOTE:LFGTE = landfill gas to energy.
b The former maintenance building (and the former gas collection and
control system [GCCS] building) was demolished in 2013 to accommodate construction of Phase IA of the mechanically stabilized earthen (MSE) berm. A new maintenance building was constructed in 2013.
a A new scale house was constructed in 2014 as part of front entrance
site development activities.

Table 7-1Summary of 2015 Monthly Pumping and Disposal Volumes of Leachate and LDS Liquid
Riverbend Landfill
Table 7-1 2015 Leachate Pumping Volume Data (Apr16)SCS Engineers
4/28/2016
2015 Monthly Liquid Pumping and Disposal Volumes (Gallons)
Monitoring Landfill Module January February March April May June July August September October November December
2015 Liquid
Volume Location or Area 2015 2015 2015 2015 2015 2015 2015 2015 2015 2015 2015 2015 (Gallons)
1/5P Modules 1 through 5 1,255,996 1,501,888 1,243,615 586,866 327,927 229,004 207,371 341,217 323,120 230,058 1,296,003 2,843,660 10,386,7256/7P Modules 6 and 7 70,780 57,512 66,819 62,284 61,393 55,947 58,353 52,085 46,125 45,536 45,265 32,025 654,1248P Module 8 324,568 426,990 462,598 344,271 353,360 322,192 282,817 153,954 171,876 249,561 399,914 395,118 3,887,2199P Module 9 1,066,272 1,784,514 252,186 165,816 101,262 72,210 62,682 50,472 40,276 49,644 254,531 475,920 4,375,785
Total Volumes 2,717,616 3,770,904 2,025,218 1,159,237 843,942 679,353 611,223 597,728 581,397 574,799 1,995,713 3,746,723 19,303,853
4/5S Modules 4 and 5 18,942 20,820 19,110 18,138 14,964 9,366 9,222 8,298 5,760 3,414 4,638 25,338 158,0106/7S Modules 6 and 7 2,087 2,439 3,021 2,179 1,453 1,656 1,638 1,472 1,223 1,083 1,506 2,315 22,0728S Module 8 979 1,023 1,104 902 1,130 1,400 1,063 714 1,517 896 2,077 2,618 15,4239S Module 9 17 0 0 1,308 1,345 11 1,237 1,171 1,305 0 1,185 1,140 8,719
Total Volumes 22,025 24,282 23,235 22,527 18,892 12,433 13,160 11,655 9,805 5,393 9,406 31,411 204,224
Leachate Pond LDS 34,576 24,362 24,362 2,637 1,021 652 697 329 341 1 751 20,665 110,394
Leachate Pond Leachate Pond 6,890,094 5,799,141 6,964,972 2,837,188 1,716,191 1,202,246 938,613 1,552,180 1,548,245 1,683,167 1,912,568 1,269,197 34,313,801
North Tanks GCCS 0 1,061,520 750,191 647,564 565,923 529,159 526,923 460,072 500,574 161,694 0 0 5,203,620
Total Volumes 6,890,094 6,860,661 7,715,163 3,484,752 2,282,114 1,731,405 1,465,536 2,012,252 2,048,819 1,844,861 1,912,568 1,269,197 39,517,421NOTES: LCRS = leachate collection and removal system; LDS = secondary leak detection system; P = primary; S = secondary; GCCS = gas collection and control system.a Volume of leachate pumped from each LCRS includes the volume of liquids pumped from its corresponding secondary leak detection sump.
b Volume of leachate and liquid disposed of off-site at approved treatment facilities in the truck haul program.
LCRS Pumping Volumesa
LDS Liquid Pumping Volumes
Disposal Volumesb

Table 7-2VOCs Detected in Landfill Module Leachate and LDS Sump Liquid Samples (µg/L)
Riverbend Landfill
Table 7-2 RL 2015 Leachate Sumps VOCs (Apr16)Table 7-2 Page 1 of 3SCS Engineers4/19/201612:37 PM
4-Iso- Iso-
Sample Sample propyl- propyl-Location Date Acetone Benzene benzene toluene
1/5 P 30-Dec-97 1,600 ND 2,900 ND ND ND ND ND ND 15 ND ND ND ND ND 11 ND ND ND 36 ND ND ND 4.0 ND ND ND ND ND ND ND1/5 P 17-Jun-98 540 D ND 900 D ND ND ND ND ND ND 18 D ND ND ND ND ND 27 D ND ND ND 35 D ND ND ND 4.9 D ND ND ND ND ND ND ND1/5 P 8-Jan-99 190 0.2 J 150 ND ND ND 0.5 J ND ND 1.3 ND ND ND ND ND 1.0 ND ND ND 8.3 2.0 J 0.6 J ND 3.3 0.4 J ND ND ND ND ND ND1/5 P 21-Jun-99 25 ND ND ND ND ND ND ND ND ND ND ND ND ND ND ND ND ND ND ND ND ND ND 3.5 ND ND ND ND ND ND ND1/5 P 6-Oct-99 ND ND ND ND ND ND ND ND ND ND ND 7.1 D ND ND ND ND ND ND ND ND ND ND ND ND ND ND ND ND ND ND ND1/5 P 15-Dec-99 250 2.8 420 ND ND ND ND ND ND 28 ND ND ND ND ND 5.9 ND ND ND 38 6.9 3.5 ND 6.6 ND ND ND ND ND 2.0 ND1/5 P 26-May-00 150 4.2 250 ND ND ND ND ND ND 33 ND 3.8 11 ND ND 9.8 ND ND 2.2 56 8.5 3.0 ND 9.0 ND 2.4 ND 7.5 ND 5.7 ND1/5 P 8-Nov-00 ND ND ND ND ND ND ND ND ND 30 ND 5.7 ND ND ND 8.5 ND ND ND 40 6.7 ND ND ND ND ND ND ND 10 7.6 ND1/5 P 26-Apr-01 670 ND 840 5.9 ND ND ND ND ND 8.8 ND ND 53 ND ND 9.1 ND ND ND 16 ND ND ND 4.6 ND ND ND ND 5.8 ND ND1/5 P (Dup) 26-Apr-01 720 ND 950 4.5 ND ND ND ND ND 7.0 ND ND 48 ND ND 7.2 ND ND ND 7.9 ND ND ND ND ND ND ND ND 4.5 ND ND1/5 P 15-Apr-02 1,900 ND 3,600 ND ND ND ND ND ND 36 ND 7.9 63 ND ND 22 ND ND ND 66 9.5 ND ND 11 ND ND ND ND 11 ND ND1/5 P (Dup) 15-Apr-02 1,200 ND 2,200 ND ND ND ND ND ND 34 ND 6.8 45 ND ND 17 ND ND ND 54 9.3 ND ND 11 ND ND ND ND 12 ND ND1/5 P 15-May-03 86 3 79 ND ND ND ND ND ND 19 ND ND ND ND ND 18 ND ND 1.0 36 4.5 1.7 ND 3.2 1.7 1.1 5.0 ND 7.1 ND ND1/5 P 23-Apr-04 190 2.7 280 ND ND ND ND ND ND 17 ND ND 20 ND ND 20 ND ND 0.92 41 5.9 1.7 ND 3.8 1.3 1.1 5.3 ND 8.5 5.3 ND1/5 P 26-May-05 150 1.8 190 ND ND ND ND ND ND 11 ND ND ND 0.7 ND 10 ND ND ND 23 3.6 1.1 ND 2.6 0.97 0.88 2.4 0.51 6.9 ND 271/5 P 15-May-06 ND ND ND ND ND ND ND ND ND ND 150 ND ND ND ND 21 ND ND ND 26 ND ND ND ND ND ND ND ND ND ND ND1/5 P 11-May-07 1,500 ND 3,100 ND ND ND ND ND ND 6.3 ND ND ND ND ND 24 ND ND ND 18 2.2 ND 3.4 ND ND ND ND ND 23 ND 721/5 P (Dup) 11-May-07 1,500 ND 3,100 ND ND ND ND ND ND 5.5 ND ND ND ND ND 24 ND ND ND 16 ND ND 3.4 ND ND ND ND ND ND ND 731/5 P 22-May-08 220 ND 450 ND ND ND ND ND ND 17 260 ND ND ND ND 13 ND ND ND 45 9.4 ND ND ND ND ND ND ND 6.7 ND ND1/5P 8-May-09 360 ND 580 ND ND ND ND ND ND 15 350 ND ND ND ND 11 ND ND ND 36 5.3 ND ND 5.9 ND ND ND ND 9.4 ND 381/5 P 23-Apr-10 310 ND ND ND ND ND ND ND ND ND ND ND ND ND ND 11 ND ND ND 21 ND ND ND ND ND ND ND ND 12 ND ND1/5 P 11-Apr-11 390 ND 520 ND ND ND ND ND ND 11 ND ND ND ND ND 11 ND ND ND 27 6.0 ND ND 3.8 ND ND ND ND 7.1 ND 301/5 P 1-May-12 1,300 ND 1,400 ND ND ND ND ND ND 14 ND ND ND ND ND 4.8 ND ND ND 28 6.5 ND ND 3.5 ND ND ND ND ND ND 211/5 P 10-Apr-13 71 2.6 64 ND ND ND ND ND ND 9.5 ND ND ND ND ND 6.2 ND ND ND 21 5.1 2.5 ND 2.7 ND ND 1.5 ND 6.2 ND 111/5 P 5-May-14 370 2.0 220 ND ND ND ND ND ND 9.9 ND ND ND ND ND 5.6 ND ND ND 18 4.4 1.6 ND 4.2 1.4 ND 1.5 ND 8.4 ND 201/5 P 8-May-15 740 2.8 370 ND ND ND ND ND ND 12 ND ND ND ND ND 7.0 ND ND ND 19 4.6 1.4 ND 4.9 1.4 1.8 1.6 ND 8.2 ND 274/5 S 30-Dec-97 ND ND ND ND ND ND 1.0 ND ND ND ND ND ND ND ND ND ND ND ND ND ND ND ND ND ND ND ND ND ND ND ND4/5 S 17-Jun-98 ND ND ND ND ND ND ND ND ND ND ND ND ND ND ND ND ND ND ND ND ND ND ND ND ND ND ND ND ND ND ND4/5 S 8-Jan-99 ND 0.4 J ND ND 0.5 ND 1.1 ND ND ND ND ND ND ND ND ND ND ND ND ND ND ND ND 0.2 J 0.6 ND ND ND ND ND ND4/5 S 21-Jun-99 ND ND ND 8.1 ND ND 0.64 ND ND ND ND ND ND ND ND ND ND ND ND ND ND ND ND ND ND ND ND ND ND ND ND4/5 S (Dup) 21-Jun-99 ND ND ND 10 ND ND 0.63 ND ND ND ND ND ND ND ND ND ND ND ND ND ND ND ND ND ND ND ND ND ND ND ND4/5 S 6-Oct-99 ND ND ND ND ND ND 0.77 ND ND ND ND ND ND ND ND ND ND ND ND ND ND ND ND ND ND ND ND ND ND ND ND4/5 S 15-Dec-99 ND ND ND 0.57 ND ND 0.55 ND ND ND ND ND ND ND ND ND ND ND ND ND ND ND ND ND ND ND ND ND ND ND ND4/5 S 26-May-00 ND ND ND 0.81 ND ND 0.69 ND ND ND ND ND ND ND ND ND ND ND ND ND ND ND ND ND 0.53 ND ND ND ND ND ND4/5 S 8-Nov-00 ND ND ND 1.1 ND ND ND ND ND ND ND ND ND ND ND ND ND ND ND ND ND ND ND ND ND ND ND ND ND ND ND4/5 S 26-Apr-01 ND ND ND ND ND ND 0.75 ND ND ND ND ND ND ND ND ND ND ND ND ND ND ND ND ND 0.7 ND ND ND ND ND ND4/5 S 15-Apr-02 ND 0.58 ND ND ND ND 0.59 ND ND ND ND ND ND ND ND ND ND ND ND ND ND ND ND ND 0.73 ND ND ND ND ND ND4/5 S 15-May-03 ND ND ND ND ND ND ND ND ND ND ND ND ND ND ND ND ND ND ND ND ND ND ND ND 0.79 ND ND ND ND ND ND4/5 S 23-Apr-04 ND 0.74 ND ND ND ND ND ND ND ND ND ND ND ND ND ND ND ND ND ND ND ND ND ND 0.74 ND ND ND ND ND ND4/5 S 26-May-05 ND 0.85 ND ND ND ND ND ND ND ND ND ND ND ND ND ND ND ND ND ND ND ND ND ND 0.67 ND ND ND 1.3 ND ND4/5 S 15-May-06 23 ND ND ND ND ND ND ND ND ND ND ND ND ND ND ND ND ND ND ND ND ND ND ND ND ND ND ND ND ND ND4/5 S 11-May-07 ND ND ND ND ND ND ND ND ND ND ND ND ND ND ND ND ND ND ND ND ND ND ND ND ND ND ND ND ND ND ND4/5 S 22-May-08 ND ND ND ND ND ND ND ND ND ND ND ND ND ND ND ND ND ND ND ND ND ND ND ND ND ND ND ND ND ND ND4/5 S 8-May-09 ND ND ND ND ND ND ND ND ND ND ND ND ND ND ND ND ND ND ND ND ND ND ND ND ND ND ND ND ND ND ND4/5 S 23-Apr-10 ND ND ND ND ND ND ND ND ND ND ND ND ND ND ND ND ND ND ND ND ND ND ND ND ND ND ND ND ND ND ND4/5 S (Dup) 23-Apr-10 ND ND ND ND ND ND ND ND ND ND ND ND ND ND ND ND ND ND ND ND ND ND ND ND ND ND ND ND ND ND ND4/5 S 11-Apr-11 ND ND ND ND ND ND ND ND ND ND ND ND ND ND ND ND ND ND ND ND ND ND ND ND ND ND ND ND ND ND ND4/5 S 1-May-12 ND ND ND ND ND ND ND ND ND ND ND ND ND ND ND ND ND ND ND ND ND ND ND ND ND ND ND ND ND ND ND4/5 S 11-Apr-13 ND ND ND ND ND ND ND ND ND ND ND ND ND ND ND ND ND ND ND ND ND ND ND ND ND ND ND ND ND ND ND4/5 S 5-May-14 13 ND ND ND ND ND ND ND ND ND ND ND ND ND ND ND ND ND ND ND ND ND ND ND ND ND ND ND ND ND ND4/5 S 8-May-15 ND ND ND ND ND ND ND ND ND ND ND ND ND ND ND ND ND ND ND ND ND ND ND ND ND ND ND ND ND ND ND6 P 30-Dec-97 900 ND 1,600 ND ND ND ND ND ND ND 340 16 ND ND ND ND ND ND ND ND ND ND ND ND ND ND ND ND ND ND ND6 P 17-Jun-98 9,100 D,E 5.7 D 22,000 D,E ND 4.8 D ND 15 D ND ND 10 D 62 D 77 D 140 D ND ND 620 D,E ND 2.6 D ND 36 D ND ND ND ND ND ND ND ND ND 2.8 D ND6 P 8-Jan-99 3,800 2.2 8,800 1.4 0.5 ND 3.8 0.4 J ND 8.8 650 4.0 ND 1.3 0.3 J 86 ND 0.8 0.9 24.3 2 J 0.8 J ND ND 1.6 3.0 J ND 0.3 J 2.0 J ND ND6 P 22-Jun-99 20 3.1 ND ND ND ND 4.7 ND ND 17 ND 8.3 ND ND ND 62 ND ND ND 31 ND ND ND ND ND ND ND ND ND ND ND6 P 6-Oct-99 620 D ND ND ND ND ND 4.0 D ND ND 5 D ND 9.6 D ND ND ND ND ND ND ND 51 D ND 2.8 D ND 3.8 D ND ND ND ND ND 2.9 D ND6 P 15-Dec-99 590 2.3 1,500 ND ND ND ND ND ND 24 ND ND ND ND ND 17 ND ND ND 37 6.4 3.4 ND 2.4 ND ND ND ND ND 3.7 ND6 P (Dup) 15-Dec-99 580 2.14 1,500 ND ND ND ND ND ND 22 ND ND ND ND ND 17 ND ND ND 36 6.0 2.8 ND 2.4 ND ND ND ND ND 3.3 ND
4-Methyl-
ethenebenzene benzeneDichloro-
benzenechloro-
benzenep-
Tri-
Chloride Ketone Styrene chloride Xylenes benzenemethyl-
ethene Toluene ethane ethenechloro- chloro-
n-Propyl-
1,3-Di-2-Hexa lene Isobutyl methyl- Naph-
Methyl- Methyl Tetra-chloro-
1,1,1- 1,3,5-1,4-Di- cis-1,2-
1,2,4-
ethene
Di-
(MEK) Disulfide
bromo-Carbon Chloro- chloro-none
2-Buta- 1,2-Di-1,1-Di-chloro-
noneEthyl-
ethane methane ethane ethane Cymene2-penta-
nonechloro- chloro-
thaleneVinyl
benzenechloro-
1,1-Di- Tri-Tri- Tri-Total
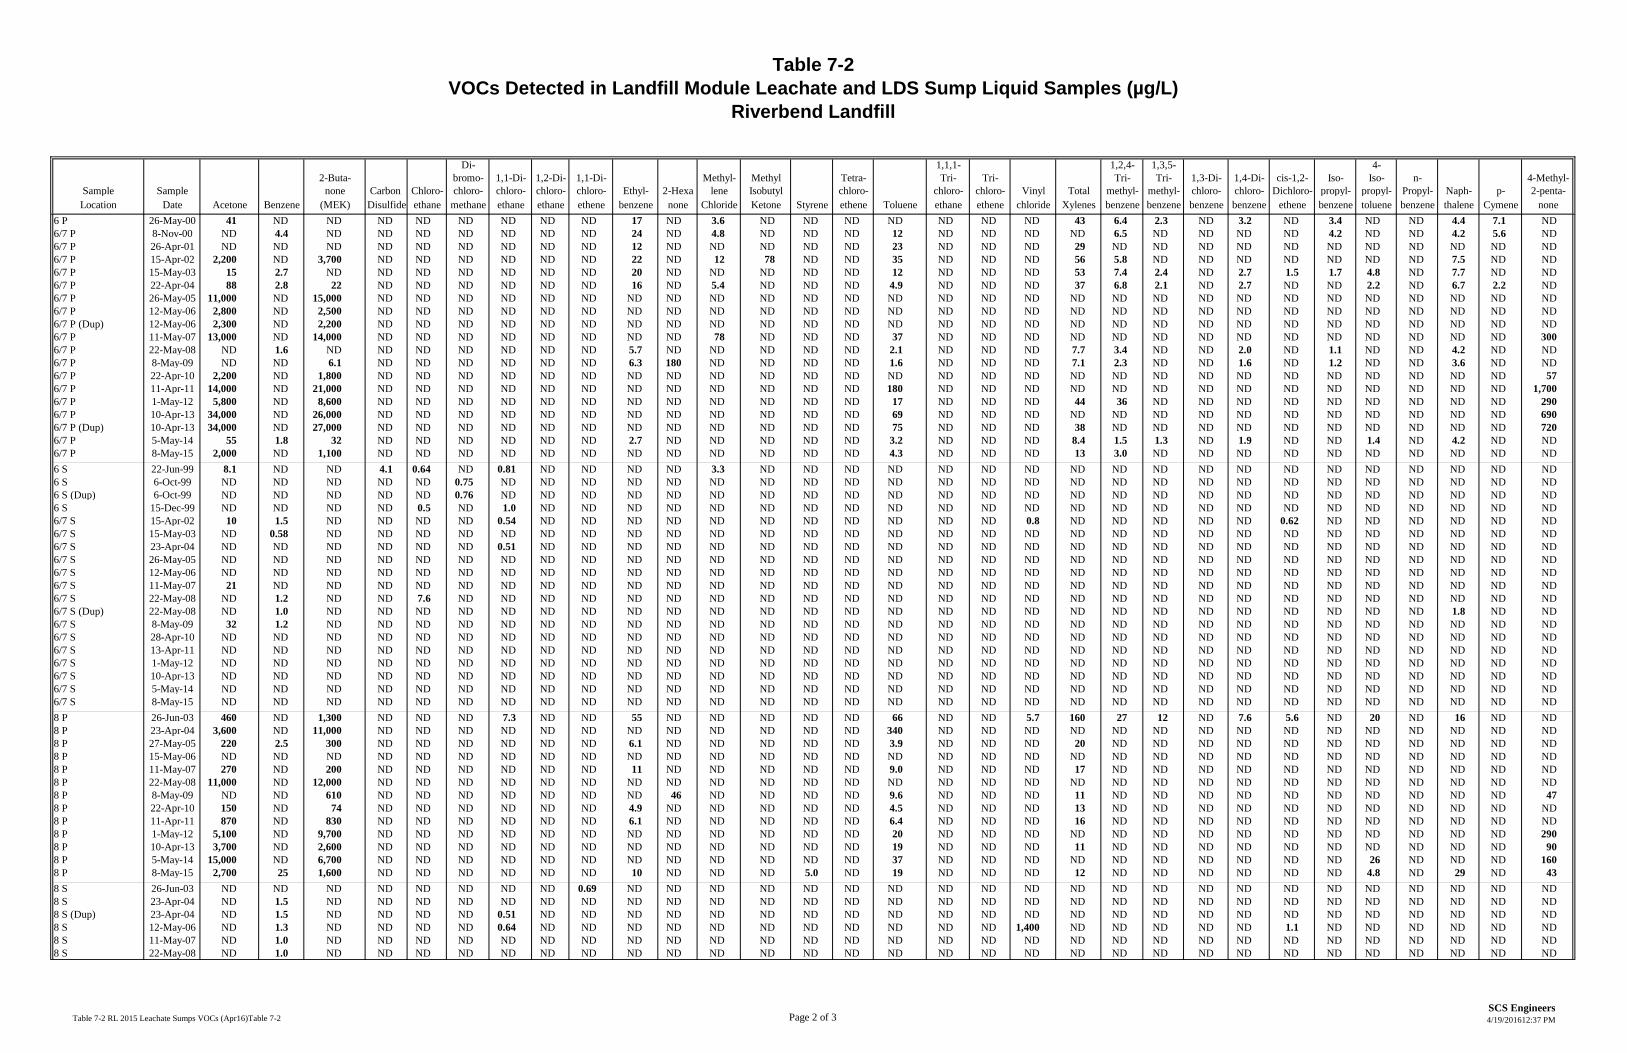
Table 7-2VOCs Detected in Landfill Module Leachate and LDS Sump Liquid Samples (µg/L)
Riverbend Landfill
Table 7-2 RL 2015 Leachate Sumps VOCs (Apr16)Table 7-2 Page 2 of 3SCS Engineers4/19/201612:37 PM
4-Iso- Iso-
Sample Sample propyl- propyl-Location Date Acetone Benzene benzene toluene
4-Methyl-
ethenebenzene benzeneDichloro-
benzenechloro-
benzenep-
Tri-
Chloride Ketone Styrene chloride Xylenes benzenemethyl-
ethene Toluene ethane ethenechloro- chloro-
n-Propyl-
1,3-Di-2-Hexa lene Isobutyl methyl- Naph-
Methyl- Methyl Tetra-chloro-
1,1,1- 1,3,5-1,4-Di- cis-1,2-
1,2,4-
ethene
Di-
(MEK) Disulfide
bromo-Carbon Chloro- chloro-none
2-Buta- 1,2-Di-1,1-Di-chloro-
noneEthyl-
ethane methane ethane ethane Cymene2-penta-
nonechloro- chloro-
thaleneVinyl
benzenechloro-
1,1-Di- Tri-Tri- Tri-Total
6 P 26-May-00 41 ND ND ND ND ND ND ND ND 17 ND 3.6 ND ND ND ND ND ND ND 43 6.4 2.3 ND 3.2 ND 3.4 ND ND 4.4 7.1 ND6/7 P 8-Nov-00 ND 4.4 ND ND ND ND ND ND ND 24 ND 4.8 ND ND ND 12 ND ND ND ND 6.5 ND ND ND ND 4.2 ND ND 4.2 5.6 ND6/7 P 26-Apr-01 ND ND ND ND ND ND ND ND ND 12 ND ND ND ND ND 23 ND ND ND 29 ND ND ND ND ND ND ND ND ND ND ND6/7 P 15-Apr-02 2,200 ND 3,700 ND ND ND ND ND ND 22 ND 12 78 ND ND 35 ND ND ND 56 5.8 ND ND ND ND ND ND ND 7.5 ND ND6/7 P 15-May-03 15 2.7 ND ND ND ND ND ND ND 20 ND ND ND ND ND 12 ND ND ND 53 7.4 2.4 ND 2.7 1.5 1.7 4.8 ND 7.7 ND ND6/7 P 22-Apr-04 88 2.8 22 ND ND ND ND ND ND 16 ND 5.4 ND ND ND 4.9 ND ND ND 37 6.8 2.1 ND 2.7 ND ND 2.2 ND 6.7 2.2 ND6/7 P 26-May-05 11,000 ND 15,000 ND ND ND ND ND ND ND ND ND ND ND ND ND ND ND ND ND ND ND ND ND ND ND ND ND ND ND ND6/7 P 12-May-06 2,800 ND 2,500 ND ND ND ND ND ND ND ND ND ND ND ND ND ND ND ND ND ND ND ND ND ND ND ND ND ND ND ND6/7 P (Dup) 12-May-06 2,300 ND 2,200 ND ND ND ND ND ND ND ND ND ND ND ND ND ND ND ND ND ND ND ND ND ND ND ND ND ND ND ND6/7 P 11-May-07 13,000 ND 14,000 ND ND ND ND ND ND ND ND 78 ND ND ND 37 ND ND ND ND ND ND ND ND ND ND ND ND ND ND 3006/7 P 22-May-08 ND 1.6 ND ND ND ND ND ND ND 5.7 ND ND ND ND ND 2.1 ND ND ND 7.7 3.4 ND ND 2.0 ND 1.1 ND ND 4.2 ND ND6/7 P 8-May-09 ND ND 6.1 ND ND ND ND ND ND 6.3 180 ND ND ND ND 1.6 ND ND ND 7.1 2.3 ND ND 1.6 ND 1.2 ND ND 3.6 ND ND6/7 P 22-Apr-10 2,200 ND 1,800 ND ND ND ND ND ND ND ND ND ND ND ND ND ND ND ND ND ND ND ND ND ND ND ND ND ND ND 576/7 P 11-Apr-11 14,000 ND 21,000 ND ND ND ND ND ND ND ND ND ND ND ND 180 ND ND ND ND ND ND ND ND ND ND ND ND ND ND 1,7006/7 P 1-May-12 5,800 ND 8,600 ND ND ND ND ND ND ND ND ND ND ND ND 17 ND ND ND 44 36 ND ND ND ND ND ND ND ND ND 2906/7 P 10-Apr-13 34,000 ND 26,000 ND ND ND ND ND ND ND ND ND ND ND ND 69 ND ND ND ND ND ND ND ND ND ND ND ND ND ND 6906/7 P (Dup) 10-Apr-13 34,000 ND 27,000 ND ND ND ND ND ND ND ND ND ND ND ND 75 ND ND ND 38 ND ND ND ND ND ND ND ND ND ND 7206/7 P 5-May-14 55 1.8 32 ND ND ND ND ND ND 2.7 ND ND ND ND ND 3.2 ND ND ND 8.4 1.5 1.3 ND 1.9 ND ND 1.4 ND 4.2 ND ND6/7 P 8-May-15 2,000 ND 1,100 ND ND ND ND ND ND ND ND ND ND ND ND 4.3 ND ND ND 13 3.0 ND ND ND ND ND ND ND ND ND ND6 S 22-Jun-99 8.1 ND ND 4.1 0.64 ND 0.81 ND ND ND ND 3.3 ND ND ND ND ND ND ND ND ND ND ND ND ND ND ND ND ND ND ND6 S 6-Oct-99 ND ND ND ND ND 0.75 ND ND ND ND ND ND ND ND ND ND ND ND ND ND ND ND ND ND ND ND ND ND ND ND ND6 S (Dup) 6-Oct-99 ND ND ND ND ND 0.76 ND ND ND ND ND ND ND ND ND ND ND ND ND ND ND ND ND ND ND ND ND ND ND ND ND6 S 15-Dec-99 ND ND ND ND 0.5 ND 1.0 ND ND ND ND ND ND ND ND ND ND ND ND ND ND ND ND ND ND ND ND ND ND ND ND6/7 S 15-Apr-02 10 1.5 ND ND ND ND 0.54 ND ND ND ND ND ND ND ND ND ND ND 0.8 ND ND ND ND ND 0.62 ND ND ND ND ND ND6/7 S 15-May-03 ND 0.58 ND ND ND ND ND ND ND ND ND ND ND ND ND ND ND ND ND ND ND ND ND ND ND ND ND ND ND ND ND6/7 S 23-Apr-04 ND ND ND ND ND ND 0.51 ND ND ND ND ND ND ND ND ND ND ND ND ND ND ND ND ND ND ND ND ND ND ND ND6/7 S 26-May-05 ND ND ND ND ND ND ND ND ND ND ND ND ND ND ND ND ND ND ND ND ND ND ND ND ND ND ND ND ND ND ND6/7 S 12-May-06 ND ND ND ND ND ND ND ND ND ND ND ND ND ND ND ND ND ND ND ND ND ND ND ND ND ND ND ND ND ND ND6/7 S 11-May-07 21 ND ND ND ND ND ND ND ND ND ND ND ND ND ND ND ND ND ND ND ND ND ND ND ND ND ND ND ND ND ND6/7 S 22-May-08 ND 1.2 ND ND 7.6 ND ND ND ND ND ND ND ND ND ND ND ND ND ND ND ND ND ND ND ND ND ND ND ND ND ND6/7 S (Dup) 22-May-08 ND 1.0 ND ND ND ND ND ND ND ND ND ND ND ND ND ND ND ND ND ND ND ND ND ND ND ND ND ND 1.8 ND ND6/7 S 8-May-09 32 1.2 ND ND ND ND ND ND ND ND ND ND ND ND ND ND ND ND ND ND ND ND ND ND ND ND ND ND ND ND ND6/7 S 28-Apr-10 ND ND ND ND ND ND ND ND ND ND ND ND ND ND ND ND ND ND ND ND ND ND ND ND ND ND ND ND ND ND ND6/7 S 13-Apr-11 ND ND ND ND ND ND ND ND ND ND ND ND ND ND ND ND ND ND ND ND ND ND ND ND ND ND ND ND ND ND ND6/7 S 1-May-12 ND ND ND ND ND ND ND ND ND ND ND ND ND ND ND ND ND ND ND ND ND ND ND ND ND ND ND ND ND ND ND6/7 S 10-Apr-13 ND ND ND ND ND ND ND ND ND ND ND ND ND ND ND ND ND ND ND ND ND ND ND ND ND ND ND ND ND ND ND6/7 S 5-May-14 ND ND ND ND ND ND ND ND ND ND ND ND ND ND ND ND ND ND ND ND ND ND ND ND ND ND ND ND ND ND ND6/7 S 8-May-15 ND ND ND ND ND ND ND ND ND ND ND ND ND ND ND ND ND ND ND ND ND ND ND ND ND ND ND ND ND ND ND8 P 26-Jun-03 460 ND 1,300 ND ND ND 7.3 ND ND 55 ND ND ND ND ND 66 ND ND 5.7 160 27 12 ND 7.6 5.6 ND 20 ND 16 ND ND8 P 23-Apr-04 3,600 ND 11,000 ND ND ND ND ND ND ND ND ND ND ND ND 340 ND ND ND ND ND ND ND ND ND ND ND ND ND ND ND8 P 27-May-05 220 2.5 300 ND ND ND ND ND ND 6.1 ND ND ND ND ND 3.9 ND ND ND 20 ND ND ND ND ND ND ND ND ND ND ND8 P 15-May-06 ND ND ND ND ND ND ND ND ND ND ND ND ND ND ND ND ND ND ND ND ND ND ND ND ND ND ND ND ND ND ND8 P 11-May-07 270 ND 200 ND ND ND ND ND ND 11 ND ND ND ND ND 9.0 ND ND ND 17 ND ND ND ND ND ND ND ND ND ND ND8 P 22-May-08 11,000 ND 12,000 ND ND ND ND ND ND ND ND ND ND ND ND ND ND ND ND ND ND ND ND ND ND ND ND ND ND ND ND8 P 8-May-09 ND ND 610 ND ND ND ND ND ND ND 46 ND ND ND ND 9.6 ND ND ND 11 ND ND ND ND ND ND ND ND ND ND 478 P 22-Apr-10 150 ND 74 ND ND ND ND ND ND 4.9 ND ND ND ND ND 4.5 ND ND ND 13 ND ND ND ND ND ND ND ND ND ND ND8 P 11-Apr-11 870 ND 830 ND ND ND ND ND ND 6.1 ND ND ND ND ND 6.4 ND ND ND 16 ND ND ND ND ND ND ND ND ND ND ND8 P 1-May-12 5,100 ND 9,700 ND ND ND ND ND ND ND ND ND ND ND ND 20 ND ND ND ND ND ND ND ND ND ND ND ND ND ND 2908 P 10-Apr-13 3,700 ND 2,600 ND ND ND ND ND ND ND ND ND ND ND ND 19 ND ND ND 11 ND ND ND ND ND ND ND ND ND ND 908 P 5-May-14 15,000 ND 6,700 ND ND ND ND ND ND ND ND ND ND ND ND 37 ND ND ND ND ND ND ND ND ND ND 26 ND ND ND 1608 P 8-May-15 2,700 25 1,600 ND ND ND ND ND ND 10 ND ND ND 5.0 ND 19 ND ND ND 12 ND ND ND ND ND ND 4.8 ND 29 ND 438 S 26-Jun-03 ND ND ND ND ND ND ND ND 0.69 ND ND ND ND ND ND ND ND ND ND ND ND ND ND ND ND ND ND ND ND ND ND8 S 23-Apr-04 ND 1.5 ND ND ND ND ND ND ND ND ND ND ND ND ND ND ND ND ND ND ND ND ND ND ND ND ND ND ND ND ND8 S (Dup) 23-Apr-04 ND 1.5 ND ND ND ND 0.51 ND ND ND ND ND ND ND ND ND ND ND ND ND ND ND ND ND ND ND ND ND ND ND ND8 S 12-May-06 ND 1.3 ND ND ND ND 0.64 ND ND ND ND ND ND ND ND ND ND ND 1,400 ND ND ND ND ND 1.1 ND ND ND ND ND ND8 S 11-May-07 ND 1.0 ND ND ND ND ND ND ND ND ND ND ND ND ND ND ND ND ND ND ND ND ND ND ND ND ND ND ND ND ND8 S 22-May-08 ND 1.0 ND ND ND ND ND ND ND ND ND ND ND ND ND ND ND ND ND ND ND ND ND ND ND ND ND ND ND ND ND

Table 7-2VOCs Detected in Landfill Module Leachate and LDS Sump Liquid Samples (µg/L)
Riverbend Landfill
Table 7-2 RL 2015 Leachate Sumps VOCs (Apr16)Table 7-2 Page 3 of 3SCS Engineers4/19/201612:37 PM
4-Iso- Iso-
Sample Sample propyl- propyl-Location Date Acetone Benzene benzene toluene
4-Methyl-
ethenebenzene benzeneDichloro-
benzenechloro-
benzenep-
Tri-
Chloride Ketone Styrene chloride Xylenes benzenemethyl-
ethene Toluene ethane ethenechloro- chloro-
n-Propyl-
1,3-Di-2-Hexa lene Isobutyl methyl- Naph-
Methyl- Methyl Tetra-chloro-
1,1,1- 1,3,5-1,4-Di- cis-1,2-
1,2,4-
ethene
Di-
(MEK) Disulfide
bromo-Carbon Chloro- chloro-none
2-Buta- 1,2-Di-1,1-Di-chloro-
noneEthyl-
ethane methane ethane ethane Cymene2-penta-
nonechloro- chloro-
thaleneVinyl
benzenechloro-
1,1-Di- Tri-Tri- Tri-Total
8 S 8-May-09 ND ND ND ND ND ND ND ND ND ND ND ND ND ND ND ND ND ND ND ND ND ND ND ND ND ND ND ND ND ND ND8 S (Dup) 8-May-09 ND ND ND ND ND ND ND ND ND ND ND ND ND ND ND ND ND ND ND ND ND ND ND ND ND ND ND ND ND ND ND8 S 22-Apr-10 ND ND ND ND ND ND ND ND ND ND ND ND ND ND ND ND ND ND ND ND ND ND ND ND ND ND ND ND ND ND ND8 S 11-Apr-11 ND ND ND ND ND ND ND ND ND ND ND ND ND ND ND ND ND ND ND ND ND ND ND ND ND ND ND ND ND ND ND8 S (Dup) 11-Apr-11 ND ND ND ND ND ND ND ND ND ND ND ND ND ND ND ND ND ND ND ND ND ND ND ND ND ND ND ND ND ND ND8 S 1-May-12 ND ND ND ND ND ND ND ND ND ND ND ND ND ND ND ND ND ND ND ND ND ND ND ND ND ND ND ND ND ND ND8 S 11-Apr-13 ND ND ND ND ND ND ND ND ND ND ND ND ND ND ND ND ND ND ND ND ND ND ND ND ND ND ND ND ND ND ND8 S 5-May-14 ND ND ND ND ND ND ND ND ND ND ND ND ND ND ND ND ND ND ND ND ND ND ND ND ND ND ND ND ND ND ND8 S (Dup) 5-May-14 ND ND ND ND ND ND ND ND ND ND ND ND ND ND ND ND ND ND ND ND ND ND ND ND ND ND ND ND ND ND ND8 S 8-May-15 ND ND ND ND ND ND ND ND ND ND ND ND ND ND ND ND ND ND ND ND ND ND ND ND ND ND ND ND ND ND ND8 S (Dup) 8-May-15 ND ND ND ND ND ND ND ND ND ND ND ND ND ND ND ND ND ND ND ND ND ND ND ND ND ND ND ND ND ND ND9 P 8-May-15 3,900 ND 7,200 ND ND ND ND ND ND ND ND ND ND ND ND 360 ND ND ND ND ND ND ND ND ND ND ND ND ND ND 1409 S 8-May-15 13 ND ND ND ND ND 5.6 1.3 ND ND ND ND ND ND ND 2.6 ND ND ND ND ND ND ND ND ND ND ND ND ND ND NDLeachate Pond 8-Apr-13 230 ND 110 ND ND ND ND ND ND ND ND ND ND ND ND ND ND ND ND ND ND ND ND ND ND ND ND ND ND ND NDLeachate Pond 21-Nov-13 ND ND ND ND ND ND ND ND ND ND ND ND ND ND ND ND ND ND ND ND ND ND ND ND ND ND ND ND ND ND NDLeachate Pond 5-May-14 1,100 ND 580 ND ND ND ND ND ND ND ND ND ND ND ND ND ND ND ND ND ND ND ND ND ND ND ND ND ND ND NDLeachate Pond 20-Nov-14 1,400 ND 460 ND ND ND ND ND ND ND ND ND ND ND ND ND ND ND ND ND ND ND ND ND ND ND ND ND ND ND NDLeachate Pond 11-May-15 910 ND 630 ND ND ND ND ND ND ND ND ND ND ND ND ND ND ND ND ND ND ND ND ND ND ND ND ND ND ND NDLeachate Pond 11-Nov-15 850 ND 250 ND ND ND ND ND ND ND ND ND ND ND ND ND ND ND ND ND ND ND ND ND ND ND ND ND ND ND NDLeachate Pond LDS 11-Apr-13 230 ND 570 ND ND ND ND ND ND ND ND ND ND ND ND ND ND ND ND ND ND ND ND ND ND ND ND ND ND ND NDLeachate Pond LDS 21-Nov-13 12 ND ND ND ND ND ND ND ND ND ND ND ND ND ND 10 ND ND ND ND ND ND ND ND ND ND ND ND ND ND NDLeachate Pond LDS 5-May-14 1,000 ND 660 ND ND ND ND ND ND ND ND ND ND ND ND 5.8 ND ND ND ND ND ND ND ND ND ND ND ND ND ND 8.0Leachate Pond LDS 20-Nov-14 110 1.2 34 ND ND ND ND ND ND ND ND ND ND ND ND 5.9 ND ND ND ND ND ND ND ND ND ND ND ND ND ND NDLeachate Pond LDS 11-May-15 13 ND 18 ND ND ND ND ND ND ND ND ND ND ND ND 4.5 ND ND ND ND ND ND ND ND ND ND ND ND ND ND 14Leachate Pond LDS 11-Nov-15 ND 1.3 ND ND ND ND ND ND ND ND ND ND ND ND ND 3.0 ND ND ND ND ND ND ND ND ND ND ND ND ND ND ND
NOTE: Detections are in bold type; LDS = secondary leak detection system; NT = not tested; ND = not detected at or above the practical quantitation limit; D = compounds identified in analysis at a secondary dilution factor; J = indicates an estimate value; E = compounds whose concentrations were above the calibration range of the GC/MS instrument for that analysis; µg/L = micrograms per liter.
P r e p a r e d f o r R i v e r b e n d L a n d f i l l C o m p a n y
R i v e r b e n d L a n d f i l l 0 4 2 0 8 0 2 2 . 1 6 2 0 1 5 A n n u a l E n v i r o n m e n t a l M o n i t o r i n g R e p o r t
F I G U R E S


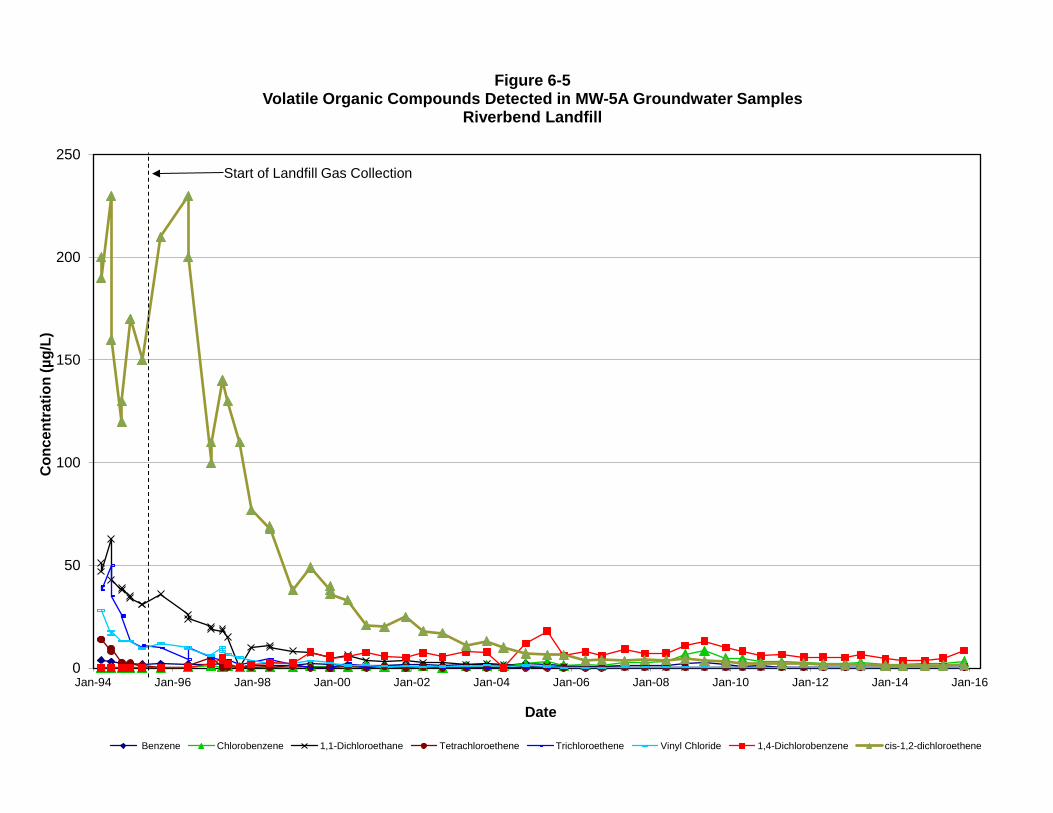
0
50
100
150
200
250
Jan-94 Jan-96 Jan-98 Jan-00 Jan-02 Jan-04 Jan-06 Jan-08 Jan-10 Jan-12 Jan-14 Jan-16
Con
cent
ratio
n (µ
g/L)
Date
Figure 6-5Volatile Organic Compounds Detected in MW-5A Groundwater Samples
Riverbend Landfill
Benzene Chlorobenzene 1,1-Dichloroethane Tetrachloroethene Trichloroethene Vinyl Chloride 1,4-Dichlorobenzene cis-1,2-dichloroethene
Start of Landfill Gas Collection

Figure 6-6: MW-5A Groundwater and Sump 1/5 P Leachate
CaCations % meq/l
Na+KMg
80 60 40 20
20
40
60
80
ClAnions
SO4
HCO
3
20 40 60 80
20
40
60
80
Ca+MgSO
4+Cl
20
40
60
80
20
40
60
80
20
40
60
80
20
40
60
80
1/5 P 5/06/2015 - 5/26/2015MW-5A 5/06/2015 - 5/26/2015
1 Prepared by: SCS Engineers1

Figure 6-7: MW-5A Groundwater and Sump 1/5 P Leachate
Ca Cl
Na+K HCO3
Mg SO4
100 80 60 40 20 0 20 40 60 80 100
100 80 60 40 20 0 20 40 60 80 100
Cations (meq/l) Anions (meq/l)
1/5 P 5/06/2015 - 5/26/2015
MW-5A 5/06/2015 - 5/26/2015
1 Prepared by: SCS Engineers1

Figure 7-1: Riverbend Landfill 2015 Shallow Groundwater, LCRS and LDS Samples
Ca
Cations % meq/l
Na+KMg
80 60 40 20
20
40
60
80
Cl
Anions
SO4
HCO
3
20 40 60 80
20
40
60
80
Ca+MgSO
4+Cl
20
40
60
80
20
40
60
80
20
40
60
80
20
40
60
80
1/5 P 5/06/2015 - 5/26/20154/5 S 5/06/2015 - 5/26/20156/7 P 5/06/2015 - 5/26/20156/7 S 5/06/2015 - 5/26/20158P 5/06/2015 - 5/26/20158S 5/06/2015 - 5/26/20159P 5/06/2015 - 5/26/20159S 5/06/2015 - 5/26/2015MW-12A 5/06/2015 - 5/26/2015
MW-12A 11/11/2015 -11/12/2015MW-14A 5/06/2015 - 5/26/2015MW-14A 12/28/2015 MW-15A 5/06/2015 - 5/26/2015MW-15A 12/28/2015 MW-16A 5/06/2015 - 5/26/2015MW-16A 12/28/2015 MW-21A 5/06/2015 - 5/26/2015MW-21A 11/11/2015 -11/12/2015
1 Prepared by: SCS Engineers1

Figure 7-2: Riverbend Landfill 2015 Leachate Pond, LDS Liquid, and Nearby Groundwater Samples
CaCations % meq/l
Na+KMg
80 60 40 20
20
40
60
80
ClAnions
SO4
HCO
3
20 40 60 80
20
40
60
80
Ca+MgSO
4+Cl
20
40
60
80
20
40
60
80
20
40
60
80
20
40
60
80
LEACHATE POND 5/06/2015 - 5/26/2015LEACHATE POND 11/11/2015 - 11/12/2015LPOND LDS 5/06/2015 - 5/26/2015LPOND LDS 11/11/2015 - 11/12/2015MW-14A 5/06/2015 - 5/26/2015MW-14A 12/28/2015 MW-14B 5/06/2015 - 5/26/2015MW-14B 11/11/2015 - 11/12/2015MW-21A 5/06/2015 - 5/26/2015MW-21A 11/11/2015 - 11/12/2015
MW-21B 5/06/2015 - 5/26/2015MW-21B 11/11/2015 - 11/12/2015MW-22A 12/28/2015
1 Prepared by: SCS Engineers1