sublethal effects of sodium nitrate on developmental rate and body
TRANSCRIPT

SUBLETHAL EFFECTS OF SODIUM NITRATE ON DEVELOPMENTAL RATE
AND BODY LENGTH IN SOUTHERN TOAD (Bufo terrestris) TADPOLES
By
ESTHER MARIE LANGAN
A THESIS PRESENTED TO THE GRADUATE SCHOOL OF THE UNIVERSITY OF FLORIDA IN PARTIAL FULFILLMENT
OF THE REQUIREMENTS FOR THE DEGREE OF MASTER OF SCIENCE
UNIVERSITY OF FLORIDA
2003

ii
ACKNOWLEDGMENTS
I wish to thank my advisor, Dr. Max Nickerson, and my committee, Dr. Peter
Frederick and Dr. Louis Guillette, Jr., for their invaluable guidance, advice, and support
in this project. Dr. Frank Nordlie, Dr. Lauren Chapman, and Dr. Gary Butcher provided
essential equipment during the course of this study.
I also wish to thank all of my friends, especially Daniel Janes, Patricia Gomez and
Thea Edwards for their assistance during the course of this project and for providing
adequate motivation when necessary. My gratitude is further extended to my
undergraduate volunteers, without whom this project would not have been completed. I
am indebted to my parents for their undying support and encouragement when morale
was lacking.

iii
TABLE OF CONTENTS page ACKNOWLEDGMENTS .................................................................................................. ii
LIST OF FIGURES ........................................................................................................... iv
ABSTRACT....................................................................................................................... vi
CHAPTER
1 AMPHIBIAN DECLINES AND NITRATES .............................................................1
Global Amphibian Declines .........................................................................................1 Nitrate Fertilizers ..........................................................................................................2 Effects of Nitrates on Amphibians ...............................................................................3 Summary.......................................................................................................................5
2 SOUTHERN TOAD (Bufo terrestris) AND TADPOLE DEVELOPMENT AND
GROWTH.....................................................................................................................7
Natural history ..............................................................................................................7 Tadpole metamorphosis: growth and development ......................................................8
3 SUBLETHAL EFFECTS OF SODIUM NITRATE ON DEVELOPMENTAL
RATE AND BODY LENGTH IN SOUTHERN TOAD TADPOLES (Bufo terrestris) .....................................................................................................................11
Introduction.................................................................................................................11 Materials and Methods ...............................................................................................13
Animals................................................................................................................13 Materials ..............................................................................................................14 Experimental design ............................................................................................15 Statistical Analysis ..............................................................................................17
Results.........................................................................................................................17 Discussion...................................................................................................................20 Future Research ..........................................................................................................25
LIST OF REFERENCES...................................................................................................50
BIOGRAPHICAL SKETCH .............................................................................................55

iv
LIST OF FIGURES
Figure page 3-1 Mean tadpole body length by treatment over time...................................................28
3-2 Mean body length by clutch in 0 mg/L NaNO3 treatment .......................................29
3-3 Mean body length by clutch in 5 mg/L NaNO3 treatment .......................................30
3-4 Mean body length by clutch in 15 mg/L NaNO3 treatment .....................................31
3-5 Mean body length by clutch in 15 mg/L NaNO3 treatment, excluding outlier ........32
3-6 Mean body length by clutch in 30 mg/L NaNO3 treatment ....................................33
3-7 Average time to metamorphosis per treatment ........................................................34
3-8 Mean tadpole Gosner stage by treatment over time.................................................35
3-9 Mean Gosner stage by clutch in 0 mg/L NaNO3 treatment......................................36
3-10 Mean Gosner stage by clutch in 5 mg/L NaNO3 treatment......................................37
3-11 Mean Gosner stage by clutch in 15 mg/L NaNO3 treatment....................................38
3-12 Mean Gosner stage by clutch in 15 mg/L NaNO3 treatment excluding outlier .......39
3-13 Mean Gosner stage by clutch in 30 mg/L NaNO3 treatment....................................40
3-14 Maximum and minimum temperatures for 0 mg/L NaNO3 treatment. ....................41
3-15 Maximum and minimum temperatures for 5 mg/L NaNO3 treatment. ....................42
3-16 Maximum and minimum temperatures for 5 mg/L NaNO3 treatment. ....................42
3-17 Overall mortality ......................................................................................................43
3-18 Total number of dead tapdoles per replicate ............................................................43
3-19 Total number of dead tadpoles per clutch. ...............................................................44

v
3-20 Proportion of deceased individuals, metamorphs, and tadpoles for 0 mg/L NaNO3 treatment. .....................................................................................................45
3-21 Proportion of deceased individuals, metamorphs, and tadpoles for 5 mg/L NaNO3 treatment. .....................................................................................................46
3-22 Proportion of deceased individuals, metamorphs, and tadpoles for 15 mg/L NaNO3 treatment. .....................................................................................................47
3-23 Proportion of deceased individuals, metamorphs, and tadpoles for 30 mg/L NaNO3 treatment. .....................................................................................................48
3-24 Proportion of new metamorphs ................................................................................49

vi
Abstract of Thesis Presented to the Graduate School
of the University of Florida in Partial Fulfillment of the Requirements for the Degree of Master of Science
SUBLETHAL EFFECTS OF SODIUM NITRATE ON DEVELOPMENTAL RATE AND BODY LENGTH IN SOUTHERN TOAD (Bufo terrestris) TADPOLES
By
Esther M. Langan
August 2003
Chair: Max A. Nickerson Department: Wildlife Ecology and Conservation
Agricultural industries are the major contributors of nonpoint nitrate pollution in
the environment. Runoff from agricultural areas ultimately resides in aquatic habitats
where amphibians breed and develop in North America. Many studies have documented
adverse effects of nitrates on amphibians including mortality, edema, reduced feeding
and swimming activity, spinal curvature, and reduced growth and developmental rates.
My study used low levels of sodium nitrate (0 mg/L, 5 mg/L, 15 mg/L, and 30 mg/L) on
Southern toad tadpoles (Bufo terrestris) to determine if there was an effect on body length
and developmental rate. Levels used in this experiment reflect nitrate concentrations in
areas where this species develops. Tadpoles were obtained from one population and
three separate clutches. I staged and measured them every other day until all tadpoles
had either metamorphosed (Gosner stage 45) or died. All tadpoles were at the same
Gosner stage at the beginning of the experiment. Water temperature and pH were

vii
sampled frequently. Dissolved oxygen was measured randomly throughout the
experiment.
There was no relationship among water temperature, pH, dissolved oxygen and
tadpole body length. Time to metamorphosis was significantly different between 0 mg/L
and 30 mg/L treatments, 5 mg/L and 30 mg/L treatments, and 15 mg/L and 30 mg/L
treatments. Time to metamorphosis was not significantly different among 0 mg/L, 5
mg/L, and 15 mg/L sodium nitrate treatments. Water parameters were relatively
consistent among tadpole tanks throughout the experiment. Nitrate treatment had no
effect on tadpole body length (mm). It is possible that the population from which I
obtained tadpoles contained animals tolerant to nitrate contamination (because of past
selection favoring individuals more tolerant to nitrate). Individuals from this population
may have higher phenotypic plasticity with respect to nitrate tolerance. It is also
plausible that the levels used in the experiment were too low to produce effects on body
length (since published studies found effects in many species at much higher levels).
Nitrate treatment accelerated developmental rate. Tadpoles may have accelerated
development in order to escape an unfavorable habitat. Alternatively, sodium nitrate may
have stimulated developmental rate by interacting with hormones responsible for
metamorphosis. Clutch had an effect on tadpole length and stage, with one clutch
developing more slowly than the other two clutches and exhibiting smaller body lengths
throughout most of the experiment. This result could be due to genetic factors or
nongenetic factors from maternal influences such as yolk content and egg size.

1
CHAPTER 1 AMPHIBIAN DECLINES AND NITRATES
Global Amphibian Declines
Global decline in amphibian populations is a relatively recent concern (Barinaga
1990; Phillips 1990; Dunson et al. 1992; Howe et al. 1998). Although many extinctions
have occurred, amphibian declines alarm scientists because they are occurring at
unnaturally high rates and because anthropogenic factors are most likely involved
(Barinaga 1990; Hecnar 1995; Schuytema and Nebeker 1999a). Increased exposure to
ultraviolet radiation due to ozone depletion has been studied intensively as a potential
cause of decline, especially in amphibian populations that occur at higher elevations
where ultraviolet radiation may have greater effects (Blaustein et al. 1994; Hays et al.
1996; Langhelle et al. 1999). Fungal and bacterial epidemics, iridoviruses, droughts,
temperature changes, habitat destruction and fragmentation, exotic species, heavy metals,
acid rain, pesticides and fertilizers have also been proposed as agents of amphibian
decline (Barinaga 1990; Phillips 1990; Dunson et al. 1992; Howe et al. 1998; Adams
1999; Hayes et al. 2002).
Species-specific differences in response to (and tolerance of) these different agents
further complicate research on amphibian declines (Rouse et al. 1999; Hayes et al. 2002).
In addition, most studies focus on individual agents and their effects on amphibians rather
than including multiple agents in the study. This is important since agents most likely
work synergistically to adversely affect amphibian populations (Rouse et al. 1999). It is
necessary to study these effects since amphibians are important predators and prey in
2
their ecosystems. Such studies are also necessary to effectively conserve and monitor
amphibian populations (Hecnar 1995).
Nitrate Fertilizers
Although nitrogen enters ecosystems from sewage effluents, industrial waste, urban
runoff, atmospheric deposition, and livestock feed lots, agricultural application of
nitrogen-based fertilizers remains the major nonpoint source of nitrates in the
environment (Camargo & Ward 1995; Carpenter et al. 1998; Rouse et al. 1999).
Nitrogen fertilizers are widely used in the United States and Canada. In less than 50
years, the use of nitrogen fertilizer in the United States has increased from 0.45 million
metric tons to more than 9.98 million tons (Lanyon 1995). Nitrogen becomes present at
high levels in aquatic systems as ammonia, ammonium ion, nitrite, and nitrate. The most
common form of nitrogen found in fertilizers is ammonium nitrate, NH4NO3 (Oldham et
al. 1997).
Fertilizers are applied to agricultural crops to provide them with nitrogen,
phosphate, and potassium needed for plant growth. Agricultural operations tend to apply
more fertilizer than necessary to the landscape, and the crops are not able to absorb all of
the nutrients in the fertilizer (Hecnar 1995). This excess fertilizer is either washed (via
runoff) into aquatic habitats where embryos and larvae develop; or penetrates the soil and
ultimately contaminates groundwater (Hecnar 1995). Safe levels of nitrate in
groundwater for humans have been designated at 10 mg/L nitrate (Camargo & Ward
1995). Exceeding this level may result in methemoglobinemia (blue-baby syndrome),
cancer in humans, or neural tube defects in infants (Hecnar 1995; Rouse et al. 1999;
Croen et al. 2001). Methemoglobinemia occurs when nitrate is converted to nitrite by
symbiotic intestinal fauna, resulting in the oxidation of hemoglobin to methemoglobin (a

3
molecule that is unable to bind with oxygen). In aquatic habitats, nitrate levels below 10
mg/L produce mortality in salmonid eggs and fry (Kincheloe et al. 1979), in two species
of insects (Camargo and Ward 1995), and in amphibians (Rouse et al. 1999). Therefore,
when agricultural practices over-apply fertilizers, the excess ultimately ends up in aquatic
habitats where amphibians breed and lay their eggs; and where embryos and tadpoles
develop (Meyer-Aurich et al. 1998).
Effects of Nitrates on Amphibians
Most research on the effects of nitrogen-based fertilizers has focused on lethal and
sublethal effects of nitrates on embryonic and larval stages since they are considered to
be more susceptible than adults to aquatic contaminants. This is due to the restriction of
larvae to aquatic habitats where fertilizers can be concentrated during development; the
permeability of the egg membrane; the presence of gills; and the highly cutaneous nature
of their skin (Hecnar 1995). Sublethal effects of nitrate-based fertilizers include
deformities, smaller body size, decreased movement, and decreased feeding activity that
would make larvae more vulnerable to predators (Hecnar 1995; Watt and Oldham 1995;
Xu and Oldham 1997; Laposta and Dunson 1998; Marco et al. 1999; Schuytema and
Nebeker 1999a, 1999b; Rouse et al. 1999). Other indirect population effects could result
if chronically exposed individuals survive to become adults and reproduce. Smaller body
sizes can affect the ability of male amphibians to attract mates and smaller females have
been shown to lay fewer and smaller eggs than larger females (Watt & Oldham 1995).
In general, the application of agricultural fertilizers occurs primarily in the spring
when most amphibians breed and when embryos and larvae develop (Xu & Oldham
1997). Adult amphibians may, therefore, migrate over landscapes where fertilizers were

4
recently applied (Oldham et al. 1997). However, fertilizers’ effects on adult amphibians
have not been studied intensively.
The amount of fertilizer required to produce 50% mortality in test subjects varies
among species and type of nitrogen-based fertilizer (ammonium, ammonium nitrate,
sodium nitrate, or ammonium sulfate) (Rouse et al. 1999; Schuytema & Nebeker 1999a).
Depending on the amount of fertilizer used, sublethal effects can occur such as
embryonic or larval deformities, cardiac or abdominal edema, disequilibrium, small body
size at metamorphosis, and decreased swimming and feeding activity (Hecnar 1995;
Marco et al. 1999; Rouse et al. 1999; Schuytema & Nebeker 1999a).
The larval deformity, curling defect, refers to the curvature of the larva’s tail.
Curling defects occur when the vitelline membrane surrounding the embryo fails to
expand during embryonic development; and forces the growing spine to curl. The
underlying cause of curling is not well understood although one hypothesis suggests that
pH affects osmotic potential within the vitelline membrane. Another hypothesis suggests
that pH affects inhibition of a hatching enzyme that digests the vitelline membrane (Freda
1991; Laposata & Dunson 1998). Schuytema and Nebeker (1999a) found that Xenopus
laevis (Anura: Pipidae) tadpoles exposed to 50.9 mg/L ammonium nitrate all exhibited
curling defects. Since ammonium nitrate is commonly used in agricultural landscapes, a
lower pH may be present in aquatic systems where amphibians congregate, thus
potentially producing curling defects in larvae. Such deformities likely affect foraging
and swimming ability in tadpoles, which could increase the likelihood of mortality due to
nutritional deficiencies, predation, and higher incidence of infection resulting from poor
nutritional status (Andrén et al. 1988). Population studies relating to this sublethal effect

5
of low pH have not yet been conducted, but are necessary to determine long-term
survivability of species. Other deformities of low pH such as tail retention and limb
malformations in metamorphs would most likely increase predation risk because they
would decrease mobility (Xu & Oldham 1997).
Slow growth rates have been found in many amphibian species exposed to varying
levels of nitrate (Hecnar 1995; Xu & Oldham 1997; Schuytema & Nebeker 1999a).
Hecnar (1995) proposed that a small size at metamorphosis was related to decreased
foraging as a direct result of methemoglobinemia in amphibian larvae.
Methemoglobinemia would cause decreased oxygen transport in larvae and would reduce
activity levels, including foraging. Small size at metamorphosis may be avoided if the
larva undergoes a longer metamorphic period (Larson et al. 1998). However, both small
size at metamorphosis and a long metamorphic period carry with them the costs of
increased susceptibility to predation and desiccation (Alford and Harris 1988). Smaller
individuals may not reproduce as early as larger individuals, thereby reducing fecundity
(Alford and Harris 1988) and may have higher predation risks, higher rates of water loss,
and a smaller range of viable prey items, all serving to decrease chances of survival
(Crump 1980). A long metamorphic period may expose larvae to desiccation if larvae
develop in ephemeral habitats and do not metamorphose before the habitat dries up
(Hecnar 1995).
Summary
Researchers are investigating many possible causes of amphibian declines
worldwide, particularly anthropogenic factors. Nitrate fertilizers are heavily used in
agricultural practices. Water runoff of these fertilizers into amphibian habitats may be
negatively affecting populations. Laboratory studies on several amphibian species using
6
different nitrate fertilizers have resulted in tadpoles with slower growth, smaller size at
metamorphosis, reduced feeding and swimming activity, edema, curling defects and
mortality. Studies need to focus on how nitrate contamination may be affecting
amphibians in the wild. Mesocosm studies are needed that mimic temporary pond
communities. Such studies may elucidate direct and indirect effects of nitrates on
amphibians. In addition, since there is ample evidence that nitrates produce adverse
effects on amphibians, research should concentrate on determining the underlying
mechanisms producing these effects. It is also essential to compare amphibian
populations and species existing in high-usage areas of nitrate fertilizer with those
existing in areas with little or no nitrate fertilizer usage. Such studies may reveal possible
adaptive tolerance of species exposed to constant levels of nitrate.
7
CHAPTER 2 SOUTHERN TOAD (Bufo terrestris) AND TADPOLE DEVELOPMENT AND
GROWTH
Natural History
The southern toad Bufo terrestris is one of six species belonging to the americanus
toad complex, the most broadly distributed group of the Bufo genus (Anura: Bufonidae)
in North America. It is a common species that exists in the Coastal Plain of the United
States from Louisiana south to Florida and north to the extreme southeast of Virginia. An
isolated population is also found in South Carolina (Blair 1972, Conant and Collins
1998). Bufo terrestris is found throughout mainland Florida and the lower Florida Keys.
Toads inhabiting the Keys have a noticeably smaller body size than those on the
mainland. The typical snout vent length of mainland toads is 80 mm. In Florida, the
southern toad is found in mesophytic hammocks, scrubs, wet prairies, pinelands and
urban and agricultural areas (Duellman and Schwartz 1958). It is nocturnal, spending the
daytime hiding in burrows and the nighttime foraging (Conant and Collins 1998). Its diet
consists mainly of invertebrates, particularly beetles (Duellman and Schwartz 1958). In
Florida, B. terrestris breeds from March through August in any lentic body of water.
Females are capable of laying thousands of eggs contained in two gelatinous strings. The
strings are typically attached to submerged vegetation and multiple females may lay their
eggs in the same area (Martof et al. 1980). Eggs hatch after a few days; and tadpoles
school together in groups of between 100 and 1000 individuals (McDiarmid and Altig
1999). Bufo terrestris tadpoles prefer warmer temperatures (> 30ºC) in their aquatic
8
habitats (Noland and Ultsch 1981). Tadpoles metamorphose into 7 to 21 mm toadlets in
approximately 1 to 2 months (Martof et al. 1980).
Tadpole Metamorphosis: Growth and Development
Metamorphosis is the change of an aquatic tadpole into a terrestrial adult. During
this process, radical external and internal morphological and physiological changes occur
primarily due to changes in several hormone levels including thyroid hormone (T3 and
T4), thyroid-stimulating hormone (TSH), prolactin (PRL), corticosterone (B),
aldosterone, deoxycorticosterone, estradiol (E2), and testosterone (T). Many other
hormones (e.g. melatonin, somatostatin, and gonadotropin-releasing hormone) may also
influence amphibian metamorphosis but conclusive scientific evidence is lacking (Shi
2000). Factors such as temperature (Hayes et al. 1993), water amount, light, and density
(Shi 2000) may also influence hormone levels.
Tadpoles typically exhibit a period of maximum growth after hatching from the egg
(Gosner Stages 25-41) that is accompanied by little development. During metamorphosis
(Gosner Stages 42-46), however, significant development occurs while little growth is
obtained (McDiarmid and Altig 1999). Many factors affect developmental and growth
rates including photoperiod, temperature, food abundance and quality, tadpole density,
pH, and oxygen concentration. Temperature produces the greatest effect on development
and growth rates. Lower temperatures typically produce slower growth and
developmental rates in anuran larvae with developmental rate being affected more than
growth rate (Harkey and Semlitsch 1988; Herreid and Kinney 1967). Tadpoles raised at
lower temperatures, however, are usually larger than those raised at higher temperatures
since developmental rate is more sensitive to temperature than growth rate (Harkey and
Semlitsch 1988; McDiarmid and Altig 1999; Smith-Gill and Berven 1979). Bufo

9
terrestris tadpoles prefer the warmest temperatures in their aquatic environment; and
often exhibit body temperatures greater than 30ºC. This confers faster developmental
times to reach metamorphosis before pond desiccation since this species typically breeds
in ephemeral waters (Crump 1989; Noland and Ultsch 1981). Temperature also affects
thyroid hormone, a major hormone producing metamorphosis in anurans. Lower
temperatures slow down metamorphosis induced by thyroid hormone by requiring much
higher levels of thyroid hormone in order for metamorphosis to occur (Harkey and
Semlitsch 1988; Shi 2000). Therefore, variations in temperature can have significant
effects on growth and developmental rates in tadpoles (Smith-Gill and Berven 1979).
Tadpole density affects growth and developmental rates in that individuals raised in
low-density conditions with high food availability tend to maximize growth rates and
decrease developmental rate to achieve a maximum body size at metamorphosis.
However, individuals raised in high-density conditions where food abundance is low tend
to exhibit lower growth rates and higher developmental rates. These individuals
generally achieve a smaller body size at metamorphosis. Higher densities tend to affect
growth rate more than developmental rate (Pough and Kamel 1984; Smith-Gill and
Berven 1979; Wilbur and Collins 1973). In high food availability conditions more
resources are allocated to growth. In low food conditions more resources are allocated to
development to escape unfavorable conditions (Alford and Harris 1988). Individuals
from high food conditions will metamorphose later at larger body sizes while the
majority of individuals from low food conditions will metamorphose earlier at a smaller
body size (McDiarmid and Altig 1999).

10
As with temperature and density, pH can affect developmental and growth rates,
thus affecting size at metamorphosis. Low pH levels produce slower growth (Beebee
1986; Cummins 1986; Freda and Dunson 1986; Grant and Licht 1993; Warner et al.
1991) and developmental rates (Cummins 1986; Grant and Licht 1993) in tadpoles of
several anuran species. Metamorphs exposed to low pH have exhibited tail retention and
malformed limbs (Xu and Oldham 1997). Additionally, Beebee (1986) determined that
small tadpoles were more susceptible to adverse effects of low pH than large tadpoles.
Low pH also affects fertilization in adult Rana pipiens by decreasing sperm motility
(Schlichter 1981).
11
CHAPTER 3 SUBLETHAL EFFECTS OF SODIUM NITRATE ON DEVELOPMENTAL RATE
AND BODY LENGTH IN SOUTHERN TOAD (Bufo terrestris) TADPOLES
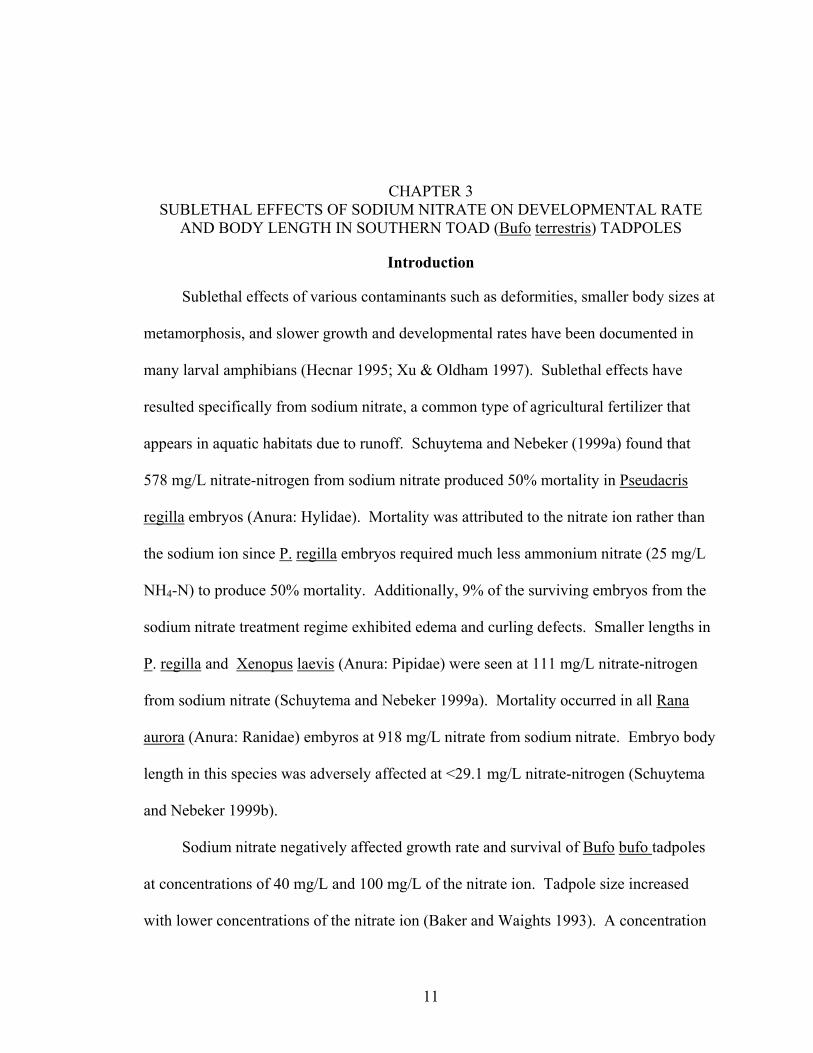
Introduction
Sublethal effects of various contaminants such as deformities, smaller body sizes at
metamorphosis, and slower growth and developmental rates have been documented in
many larval amphibians (Hecnar 1995; Xu & Oldham 1997). Sublethal effects have
resulted specifically from sodium nitrate, a common type of agricultural fertilizer that
appears in aquatic habitats due to runoff. Schuytema and Nebeker (1999a) found that
578 mg/L nitrate-nitrogen from sodium nitrate produced 50% mortality in Pseudacris
regilla embryos (Anura: Hylidae). Mortality was attributed to the nitrate ion rather than
the sodium ion since P. regilla embryos required much less ammonium nitrate (25 mg/L
NH4-N) to produce 50% mortality. Additionally, 9% of the surviving embryos from the
sodium nitrate treatment regime exhibited edema and curling defects. Smaller lengths in
P. regilla and Xenopus laevis (Anura: Pipidae) were seen at 111 mg/L nitrate-nitrogen
from sodium nitrate (Schuytema and Nebeker 1999a). Mortality occurred in all Rana
aurora (Anura: Ranidae) embyros at 918 mg/L nitrate from sodium nitrate. Embryo body
length in this species was adversely affected at <29.1 mg/L nitrate-nitrogen (Schuytema
and Nebeker 1999b).
Sodium nitrate negatively affected growth rate and survival of Bufo bufo tadpoles
at concentrations of 40 mg/L and 100 mg/L of the nitrate ion. Tadpole size increased
with lower concentrations of the nitrate ion (Baker and Waights 1993). A concentration

12
of 16.45 mg /L nitrate-nitrogen (from potassium nitrate) produced 50% mortality in Rana
pretiosa. Other effects included reduced feeding, lethargy, disequilibrium, edema and
curling defects at 16.45 mg/L or higher. The 10 mg/L nitrate maximum in U.S. drinking
water was deemed toxic to Rana pretiosa (Marco et al. 1999). Hecnar (1995) found that
13.6 and 39.3 mg/L nitrate (from ammonium nitrate) was sufficient to produce 50%
mortality in two different populations of Bufo americanus tadpoles. At 2.5 mg/L nitrate,
all tadpoles of three anuran species displayed less feeding and swimming activity.
Anuran species are affected differently by contaminant concentrations (Hecnar
1995; Marco et al. 1999). In this study, I exposed Bufo terrestris tadpoles to low levels
(0, 5, 15, and 30 mg/L ) of sodium nitrate to determine if these levels produced adverse
effects on body length and developmental rate. These concentrations are 0, 0.824, 2.472,
and 4.944 mg/L nitrate-nitrogen, respectively, based on molecular weight. These levels
were chosen because they represent nitrate levels found in Bufo terrestris breeding
habitats in Florida. I chose sodium nitrate as a contaminant since it is used frequently in
agricultural practices. From available water data, pond nitrate-nitrogen amounts in
Florida typically range from 0.1 to 1 mg/L although values of 3 mg/L or higher have been
reported (United States Geological Survey. NWISWeb Data for the Nation.
http://waterdata.usgs.gov/nwis. Accessed April 2004). Furthermore, since very few
studies have used such low nitrate-nitrogen levels, this study will help determine a nitrate
toxicity range for this species.
I predicted that adverse effects would be more dramatic in the higher sodium nitrate
treatment levels, and that adverse effects would be manifested in tadpoles as shorter body
lengths and retarded development. Most of the tadpoles in previous experiments have

13
developmental times longer than 60 days. It is known that species are influenced
differently by varying types and concentrations of sodium nitrate. Perhaps larval period
length also influences how greatly a tadpole is affected by a contaminant since
individuals with faster growth display higher metabolic rates.
Materials and Methods
Animals
I obtained seven pairs of amplexing Bufo terrestris adults at approximately 0200
hours on the morning of 1 June 2002. Pairs were collected from a retention pond in a
commercial area in Gainesville, Florida. Amplecting pairs were placed in separate plastic
shoe boxes with approximately 2.54-3.81 cm of standing water from their native pond.
Each of the seven pairs of Bufo terrestris laid eggs in the hours among time of capture
and 1100 hours on 1 June 2002. Adults were removed from the plastic containers and
released at their site of capture. One clutch of eggs perished due to a possible fungal
infection. At 2030 hours on the same day, the remaining six clutches of eggs were
separately placed into 55-liter containers. Before egg introduction, the containers were
filled with approximately 47 quarts of chlorine-free tap water. Each container was also
furnished with two air pumps to provide adequate oxygen flow in the water. Embryos
remained in these containers until they reached a feeding and free-swimming tadpole
stage, Stage 25 of the Gosner (1960) staging system, at which time I selected tadpoles for
the experiment.
Using a lottery, I randomly selected three of the six clutches to be used in the
experiment and released the remaining three clutches of tadpoles to their native pond. I
used a total of 180 tadpoles in the experiment (60 tadpoles from each clutch). Tadpoles
were selected for the experiment by dipping small fish nets in different areas in the clutch

14
containers. I placed five tadpoles from each clutch into each of the 12 tanks, providing a
total of 15 tadpoles per tank.
Materials
I used 0 mg/L, 5 mg/L, 15 mg/L and 30 mg/L sodium nitrate (NaNO3) as my
treatment levels. These levels as nitrate-nitrogen are 0 mg/L, 0.824 mg/L, 2.472 mg/L,
and 4.944 mg/L, respectively, calculated by molecular weight of nitrogen present in
NaNO3. Levels chosen for use in this experiment represent the low range of nitrate
concentrations in Florida waters. Stock solutions of sodium nitrate were created
immediately before the experiment so that each time water was to be changed, each tank
would receive only 2 mL of stock solution from its respective treatment level. Another
scientist labeled the solution bottles either E, F, H, or J so that I was blind to the
concentrations.
On 3 June 2002, I obtained twelve 10-gallon glass aquaria to house Bufo terrestris
tadpoles. Each treatment had three replicates, producing a total of twelve aquaria. I
washed and scrubbed the tanks with a diluted bleach solution (~10% bleach) and then
thoroughly rinsed them with fresh tap water. The next day, the tanks were again rinsed
with fresh tap water and allowed to dry. On 5 June 2002, I set up the twelve 10-gallon
tanks in an outdoor, open-air, covered setting. This setting provided tadpoles with
ambient temperatures and some direct sunlight throughout the experiment but prevented
the addition of rainwater to the tanks. I set up three 1-gallon, cloth painting sieves in
each tank Each sieve separated tadpole clutches within the tank. Sieves were attached to
the top of the tanks using office clips and the tanks were covered with aluminum mesh to
minimize the introduction of detritus and to prevent possible predation by insects. A
151-liter glass tank that was filled with tap water and constantly had air running through

15
it using two air pumps served as a water reservoir that would be used to replenish tank
water. Tadpoles were fed rabbit pellets ad libitum throughout the experiment.
Experimental Design
Using a lottery system, tanks were randomly assigned to one of four treatments: H,
E, F, or J, representing 0 mg of sodium nitrate per liter, 5 mg/L, 15 mg/L, or 30 mg/L,
respectively. Clutch order within each tank was also randomized using a lottery so that
clutch order and clutch neighbors within each tank would vary among tanks. I labeled
each tank with its designated treatment letter and clutch order (e.g., 1 2 3 or 1 3 2). I
assigned tanks a position in the lab setting and randomly moved them every other day
throughout the experiment using a lottery system. Clutch order within each tank did not
change during the course of the experiment. Seven liters of water were added to each
tank followed by two mL of sodium nitrate stock solution (either E, F, J, or H, depending
on each tank’s previous random assignment). Tanks were agitated to thoroughly mix the
solutions in the water.
On 6 June 2002 (5 days after egg collection), all tadpoles were measured and
staged. Body length (mm) was measured from the tip of the snout to the posterior part of
the body where the tail’s lateral line joined the body. Developmental staging of tadpoles
was performed using a dissecting microscope and the Gosner (1960) staging system. I
performed body length measurements and staging every other day. In order to stage and
measure tadpoles, I removed each tadpole from its treatment tank and placed it on a
water-saturated cloth. Body lengths were determined using calipers and staging required
that the tadpoles be placed under a bright light for microscope use. Tadpoles were
typically out of water for one minute to obtain body length and stage data.
16
Tank water was changed every other day, on the days when tadpoles were not
staged or measured. Before changing water for each tank, tadpoles in each sieve were
transferred to a small, plastic weighing boat by gently reversing the sieve. The tanks
were rinsed with high-pressure water and sieves were also rinsed out to remove leftover
food. Again, seven liters of water were added per tank, followed by two mL of the
appropriate nitrate solution. Water that was added to the tanks was obtained from tap
water that had been sitting in the 151-liter tank for approximately 48 hours with air
pumps aiding in chlorine removal. Tadpoles were added to each sieve and each sieve
was placed in its corresponding position in its tank according to the previously arranged
clutch order. One pellet of rabbit food was added to each clutch sieve and the tanks were
again covered with aluminum mesh.
Water, pH, and temperature per tank were measured frequently throughout the
experiment. On days when the water was changed, pH and temperature were measured
twice: once before changing the water and once after adding new water and nitrate
concentrations. This provided a range for these parameters during the experiment.
Furthermore, the use of maximum/minimum temperature thermometers provided daily
temperature ranges for one tank in each treatment. Every day the maximum/minimum
thermometers were placed in a new tank within the same treatment level. Dissolved
oxygen was measured randomly during the experiment.
I checked tanks daily for tadpole mortality and abnormalities such as edema, erratic
swimming, and body malformations. I recorded deceased or deformed tadpoles, noting
treatment level (E, F, H, or J) and clutch number. Deceased tadpoles were removed from
the experiment and a final body length and stage, if possible, were recorded. Any

17
tadpoles showing abnormalities were noted yet remained in the experiment. Towards the
end of the experiment, each tank was also checked daily for new metamorphs (Gosner
Stage 42, forelimb emergence). The presence of metamorphs was recorded, but they
were only removed from the experiment when they reached Gosner Stage 45, when Bufo
terrestris tadpoles have fully functioning lungs (Wassersug and Seibert 1975). The
experiment lasted a total of 33 days, until all of the tadpoles had either reached Gosner
Stage 45 (four limbs present, tail stub present, terrestrial stage) or died.
Statistical Analysis
I calculated average body lengths per clutch in each tank. A square root
transformation was performed to linearize the data. Comparisons of body length among
clutch and treatment were performed over time using a mixed linear model in SAS. This
determined whether clutch, treatment, or tank influenced body length in tadpoles. Water,
pH, and temperature were also compared among tanks in the mixed linear model to
determine any possible relationship with tadpole body length. Time to metamorphosis
(days) was analyzed per tadpole using a mixed linear model as well. Stage 42 (forelimb
emergence) was considered metamorphosis since this stage is easily recognizable.
Results
One clutch of eggs perished, presumably due to a fungal infection, as noted by a
white, opaque covering on the eggs. There was no significant difference in body length
(F = 0.79, p = 0.5063) among treatments (Fig. 3-1) or among tanks (p = 0.28). There was
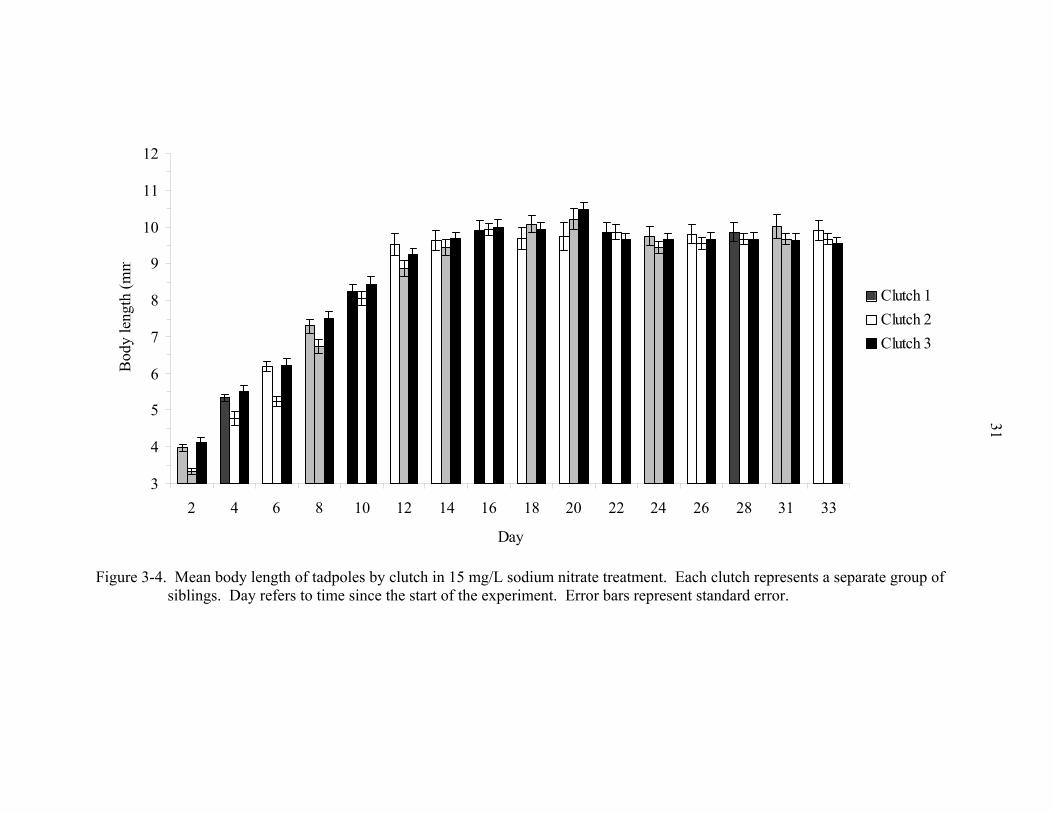
a clutch effect on body length (p = 0.0006) over time (Figs. 3-2 - 3-6). Figure 3-5
excludes an outlier tadpole in the 15 mg/L treatment. This tadpole remained at Stage 25
throughout the entire experiment. Elimination of this tadpole produced much lower
standard errors. Towards the end of the experiment this individual’s body began swelling

18
and became transparent. On Day 28, body length (BL) of this tadpole was 10.29 mm
while its body width (BW) was 8.56 mm. On Day 31, its BL was the longest at 11.91
mm with the widest BW of 12.00 mm. On Day 33, it had a BL of 10.86 mm and a BW of
10.30 mm. Ultimately, its body swelling produced a width practically the same
dimension as its length, an abnormal feature for a typical tapdole in this species. Body
lengths of Clutch 2 were typically smaller than Clutches 1 and 3. However, after the
elapse of three-quarters of the experimental time, Clutch 2 in each treatment typically
attained an equal or greater size than either or both Clutches 1 and 3. This typically
occurred when Clutches 1 and 3 were in metamorphic climax.
Time to metamorphosis was significantly different among control and 30 mg/L
tadpoles (p = 0.0346), 5 mg/L and 30 mg/L tadpoles (p = 0.0334), and 15 mg/L and 30
mg/L tadpoles (p = 0.0499). Time to metamorphosis was not significantly different
among control and 5 mg/L tadpoles (p = 0.9787), control and 15 mg/L tadpoles (p =
0.6814), and 5 mg/L and 15 mg/L tadpoles (p = 0.6954). Average time to metamorphosis
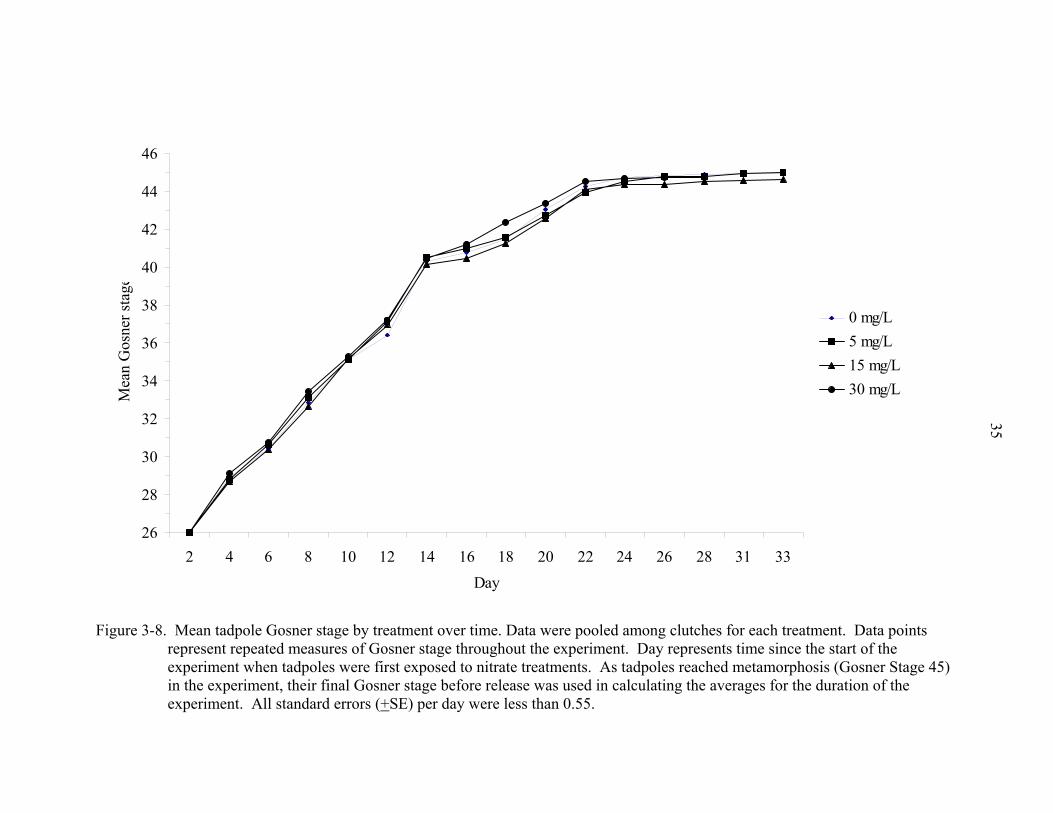
per treatment is depicted in figure 3-7. Figure 3-8 depicts the average Gosner stage per
treatment per day. A clutch effect on time to metamorphosis was not present (p =
0.2190). Figures 3-9 - 3-13 depict mean Gosner Stage of tadpoles by clutch over time.
Figure 3-12 exludes the outlier tadpole from Clutch 1 which maintained Gosner Stage 25
throughout the entire experiment.
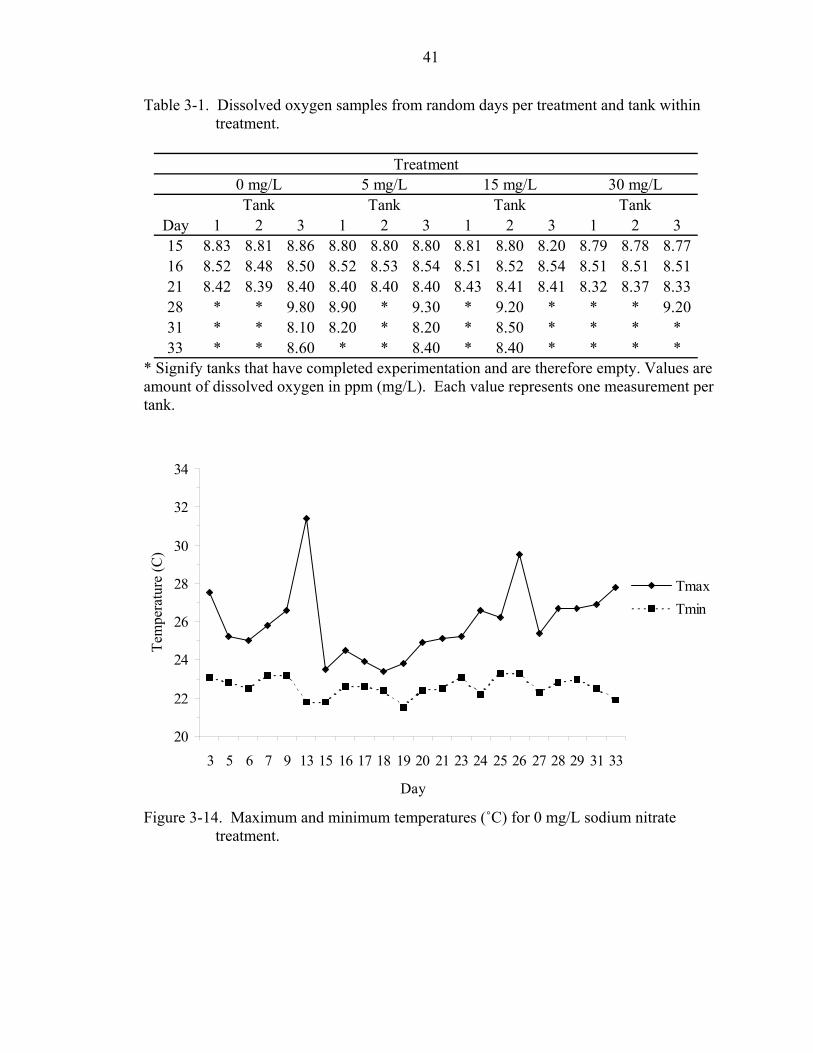
Dissolved oxygen appeared constant among tanks as well (Table 3-1).
Temperature and pH did not vary significantly during the course of the experiment and
exhibited no apparent relationship with tadpole body length (p = 0.2810, p = 0.3628).

19
These environmental factors are known to influence life history traits such as size and
developmental rate.
Days 13 and 26 had the highest temperatures at about 31°C and 30°C (Figs. 3-14 -
3-16). Differences in maximum and minimum treatment temperatures can be attributed
to variation in thermometers and tank placement. Some tanks may have received more
sunlight on a given day than other tanks. Possible confounding effects of the latter
variability were minimized in the experiment by randomly moving tank position every
other day.
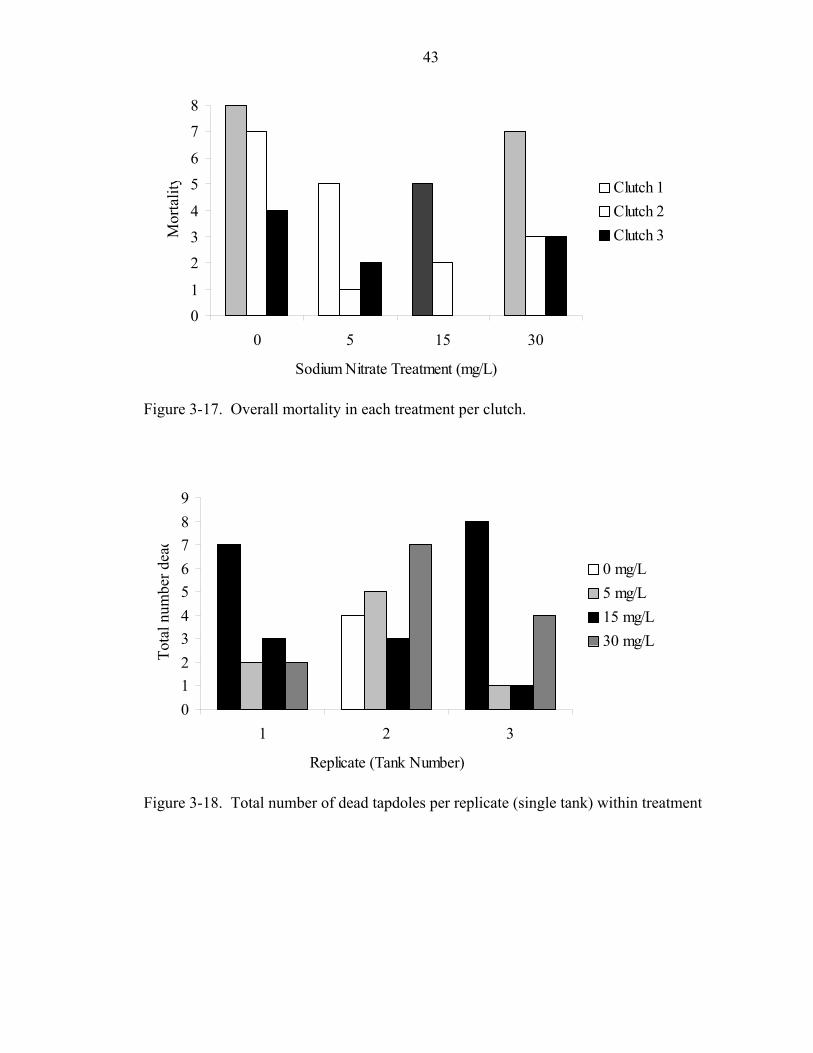
Mortality was unequal among treatments. Mortality was 42.2%, 17.8%, 15.6%,
and 28.9% in the sodium nitrate treatments from lowest to highest concentrations. Clutch
1 had the highest mortality and Clutch 3 had the lowest mortality overall (Fig. 3-17).
Mortality was also present in each replicate (tank) with no apparent pattern (Fig. 3-18).
No replicate exhibited mortality of all 15 tadpoles. Clutch 1 tadpoles had higher
mortality than Clutch 2 or 3 tadpoles, regardless of treatment regime, and Clutch 2
tadpoles had higher mortality than Clutch 3 tadpoles in all treatments with the exception
of the 5 mg/L sodium nitrate treatment (Fig. 3-19). In this instance, Clutch 2 and 3
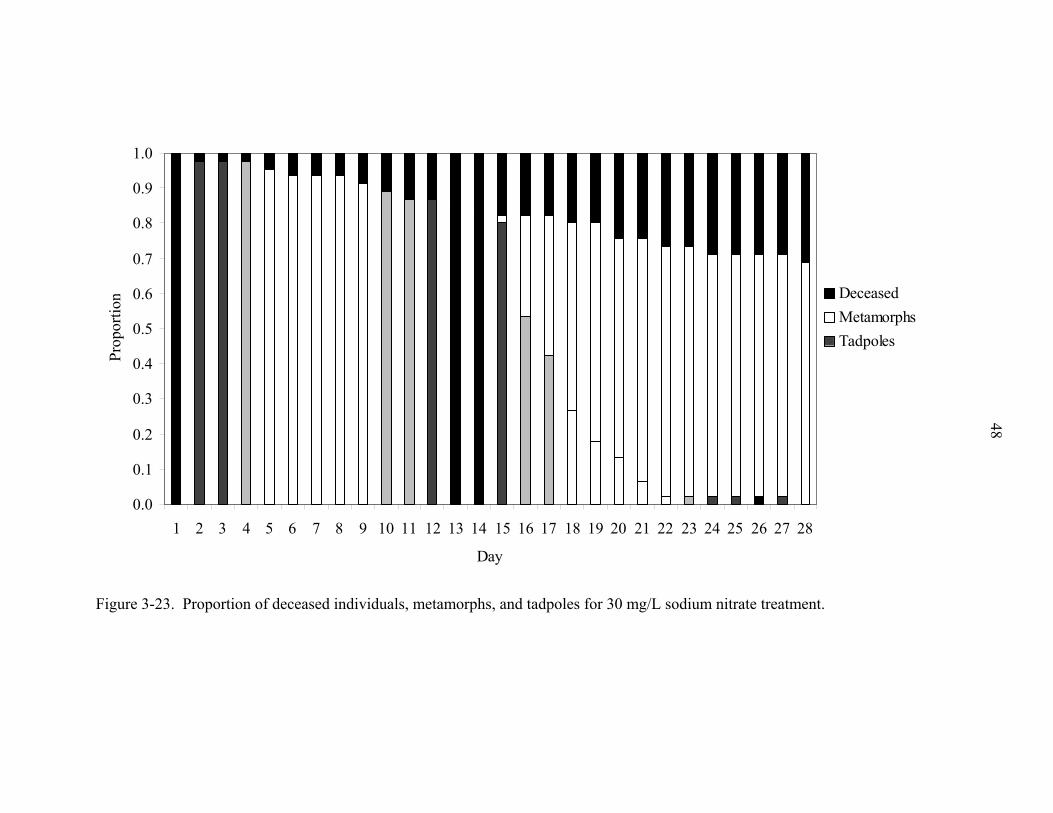
tadpoles had equal mortality (one tadpole each). Higher proportions of mortality in the
control and 30 mg/L treatments are reflected in lower proportions of total metamorphs
throughout the experiment (Figs. 3-20 – 3-23). Proportion of metamorphs was higher for
5 mg/L and 15 mg/L treatment levels due to decreased amount of mortality. Metamorphs
began appearing by Day 16 of the experiment. Clutch 1 tadpoles typically
metamorphosed before Clutches 2 and 3 (Fig. 3-24). The majority of Clutch 1 tadpoles
metamorphosed among Days 16 and 18 with the greatest proportion occurring on Day 16.

20
The majority of Clutch 2 tadpoles metamorphosed among Days 18 and 20 with the
greatest proportion occurring on Day 20. The majority of Clutch 3 tadpoles
metamorphosed among Days 18 and 20 also. Unlike Clutch 2, however, the greatest
proportion of metamorphs for Clutch 3 occurred on Day 18.
Discussion
Concentrations of 5 mg/L, 15 mg/L and 30 mg/L sodium nitrate (0.824 mg/L, 2.472
mg/L, and 4.944 mg/L nitrate-nitrogen) produced no observable effects on body length in
Bufo terrestris tadpoles. Tadpoles in different tanks had statistically similar body lengths,
suggesting that variation as a result of tank setup was minimal, if present at all. Tadpoles
of different treatment regimes exhibited statistically similar body lengths throughout the
course of the experiment. Higher concentrations of nitrate can produce negative effects
on body length in this species as seen in other literature (Hecnar 1995; Schuytema and
Nebeker 1999a and 1999b). However, exposing earlier stages (egg and embryo) of Bufo
terrestris to the experimental concentrations may produce the proposed lethal and
sublethal effects since earlier stages may differ in their susceptibility to nitrate
contamination (Xu and Oldham 1997). Temperature and pH, factors known to greatly
influence body length and developmental rate, did not vary greatly among tanks during
the course of the experiment.
Time to metamorphosis differed among the 30 mg/L sodium nitrate treatment and
all other treatments. Tadpoles exposed to 30 mg/L sodium nitrate obtained Gosner Stage
42 in the shortest amount of time. Tadpoles exposed to 15 mg/L sodium nitrate achieved
forelimb emergence before 5 mg/L and control tadpoles. Control tadpoles reached
Gosner Stage 42 before 5 mg/L tadpoles. These data suggest that higher concentrations
of sodium nitrate (30 mg/L and 15 mg/L) accelerated developmental rate in Bufo

21
terrestris tadpoles. It is possible that the tadpoles in the 30 mg/L treatment increased
developmental rate to escape the unfavorable habitat created by sodium nitrate. Another
possibility is that a hormetic response occurred such that these low levels of sodium
nitrate stimulated developmental rate by interacting with hormones responsible for
metamorphosis. Hormesis refers to stimulatory effects of contaminants at low doses
followed by inhibitory effects at higher contaminant levels (Bailer et al. 2003).
Contaminants such as cadmium, polycyclic aromatic hydrocarbons, and dioxin have been
shown to produce hormetic effects in some species (Calabrese and Baldwin 2003).
Boone et al. (2001) found that the insecticide, carbaryl, accelerated development in Rana
clamitans tadpoles. Although a faster developmental rate may be beneficial in instances
where tadpoles are in a habitat that will quickly dry up, it may produce smaller body sizes
at metamorphosis that could have negative effects on fecundity and survival (Alford and
Harris 1988; Wilbur and Collins 1973).
All tadpoles used in the experiment originated from a single population in the
wild. Hecnar (1995) reported that 13.6 mg/L of NH4-N was sufficient to produce 50%
mortality in one population of Bufo americanus tadpoles while another population
required 39.3 mg/L of NH4-N to produce 50% mortality. The latter population originated
from an area where intensive agriculture occurs, suggesting that this population
developed resistance to ammonium nitrate. Laurila et al. (2002) observed significant
differences in body size at metamorphosis and larval period length in Rana temporaria
tadpoles. In their study, tadpoles from a northern population did not vary these life
history traits with respect to water quantity while tadpoles from a southern population
exhibited faster developmental times and smaller body sizes when exposed to quickly

22
decreasing water volume. In nature, the southern population inhabits ponds which dry
out frequently and erratically. The northern population, however, inhabits ponds that are
not prone to complete drying. Since populational differences exist, determining lethal
and sublethal effects of contaminants based on one or a few populations may not apply to
all populations within a species, resulting in conservation efforts that may not be
adequate to preserve the whole species.
In a survey of 26 Florida springs, nitrate (NO3-N) ranged from 1.10 to 38.00 mg/L
(Katz et al. 1999). Total nitrogen in four lakes (Wauberg, Watermelon Pond, Orange and
Newnan) in Alachua County, Florida ranged from a minimum of 0.273 to a maximum of
11.500 mg/L (Lakewatch 2001). Nitrate amounts (as NO3) in Florida ponds typically
range from 0.1 to 1 mg/L, although some ponds have nitrate amounts at the 3 mg/L range
or higher (USGS 2003). One pond in Gainesville, Florida (Alachua County) where B.
terrestris bred in 2003 had 0.0048 mg/L nitrate-nitrogen. The pond where I obtained
breeding adults for use in this experiment was also located in Gainesville, Florida. This
pond was not situated near agricultural sites and likely exhibited nitrate levels similar to
other Florida ponds (< 1 mg/L). The levels used in this experiment were ecologically
relevant at 0 mg/L, 0.824 mg/L, 2.472 mg/L, and 4.944 mg/L nitrate-nitrogen. Although
Bufo terrestris tadpole body length was not adversely affected by the nitrate
concentrations in this study, higher concentrations may produce smaller body lengths
since studies that used higher levels found such an effect.
Clutch affected tadpole body length during the course of this experiment. This
could be due to genetic variation or nongenetic variation from maternal influences such
as egg size and nutrient input in egg yolk (Travis 1980) . Travis (1980) observed a

23
genetic effect on growth rates in Hyla gratiosa by cross-breeding a limited number of
males and females and observing the growth rates in offspring. Semlitsch et al. (2000)
performed a cross-breeding experiment with Hyla versicolor and concluded that genetic
variation in tadpoles, rather than maternal influences, largely affected tadpole tolerance to
the insecticide carbaryl. However, a separate, crossbreeding experiment would have to
be conducted to conclusively state whether clutch differences in body length and Gosner
stage of Bufo terrestris are due to genetic effects.
Tadpoles from Clutch 2 typically had smaller body lengths than tadpoles from
either Clutch 1 or 3 until about Day 24 in the control and 5 mg/L treatment, Days 18-22
and Day 28 for 15 mg/L, and Day 22 for 30 mg/L . A potential explanation for Clutch 2
tadpoles having longer body lengths later in the experiment could be the decrease in body
length during metamorphic climax, Gosner Stages 42-46 (Emerson 1986). Since tadpoles
in Clutches 1 and 3 were ahead in developmental stages they also had smaller body
lengths when in Gosner Stages 42-46 (metamorphic climax). Tadpoles from Clutch 2
typically had slightly slower development than tadpoles from Clutches 1 and 3, although
clutch did not have a statistically significant effect on time to metamorphosis.
Since density and competition were not factors, longer larval periods did not appear
to translate into smaller body sizes at metamorphosis. At the beginning of the
experiment, all tadpoles from Clutch 2 were smaller than tadpoles from Clutches 1 and 3.
At the end of the experiment, Clutch 2 tadpoles in the control group achieved larger body
lengths than Clutch 1 or 3 tadpoles (Fig. 3-2). In the 5 mg/L and 30 mg/L treatments,
Clutch 2 tadpoles were still smaller than Clutch 1 or 3 tadpoles at the end of the
experiment, although the difference was not as large as it was at the onset of the

24
experiment (Figs. 3-3 and 3-6). At the end of the experiment, Clutch 2 tadpoles in the 15
mg/L treatment level were larger than Clutch 3 tadpoles. However, they were still
smaller than Clutch 1 tadpoles although the size difference was not as great as at the
onset of the experiment (Fig. 3-5). Clutch 2 tadpoles also had slightly longer larval
periods although this was not statistically significant. Individuals with longer larval
periods spend more time in a stable environment and maximize growth at the risk of
increased mortality from predation and desiccation thereby achieving a larger body size
at metamorphosis (Alford and Harris 1988; Hecnar 1995). Although most Clutch 2
tadpoles were not larger than Clutch 1 or 3 tadpoles, their body lengths did increase
during the course of the experiment such that their final lengths showed much less
disparity among Clutches 1 and 3 as compared to the beginning of the experiment.
One tadpole from the 15 mg/L treatment (2.472 mg nitrate/L) had a grossly swollen
and transparent body. Hecnar (1995) noted many tadpoles with a similar condition when
he exposed them to chronic levels (2.5, 5, and 10 mg/L) of nitrate-nitrogen and suggested
that nitrate produced the deformity by affecting tadpole osmoregulation. It is possible
that nitrate produced the same condition in my experiment. Although only one tadpole
exhibited the swelling, it may have been more susceptible to nitrate since individuals vary
in their response to contaminants. However, since only one tadpole exhibited this
condition in my experiment, it is uncertain what the causitive agent may have been.
The fact that the control and 30 mg/L treatments had the highest mortality appear to
be a stochastic event unrelated to nitrate concentration. All water parameters among
treatments were similar, there was no variability in body length, and all tadpoles were
handled equally by the investigators. Length of larval period cannot account for

25
mortality since control tadpoles required approximately the same amount of time to reach
metamorphosis as tadpoles in the 5 and 15 mg/L treatments. Furthermore, since tadpoles
in these groups reached metamorphosis at approximately the same time, handling stress
from body measurements and staging among these groups would have been fairly
consistent and cannot account for mortality differences. A scientific explanation for
Clutch 1 displaying the greatest mortality in each treatment is also lacking and may be
stochastic as well. Similar studies which staged tadpoles typically did so with much less
frequency. Semlitsch and Schmiedehausen (1994) used only one stage measurement
(Gosner Stage 42, forelimb emergence) for a measure of developmental rate. Performing
fewer tadpole measurements would certainly decrease stress to the animals and,
therefore, possibly reduce mortality.
Future Research
Determining effects of varying nitrate levels on all life stages of amphibians
inhabiting areas where such contamination occurs is essential to prevent possible
population and species declines. Since many amphibian species breed in temporary
bodies of water, future experiments should compare effects of nitrates among several
populations that inhabit a range of nitrate-contaminated and uncontaminated areas, using
levels consistent with those found in the field. Such levels are likely to be much lower
than those in current literature. Data on nitrate concentrations in temporary bodies of
water are relatively scant, therefore this type of study would add to that body of literature
as well by providing such data. Additionally, scant information exists on nitrate effects
on developmental rate in amphibians. If nitrate levels decrease developmental rates,
amphibians inhabiting temporary ponds may be in danger of dessiccation since
metamorphosis may not be completed by the time their pond dries completely. If nitrates
26
increase developmental rates, it may lead to individuals with smaller body sizes at
metamorphosis since a longer larval period typically produces larger metamorphs (Alford
and Harris 1988; McDiarmid and Altig 1999). This could reduce fitness if smaller
females produce fewer and smaller eggs (Watt and Oldham 1995), ultimately resulting in
reduced amphibian populations.
Comparing effects of different types of nitrate would be useful since they produce
varying effects on amphibians. Ammonium nitrate, for example, is more toxic to
amphibians than sodium nitrate, owing to the ammonium ion and is used extensively in
agricultural settings (Schuytema and Nebeker 1999b). Effects on fecundity and
fertilization are also lacking in the literature with only one study linking low pH to
decreased sperm motility (Schlicther 1981). Decreased sperm motility could negatively
affect population growth in habitats heavily contaminated with ammonium nitrate.
Ultimately, many factors work synergistically in the environment to create adverse
effects. Without the addition of contaminants, larval mortality is relatively high so that
very few individuals reach reproductive ages. With the added stress of contaminants,
mortality likely will increase and reduce populations in the future (Semlitsch et al. 2000).
Although contaminants may select for resistant individuals in the population, allowing
the population to persist and grow, loss of genetic diversity could reduce adaptiveness of
the population to future selective pressures. Pesticides, fertilizers, competition, food
abundance and water quality all likely have complex roles in developmental and growth
rates of larval amphibians. It is necessary to understand the impact of each factor
independently and interdependently to predict the future of amphibian populations and
create realistic conservation goals.

27
More detailed studies comparing contaminant effects on species with different life
history characteristics need to be undertaken as well. Bufo terrestris exhibits
synchronous hatching and metamorphosis. Studies have shown that high density and low
food abundance can affect development and growth in other species by producing smaller
metamorphs (Smith-Gill and Berven 1979; Wilbur and Collins 1973). Nitrate has been
shown to affect body length, larval period length, and feeding activity in other species as
well (Hecnar 1995; Marco et al. 1997; Oldham et al. 1997; Rouse et al. 1999). It may be
reasonable, therefore, to conclude that nitrate contamination may differentially affect
species with varying life history characteristics such as population density and time to
metamorphosis, producing more drastic effects in species that breed synchronously in
ephemeral bodies of water compared to species with asychronous breeding in permanent
bodies of water. Since temperature can greatly affect the length of the larval period, a
laboratory experiment using tadpoles of the same species with varying nitrate
concentrations and three temperature regimes may be useful in determining how larval
period may interact with contaminants.
Mesocosms are experimental tank communities that mimic natural temporary pond
conditions but provide more control, manipulation, and accurate censusing data than
natural ponds (Morin 1983). Mesocosm studies would be particularly useful in
determining indirect nitrate effects on tadpoles resulting from algal effects, a major
tadpole food source. Mesocosm experiments may more accurately reflect contaminant
interactions in nature and provide more insight into complex ecological interactions of
contaminants in nature.

28
Figure 3-1. Mean tadpole body length by treatment over time. Data were pooled among clutches for each treatment. Data points represent repeated measures of body length throughout the experiment. Day represents time since the start of the experiment when tadpoles were first exposed to nitrate treatments. As tadpoles reached metamorphosis (Gosner Stage 45) in the experiment, their final body length before release was used in calculating the averages for the duration of the experiment. All standard errors (+SE) per day were less than 0.20.
3
4
5
6
7
8
9
10
11
2 4 6 8 10 12 14 16 18 20 22 24 26 28 31 33
Day
Mea
n bo
dy le
ngth
(mm
0 mg/L5 mg/L15 mg/L30 mg/L

29
Figure 3-2. Mean body length of tadpoles by clutch in 0 mg/L sodium nitrate treatment. Each clutch represents a separate group of siblings. Day refers to time since the start of the experiment. Error bars represent standard error. Standard error ranged from 0.065 to 0.89.
3
4
5
6
7
8
9
10
11
12
2 4 6 8 10 12 14 16 18 20 22 24 26 28 31 33
Day
Mea
n bo
dy le
ngth
(mm
Clutch 1Clutch 2Clutch 3

30
Figure 3-3. Mean body length of tadpoles by clutch in 5 mg/L sodium nitrate treatment. Each clutch represents a separate group of siblings. Day refers to time since the start of the experiment. Error bars represent standard error.
3
4
5
6
7
8
9
10
11
12
2 4 6 8 10 12 14 16 18 20 22 24 26 28 31 33
Day
Bod
y le
ngth
(mm
Clutch 1Clutch 2Clutch 3
31
Figure 3-4. Mean body length of tadpoles by clutch in 15 mg/L sodium nitrate treatment. Each clutch represents a separate group of siblings. Day refers to time since the start of the experiment. Error bars represent standard error.
3
4
5
6
7
8
9
10
11
12
2 4 6 8 10 12 14 16 18 20 22 24 26 28 31 33
Day
Bod
y le
ngth
(mm
Clutch 1Clutch 2Clutch 3

32
Figure 3-5. Mean tadpole body length of tadpoles by clutch in 15 mg/L NaNO3 treatment, excluding outlier from Clutch 1. Data were pooled among tadpoles for each clutch and each clutch represents a separate group of siblings. Day refers to time since the start of the experiment. Error bars represent + SE. Elimination of the outlier tadpole produced slightly larger body lengths for Clutch 1 tadpoles on some days.
3
4
5
6
7
8
9
10
11
12
2 4 6 8 10 12 14 16 18 20 22 24 26 28 31 33
Day
Bod
y le
ngth
(mm
Clutch 1Clutch 2Clutch 3

33
Figure 3-6. Mean body length of tadpoles by clutch in 30 mg/L sodium nitrate treatment. Each clutch represents a separate group of siblings. Day refers to time since the start of the experiment. Error bars represent standard error.
3
4
5
6
7
8
9
10
11
12
2 4 6 8 10 12 14 16 18 20 22 24 26 28
Day
Bod
y le
ngth
(mm
Clutch 1Clutch 2Clutch 3

34
Figure 3-7. Average time to metamorphosis (days) per treatment. Metamorphosis was defined as Gosner Stage 42 (forelimb emergence). Error bars represent standard error (+SE).
17
17.5
18
18.5
19
19.5
20
Treatment
Tim
e to
met
amor
phos
is (d
ay
0 mg/L5 mg/L15 mg/L30 mg/L
35
Figure 3-8. Mean tadpole Gosner stage by treatment over time. Data were pooled among clutches for each treatment. Data points
represent repeated measures of Gosner stage throughout the experiment. Day represents time since the start of the experiment when tadpoles were first exposed to nitrate treatments. As tadpoles reached metamorphosis (Gosner Stage 45) in the experiment, their final Gosner stage before release was used in calculating the averages for the duration of the experiment. All standard errors (+SE) per day were less than 0.55.
26
28
30
32
34
36
38
40
42
44
46
2 4 6 8 10 12 14 16 18 20 22 24 26 28 31 33Day
Mea
n G
osne
r sta
ge
0 mg/L5 mg/L15 mg/L30 mg/L

36
Figure 3-9. Mean Gosner stage of tadpoles by clutch in 0 mg/L sodium nitrate treatment. Each clutch represents a separate group of siblings. Day refers to time since the start of the experiment. Error bars represent standard error.
24
26
28
30
32
34
36
38
40
42
44
46
2 4 6 8 10 12 14 16 18 20 22 24 26 28 31 33
Day
Mea
n G
osne
r sta
ge
Clutch 1Clutch 2Clutch 3

37
Figure 3-10. Mean Gosner stage of tadpoles by clutch in 5 mg/L sodium nitrate treatment. Each clutch represents a separate group of siblings. Day refers to time since the start of the experiment. Error bars represent standard error.
24
26
28
30
32
34
36
38
40
42
44
46
2 4 6 8 10 12 14 16 18 20 22 24 26 28 31 33Day
Mea
n G
osne
r sta
ge
Clutch 1Clutch 2Clutch 3

38
Figure 3-11. Mean Gosner stage of tadpoles by clutch in 15 mg/L sodium nitrate treatment. Each clutch represents a separate group of siblings. Day refers to time since the start of the experiment. Error bars represent standard error.
24
26
28
30
32
34
36
38
40
42
44
46
2 4 6 8 10 12 14 16 18 20 22 24 26 28 31 33Day
Mea
n G
osne
r sta
ge
Clutch 1Clutch 2Clutch 3

39
Figure 3-12. Mean Gosner stage of tadpoles by clutch in 15 mg/L sodium nitrate treatment excluding one individual from Clutch 1 that did not develop and remained at Stage 25 throughout the experiment. Elimination of this individual produced a smaller standard error for Clutch 1 than represented in figure 9. Each clutch represents a separate group of siblings. Day refers to time since the start of the experiment. Error bars represent standard error.
24
26
28
30
32
34
36
38
40
42
44
46
2 4 6 8 10 12 14 16 18 20 22 24 26 28 31 33Day
Mea
n G
osne
r sta
ge
Clutch 1Clutch 2Clutch 3

40
Figure 3-13. Mean Gosner stage of tadpoles by clutch in 30 mg/L sodium nitrate treatment. Each clutch represents a separate group of siblings. Day refers to time since the start of the experiment. Error bars represent standard error.
24
26
28
30
32
34
36
38
40
42
44
46
2 4 6 8 10 12 14 16 18 20 22 24 26 28 31Day
Mea
n G
osne
r sta
ge
Clutch 1Clutch 2Clutch 3
41
Table 3-1. Dissolved oxygen samples from random days per treatment and tank within treatment.
* Signify tanks that have completed experimentation and are therefore empty. Values are amount of dissolved oxygen in ppm (mg/L). Each value represents one measurement per tank.
Figure 3-14. Maximum and minimum temperatures (˚C) for 0 mg/L sodium nitrate treatment.
0 mg/L 5 mg/L 15 mg/L 30 mg/LTank Tank Tank Tank
Day 1 2 3 1 2 3 1 2 3 1 2 315 8.83 8.81 8.86 8.80 8.80 8.80 8.81 8.80 8.20 8.79 8.78 8.7716 8.52 8.48 8.50 8.52 8.53 8.54 8.51 8.52 8.54 8.51 8.51 8.5121 8.42 8.39 8.40 8.40 8.40 8.40 8.43 8.41 8.41 8.32 8.37 8.3328 * * 9.80 8.90 * 9.30 * 9.20 * * * 9.2031 * * 8.10 8.20 * 8.20 * 8.50 * * * *33 * * 8.60 * * 8.40 * 8.40 * * * *
Treatment
20
22
24
26
28
30
32
34
3 5 6 7 9 13 15 16 17 18 19 20 21 23 24 25 26 27 28 29 31 33
Day
Tem
pera
ture
(C)
TmaxTmin

42
Figure 3-15. Maximum and minimum temperatures (˚C) for 5 mg/L sodium nitrate treatment.
Figure 3-16. Maximum and minimum temperatures (˚C) for 15 mg/L sodium nitrate treatment.
20
22
24
26
28
30
32
34
3 5 6 7 9 13 15 16 17 18 19 20 21 23 24 25 26 27 28 29 31 33
Day
Tem
pera
ture
(C)
TmaxTmin
20
22
24
26
28
30
32
34
3 5 6 7 9 13 15 16 17 18 19 20 21 23 24 25 26 27 28 29 31 33
Day
Tem
pera
ture
(C)
TmaxTmin
43
Figure 3-17. Overall mortality in each treatment per clutch.
Figure 3-18. Total number of dead tapdoles per replicate (single tank) within treatment
01
234
56
78
0 5 15 30
Sodium Nitrate Treatment (mg/L)
Mor
talit
y Clutch 1Clutch 2Clutch 3
0123456789
1 2 3
Replicate (Tank Number)
Tota
l num
ber d
ead
0 mg/L5 mg/L15 mg/L30 mg/L

44
Figure 3-19. Total number of dead tadpoles per clutch within treatment.
0
2
4
6
8
10
12
1 2 3
Clutch
Tota
l num
ber o
f dea
d0 mg/L5 mg/L15 mg/L30 mg/L

45
Figure 3-20. Proportion of deceased individuals, metamorphs, and tadpoles for 0 mg/L sodium nitrate treatment.
0.0
0.1
0.2
0.3
0.4
0.5
0.6
0.7
0.8
0.9
1.0
1 2 3 4 5 6 7 8 9 10 11 12 13 14 15 16 17 18 19 20 21 22 23 24 25 26 27 28
Day
Prop
ortio
n DeceasedMetamorphsTadpoles

46
Figure 3-21. Proportion of deceased individuals, metamorphs, and tadpoles for 5 mg/L sodium nitrate treatment.
0.0
0.1
0.2
0.3
0.4
0.5
0.6
0.7
0.8
0.9
1.0
1 2 3 4 5 6 7 8 9 10 11 12 13 14 15 16 17 18 19 20 21 22 23 24 25 26 27 28 29 30 31
Day
Prop
ortio
n DeceasedMetamorphsTadpoles

47
Figure 3-22. Proportion of deceased individuals, metamorphs, and tadpoles for 15 mg/L sodium nitrate treatment.
0.0
0.1
0.2
0.3
0.4
0.5
0.6
0.7
0.8
0.9
1.0
1 2 3 4 5 6 7 8 9 10 11 12 13 14 15 16 17 18 19 20 21 22 23 24 25 26 27 28 29 30 31 32 33 34
Day
Prop
ortio
n DeceasedMetamorphsTadpoles
48
Figure 3-23. Proportion of deceased individuals, metamorphs, and tadpoles for 30 mg/L sodium nitrate treatment.
0.0
0.1
0.2
0.3
0.4
0.5
0.6
0.7
0.8
0.9
1.0
1 2 3 4 5 6 7 8 9 10 11 12 13 14 15 16 17 18 19 20 21 22 23 24 25 26 27 28
Day
Prop
ortio
n DeceasedMetamorphsTadpoles

49
0.0
0.1
0.2
0.3
0.4
0.5
15 16 17 18 19 20 21 22 23 24 25 26 27 28Day
Prop
ortio
n of
new
met
amor
phs
Clutch 1Clutch 2Clutch 3
Figure 3-24. Proportion of new metamorphs (Gosner Stage 42, forelimb emergence)
each day per clutch. Proportions are number of new metamorphs per day for each clutch divided by total number of metamorphs each clutch ultimately produced.

50
LIST OF REFERENCES
Adams, M. J. 1999. Correlated factors in amphibian decline: exotic species and habitat change in Western Washington. Jounral of Wildlife Management 63(4):1162-1171.
Alford, R. A. and R. N. Harris. 1988. Effects of larval growth history on anuran metamorphosis. The American Naturalist 131:91-106.
Andrén, C., Henrikson, L., M. Olsson, and G. Nilson. 1988. Effects of pH and aluminum on embryonic and early larval stages of Swedish brown frogs Rana arvalis, R. temporaria, and R. dalmatina. Holarctic Ecology 11:127-135.
Bailer, A. J., J.T. Oris, K. See, M. R. Hughes, and R. Schaefer. 2003. Defining and evaluating impact in environmental toxicology. Environmetrics 14:235-243.
Baker, J. and V. Waights. 1993. The effect of sodium nitrate on the growth and survival of toad tapoles (Bufo bufo) in the laboratory. Herpetological Journal 3:147-148.
Barinaga, M. 1990. Where have all the froggies gone? Science 247:1033-1034.
Beebee, T. J. C. 1986. Acid tolerance of natterjack toad (Bufo calamita) development. Herpetologocial Journal 1:78-81.
Blair, W. F., ed. 1972. Evolution in the genus Bufo. University of Texas Press, Austin, Texas.
Blaustein, A. R., P. D. Hoffman, D. G. Hokit, J. M. Kiesecker, S. C. Walls, and J. B. Hays. 1994. UV repair and resistance to solar UV-B in amphibian eggs: a link to population declines? Proceedings of the National Academy of Sciences of the United States of America 91(5):1791-1795.
Boone, M. D., C. M. Bridges, and B. B. Rothermel. 2001. Growth and development of larval green frogs (Rana clamitans) exposed to multiple doses of an insecticide. Oecologia 129:518-524.
Calabrese, E. J. and L. A. Baldwin. 2003. Toxicology rethinks its central brief. Nature 421:691-692.
Camargo, J. A. and J. V. Ward. 1995. Nitrate (NO3-N) toxicity to aquatic life: a proposal of safe concentrations for two species of nearctic freshwater invertebrates. Chemosphere 31(5):3211-3216.

51
Canfield, D. J., ed. 2002. Florida Lakewatch Annual Summaries for 1986 through 2001. Department of Fisheries and Aquatic Sciences, University of Florida/Institute of Food and Agricultural Sciences. Accessed at http:// lakewatch.ifas.ufl.edu on April 2003.
Carpenter, S. R., N. F. Caraco, D. L. Correll, R. W. Howarth, A. N. Sharpley, and V. H. Smith. 1998. Nonpoint pollution of surface waters with phosphorus and nitrogen. Ecological Applications 8(3): 559-568.
Conant, R. and J. T. Collins. 1998. A field guide to the reptiles and amphibians of Eastern and Central North America, 3rd edition, expanded. Houghton Mifflin Company.
Croen, L. A., K. Todoroff, and G. M. Shaw. Maternal exposure to nitrate from drinking water and diet and risk for neural tube defects. American Journal of Epidemiology 153(4):325-331.
Crump, M. L. 1989. Effect of habitat drying on developmental time and size at metamorphosis in Hyla pseudopuma. Copeia 1989(3):794-797.
Cummins, C. P. 1986. Efects of aluminium and low pH on growth and development in Rana temporaria tadpoles. Oecologia 69:248-252.
Duellman, W. E. and A. Schwartz. 1958. Amphibians and reptiles of southern Florida. Bulletin of the Florida State Museum of Biological Sciences 3(5):181-324.
Dunson, W. A., R. L. Wyman, and E. S. Corbett. 1992. A symposium on amphibian declines and habitat acidification. Journal of Herpetology 26(4):349-352.
Emerson, S. B. 1986. Heterochrony and frogs: the relationship of a life history trait to morphological form. The American Naturalist 127(2):167-183.
Freda, J. 1991. Long term monitoring of amphibian populations with respect to the effects of acidic deposition. Water, Air, and Soil Pollution 55:445-462.
Freda, J. and W. A. Dunson. 1986. Effects of low pH and other chemical variables on the local distribution of amphibians. Copeia 1986(2):454-466.
Gosner, K. L. 1960. A simplified table for staging anuran embryos and larvae with notes on identification. Herpetologica 16:183-190.
Grant, K. P. and L. E. Licht. 1993. Acid tolerance of anuran embryos and larvae from central Ontario. Journal of Herpetology 27(1):1-6.
Harkey, G. A. and R. D. Semlitsch. 1988. Effects of temperature on growth, development, and color polymorphism in the ornate chorus frog Pseudacris ornata. Copeia 1988(4):1001-1007.

52
Hays, J. B., A. R. Blaustein, J. M. Kiesecker, D. P. Chivers, and R. G. Anthony. 1996. Developmental response of amphibians to solar and artificial UVB sources: a comparative study. Photochemistry and Photobiology 64(3): 449-456.
Hayes, T., R. Chan, and P. Licht. 1993. Interactions of temperature and steroids on larval growth, development, and metamorphosis in a toad (Bufo boreas). Journal of Experimental Zoology 266:206-215.
Hayes, T., K. Haston, M. Tsui, A. Hoang, and A. V. Haeffele. 2002. Feminization of male frogs in the wild. Nature 419:895-896.
Hecnar, S. J. 1995. Acute and chronic toxicity of ammonium nitrate fertilizer to amphibians from southern Ontario. Environmental Toxicology and Chemistry 14(12):2131-2137.
Herreid II, C. F. and S. Kinney. 1967. Temperature and development of the wood frog, Rana sylvatica, in Alaska. Ecology 48(4):579-590.
Howe, G. E., R. Gillis, and R. C. Mowbray. 1998. Effect of chemical synergy and larval stage on the toxicity of atrazine and alachlor to amphibian larvae. Environmental Toxicology and Chemistry 17(3):519-525.
Katz, B. G., H. D. Hornsby, J. F. Bohlke, and M. F. Mokray. 1999. Sources and chronology of nitrate contamination in spring waters, Suwannee River Basin, Florida. U. S. Geological Survey Water-Resources Investigations Report 99-4252.
Kincheloe, J. W., G. A. Wedemyer, and D. L. Koch. 1979. Tolerance of developing salmonid eggs and fry to nitrate exposure. Bulletin of Environmental Contamination and Toxicology 23:575-578.
Langhelle, A., J. Lindell-Mans, and P. Nystrom. 1999. Effects of ultraviolet radiation on amphibian embryonic and larval development. Journal of Herpetology 33(3): 449-456.
Lanyon, L. E. 1995. Does nitrogen cycle?: Changes in the spatial dynamics of nitrogen following the industrialization of nitrogen fixation. Journal of Productivity Analysis 8:70-78.
Laposata, M. M., and W. A. Dunson. 1998. Effects of boron and nitrate on hatching success of amphibian eggs. Archives of Environmental Contamination and Toxicology 35:615-619.
Larson, D. L., S. McDonald, A. J. Fivizzani, W. E. Newton, and S. J. Hamilton. 1998. Effects of the herbicide atrazine on Ambystoma tigrinum metamorphosis: duration, larval growth, and hormonal response. Physiological Zoology 71(6):671-679.

53
Laurila, A., S. Karttunen, and J. Merilä. 2002. Adaptive phenotypic plasticity and genetics of larval life histories in two Rana temporaria populations. Evolution 56(3):617-627.
Marco, A., C. Quilchano, and A. R. Blaustein. 1999. Sensitivity to nitrate and nitrite in pond-breeding amphibians from the Pacific Northwest, USA. Environmental Toxicology and Chemistry 18(12):2836-2839.
Martof, B. S., W. M. Palmer, J. R. Bailey, and J. R. Harrison III. 1980. Amphibians and reptiles of the Carolinas and Virginia. The University of North Carolina Press, Chapel Hill.
McDiarmid, R. W. and R. Altig. 1999. Tadpoles: the Biology of Anuran Larvae. The University of Chicago Press, Chicago.
Meyer-Aurich, A., P. Zander., A. Werner, and R. Roth. 1998. Developing agricultural land use strategies appropriate to nature conservation goals and environmental protection. Landscape and Urban Planning 41:119-127.
Morin, P. J. 1983. Predation, competition, and the composition of larval anuran guilds. Ecological Monographs 53(2):119-138.
Noland, R. and G. R. Ultsch. 1981. The roles of temperature and dissolved oxygen in microhabitat selection by the tadpoles of a frog (Rana pipiens) and a toad (Bufo terrestris). Copeia 1981:645-652.
Oldham, R. S., D. M. Latham, D. Hilton-Brown, M. Towns, A. S. Cooke, and A. Burn. 1997. The effect of ammonium nitrate fertiliser on frog (Rana temporaria) survival. Agriculture, Ecosystems and Environment 61:69-74.
Phillips, K. 1990. Where have all the frogs and toads gone? Bioscience 40(6):422-424.
Pough, F. H. and S. Kamel. 1984. Post-metamorphic change in activity metabolism of anurans in relation to life history. Oecologia 65:138-144.
Rouse, J. D., C. A. Bishop, and J. Struger. 1999. Nitrogen Pollution: An assessment of its threat to amphibian survival. Environmental Health Perspectives 107(10): 799-803.
Schlichter, L. C. 1981. Low pH affects the fertilization and development of Rana pipiens eggs. Canadian Journal of Zoology 59:1693-1699.
Schuytema, G. S., and A. V. Nebeker. 1999a. Comparative effects of ammonium and nitrate compounds on Pacific treefrog and African clawed frog embryos. Archives of Environmental Contamination and Toxicology 36:200-206.
Schuytema, G. S., and A. V. Nebeker. 1999b. Effects of ammonium nitrate, sodium nitrate, and urea on red-legged frogs, Pacific treefrogs, and African clawed frogs. Bulletin of Environmental Contamination and Toxicology 63:357-364.

54
Semlitsch, R. D., C. M. Bridges, and A. M. Welch. 2000. Genetic variation and a fitness tradeoff in the tolerance of gray treefrog (Hyla versicolor) tadpoles to the insecticide carbaryl. Oecologia 125:179-185.
Semlitsch, R. D. and S. Schmiedehausen. 1994. Parental contributions to variation in hatchling size and its relationship to growth and metamorphosis in tapdoles of Rana lessonae and Rana esculenta. Copeia 1994(2):406-412.
Shi, Y. 2000. Amphibian Metamorphosis: From Morphology to Molecular Biology. John Wiley and Sons, Inc., New York.
Smith-Gill, S. J. and K. A. Berven. 1979. Predicting amphibian metamorphosis. The American Naturalist 113(4):563-585.
Travis, J. 1980. Genetic variation for larval specific growth rate in the frog Hyla gratiosa. Growth 44:167-181.
Warner, S.C., W. A. Dunson, and J. Travis. 1991. Interaction of pH, density, and priority effects on the surviviorship and growth of two species of hylid tadpoles. Oecologia 88:331-339.
Wassersug, R. J. and E. A. Seibert. 1975. Behavioral responses of amphibian larvae to variation in dissolved oxygen. Copiea 1975(1):86-103.
Watt, P. J., and R. S. Oldham, R. S. The effect of ammonium nitrate on the feeding and development of larvae of the smooth newt, Triturus vulgaris (L.), and on the behaviour of its food source, Daphnia. Freshwater Biology 33:319-324.
Wilbur, H. M. and J. P. Collins. 1973. Ecologocial aspects of amphibian metamorphosis. Science 182:1305-1314.
Xu, Q. and R. S. Oldham. 1997. Lethal and sublethal effects of nitrogen fertilizer ammonium nitrate on common toad (Bufo bufo) tadpoles. Archives of Environmental Contamination and Toxicology 32(3): 298-303.

55
BIOGRAPHICAL SKETCH
Esther M. Langan was born in Melbourne, Florida, on 25 February 1975. An Air
Force upbringing moved her to Germany, Virginia, North Dakota, and finally Tampa,
Florida where she has lived most of her life. She received her Bachelor’s of Science
degree from the Department of Wildlife Ecology and Conservation at the University of
Florida in 1997.