submitted to ccafs/icraf/ciat october 2017 · which indicator is associated to each of them and can...
TRANSCRIPT

1
CSIR-SAVANNA AGRICULTURAL RESEARCH INSTITUTE (CSIR-SARI), GHANA
Supervisory Report on CSV Monitoring Plan in the Lawra-Jirapa Climate-Smart Villages,
Ghana
Submitted to
CCAFS/ICRAF/CIAT
OCTOBER 2017

2
TABLE OF CONTENT
RESEARCH TEAM ....................................................................................................................... 3
LIST OF TABLES .......................................................................................................................... 5
LIST OF FIGURES ........................................................................................................................ 6
ACRONYMNS AND ABBREVIATIONS .................................................................................... 7
ACKNOWLEDGEMENT .............................................................................................................. 8
1. Background………………………………………………………………………….……9
2. Objectives of the study……………………………………………………………..……..9
3. Approach………………………………………………………………………….……....9
4. Outcomes of survey………………………………………………………………..…….10
a. Average Time to Complete a Survey……………………………………..……..17
b. Average number of questionnaire per enumerator per day……………..……….18
c. Enumerators’ Feedback and Comments………………………………...……….18
d. Farmers’ reactions to the questions and monitoring exercise…………….……..18
e. Ideal Time for the Implementation of the Monitoring Survey…………..……....19
f. Photos of Enumerators…………………………………………………...………19
g. CSA technologies or practices implemented in 2017 at Doggoh and Bompari....19

3
List of Tables
Table 1: total number of farmers interviewed…………………………………………..10
Table 2: Average time spent on administering a questionnaire…………………………17
Table 3: average number of questionnaires completed in a day………………………..18
Table 4: CSA technologies and practices implemented in 2017………………………..19
List of Figures
Figure 1: Tied ridges technology…………………………………………………………..20
Figure 2: Earth bunding……………………………………………………………………20
Figure 3: Crop rotation between maize and cowpea………………………………………21
Acronyms and Abbreviations
CSA Climate-Smart Agriculture
CCAFS Climate Change Agriculture and Food Security
CSV Climate-Smart Village
CIAT International Center for Tropical Agriculture
NCSV Non Climate-Smart Village
ICRAF International Centre for Research in Agroforestry
ACKNOWLEDGEMENT
The research team wishes to express its gratitude to CCAFS and ICRAF for providing financial
and technical support for this study. We appreciate the CIAT team for choosing to pilot the
Monitoring plan in Ghana. We also wish to acknowledge the significant role the Savanna
Agricultural Research Institute of the Council for Scientific and Industrial Research (CSIR-SARI)
played as a host institution for the survey and also providing the necessary logistics. We are also
grateful to all farmers who participated in the survey. We are thankful to, Bawa T. Assibi, Mavis
Derigubah, Peter Maalong-Gae, David Beni and Ibrahim Hashim for collecting the data.

4
RESEARCH TEAM
The Savanna Agricultural Research Institute of the Council for Scientific and Industrial Research
(CSIR-SARI) served as the host institution for the pilot survey of the CSV Monitoring Plan of the
CCAFS project in the Upper West Region of Ghana. The implementation of the project was carried
out by the collaborative effort of the following research scientists and staff from CCAFS CIAT,
ICRISAT and SARI:
Name Portfolio in CCAFS Team Responsibility in M&E
survey
Dr. Samuel Saaka Buah CCAFS Team Leader Coordinator
Anslem B. Nyuor M&E Focal Person Supervisor
Hashim Ibrahim Team member Enumerator
Mavis Derigubah CCAFS Gender Disk Officer Enumerator
Assibi T. Bawa CCAFS Field officer, Bompari Enumerator
Peter Maalongae CCAFS Field officer, Doggoh Enumerator
David Beni Field assistance Enumerator
Stephen Dari CSIR-SARI staff Enumerator
Dr Osana Bonilla- Findji CCAFS/CIAT
Dr Anton Eitzinger CIAT
Dr Nadine Veronique
Charron Andrieu
CIAT
Dr Mathieu Ouedraogo CCAFS/ICRISAT

5
1. Background
The purpose of the study was to pilot the implementation of an M&E monitoring Plan that would
allow future monitoring to track progress of CSA adaptation options currently being implemented
in the Lawra and Jirapa Climate-Smart Village site comprising seven communities of these
districts located in the Upper West region of Ghana.
2. Objectives of the study
The study sought to assess four specific objectives as follows;
1. Assess the CSA performance at farm level.
2. Assess changes in household food, livelihood security, adaptation indicators.
(adopters/non-adopters) to assess potential effects of the CSA practices
3. Assess CSA adoption and dissemination within those communities.
Objectives 2 and 3 were examined using the Smart Monitoring Application developed by CCAFS
which covers six thematic areas or modules: Demographic baseline, Climate shocks, Climate
services, Livelihood security and financial services, Food security and Climate-smart options.
3. Approach
The implementation of the piloting of the CSV Monitoring Plan was conducted between
September and October, 2017 at the CCAFS villages in Ghana.
The first 2 days basically focused on sharing the Monitoring system developed with the CCAFS
team in Ghana together with a team of six enumerators. Specific scope and objectives of the CSV
monitoring and the data collection tool was introduced to the enumerators where all the Modules
& questions were discussed to ensure enumerators understand the critical issues of the M&E and
which indicator is associated to each of them and can properly translate for the farmers.
A pre-testing was conducted at the two CSVs of Doggoh and Bompari to identify issues that
needed to be streamlined for adjustment before the actual start of the survey. Data collection was
done with the use of Tablets where daily interviews were synchronized after each day’s work into
a central database system developed by the CCAFS/CIAT monitoring team.
The sampling period which lasted 11 days, covered a total of 190 households: 140 Households
from the baseline conducted in 2011 and an additional group of direct CCAFS beneficiaries (50
additional households in 2 of the villages). This was to ensure that at the end we have a similar
number of farmer’s interviews that are adopting and those not adopting for the purpose of
comparison. The dataset includes household heads and their spouses and the youth contributing to
agricultural production at the farm level.

6
4. Outcomes of survey
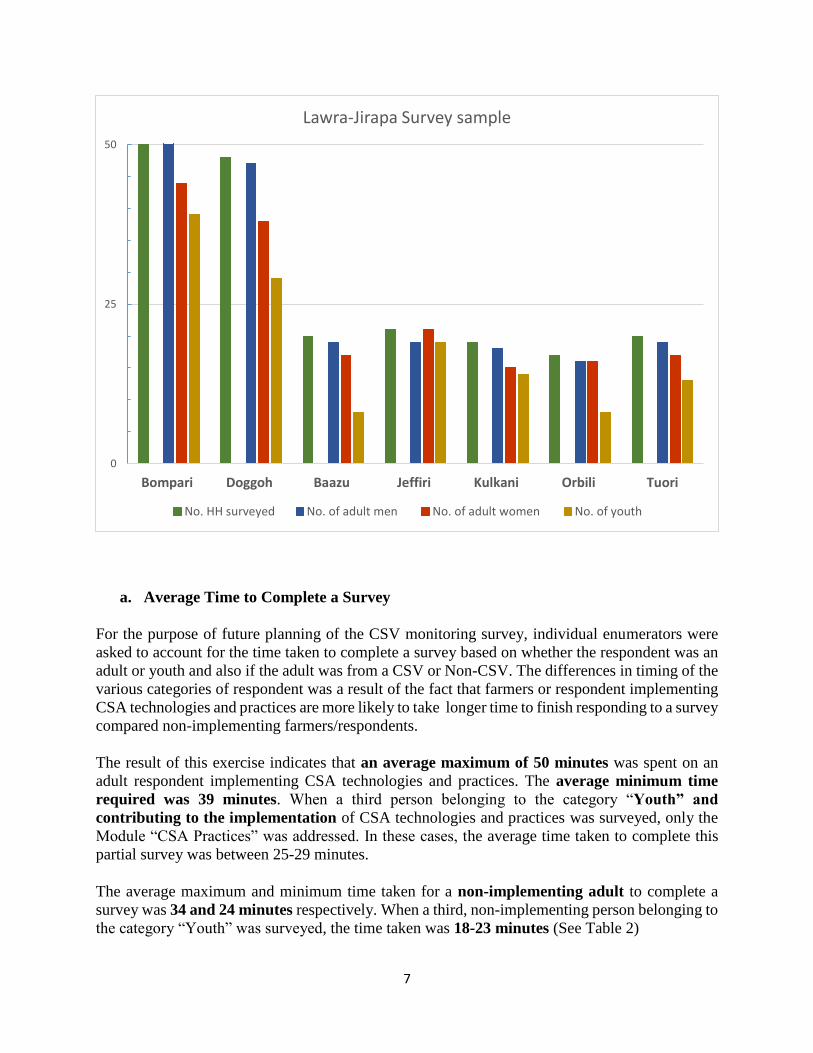
Table 1 presents the number of respondents interviewed at the CCAFS site comprising seven (7)
communities namely, Baazu, Bompari, Doggoh, Jeffiri, Kulkani, Orbili and Tuori in Ghana.
The baseline survey conducted in 2011 covered 140 households. The recent piloting of the
Monitoring plan went beyond the original respondents in the baseline which involved only
household heads to include other adult females and youth within the household setting who
contribute to agricultural production. Besides the initial 140 households from the CCAFS baseline
study, additional farmers that were not included in this 2011 exercise but who are currently
involved in the implementation of CSA technologies and practices in the two CSVs (Bompari
and Doggoh) and the other five communities were included. In order to ensure that all identified
households were covered, checks on synchronized data were done.
Table 1 shows were initial checks on households interviewed and the rest identified to establish
their status in terms of their availability for the interview. Follow ups were made in which some
of them were interviewed. Others in Baazu, Kulkani, Tuori and Orbili could not be interviewed
because they either traveled, refusal to take part or died.
After some cleaning of duplicates in the sample, a total of 358 respondents were confirmed and
authenticated has been interviewed.
Table 1: total number of households and farmers interviewed
Community Number
of HH
surveyed
Number
of
farmers
Number
of adult
men
surveyed
Number
of adult
women
surveyed
Number
of youth
surveyed
Baazu 20 36 19 17 8
Bompari 50 95 51 44 39
Doggoh 48 85 47 38 29
Jeffiri 21 40 19 21 19
Kulkani 19 33 18 15 14
Orbili 17 32 16 16 8
Tuori 20 36 19 17 13
TOTAL 195 357 189 168 130
7
a. Average Time to Complete a Survey
For the purpose of future planning of the CSV monitoring survey, individual enumerators were
asked to account for the time taken to complete a survey based on whether the respondent was an
adult or youth and also if the adult was from a CSV or Non-CSV. The differences in timing of the
various categories of respondent was a result of the fact that farmers or respondent implementing
CSA technologies and practices are more likely to take longer time to finish responding to a survey
compared non-implementing farmers/respondents.
The result of this exercise indicates that an average maximum of 50 minutes was spent on an
adult respondent implementing CSA technologies and practices. The average minimum time
required was 39 minutes. When a third person belonging to the category “Youth” and
contributing to the implementation of CSA technologies and practices was surveyed, only the
Module “CSA Practices” was addressed. In these cases, the average time taken to complete this
partial survey was between 25-29 minutes.
The average maximum and minimum time taken for a non-implementing adult to complete a
survey was 34 and 24 minutes respectively. When a third, non-implementing person belonging to
the category “Youth” was surveyed, the time taken was 18-23 minutes (See Table 2)
0
25
50
Bompari Doggoh Baazu Jeffiri Kulkani Orbili Tuori
Lawra-Jirapa Survey sample
No. HH surveyed No. of adult men No. of adult women No. of youth

8
Table 2: Average time spent on administering a questionnaire
Parameter/Enumera
tor
Max.
time
adults
CSV
Min.
time
adults
CSV
Max.
time
youths
CSV
Min.
time
youth
CSV
Max.
time
adults
NCSV
Min.
time
adults
NCSV
Max.
time
youths
NCSV
Min.
time
youth
NCSV
Hashim I. 50 35 20 15 45 30 20 15
Mavis D. 50 37 30 25 40 29 22 20
Peter M 55 42 34 30 35 25 26 21
David B 50 40 35 32 30 20 27 19
Assibi B 45 40 25 20 25 20 20 15
Stephen D 47 38 30 25 30 22 21 18
Av. Max (CSV) 49.50
Av. Min (CSV) 38.67
Max. youth CSV 29.00
Av. Min (CSV) 24.50
Av. Max (NCSV) 34.17
Av. Min (NCSV) 24.33
Max. youth (NCSV) 22.67
Av. Min (NCSV) 18.00
b. Average Number of Questionnaire per Enumerator per Day
A total of six enumerators were used to collect the survey data using Tablets. The number of a
set of questionnaires (adult, spouse and youth) completed per day by an enumerator varied from
one enumerator to the other based on the individual ability to effectively use the Tablet and also
the understanding of the question posed to the respondent.
Three (3) of the enumerators representing 50% were able to complete a set of five (5)
questionnaires comprising adult, spouse and youth in a day. Another 50% of the enumerators
were also able to complete a set of four (4) questionnaires per day (See Table 3).
Table 3: average number of questionnaires completed in a day
Enumerator Average number of set 3 persons
Hashim Ibrahim 4
Mavis Derigubah. 5
Peter Maalongae 5
David Beni 4
Assibi T Bawa 5
Stephen Dari 4

9
c. Enumerators’ Feedback and Comments
From the perspectives of some enumerators’ responses to some multiple choice questions were
limited by a few options. In their view some vital information that needed to be captured were
omitted. Other issue raised was that the timing of the survey which they indicated was not
convenient. They indicated that it was extremely difficult in some instances to get respondents
because of the harvesting they were doing during the survey. In most cases enumerators have to
trace farmers to their farms in order to interview them. Questionnaires were well understood by
enumerators.
With respect to the Tablets, it took much longer time to complete a survey in the first two days
because they were still not familiar with the questionnaire. However, it became easy to handle
and use in the subsequent days as they got familiar with the questionnaire.
d. Farmers’ Reactions to the Questions and Monitoring Exercise
The major concern raised by farmers was timing of the survey. To them the timing was not
convenient because the survey coincided with the harvesting period. Some farmers complained
that the time taken to complete a survey was rather too long. Other farmers saw the survey as
an opportunity to express their feelings (expectations and frustrations) about the CCAFS project
they are going through as far as the implementation of the project activities are concerned. Despite
the challenges farmers however expressed their appreciation to CCAFS because of the impact it
has on their production system currently. They reported that their food security issue has
improved due to increase in yield of major staple crops such as maize and sorghum. Their
income levels have also improved due to the use of good agronomic practices such as row
planting, composting and residue retention.
e. Ideal Time for the Implementation of the Monitoring Survey
Generally, reports from enumerators as well as farmers indicated that the timing of the survey was
not appropriate largely because it came at a time harvesting of farming activities were going on.
From the enumerators point of view if future surveys could be organized at a time that farmers
have finish their farming activities. Precisely they suggested that it could come before or after
harvesting. Before harvesting would be in August and after would be either between April and
May or January and February.
f. Photos of Enumerators
Photos of enumerators can be retrieved from the tablets sent to ICRAF.
g. CSA Technologies or Practices Implemented in 2017 at Doggoh and Bompari
Under the 2016/2017 cropping season, the CCAFS project implemented a number of technologies
and practices in the two CSVs of Doggoh and Bompari in the Jirapa and Lawra districts
respectively.

10
The most widely adopted technologies or practices were tied ridges, crop rotation (between
maize and cowpea), earth bunding and soybean production as nutrition enhancing strategy. Crop
planted under tied ridges and earth bunding was all maize. Soybean is being promoted in the two
CSVs particularly among women to enhance the nutritional status of the household. At
Doggoh groups of (15, 10 and 6) women produced soybean covering a total area of 1.50 acres,
whiles a group of 13 women at Bompari also cultivated half acre soybean area. The idea is to
guide women on agronomic practices of the soy crop so they can go large scale on their own
farms in the future.
Table 4 presented only farmers who are testing some combination of agronomic technologies and
practices. However, adoption of these technologies and practices are wide spread across and
beyond the CSVs through social learning framework that exist in the area.
Table 4: CSA technologies and practices implemented in 2017
Technology/pr
actices
Doggoh Bompari
No. of
male
farmers
No. of
female
farmers
Total no.
of
farmers
Total
Area
No. of
male
farmers
No. of
female
farmers
Total
no. of
farmer
s
Total
Area
Tie Ridges 7 3 10 4.20 3 3 6 2.52
Crop Rotation 1 8 9 3.74 5 0 5 2.08
Earth Bunding 0 0 0 0.00 5 1 6 2.52
Soybean 0 31 31 1.50 0 13 13 0.50
Figure 1, 2 and 3 below present photographs of tied ridges, earth bunding and crop rotation
respectively.

11
Figure 1: Tied ridges technology
Figure 2: Earth bunding

12
Figure 3: Crop rotation between maize and cowpea