subnational transparency and accountability framework · governance sustainable ... –to produce...
TRANSCRIPT

SUBNATIONAL TRANSPARENCY AND
ACCOUNTABILITY FRAMEWORK
EITI LGU Conference
February 10, 2014

Context – Resource Curse
Resource curse – also known as the “paradox of plenty.”
A number of countries rich in non-renewable natural resources tend to have less economic growth and worse development outcomes than countries with fewer natural resources (http://en.wikipedia.org/wiki/Resource_curse)
http://newsinfo.inquirer.net/files/2012/08/mining-298x224.jpg

Non-renewable resources
• Environmental devastation
• Dependence on extractive industry for income
• Corruption
• Poor social and development outcomes

Non-renewable resources
• Maximizing benefits
– Strategic investment
– Downstream industries
• Internalizing costs
• Intergenerational ownership
– Investment in social/human development
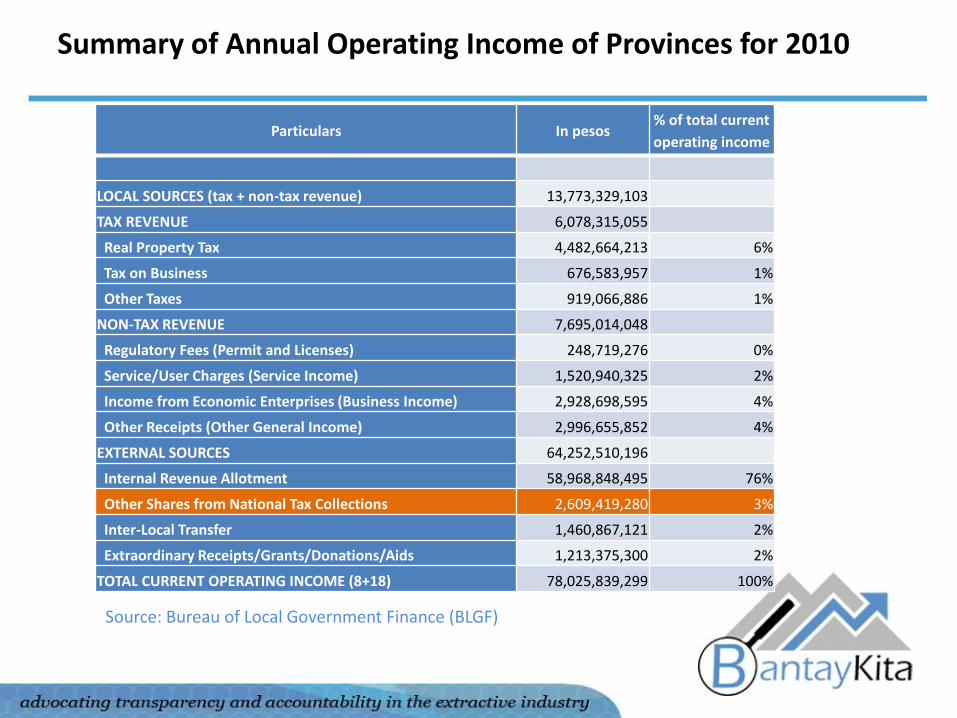
Summary of Annual Operating Income of Provinces for 2010
Particulars In pesos% of total current
operating income
LOCAL SOURCES (tax + non-tax revenue) 13,773,329,103
TAX REVENUE 6,078,315,055
Real Property Tax 4,482,664,213 6%
Tax on Business 676,583,957 1%
Other Taxes 919,066,886 1%
NON-TAX REVENUE 7,695,014,048
Regulatory Fees (Permit and Licenses) 248,719,276 0%
Service/User Charges (Service Income) 1,520,940,325 2%
Income from Economic Enterprises (Business Income) 2,928,698,595 4%
Other Receipts (Other General Income) 2,996,655,852 4%
EXTERNAL SOURCES 64,252,510,196
Internal Revenue Allotment 58,968,848,495 76%
Other Shares from National Tax Collections 2,609,419,280 3%
Inter-Local Transfer 1,460,867,121 2%
Extraordinary Receipts/Grants/Donations/Aids 1,213,375,300 2%
TOTAL CURRENT OPERATING INCOME (8+18) 78,025,839,299 100%
Source: Bureau of Local Government Finance (BLGF)
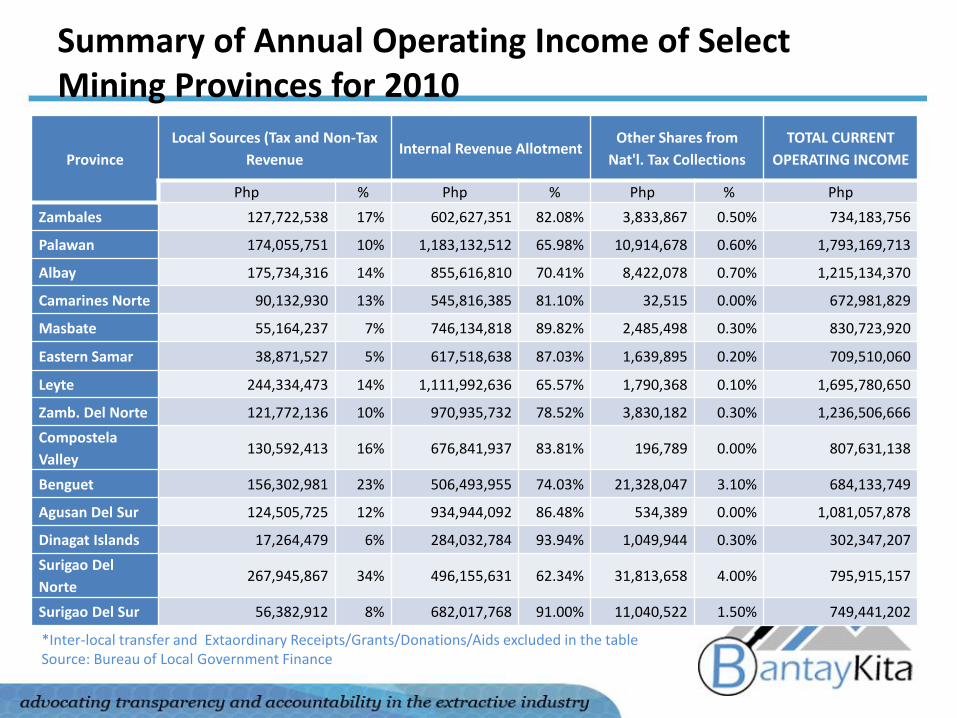
Summary of Annual Operating Income of Select Mining Provinces for 2010
Province
Local Sources (Tax and Non-Tax
RevenueInternal Revenue Allotment
Other Shares from
Nat'l. Tax Collections
TOTAL CURRENT
OPERATING INCOME
Php % Php % Php % Php
Zambales 127,722,538 17% 602,627,351 82.08% 3,833,867 0.50% 734,183,756
Palawan 174,055,751 10% 1,183,132,512 65.98% 10,914,678 0.60% 1,793,169,713
Albay 175,734,316 14% 855,616,810 70.41% 8,422,078 0.70% 1,215,134,370
Camarines Norte 90,132,930 13% 545,816,385 81.10% 32,515 0.00% 672,981,829
Masbate 55,164,237 7% 746,134,818 89.82% 2,485,498 0.30% 830,723,920
Eastern Samar 38,871,527 5% 617,518,638 87.03% 1,639,895 0.20% 709,510,060
Leyte 244,334,473 14% 1,111,992,636 65.57% 1,790,368 0.10% 1,695,780,650
Zamb. Del Norte 121,772,136 10% 970,935,732 78.52% 3,830,182 0.30% 1,236,506,666
Compostela
Valley130,592,413 16% 676,841,937 83.81% 196,789 0.00% 807,631,138
Benguet 156,302,981 23% 506,493,955 74.03% 21,328,047 3.10% 684,133,749
Agusan Del Sur 124,505,725 12% 934,944,092 86.48% 534,389 0.00% 1,081,057,878
Dinagat Islands 17,264,479 6% 284,032,784 93.94% 1,049,944 0.30% 302,347,207
Surigao Del
Norte267,945,867 34% 496,155,631 62.34% 31,813,658 4.00% 795,915,157
Surigao Del Sur 56,382,912 8% 682,017,768 91.00% 11,040,522 1.50% 749,441,202
*Inter-local transfer and Extaordinary Receipts/Grants/Donations/Aids excluded in the table Source: Bureau of Local Government Finance

Annual Poverty Incidence and Magnitude of Poor Population in Provinces Hosting Mining 2003, 2006 and 2009
Region/Province
Poverty Incidence among Population
(%)Magnitude of Poor Population
Estimate (%) Estimate
2003 2006 2009 2003 2006 2009
Zamboanga del Norte 64.2 59.5 61.6 537,442 557,351 617,057
Agusan del Sur 56 53.9 58.1 313,709 319,936 343,060
Surigao Del Norte 49.3 50.2 57 229,184 258,241 284,320
Masbate 56.9 52 54.2 422,714 425,966 441,688
Eastern Samar 36.4 47.8 54 141,236 206,979 237,122
Surigao Del Sur 43.9 42.6 44.9 212,676 223,100 261,248
Albay 43.1 42.8 43.6 469,297 512,762 512,079
Camarines Norte 50.3 41.5 42.3 244,489 215,911 232,685
Compostela Valley 40.7 36.8 36.7 248,276 235,213 212,191
Leyte 37.2 34.9 34.3 608,787 625,030 628,472
Palawan 39 36.4 29.5 315,021 329,014 273,648
Zambales 15.1 25.1 18.3 98,097 175,385 111,662
Benguet 6.6 5.2 5.8 39,449 33,480 39,249
Source: National Statistical Coordination Board, Philippine Poverty Statistics Portal

Poverty incidence among Families, (%) 2009

Natural Resource Utilization Framework
Natural resource wealth
Good governance
Sustainable development

Defining Good Governance
T&A on how decisions to extract are made
T&A on how contracts are awarded
T&A on the payments and fees
T&A in monitoring extractive operations
T&A on how the money was spent
Sustainable development

What is the natural resource
framework?
To extract or not to extract?
Who do you extract with?
How do you monitor the
project?
Are the companies
paying a fair amount?
Are the payments
reaching the state?
How should the money be
spent?
How was the money spent?
Once the dust has settled
PublishWhy You Pay
Publish WhatYou Pay
Publish What You
Spend
Publish from the start to the end
Publish What You Pay Chain for Change

Governance Goals
• Institutionalize transparency and accountability in each stage of the extractive industry value chain
• Increase publicly available information on extractive industry
• Create space for CSO participation

Existing Mechanisms to increase T&A
Issuance of contracts
• The Provincial Monitoring and Regulatory Board (PMRB) is a multistakeholder group that is tasked to designate MinahangBayan and issue licenses to SSM
Areas for improvement:
• Clear selection process of CSO representatives in PMRB
• Public availability of reports on PMRB activities
Existing Mechanisms to increase T&A
Monitoring of Mining Operations
• The Mining Monitoring Team (MMT) is a multistakeholdergroup that monitors operation and implementation of the Annual Environmental Protection and Enhancement Program (AEPEP) of large scale mining operations
• PMRB monitors the operation of SSM
Areas for improvement:
• Clear process on the selection of CSO reps in the MMT
• Increase public access on the quarterly reports of MMT (should be available in websites)

Existing Mechanisms to increase T&A
Social Development
• This is the Social Development and Management Program (SDMP) is 1.5% of operating cost of mining companies intended to assist in the development of affected communities
– 75% for implementation of projects and programs for social development of the community
– 10% of the amount for the improvement of mining technology
– 15% for information, education and communication programs

Existing Mechanisms to increase T&A
Areas for improvement:
• SDMP should contribute/support the comprehensive development plans of affected communities
• SDMP should be developed in partnership with a multistakeholder’s group that ensures that the SDMP supports the LGU’s comprehensive development plan. It can be through the LDC of LGUs

Areas for Reforms to increase T&A
Fiscal policies• A multistakeholder’s group can be created with the following
tasks:
– to monitor, audit and report the fees and taxes collected/received by local governments from extractive industries (e.g. mining, oil and gas, quarry)
– to be a sub-committee of the LDC to plan on how the proceeds from EI should be spent (including the planning and monitoring of SDMP)
– to monitor how the proceeds from EI was spent
– to produce an annual report on the state of natural resource utilization of the LGU (consolidated report of the different multistakeholder’s groups)

Areas for Reforms to increase T&A
• Transparency in the planning for the rehabilitation of mining sites
• Transparent process in renewing contracts of mining companies. Should be subjected to objective assessment (after 25 years), not automatic extension/renewal
Current Initiatives
• Transparency Initiative in Compostela Valley (TICV)
– Transparency along the entire value chain from FPIC to monitoring expenditures
– With MSG, with EO and currently drafting provincial ordinance; report template to be ready by March
• Transparency Initiative in T’boli, South Cotabato
– Capability building of stakeholders including (2) SSMcooperatives and barangay officials to implement T &A initiatives
– With MSG and draft EO


EO 020-2012 of Compostela Valley

MARAMING SALAMAT!