subsurface stratigrapy and sedimentologic control on the
TRANSCRIPT
Western Michigan University Western Michigan University
ScholarWorks at WMU ScholarWorks at WMU
Master's Theses Graduate College
8-1985
Subsurface Stratigrapy and Sedimentologic Control on the Subsurface Stratigrapy and Sedimentologic Control on the
Productive Middle Devonian Age Richfield Member of the Lucas Productive Middle Devonian Age Richfield Member of the Lucas
Formation in the Michigan Basin Formation in the Michigan Basin
Sukru Nail Apak
Follow this and additional works at: https://scholarworks.wmich.edu/masters_theses
Part of the Geology Commons
Recommended Citation Recommended Citation Apak, Sukru Nail, "Subsurface Stratigrapy and Sedimentologic Control on the Productive Middle Devonian Age Richfield Member of the Lucas Formation in the Michigan Basin" (1985). Master's Theses. 1365. https://scholarworks.wmich.edu/masters_theses/1365
This Masters Thesis-Open Access is brought to you for free and open access by the Graduate College at ScholarWorks at WMU. It has been accepted for inclusion in Master's Theses by an authorized administrator of ScholarWorks at WMU. For more information, please contact [email protected].

SUBSURFACE STRATIGRAPY AND SEDIMENTOLOGIC CONTROL ON THE PRODUCTIVE MIDDLE DEVONIAN AGE RICHFIELD MEMBER OF
THE LUCAS FORMATION IN THE MICHIGAN BASIN
By
Sukru Nail Apak
A Thesis Submitted to the
Faculty of The Graduate College in partial fullfilment of the
requirements for the Degree of Master of Science
Department of Geology
Western Michigan University Kalamazoo, Michigan
August 1985
Reproduced with permission of the copyright owner. Further reproduction prohibited without permission.

SUBSURFACE STRATIGRAPHY AND SEDIMENTOLOGIC CONTROL ON THE PRODUCTIVE MIDDLE DEVONIAN AGE RICHFIELD MEMBER
OF THE LUCAS FORMATION IN THE MICHIGAN BASIN
Sukru Nail Apak, M.S.
Western Michigan University, 1985
The depositional system of the Middle Devonian Richfield Member of Lucas Formation in the Michigan Basin
was delineated using well logs, cores, drillers' records, and the literature. The Richfield Member was deposited in Sabkha and lagoonal environments characterized by cycles of anhydrite, dolomite, and limestone. Seven significant productive dolomitic zones, interbedded with anhydrite and limestone can be correlated throughout the
study area. These zones change laterally to anhydrite towards the west flank and to dense limestone towards the east flank of the basin. Post-depositional diagenetic history of the Richfield was established with the aid of scanning electron microscopy and electron probe analysis.
SEM and electron probe analysis revealed two stages of dolomitization that were formed in the Richfield
particularly in central part of basin. This study represents detailed regional research of the Richfield
Member in the Michigan Basin and it is hoped that it will provide some information for further investigation of the
Richfield Member in Michigan Basin.
Reproduced with permission of the copyright owner. Further reproduction prohibited without permission.

ACKNOWLEDGEMENTS
This paper is a master thesis submitted by the author to the graduate faculty of Western Michigan
University. Gratitude is expressed to Dr. W. B. Harrison who supervised this work with endless help and his great friendship, Dr. W. T. Straw and Dr. J. Grace who also contributed to my study with their advise and support, and the Department of Geology that allowed me to use department facilities.
Appreciation is also expressed to Dr. A. U. Dogan who helped me with numerous SEM analyses at the University of
Iowa.I would like to thank The Graduate College for
supporting my research through Graduate Student Research Fund. I would like to thank Hunt Energy Company and Summit Petroleum Company for contributing cores for my
research.I must also thank the Turkish Government and Turkish
Petroleum Company for allowing and supporting me in completing my degree in the U.S.A. This study is also dedicated to my family for their continuing moral support. I also hope that this study will generate some ideas for further investigation of Richfield in the Michigan Basin.
Sukru Nail Apak ii
Reproduced with permission of the copyright owner. Further reproduction prohibited without permission.

INFORMATION TO USERS
This reproduction was made from a copy of a document sent to us for microfilming. While the most advanced technology has been used to photograph and reproduce this document, the quality of the reproduction is heavily dependent upon the quality of the material submitted.
The following explanation of techniques is provided to help clarify markings or notations which may appear on this reproduction.
1.The sign or “target” for pages apparently lacking from the document photographed is “Missing Page(s)”. I f it was possible to obtain the missing page(s) or section, they are spliced into the film along with adjacent pages. This may have necessitated cutting through an image and duplicating adjacent pages to assure complete continuity.
2. When an image on th„ film is obliterated with a round black mark, it is an indication of either blurred copy because of movement during exposure, duplicate copy, or copyrighted materials that should not have been filmed. For blurred pages, a good image of the page can be found in the adjacent frame. If copyrighted materials were deleted, a target note will appear listing the pages in the adjacent frame.
3. When a map, drawing or chart, etc., is part of the material being photographed, a definite method of “sectioning” the material has been followed. It is customary to begin filming at the upper left hand comer of a large sheet and to continue from left to right in equal sections with small overlaps. I f necessary, sectioning is continued again—beginning below the first row and continuing on until complete.
4. For illustrations that cannot be satisfactorily reproduced by xerographic means, photographic prints can be purchased at additional cost and inserted into your xerographic copy. These prints are available upon request from the Dissertations Customer Services Department.
5. Some pages in any document may have indistinct print. In all cases the best available copy has been filmed.
UniversityMicn5nlms
International300 N. Zeeb Road Ann Arbor, Ml 48106
Reproduced with permission of the copyright owner. Further reproduction prohibited without permission.

Reproduced with permission of the copyright owner. Further reproduction prohibited without permission.

1326589
A pak, Sukru Nail
SUBSURFACE STRATIGRAPHY AND SEDIMENTOLOGIC CONTROL ON THE PRODUCTIVE MIDDLE DEVONIAN AGE RICHFIELD MEMBER OF THE LUCAS FORMATION IN THE MICHIGAN BASIN
Western Michigan University M.S. 1985
UniversityMicrofilms
International 300 N. Zeeb Road, Ann Arbor, Ml 48106
Reproduced with permission of the copyright owner. Further reproduction prohibited without permission.

Reproduced with permission of the copyright owner. Further reproduction prohibited without permission.

PLEASE NOTE:
In all cases this material has been filmed in the best possible way from the available copy. Problems encountered with this document have been identified herewith a check mark V .
1. Glossy photographs or pages ____
2. Colored illustrations, paper or print _____
3. Photographs with dark background >J4. Illustrations are poor copy_______
5. Pages with black marks, not original copy_______
6. Print shows through as there is text on both sides of page_______
7. Indistinct, broken or small print on several pages J8. Print exceeds margin requirements______
9. Tightly bound copy with print lost in spine________
10. Computer printout pages with indistinct print_______
11. Page(s)____________ lacking when material received, and not available from school orauthor.
12. Page(s)____________ seem to be missing in numbering only as text follows.
13. Two pages numbered . Text follows.
14. Curling and wrinkled pages______
15. Dissertation contains pages with print at a slant, filmed as received _______
16. Other___________________________________________________________________________
UniversityMicrofilms
International
Reproduced with permission of the copyright owner. Further reproduction prohibited without permission.

Reproduced withpermission of the copyright owner. Further reproduction prohibited without
permission.

TABLE OP CONTENTS
ACKNOWLEDGEMENTS .................... iiLIST OF FIGURES ............ ivINTRODUCTION . ............................................... 1
Previous Work ........................................... .1Area of Study .......................... 3Purpose of Study ...................... 3Methods of Study ......................... 5
STRUCTURE ................... 10S T R A T I G R A P H Y ....... 13RICHFIELD DEPOSITIONAL ENVIRONMENT ............... .....16
Sabkha Environment ................................... ..23Subtidal Environment ................................... 29
POROSITY TYPE AND DEVELOPMENT IN R I C H F I E L D .............. 33DOLOMITIZATION .............................................. 35
Sabkha Type Dolomitization .......................... 38Seepage Reflux Dolomitization ........................ 40
SUBSURFACE CORRELATION AND FACIES INTERPRETATION .....43
CORRELATION OF THE MAJOR ZONES WITHIN THE BASIN .....55
SEM ANALYSIS ............................. 62Anderson 1-31,Isabella .............................. 63Me Guire 1-22,Oscoda .................................79
C O N C L U S I O N .................... 90APPENDIX .... 92BIBLIOGRAPHY ..... ....95
i i i
Reproduced with permission of the copyright owner. Further reproduction prohibited without permission.

LIST OF FIGURES
1. Study Area Location within Michigan...................... 42. Location of Wells within Study Area................... 73. Illustration of Type Section in Study Area............ 84. Tectonic Features Surrounding Michigan Basin.......... 115. Structure Map of Richfield Member in the Study Area..126. Middle Devonian Detroit River Group Showing Position
of Richfield Member........................................147. Late Devonian Paleogeography Illustration of Michigan
Basin as Subtropical...................................... 17
8. Generalized Depositional Cycle of Carbonates and Evaporites in the Sabkha Cycle...........................18
9. Isopach Map of Richfield Member in the Study Area....2010. Block Diagram Schematically Showing Facies and
Interpreted Depositional Environments in the Michigan Basin During Richfield DepositionalPeriod............. 21
11. Southwest - Northeast Cross-Section Across the Study Area, Showing Facies Relationship withinthe Richfield Member..................................... 22
12. Laminated Dolomitic Algal Mats .............. 2413. Decussate Algal Dolomicrite ............................ 2514. Anhydrite Laths Along Algal Mats Bedding Planes 26
15. Dolomitic Algal Mats............. 2716. Dolomitic Algal Mats and Vertical Growth of Anhydrite
Nodules.................................. 2817. Vertical Growing Anhydrite Nodules ............... 3118. Vertical Growing Anhydrite Nodules..................... 32
iv
Reproduced with permission of the copyright owner. Further reproduction prohibited without permission.

19. Dolomitization Map of the Richfield Memberin the study area.............. .................... .....37
20. Schematic Diagram Showing Sabkha and Seepage RefluxType of Dolomitization.................................... 39
21. Correlation of Major Zones within the RichfieldMember................... 45
22. Illustration of Type Section in Newaygo County........ 4723. Illustration of Type Section in Clare County.......... 4924. Illustration of Type Section in Missaukee County......5025. Illustration of Type Section in Roscommon County......5126. Illustration of Type Section in Crawford County...... 5227. Illustration of Type Section in Oscoda County......... 54
28. Porosity Map of zone-1.................................... 5629. Porosity Map of zone-2.................................... 5730. Porosity Map of zone-3.................................... 5831. Porosity Map of zone-4.................................... 5932. Porosity Map of zone-5.................................... 6033. Porosity Map of zone-6.................................... 6134. Type Log and Core Description of Anderson 1-31,
Isabella County............................. 6435. Dolomite Crystals and Secondary Porosity
Relationship................ 6536. Dolomite Crystals, Secondary Porosity, and Pyrite
Pramboids .................. 6637. Pyrite Framboids and Dolomite Crystals..................6738. Micro-Calcite Cement, Dolomite Crystals, and
Secondary Porosity Relationships........................ 6839. Dolomite Dissolution and Micro-Calcite Crystals....... 6940. Dolomite Dissolution and Micro-calcite Crystals....... 70
v
Reproduced with permission of the copyright owner. Further reproduction prohibited without permission.

41. Dolomite Rhombs and High Intercrystalline Porosity..7142. Dolomite Crystals with probable Fluid Inclusion 72
43. Dolomite Rhombs and Fluid Inclusions...................7344. Dolomite Rhombs and Secondary Porosity Relationship.7445. Dolomite Rhombs in the Pore Spaces.......... 7546. Dolomite Rhombs in the Pore Spaces................... ..7647. Two Sizes of Dolomite Crystals.................... .....7748. Small Dolomite Crystal on Large Dolomite
Crystal................................. .7849. Core Description of Me Guire 1-22,
Oscoda County..............................................7950. Micritic Limestone and Salt Crystals................... 8051. Micro-Calcite and Salt Crystals........................ 8152. Anhydrite Crystals in Micritic Limestone.............8253. Salt Crystals and Partly Dolomitic
Limestone............................. .8354. Dolomite Crystals and Micritic Limestone.............. 8455. Star-Shaped Salt Crystals (KC1)........................85
56. Dolomite Crystals........................... 8657. Micritic Limestone ...... 8758. Secondary Single Calcite Crystal in the Pore
Space. ........................... 88
vi
Reproduced with permission of the copyright owner. Further reproduction prohibited without permission.
INTRODUCTION
Previous Work
Due to poor outcrops in the Michigan Basin investigation of the Middle Devonian strata have been done based on subsurface strata by some authors. The main purpose of this studies is to define the depositional environment, facies relationships, and age determinations, of the Middle Devonian rocks in the basin. However,relatively little work has been published on thedepositional system of the Richfield Member of Lucas Formation of the Detroit River Group in the Michigan Basin.
Landes (1951) correlated the outcropping rocks of the Detroit River Group from the type locality sections. He has also used well logs and cores to define the formations' depositional environment, their contacts,
diagenesis and economically important future.Ehrnann (1964) studied stratigraphic analysis of the
Detroit River Group in the Michigan Basin. He hadsubdivided the Detroit River Group into the characteristic zones in the center of the basin and correlated them
in the entire basin.
1
with permission of the copyright owner. Further reproduction prohibited without permission.

2
Gardner (1974) worked on the Middle Devonian evaporite-carbonate complex to determine the depositional environment and diagenetic history of the rocks. He tried to establish the paleogeographic reconstruction of strata and the relationships of the environmental complex and its distribution in the basin.
Matthews (1977) studied the correlation of evaporite cycles and lithofacies of Lucas Formation in Midland County, Michigan. This study was based on the description of the cores which were used to correlate the cycles and salinity of the depositional environment in Midland county.
Briggs and Haney (1964) determined the cyclicity of textures in evaporite rocks of the Lucas Formation in the Michigan Basin. He pointed out that the texture could be related to the physiochemical conditions of mineral precipitation and specific conditions of brine concentration at that time.
Fagerstrom (1983) researched the Lucas Formation' s carbonate and evaporite complex and their petrological and regional significance in the eastern Michigan Basin. He petrologically studied the interreef rocks, transition rocks and reefs and their type of diagenetic evolution .
Reproduced with permission of the copyright owner. Further reproduction prohibited without permission.

3
Melvin (1984) has studied the Richfield Member of the Lucas Formation in Gladwin and Clare Counties in the Michigan Basin in order to establish the depositional model and facies analyses of the Richfield Member. She has also defined types of hydrocarbon traps
that were formed either structurally or stratigraphically.
Area of Study
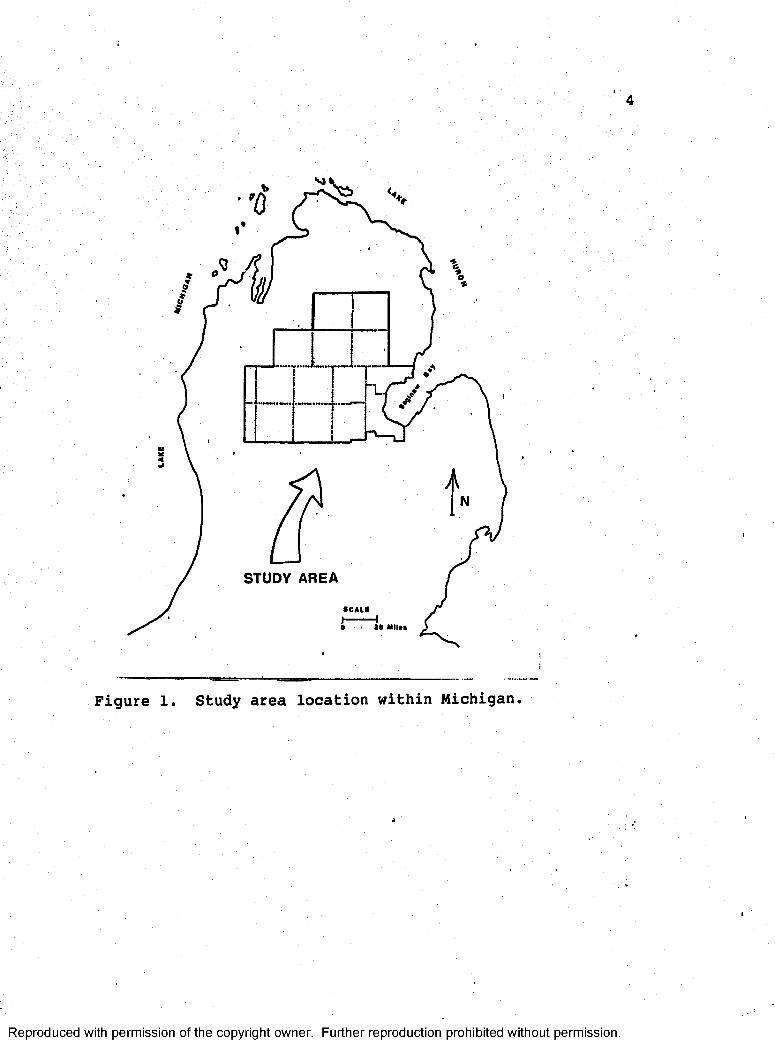
The research area includes the following counties : Crawford, Oscoda, Missaukee, Roscommon, Ogemaw, Lake, Osceola, Clare, Gladwin, Arenac, Bay, Newaygo, Mecosta,
Isabella, and Midland . (Figure 1).
Purpose of Study
The Middle Devonian Richfield Member of the Lucas
Formation contains oil and gas reservoirs within structures in the central portion of the Michigan Basin.
Reproduced with permission of the copyright owner. Further reproduction prohibited without permission.
STUDY AREA
Figure 1. Study area location within Michigan.
Reproduced with permission of the copyright owner. Further reproduction prohibited without permission.
5
However, productive units in some structures are non productive on similar structures in the eastern and western part of the basin. The purpose of this study was to determine which parameters limit production to structures in the central portion of the basin. Using available subsurface materials (well logs and core samples), objectives of this study were:
1. To divide the Richfield Member into several distinctive, usually productive zones which can be correlated throughout the basin.
2. To delineate lateral facies changes of the productive zones towards the eastern and western flank of
the basin.3. To determine the geological factors which
controlled the reservoir properties and limit production
to the central portion of the basin.
Methods of Study
Well logs, drillers' logs, cores, core analysis reports, and literature were used as data to prepare subsurface maps. One hundred and eighty-one well logs (formation density, neutron, gamma ray, resistivity, and sonic logs) were obtained from Michigan Department of Natural Resources in Lansing, Michigan. Drillers' logs were used for lithologic descriptions of the Richfield where the
Reproduced with permission of the copyright owner. Further reproduction prohibited without permission.

6
wire-line electric well logs were not available for this data. Well locations were chosen from nearly every township within the study area (Figure 2.). Producing and non producing wells from each county, in the same geologic
interval, were used to define lateral facies and lithological changes throughout Richfield. The upper (just below the massive anhydrite) and the lower (below the last dolomite zones of Richfield) contacts of the Richfield were picked from each log in the study area (Figure 3.).
The samples from Anderson 1-31, Isabella Co., and 1-22 McGuire, Oscoda Co. were examined and sampled in detail to construct the depositional model and determine post- depositional diagenesis of the sediment. Petrographic analysis were made by 1. standard petrographic microscope, 2. scanning electron microscope , and3. electron probe analysis. Fifty-one core samples were examined (27 of them from Anderson 1-31, Isabella Co. and 24 of them from 1-22 McGuire, Oscoda Co.) using the scanning electron microscope. All of the core samples were coated with either 1. gold and platinium, 2. gold and palladium, or 3. carbon.
The Jeol-35C scanning electron microscope was used to determine rock properties such as cementation,
compaction, replacement, pore geometries, sizes and shapes of microcrystaline authigenic minerals
Reproduced with permission of the copyright owner. Further reproduction prohibited without permission.

7
Osama t11-41 ai.Ntf«a«
1-MMffin QuuMmkE.UHff„ •j*a
S Nm M I'i k U.T* 11
m rm c M M i
Figure 2. Location o£ wells within study area.
Reproduced with permission of the copyright owner. Further reproduction prohibited without permission.

8
3 HAMILTON UNIT 18SEC.? T1IN- R1W SE NE NC
C LA RE CO.,M ICHIG AN1
u lU L K O C N IIT T M
M tU TN O N P O IIO tlT V
M M IIV C ANNVO H ITt . 8 1 0 0
0 0/0
SOM f 1 0 3
tO N l 2 1 8
ZONK a 22.5
IO N C 4 .
IO N I 3
8201
SONS •
IO N C 7
C LA C K U M C S T O N C
Figure 3. Illustration of type section in study area.
Reproduced with permission of the copyright owner. Further reproduction prohibited without permission.

9
(halite, quartz etc. ). Grain or crystal surface texture and textural relationship of diagenetic minerals was determined by using freeze fracture method (Dogan,
Personel comm. 1984).
Reproduced with permission of the copyright owner. Further reproduction prohibited without permission.

STRUCTURE
The Michigan Basin is an almost circular, intracratonic basin located in the central interior platform. The basin covers southern Ontario, part of the upper peninsula of Michigan, eastern Wisconsin, the northern portion of Illinois, northern Indiana, northwestern Ohio, and the southern peninsula of Michigan. The Michigan Basin is bounded by ̂ Wisconsin arch on the west, Kankakee platform on the southwest, Findlay arch on the east, and Canadian shield on the north (Figure 4.). Deposition and erosion were controlled by these tectonic features.
Many models have been proposed to define the formation and structure of Michigan Basin. The basin was present during Cambrian time in an embryonic form
(Fisher, 1979). Clastics and carbonates were deposited on pre-Cambrian basement rock. The basin' s current shape
was developed in Middle Ordovician time.During Early Silurian time , shales and carbonates
filled the basin and by Middle Silurian time reefs were developed around the basin margin. Maximum subsidence of the basin occurred in Paleozoic time. The central part of the basin received 8000 feet of sediments in Silurian and Devonian times. These sediments were mostly limestone, evaporite, and shale (Fisher, 1979). By Mississippian time, movement occurred along the basement
10
Reproduced with permission of the copyright owner. Further reproduction prohibited without permission.

11
[study area)
CANADA \
UNITED STATES ' V / S - ^ - 1 - ' - f ? \ . v v v v si- v
SHIELD
CHIGAf*BASIN
ILLINOIS > BASIN'-.
DOME
MISSISSIPPIEMBAYMENT
GULF OF MEXICO
CRETACEOUS AND TERTIARY
F T ] MISSISSIPPI** AND PENNSYLVANIAN
I I PALEOZOIC ROCKS OP PRE-MISSISSIPMAN AGE '
E 3 PRINCIPALLY p r e c a m b r ia n c r t s ta l in e r o c ks
. J O O g O MILES 0 ISO 320 KILOMETERS
Figure 4. Tectonic features surrounding Michigan Basin. Source: Hager, 1949, 1198-1205.
Reproduced with permission of the copyright owner. Further reproduction prohibited without permission.

12
ma«
mar
>4030.>3140*
U4III*
>3270)
Figure 5. Structure map of Richfield Member in the study area.
Reproduced with permission of the copyright owner. Further reproduction prohibited without permission.

faults. According to Fisher (1979) vertical movements caused NW trending folds-in the central part of the basin. A structure map (Figure, 5.) shows the current shape of basin. As it is seen on the map, the central part which is main producing area is the deepest part of the basin.
STRATIGRAPHY
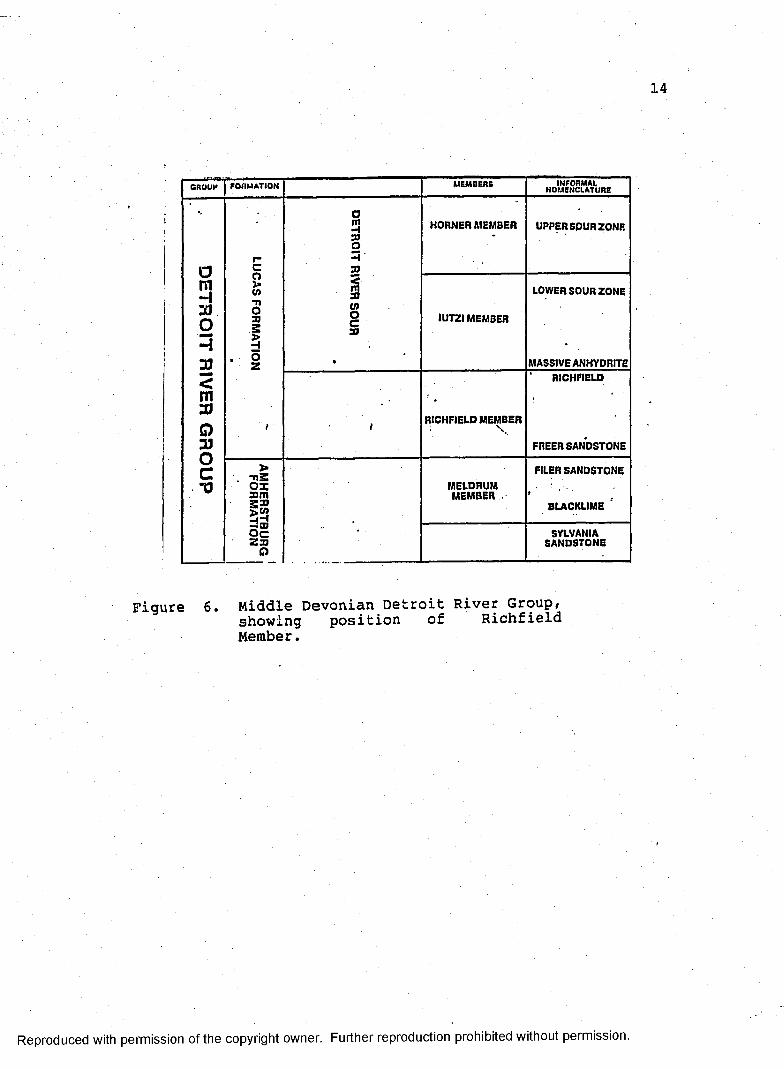
Middle Devonian age strata of the Michigan Basin include from oldest to youngest, the Detroit River Group, Dundee Formation, and Traverse Group. The Detroit River Group (Figure 6.) is composed of Sylvania Sandstone, Amherstburg Formation, and Lucas Formation (Gardner,1974).
Sylvania Sandstone is the basal part of Amherstburg Formation and can be correlated in most parts of the basin (Landes, 1951). Amherstburg Formation, which is often called " Black Limestone " by well-site geologists is present throughout the basin. Its lithology is dark-colored limestone and generally fosilliferous. It is underlying the Richfield Member. The boundary between them can be recognized by a difference in their colors. The Upper part of Amherstburg is a black-colored limestone, whereas, the
basal part of the Richfield is lighter and dolomitic. The contact between them appears just below the last dolomitic zone of Richfield member. In some areas this zone is not
13
with permission of the copyright owner. Further reproduction prohibited without permission.
GROUP FORMATION MEMBERS INFORMALNOMENCLATURE
o5ao
HORNER MEMBER UPPER SPUR ZONE
am3JOH
r-C
Hao>w-nO3s5
<maCOOca
IUTZI MEMBER
LOWER SOUR ZONE
33 • £ • MASSIVE ANHYDRITE
< RICHFIELD
m31Q / RICHFIELD MEMBERS.
!
3) FREER SANDSTONEOC >
. -n 2 OX a m 3a
FILER SANDSTONE
■o MELDRUMMEMBER t
BLACKLIME ’
i cZ aO
SYLVANIASANDSTONE
Figure 6. Middle Devonian Detroit River Group, showing position of Richfield Member.
Reproduced with permission of the copyright owner. Further reproduction prohibited without permission.
15
as dolomitic and also is black color, so this may suggest a gradational boundary between them. The Lucas Formation lies below the Dundee Formation. The upper part of Lucas Formation is dolomite and the basal part of Dundee Fm. is
limestone. However, the basal part of Dundee Fm. may be dolomitic and anhydritic especially in the western part of the basin. In the central basin Lucas Formation contains limestone, salt, and anhydrite beds. Therefore, contact between them is not clear in the western part of basin. It may also suggest a gradational boundary between the two
formations.The basal part of Lucas Formation is called the
Richfield Member which is an important oil and gas reservoir in the central Michigan Basin. It is characterized
by several cycles of anhydrite, limestone, and dolomite with its distinctively developed secondary porosity. These dolomitic zones have porosities range up to 30% especially in the central part of the basin. Towards the east and west this porosity decreases where the dolomitic lithology turns to anhydrite at the west flank and to dense limestone at the east flank. The upper part of the Richfield Member is characterized by a thick anhydrite bed which is informally called the "Big Anhydrite" . This anhydrite is continuous in the whole basin, but it is much thicker in the central and northern part of the basin.
Reproduced with permission of the copyright owner. Further reproduction prohibited without permission.

RICHFIELD DEPOSITIONAL ENVIRONMENT
During Devonian time the basin was affected by
several marine transgressions and regressions. Multiple
cycles of limestone, anhydrite, and dolomite suggest a restricted marine environment in an arid and hot climate (Dott and Batten, 1981) during the Richfield depositional
period (Figure 7.). Repeated sea level fluctuations caused vertical repetition of similar rock sequences, local unconformities, and thickness variations within the Richfield Member. These sea level changes were caused by: 1. marine water flowing through the Saginaw inlet,2. basin subsidence, and 3. changes of evaporation rates.
In a Sabkha environment sediments are deposited under very shallow water (Figure 8 .) and they are very sensitive
to sea-level fluctuations (Schreiber, pers. comm.,1985). Slight rises of sea level cause dissolution of evaporites and create pore places. These pore places were filled either by hydrocarbon or cement at the later stage. In the lower stage of sea level evaporation rates
increased, dolomitization occurred, and sea water entered the basin. The Richfield deposition shows a similar environment and it is considered to be deposited under the
Sabkha and lagoonal environment. Anhydrite beds are the key marker zones within the Richfield deposition. Laterally continuous vertically thick anhydrite beds deposited in the
16
Reproduced with permission of the copyright owner. Further reproduction prohibited without permission.

17
ITUDY AHI
Figure 7. Late Devonian Paleogeography illustration of Michigan Basin as Subtropical. Source: Dott and Batten, 1981.
Reproduced with permission of the copyright owner. Further reproduction prohibited without permission.

18
lF ig u r e
«
GENERALIZED DEPOSITIONAL CYCLE]
EVAPORITE STRUCTURES
• Tz z
i 7 5 z .= r*
Si
5 ^ • • ••gB'csays
s?
cea■C^
< >
l r\ r
v
CARBONATE FACIE
- I 3
' •= u
?U9 riDAL. May oocorne stmacrinlly exposure.!during ionq oeriocs of evaporation.
8 . Generalized depositional cycle ofcarbonates and evaporites in the sabkha cycle, source: Loucksand Longman, 1982.
Reproduced with permission of the copyright owner. Further reproduction prohibited without permission.
19
shallow water lagoon environment. Laterally discontinuousanhydrite beds and subaerial deposits indicate a sabkhaenvironment. In the Richfield Member each facies ischaracterized by these rocks:
Subtidal Environment: It is mainly alimestone facies; however, salinity of water caused either limestone or anhydrite deposition in this facies.Sabkha Environment: 1. Intertidal Facies;Limestone and dolomitic limestone are the main lithologies. Dolomitization rate increases towards the upper intertidal zone. Ripple-marks, oolites, algal laminated limestone are common. This facies may be good reservoir rocks.2. Supratidal Facies: This facies ischaracterized by nodular anhydrite. It is an important facies because it seals the reservoir rocks as a cap rock.
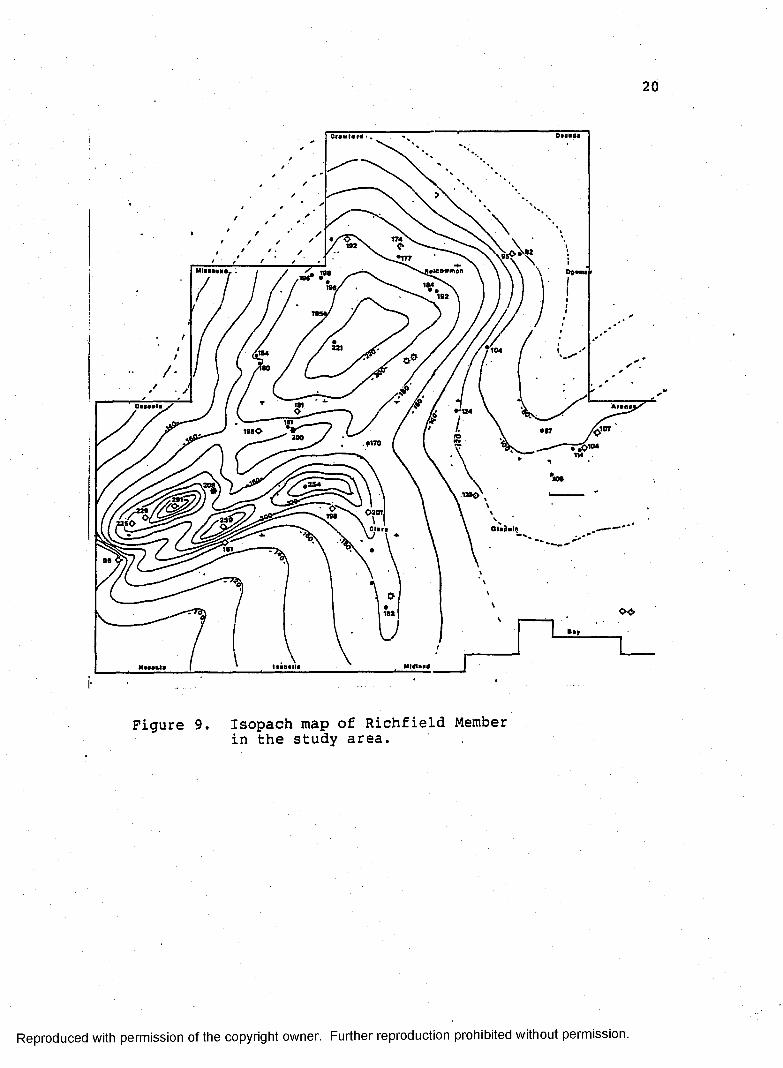
Based on an Isopach map, the Richfield Member gradually thins eastward and northeastward (Figure 9).
According to Gardner (1974) the maximum thickness of the Richfield Member was deposited in Missaukee and Wexford Counties. In the study area the maximum thickness is seen in Osceola (291 feet), Missaukee (198 feet), Clare (254 feet), and Roscommon (221 feet) Counties. Anhydrite, which was the dominant lithology in these counties controlled the maximum thickness of the Richfield Member in this part of basin. It shows that during Richfield deposition, the west flank of the basin was under supratidal conditions (Figure 10-11) while other parts of basin were receiving intertidal and
Reproduced with permission of the copyright owner. Further reproduction prohibited without permission.
20
174
184T96i1B2
231 104|t84180
181
181 .1071980 • r200
►254
.220108250
16106
Figure 9. Isopach map of Richfield Member in the study area.
Reproduced with permission of the copyright owner. Further reproduction prohibited without permission.

21
j
i
Figure 10. Block diagram schematicallyshowing facies and interpreted depositional environments in the Michigan Basin during the Richfield depositional period.
Reproduced with permission of the copyright owner. Further reproduction prohibited without permission.

22
sw NE
i
IS U B T I D A LI N T E I T IS U P R A T I D A L
i
e*
B L A c
Figure 11. Southwest-Northeast cross sectionacross the study area, showing facies relationship within the Richfield Member.
Reproduced with permission of the copyright owner. Further reproduction prohibited without permission.

23
subtidal deposits.
Sabkha Environment
Environmental factors such as temperature, sea level fluctuations, high salinity, and high evaporation rate may limit the distribution of organisms and sediments in the Sabkha environment. The supratidal and intertidal zone, collectively is defined as the Sabkha environment.
The supratidal environment of the Richfield Member, on the west flank of the basin, is characterized by thick
anhydrite bed deposition interbedded with thin carbonate
beds that were completely dolomitized .In the upper and middle supratidal zone, nodular
anhydrite is abundant. These nodules are mostly lenticular or discoidal gypsum that were later altered to nodular anhydrite (Schreiber, 1981). In the lower
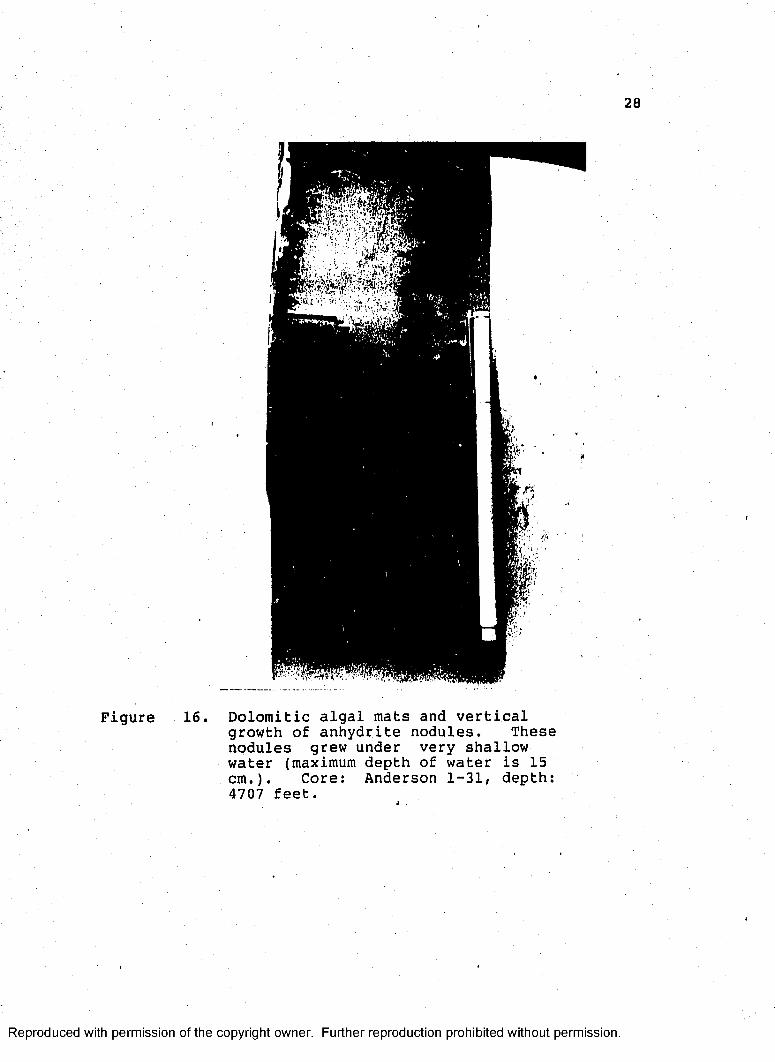
supratidal and upper intertidal zone anhydrite laths are generated within the algal mats (Figure 12, 13, and 14). Sedimentary structures such as ripple marks, cross bedding, oolites, and algal mats are associated with the Sabkha environment. The most common plants found in the intertidal zone are blue-green algae which are deposited as algal mats within the lime mud (Figure 12, 15, and 16).
Reproduced with permission of the copyright owner. Further reproduction prohibited without permission.

24
Figure 12. Laminated dolomitic algal mats. Dark anhydrite laths developed along wavy bedding planes, but oriented high angle to the bedding. The nodules appear to have formed low relief on the lagoon floor, but growth continued after deposition by revealing draping of.laminae.' Core: Anderson 1-31, depth: 4759.5 feet.
Reproduced with permission of the copyright owner. Further reproduction prohibited without permission.

Figure 13. Decussate algal dolomicrite. Darkanhydrite laths randomly oriented along bedding. Core: Anderson1-31, depth: 4771.5 feet.
Reproduced with permission of the copyright owner. Further reproduction prohibited without permission.

Figure 14. Anhydrite laths along algal matsbedding planes. Intertidal environment. CoretAnderson 1-31, depth: 4789 feet.
Reproduced with permission of the copyright owner. Further reproduction prohibited without permission.
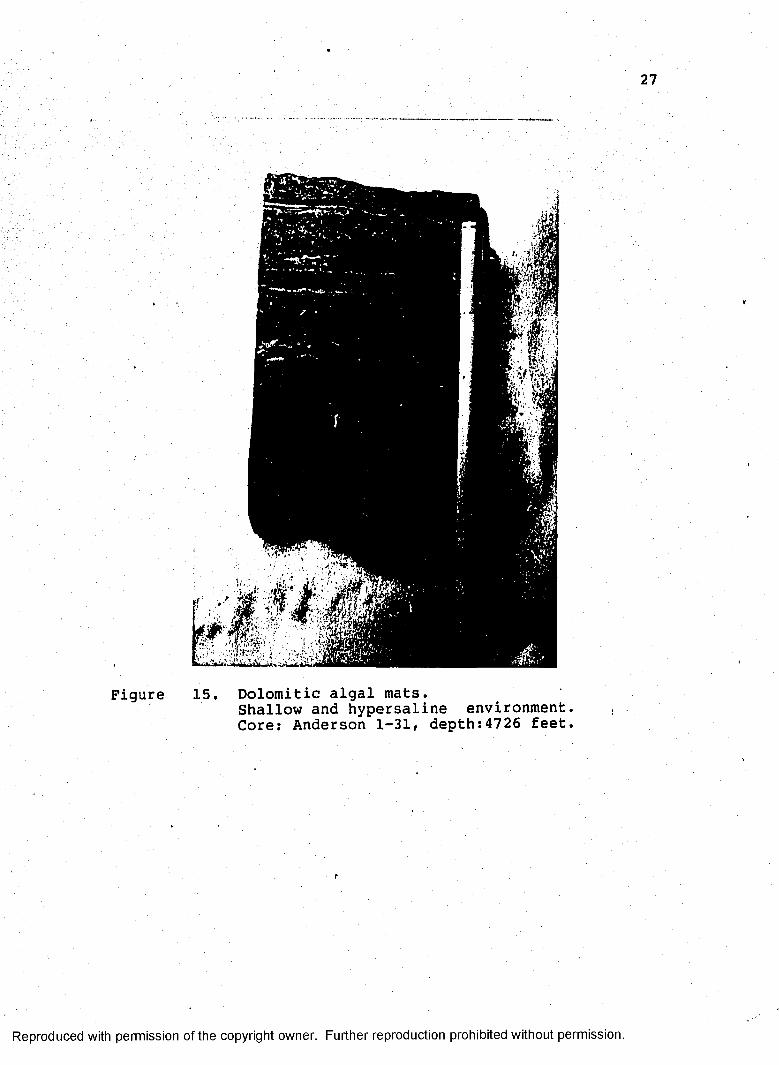
Figure 15. Dolomitic algal mats.Shallow and hypersaline environment. Core: Anderson 1-31, depth:4726 feet.
Reproduced with permission of the copyright owner. Further reproduction prohibited without permission.
28
Figure 16. Dolomitic algal mats and verticalgrowth of anhydrite nodules. These nodules grew under very shallow water (maximum depth of water is 15 cm.). Core: Anderson 1-31, depth: 4707 feet.
Reproduced with permission of the copyright owner. Further reproduction prohibited without permission.

29
Environmental factors explained above control the marine organism distribution in the Sabkha environment. In the restricted character of most Richfield lithologies macrofossils are not common, because the environment would not support those kind of organisms. Only the lower part of Richfield, deposited during a transgressive cycle of the Lucas sea contains fossils such as brachiopods and marine plankton (Melvin, 1983). The organic-rich "black Limestone" and the dark-colored lower part of Richfield may be possible source rocks for the hydrocarbon that later accumulated in the porous dolomitic zones. In the study area, especially in central part of basin which was mostly intertidal zone during Richfield deposition, dolomitization occurred resulting in high secondary porosity. Then oil and gas migrated into this area where reservoir properties allowed for hydrocarbon trapping.
Subtidal Environment
During Richfield deposition, the eastern flank of the
basin was under subtidal condition, because of the entrance of water from the ocean into the restricted basin. In the study area, this facies is represented by limestone interbedded with subaqueous anhydrite deposits. There is almost no dolomitization in this facies (10%-0%). Different salinity of the water, which was caused by sea-level
Reproduced with permission of the copyright owner. Further reproduction prohibited without permission.

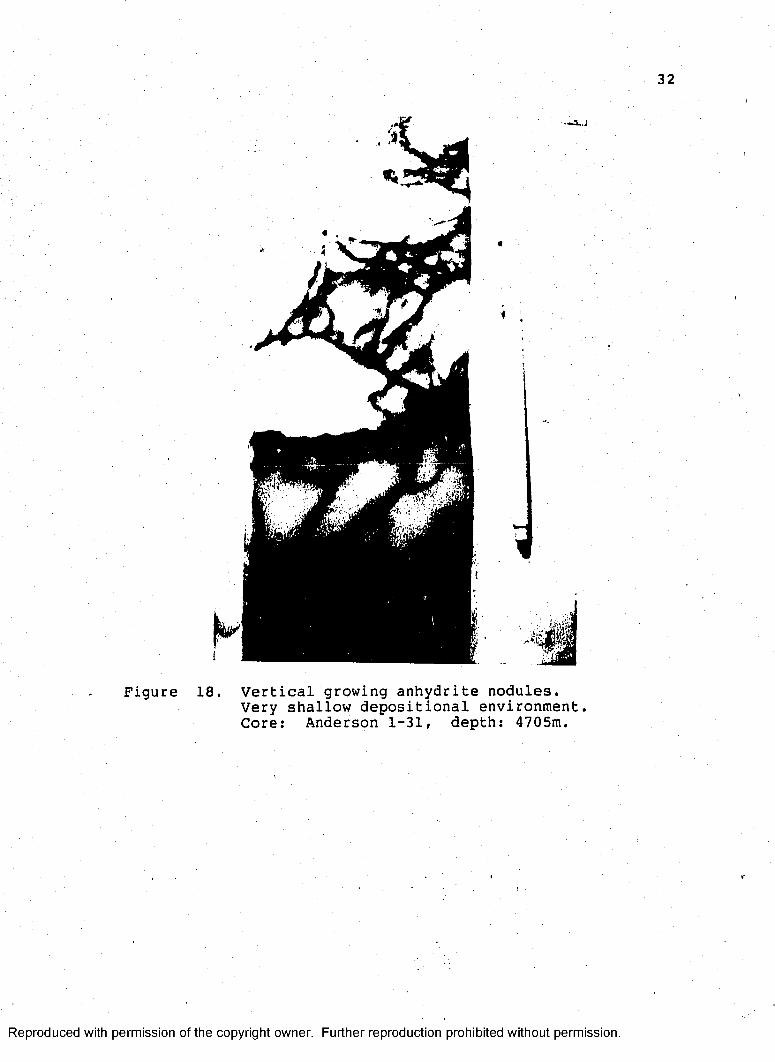
fluctuations and high evaporation, caused limestoneand anhydrite deposition in the area. At the lower stage Of sea level, Subaqueous anhydrite was deposited due to high evaporation and hypersaline water. This anhydrite is characterized by vertically growing crystals (Figure 17-18). These type of anhydrite crystals indicate that they formed in very shallow water of about 10-15 cm. (Schreiber, 1984). During this period, no influx of water from the ocean occurred and high evaporation yielded laterally expansive anhydrite deposition in the area. SEM analysis of the McGuire 1-22, Oscoda Co. core, indicates that secondary salt crystals were precipitated in the intercrystallini
porosity of the limestone. These salt (NaCl) crystals are most probably secondary because they filled the intercrystalline porosity and were precipitated on the
calcite crystals (Figure 50, 53, and 54).
In the upper part of Richfield, thick anhydrite beds called the "Big Anhydrite" were deposited due to a high rate evaporation and hypersaline water. Laterally it can be correlated, particularly in the central and northern part of basin. This vast expansion of the anhydrite beds indicate that the area remained under subtidal conditions for a long time. During this time the basin was mostly covered by lakes or ponds like those found in the present day Persian Gulf lagoon environment (Kendall, 1968). This evaporite bed covered all previous carbonate depositions,
Reproduced with permission of the copyright owner. Further reproduction prohibited without permission.

31
Figure 17. Vertical growing anhydrite nodules.Core: Anderson 1-31, depth: 4697.
Reproduced with permission of the copyright owner. Further reproduction prohibited without permission.
32
A
Figure 18. Vertical growing anhydrite nodules.Very shallow depositional environment, Core: Anderson 1-31, depth: 4705m.
Reproduced with permission of the copyright owner. Further reproduction prohibited without permission.

so most of oil and gas production in Richfield carbonates is found beneath the "Big Anhydrite" bed. At the upper last zone of the Richfield deposition, the area was affected by a transgressive cycle and was covered by water which was less saline than the previous inudations. This last Richfield carbonate sequence was deposited mostly in the central part of the basin. Even though the sequence has high porosity it contains no economical hydrocarbon
accumulation. "Big Anhydrite" beds apparently blocked the hydrocarbons from migrating up into the last carbonate bed. After the deposition of the last carbonate unit of the Richfield Member, the basin again became a restricted environment and the Richfield was covered by the another
thick anhydrite bed which is called "Massive Anhydrite".
POROSITY TYPE AND DEVELOPMENT IN THE RICHFIELD
Two types of porosity are present in the carbonate sequences of the Richfield Member, 1) primary porosity related to the depositional environment, and 2 ) secondary porosity related to rock diagenesis occurring after
deposition.Primary porosity forms as a result of events which
occur during the depositional process. Certain environments have good primary porosity while others have almost none.
33
Reproduced with permission of the copyright owner. Further reproduction prohibited without permission.

34
For instance, oolites deposited in a high energetic environment have good porosity because the fine size materials which can fill in the pores and decrease porosity are winnowed away by currents. However, some porosity may be associated with chemical processes instead of physical depositional processes. Primary porosity is modified by compaction, solution, and cementation, which may cause a secondary decrease or increase the porosity (Choquette and Pray, 1970).
Secondary porosity is the result of diagenetic alteration. Textural characteristics (grain size, shape, and packing) also help to create and increase the secondary porosity. All these features are controlled by
the rock's facies.In the Richfield Member of the Lucas Formation
good to poor porosity developed in the carbonate sequences. In the central part of basin, which is the most productive region in the Michigan Basin, dolomitization caused the high secondary porosity. However, the eastern and western flank of the basin show an entirely different picture from the central part. The western flank, which was mostly a supratidal environment during the Richfield deposition period, is characterized
by thick anhydrite beds. Because of this lateral facies changes in the Richfield no porosity developed on the west flank of the basin. On the east flank
Reproduced with permission of the copyright owner. Further reproduction prohibited without permission.

of the basin, the Richfield is characterized mainly by limestone interbedded with subaqueous anhydrite. A low energy environment, poor water circulation, and poor dolomitization of the limestone yielded the low porosity in this region. The samples from Anderson 1-31, Isabella Co. in the central part of the basin, and McGuire 1-22, Oscoda Co. in the northeastern part of the basin were studied to determine how the facies change laterally from the central part to the eastern flank. In the study area, high secondary porosity developed in the Sabkha environment. It seems that the dolomitization which occurs throughout the Sabkha environment, is the most important process involved in creating secondary porosity.
DOLOMITIZATION
Certain conditions are necessary for the formation of dolomite in carbonate sequences. The first and the most
important one is that a source of Mg ion must be present in the environment. Other factors include the Mg:Ca ratio sulfate concentration, organic material, iron content, and bacterial activity in the environment (Longman, 1981). Several models have been proposed for the formation of dolomite. These models are: 1. primary precipitation, 2.seepage refluxion 3. solution cannibalization, 4. capillary concentration, 5. mixing of fresh and marine
35
Reproduced with permission of the copyright owner. Further reproduction prohibited without permission.

36
waters, and 6 . subsurface brines (Longman, 1981).Dolomite can be either primary or secondary in the
carbonate sequences as suggested by Zenger, 1972. Primary dolomites are associated with evaporite and they are mostly found in the Sabkha environment. Secondary dolomitization occurs by replacement of pre-existing carbonate materials. A number of factors control the dolomitic replacement of carbonate. Composition and grain size are significant controlling factors. Aragonite, high Mg-calcite, and fine-grained size materials such as micrite become dolomitic faster than coarser-grained sizes.
During Richfield deposition, the Michigan Basin was a restricted basin which was characterized by several cycles of regressions and transgressions. High evaporation, dry
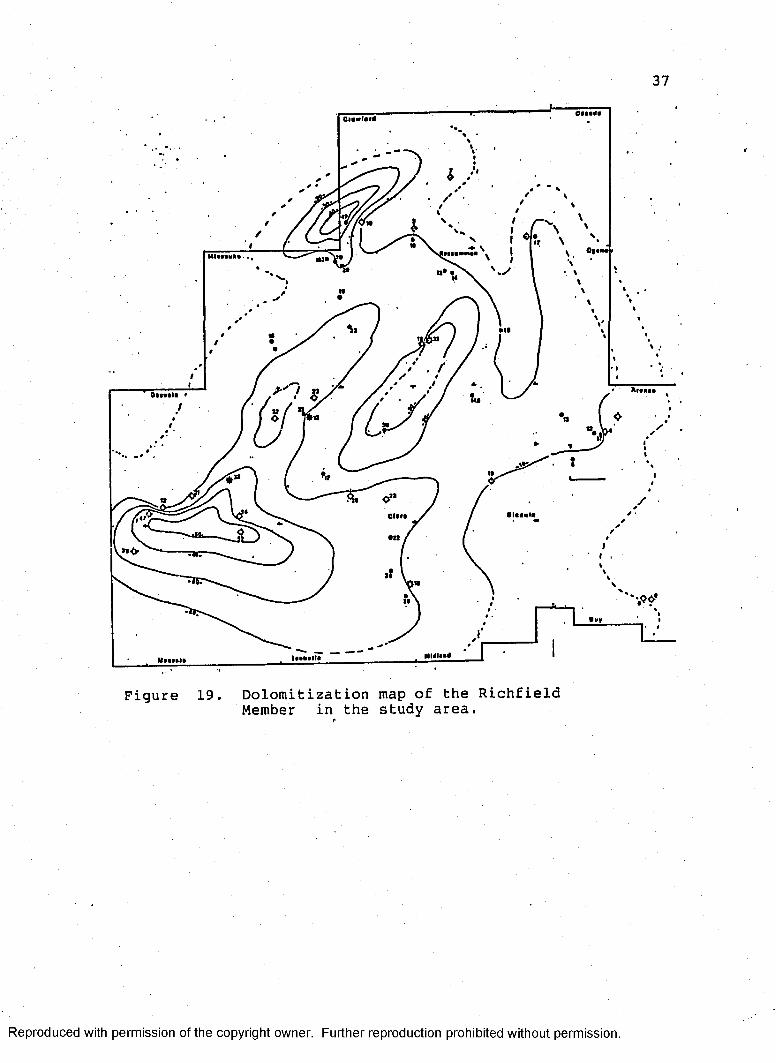
climate, and high salinity of the water resulted in thick anhydrite bed deposition in the Sabkha environment. There is also abundant dolomitization in this area (Figure 19). Complete dolomitization of the carbonate beds in the supratidal environment can be explained by Sabkha-type of
dolomitization (Figure 20).
Reproduced with permission of the copyright owner. Further reproduction prohibited without permission.
37
0|ti
HI
Clin
•tl
Figure 19. Dolomitization map of the Richfield Member in the study area.f
Reproduced with permission of the copyright owner. Further reproduction prohibited without permission.

38
intertidalSUPRATIDAL SUBTIOAL
ANHYDRITE , A A A a O N IT E + M g C A L C IT E
EEEPAQE .H E F L U X IO N ZO N e
'!
Figure 20. Schematic diagram showing sabkha and seepage reflux type of dolomitization.
Reproduced with permission of the copyright owner. Further reproduction prohibited without permission.
39
Sabkha Type Dolomitization
Normal marine water contains more sulfate ions than Ca++ and Mg++ ions . When the sea is allowed to evaporate, gypsum is precipitated until all Ca++ ions have been used up, and the rest of sulfate remains in residual brines. Major seawater ions and this sulfate reaction are listed below.
Na+Mg++K+Ca++
(Eg. 1) Ca + SO4 = CaS0 4 + residual SO4
Cl”SO4
Precipitation of gypsum increases the Ca:Mg ratio which promotes dolomitization of the carbonate host rocks. For example, in Newaygo, Mecosta, and Osceola Counties the thin carbonate beds are all dolomitic.(Eg. 2) Mg + 2CaC03 = CaC03 MgC0 3 + Ca++As a result of these reactions additional SO 4 ions combine with Ca++ ions to make more CaS0 4 , shown below (Shearman, 1978).(Eg. 3) Ca + SO4 = CaS0 4 + residual SO4(Eg. 4) Mg + 2CaC03 = CaC03 MgC0 3 + Ca++(Eg. 5) Ca + residual SO 4 = CaS0 4 (Gypsum)
Reproduced with permission of the copyright owner. Further reproduction prohibited without permission.
40
The reaction explained above, allows for, more calcium sulfate to be produced in the carbonate Sabkha. That is why the thickest part of the Richfield is deposited in the supratidal environment.
Seepage Reflux Model Dolomitization
In the central part of basin, similar thick anhydrite and dolomite beds are preserved. During Richfield deposition, the restricted Lucas sea had a different salinity than the adjacent open sea. Sea level fluctuations were caused by the difference salinity of each transgressive
and regressive cycles. This resulted in anhydrite and limestone deposition in the central part of basin. Loss of water by evaporation caused lowering of sea level and increased the concentration of the remaining brine. Then waters entered from the adjacent open ocean. This remaining brine sank and while incoming water from the ocean flowed along the surface and maintained water circulation across the shelf. At this time the Ca++ ions reacted with with the hypersaline brine to make CaSC>4 . Than, Mg-rich sea water seeped towards the sea and the Mg++ reacted with
the CaC0 3 , which caused the limestone to turn to dolomite in this zone. This circulation is called seepage reflux by
Adams and Rhodes (1960), (Figure 20). It seems that Sabkha and seepage reflux models are the appropriate model for the widespread dolomitization in the Sabkha environment.
Reproduced with permission of the copyright owner. Further reproduction prohibited without permission.

41
The important question is why the dolomitization did not occur or, was only slightly formed in subtidal environment. According to Kastner, (1983) the important condition for the dolomitization is not the high Ca:Mg ratio as it was previously thought. She states that a low dissolved sulfate (S0 4 ) content is very important fordolomitization. High dissolved sulfate in the sea water inhibits dolomite formation in the environment. The eastern flank of the basin was a subtidal depositional environment at this time. The lithology is mainly micritic limestone and subaqueous anhydrite. A low energy environment and poor dolomitization created little porosity in the
limestone. Due to low water circulation in the subtidal environment, removal of sulfate ions from Sabkha environment, either by the seeping of the sulfate-rich sea water from intertidal to subtidal or by being washed by water circulation, increases the amount of free sulfate ion concentrations. This excess of sulfate ions inhibits the dolomitization in the subtidal environment.
SEM analysis which was done in two wells, revealed that two types of dolomite crystals formed within the Richfield. They were formed at a slightly different time during Richfield diagenesis. At the first stage, the limestone beds were dolomitized (Seepage Reflux Method) and big dolomite crystals were formed. They are not rich in Mg content. A loss of volume due to dolomitization
Reproduced with permission of the copyright owner. Further reproduction prohibited without permission.
42
created secondary porosity of the limestone (see in the SEM section). At the second stage small dolomite crystals were formed on the big dolomite crystals and in the pore spaces. The second type of crystals are very small in size and have a high Mg content. SEM result are given about the two types of dolomitization in the SEM analysis section.
Reproduced with permission of the copyright owner. Further reproduction prohibited without permission.
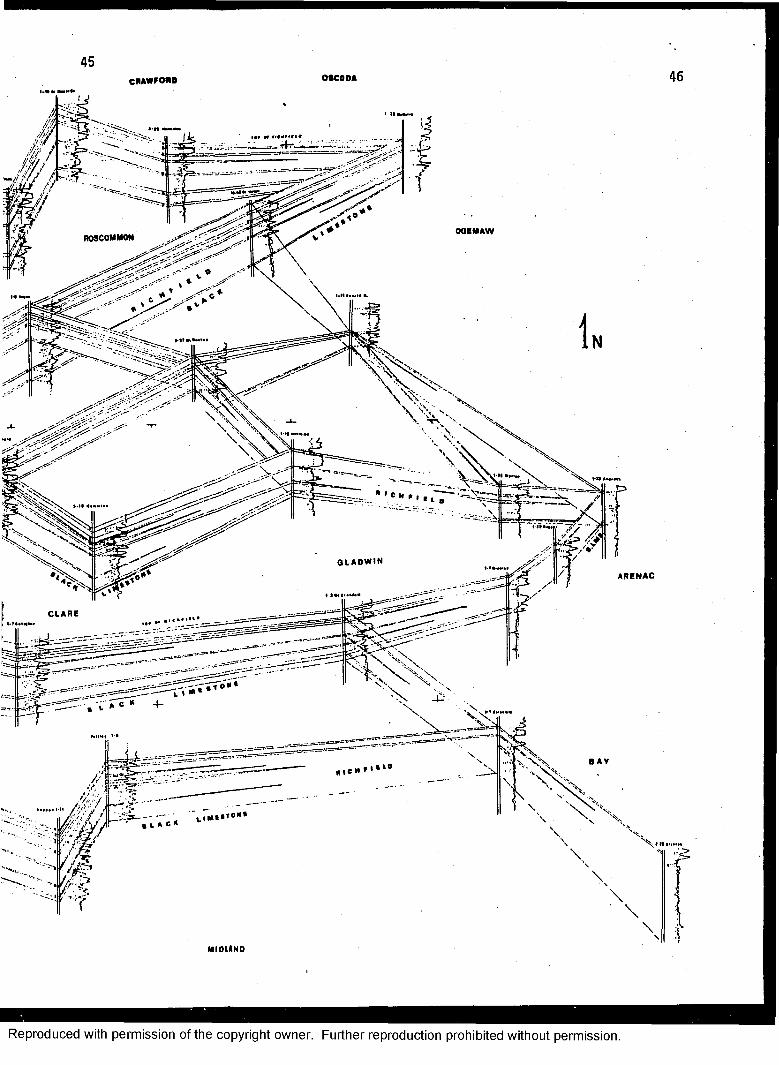
SUBSURFACE CORRELATION AND FACIES INTERPRETATION
The Richfield Member of Lucas Formation ischaracterized by Sabkha and lagoonal facies type deposits. It is underlain by a dark-colored coralline rich "Black Limestone". The differences in lithologies between the "Black Limestone" and the Richfield Member indicates normal marine conditions in the basin during the "Black Limestone" depositional period. These conditions changed to a widespread shallow lagoonal and Sabkha-type depositional environment during Richfield deposition. On the west flank and central portion of the basin, a thick Sabkha-type deposit occurs, whereas, on the eastern side of basin lagoonal carbonates were deposited. In the upper part of the Richfield, the
"Big Anhydrite" covers all previous Richfield deposits as a cap rock.
The top contact of Richfield is located between the "Massive Anhydrite" and the carbonate bed deposited during the last influx of sea water from the Saginaw inlet, after "Big Anhydrite" accumulated. As mentioned before the Richfield is composed of anhydrite, dolomite, and limestone beds. Sabkha deposits occur in the
supratidal and intertidal environments. These lithologies can be correlated in the basin (Figure 21). Anhydrite beds
43
Reproduced with permission of the copyright owner. Further reproduction prohibited without permission.

are mainly laminar, vertical growth crystals, and nodular type of deposits. In the supratidal zone nodular anhydrite beds are mostly discontinuous as many of them were deposited subaqueously in ponds on the upper intertidal or lower supratidal zones. Most were not deeper than 15cm. The Richfield Member is herein subdivided into seven
zones which are generally dolomitized in the central part, change laterally to anhydrite towards the west flank, and change to limestone towards the east flank of the basin (Figure 21).
On the west flank, the Richfield Member is composed of thick anhydrite beds interbedded with thin dolomitized carbonate beds. These deposits are found in Newaygo, Mecosta, and Osceola counties and formed in the supratidal
environment. Therefore, none of the seven carbonate zones can be identified in this area (Figure 22). Lutz 1-27/A (Newaygo Co.), Schwalm 1-15, Leach 1-4, and R.Quart 1-30 from Osceola Co.,and R.Thelma 1-12 from Mecosta Co. are typical wells in the western flank.
In the central part of basin, Richfield was deposited in an intertidal environment. In the regression cycle, the lower stage of sea level, influx of water from the sea
affected the environment. Dolomitization occurred and progressed towards the central area and decreased towards
the eastward edge of the basin. This dolomitization caused high secondary porosity in the central part of basin.
Reproduced with permission of the copyright owner. Further reproduction prohibited without permission.

CRAWFOftB
O SC E O LA
M E C O S T A
Reproduced with permission of the copyright owner. Further reproduction prohibited without permission.

Reproduced with permission of the copyright owner. Further reproduction prohibited without permission.
Reproduced with permission of the copyright owner. Further reproduction prohibited without permission.

Reproduced with permission of the copyright owner. Further reproduction prohibited without permission.

47
1 -2 7 A LUTZS E C .1 T T 1 8 H - R 1 1 W B W M W SC
NEWAYGO CO., MICHIGAN
GAMMA «AV 2.0 BUU D1N1ITT 2.3 3.0
400 4.5NVUINON R0AQI1TV
3 0 13
V 4264
i
I
.4300
SWWWl« \ \ v
ftmwv
-4400
Figure 22. Illustration of type section in Newaygo County.
Reproduced with permission of the copyright owner. Further reproduction prohibited without permission.
2
48
Wells used in this study which represent deposition in
the central basin, include the Hamilton Unit 3-18 (Clare C o.), Molhoek 9-31 (Missaukee Co.), Helveston 4-25 (Crawford Co.), and Porter Hogan 1-8 (Roscommon Co.). It is seen in these wells that the Richfield lithology can be correlated from well to well. In the Hamilton Unit 3-18 (Clare Co.) seven carbonate zones and anhydrite beds are seen. The porosity range in this well from 9% (zone-6) to 22.5% (zone-3 ), (Figure 23).
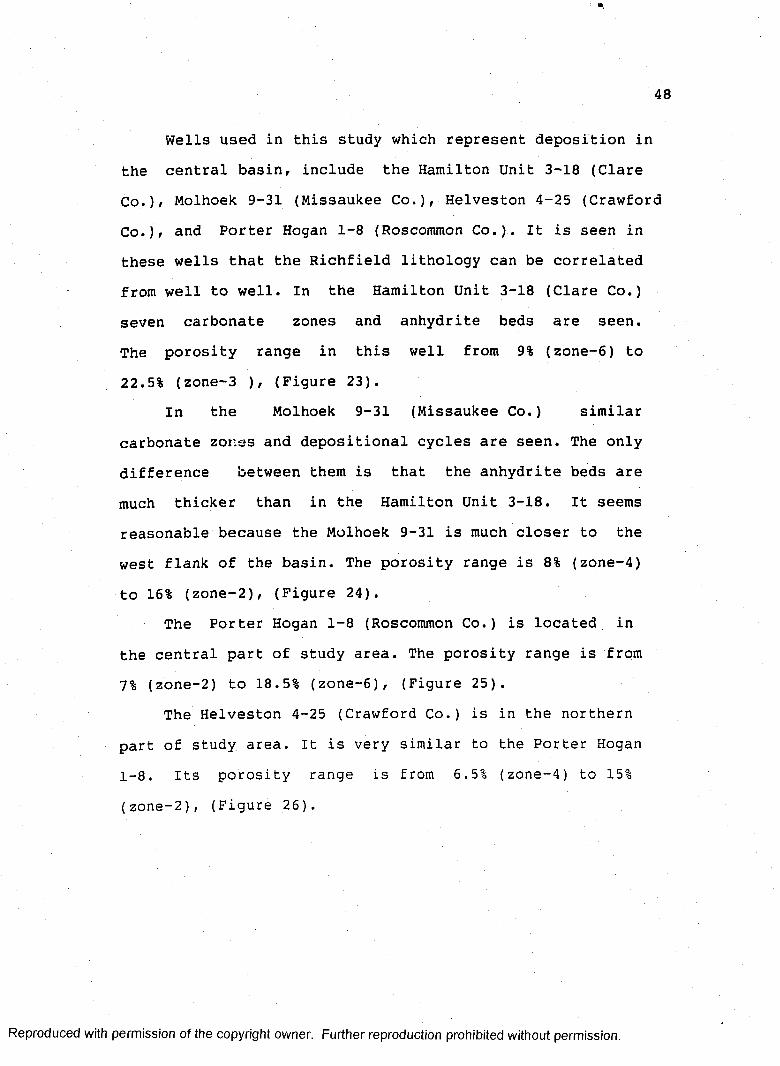
In the Molhoek 9-31 (Missaukee Co.) similar carbonate zones and depositional cycles are seen. The only difference between them is that the anhydrite beds are much thicker than in the Hamilton Unit 3-18. It seems reasonable because the Molhoek 9-31 is much closer to the
west flank of the basin. The porosity range is 8% (zone-4)
to 16% (zone-2), (Figure 24).The Porter Hogan 1-8 (Roscommon Co.) is located in
the central part of study area. The porosity range is from 7% (zone-2) to 18.5% (zone-6), (Figure 25).
The Helveston 4-25 (Crawford Co.) is in the northern
part of study area. It is very similar to the Porter Hogan 1-8. Its porosity range is from 6.5% (zone-4) to 15%
(zone-2), (Figure 26).
Reproduced with permission of the copyright owner. Further reproduction prohibited without permission.

3 HAMILTON UNIT 18»eC.T T U N -M W S E N E N I
CLARE CO.,MICHIGAN•
M ____________»um B IH I I f t , ,
Figure 23. Illustration of type section in Clare County.
Reproduced with permission of the copyright owner. Further reproduction prohibited without permission.
509 r 3 1 . M O L H O E K
SEC 31 T22N- ROW NW NWSW M IS S A U K E C O ., M IC H IG A N
N IU M 0 9 POROIIVV
u________ ac__________is
Ispi-l II
i d i i i _ 4 . . 1 .
■lac* umiioMi__
Figure 24. Illustration .of type section in Missaukee County.
Reproduced with permission of the copyright owner. Further reproduction prohibited without permission.

PORTER HOGAN 1-88IC.I N-II'W NE BE tW
ROSCOMMON CO., MICHIGANflmm iit miLi.nmiiii
JOMB t •
4 0 N t | F
IDMI S IJ
....CJU*
Figure 25. Illustration of type section in Roscommon County.
Reproduced with permission of the copyright owner. Further reproduction prohibited without permission.

52
HELVESTON 4 -2 5SEC >1 TilN • R1W NE SW NE
CRAWFORD CO., MICHIGAN
Figure 26. Illustration of type section in Crawford County.
Reproduced with permission of the copyright owner. Further reproduction prohibited without permission.

53
The cycles of regressions and transgressions caused many unconformities within the Richfield
Member. That is why individual dolomite or anhydrite beds would disappear from one field to another one.
The McGuire 1-22 well is located, Oscoda Co., in the northeastern portion of study area. It was completed as a dry well. The depositional environment is subtidal and has poor dolomitization and low porosity within this portion of the Richfield Member. The porosity range is 0% (zone-1) to 14% (zone-7), (Figure 27).
Reproduced with permission of the copyright owner. Further reproduction prohibited without permission.

54
1-22 MC GUIRE SEC.23 T25N - R2E SW NE SW
OSCODA C0„ MICHIGAN
b«mm« ■»
U A t t W I AMHU1MTI
•LAC K U M K IfO N I
_iUt« 91
-011- _14-
t o u t
IO N I I
- o & -
I O N I I 10
IO N I I
IO N I I 9
icmi r u
T
Figure 27. Illustration of type section in Oscoda County.
Reproduced with permission of the copyright owner. Further reproduction prohibited without permission.
CORRELATION OF THE MAJOR ZONES WITHIN THE BASIN
Major zones followed throughout the basin are well developed especially in the central part of basin. For zone-1 (top of Richfield) to zone-6 porosity maps were made to establish porosity patterns in each different zone. The highest porosity developed in the central part of basin, and each zone's porosity decreased and approached zero towards the east and west flank of the basin.
Although the precise pattern and actual value of the porosity changes from zone-1 to zone-6, the similarily is enough to allow some general statements about the origin and the relationships of the porosity in different zones.
The similar pattern of the porosity maps from these six zones indicates that the same depositional environment was dominant during the deposition of these major carbonate zones. Because of the dolomitization, porosity is much better developed in the central part of the basin. In the supratidal zone (west flank), porosity becomes very low and zero in Mecosta and Newaygo Counties. Because of the high concentration of anhydrite in the eastern flank of the basin, dolomitic carbonate zones turn into impermeable limestone and porosity drops down to zero. The limestones are deposited seaward of the environments affected by the dolomitizing fluids.
55
Reproduced with permission of the copyright owner. Further reproduction prohibited without permission.

56
* r
iit *12
i
*S|• I t
Qiiullti 1U
• s
n s
17
II
••r
Figure 28. Porosity map of zone-1.
Reproduced with permission of the copyright owner. Further reproduction prohibited without permission.

57
18.7
0 | i m
1.1 IS*
•IS
Figure 29. Porosity map of zone-2.
Reproduced with permission of the copyright owner. Further reproduction prohibited without permission.

58
t2J
O a iu l i
aa1
127
Figure 30. Porosity map of zone-3.
Reproduced with permission of the copyright owner. Further reproduction prohibited without permission.

59
Oicodt
>•?
Figure 31. Porosity map of zone-4.
Reproduced with permission of the copyright owner. Further reproduction prohibited without permission.

60
it*•«
Oo
• 0•I u
00
»•»
Figure 32. Porosity map of zone-5
Reproduced with permission of the copyright owner. Further reproduction prohibited without permission.

61
>u
UJ
•11
• 0• 0•t
°!’*0#D O
'•IT•14(
• r
*•1
lia b a ltt
Figure 33. Porosity map of zone-6. ,
I
Reproduced with permission of the copyright owner. Further reproduction prohibited without permission.
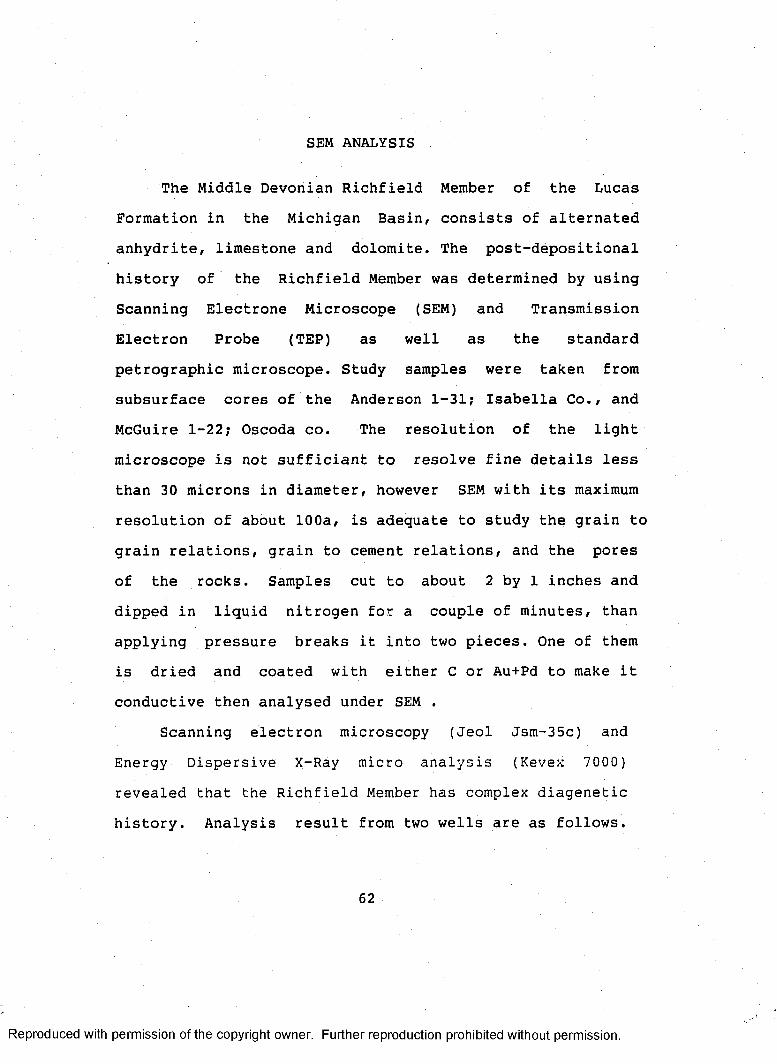
SEM ANALYSIS
The Middle Devonian Richfield Member of the Lucas Formation in the Michigan Basin, consists of alternated anhydrite, limestone and dolomite. The post-depositional history of the Richfield Member was determined by using Scanning Electrone Microscope (SEM) and Transmission Electron Probe (TEP) as well as the standard petrographic microscope. Study samples were taken from subsurface cores of the Anderson 1-31; Isabella Co., and McGuire 1-22; Oscoda co. The resolution of the light microscope is not sufficiant to resolve fine details less than 30 microns in diameter, however SEM with its maximum
resolution of about 100a, is adequate to study the grain to grain relations, grain to cement relations, and the pores of the rocks. Samples cut to about 2 by 1 inches and dipped in liquid nitrogen for a couple of minutes, than applying pressure breaks it into two pieces. One of them is dried and coated with either C or Au+Pd to make it conductive then analysed under SEM .
Scanning electron microscopy (Jeol Jsm-35c) and Energy Dispersive X-Ray micro analysis (Kevex 7000) revealed that the Richfield Member has complex diagenetic history. Analysis result from two wells are as follows.
62
with permission of the copyright owner. Further reproduction prohibited without permission.

63
1) Anderson 1-31 Rosebush field T16N R3WIsabella Co.,Michigan
The Anderson 1-31 was completed as a dry hole. It was off structure and was about 30 feet deeper than the closest producing well in the area. According to cores of the Anderson 1-31 the Richfield was deposited in mostly upper intertidal environment ( Figure 34 ). SEM analysis
shows that these authegenic minerals observed in the Richfield Member's carbonate sequences .
Dolomite : Two types of dolomite crystals arepresent in the samples. SEM and X-Ray analysis show the large dolomite crystals have less Mg content than small dolomite crystals(see photos). In the first stage of dolomitization, calcite altered to large dolomite crystals. Due to volume loss secondary porosity created (see photos). Subsequently, Mg rich water came into the pores and small dolomite crystals formed. Their size is much smaller than the first generation dolomite. The different Mg content indicates that slightly different conditions affected the
area during its diagenetic history.Micro-calcite is seen in the samples' photographs as
cement 3-5 microns in size.
Reproduced with permission of the copyright owner. Further reproduction prohibited without permission.

OEPOSITIONAL ENV
N E U T R O NCORE0 % HIQH LOW
4678
Alga l Lam lnalad M u d ilo n a
4700
Nodular Anhydrlta Cryal.
.O o lita a
47974800
Figure 34. Type log and core description of Anderson 1-31, Isabella County.
Reproduced with permission of the copyright owner. Further reproduction prohibited without permission.
SU
BT
IOA
L
Authigenic quartz: it is found as a trace element in
the samples.NaCl ; x-ray analysis revealed that Na and Cl are
found in the samples. Salt is the reasonable assumption.Authegenic pyrite and some zeolite like minerals are
presented in these samples. Analysis results on the
samples of Anderson 1-31, Isabella Co. are;
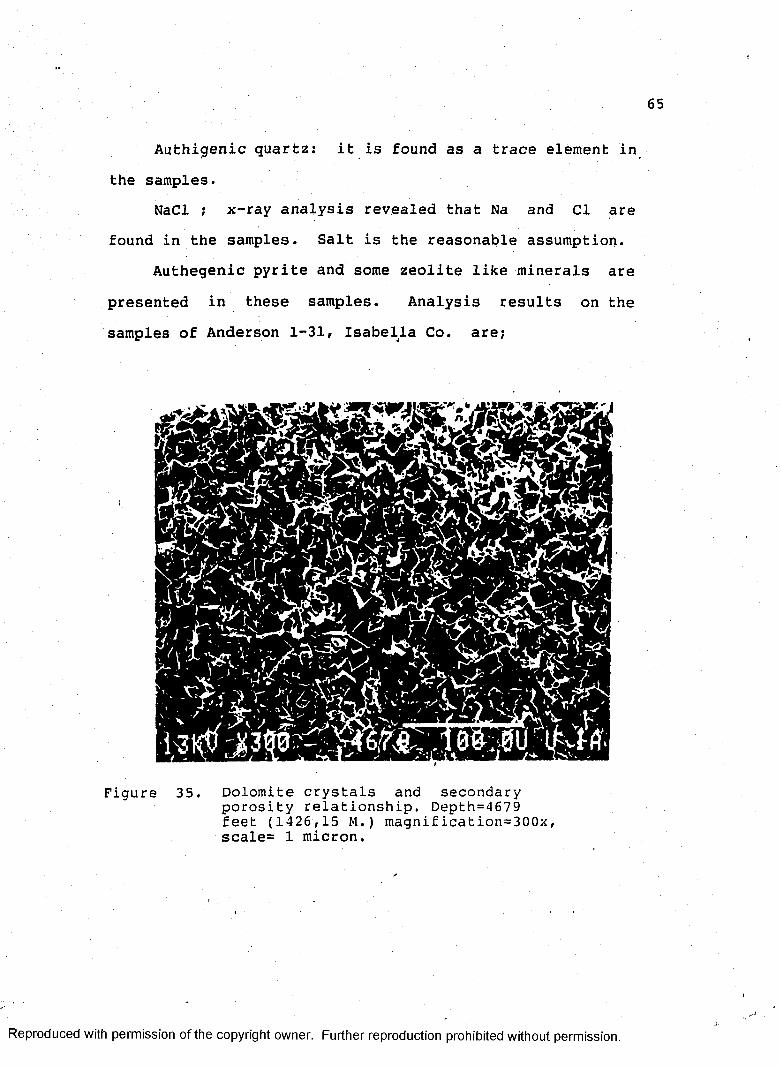
Figure 35. Dolomite crystals and secondary porosity relationship. Depth=4679 feet (1426,15 M . ) magnification=300x, scale= 1 micron.
Reproduced with permission of the copyright owner. Further reproduction prohibited without permission.

Figure 36. Dolomite crystals, secondary porosity, and pyrite framboids.Notice that the sample is mostly dolomitized and has good porosity. Closer look to pyrite framboids. Perhaps indicate pressure of organism and reducing environment. Depth=4679 feet (1426,15 M . ), magnification=1000x, scale= 10
' microns.
Reproduced with permission of the copyright owner. Further reproduction prohibited without permission.

67
Figure 37. Pyrite framboids and dolomitecrystals. Depth=4679 feet (1426.15 M.), magnification =5000x, scale= 1 micron.
Reproduced with permission of the copyright owner. Further reproduction prohibited without permission.

Figure 38. Micro-calcite cement, dolomite crystals, and secondary porosity relationships. Depth=4679 feet (1426.15 M.) magnification = lOOOx, scale=10 microns.
Reproduced with permission of the copyright owner. Further reproduction prohibited without permission.

69
Figure 39. Dolomite dissolution and microcalcite crystals Depth=4679 feet (1426.15 M.), magnification=3000x,scale= 1 micron.
Reproduced with permission of the copyright owner. Further reproduction prohibited without permission.

70
. Figure 40. Dolomite dissolution and microcalcite crystals. Depth=4679 feet ,(1426,15 M),magni£ication=5000x, scale =1 micron.
Reproduced with permission of the copyright owner. Further reproduction prohibited without permission.
71
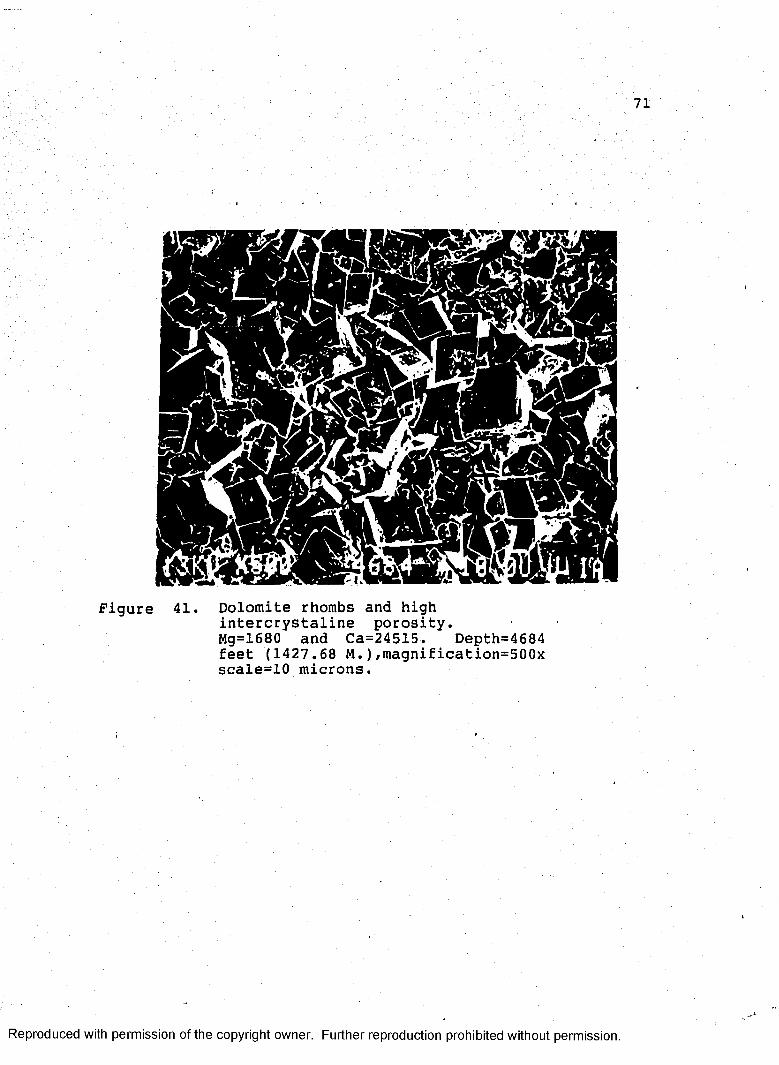
Figure 41. Dolomite rhombs and high intercrystaline porosity.Mg=1680 and Ca=24515. Depth=4684 feet (1427.68 M . ),magnification=500x scale=10 microns.
Reproduced with permission of the copyright owner. Further reproduction prohibited without permission.
72
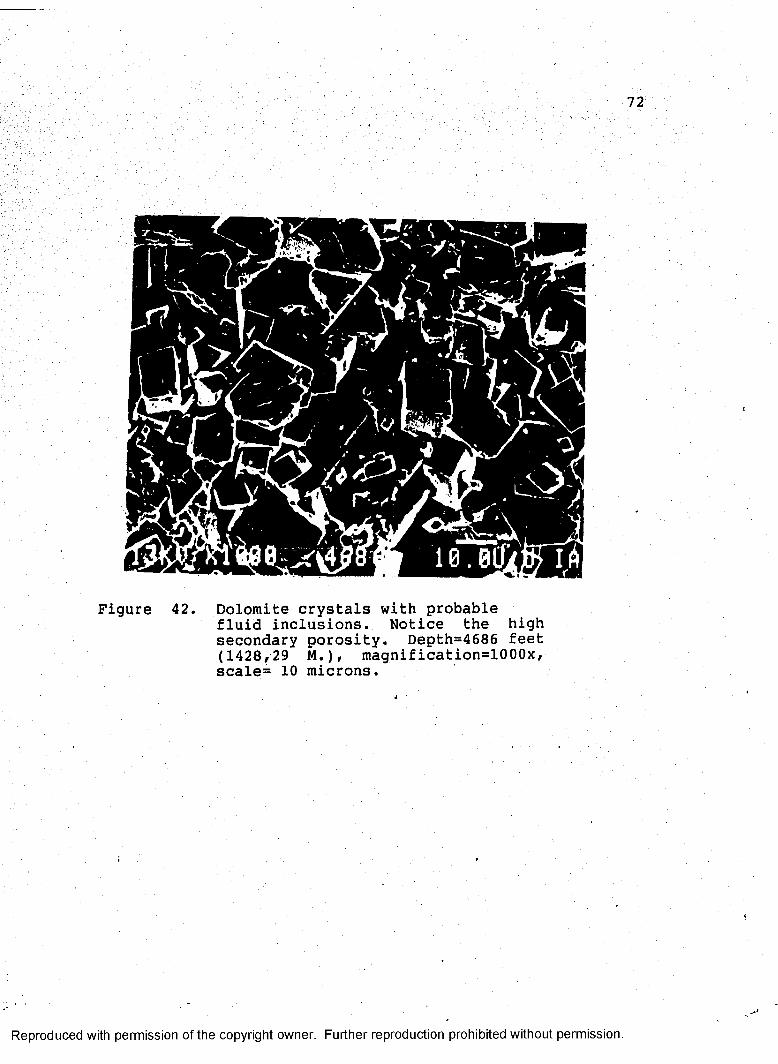
Figure 42. Dolomite crystals with probablefluid inclusions. Notice the high secondary porosity. Depth=4686 feet (1428,29 M.), magnification=1000x,scale= 10 microns.
Reproduced with permission of the copyright owner. Further reproduction prohibited without permission.

73
Figure 43. Dolomite rhombs and fluid inclusions. Depth=4686 feet (1428,29 M . ) magnification = 5000x, scale= 1 micron.
Reproduced with permission of the copyright owner. Further reproduction prohibited without permission.

Figure 44. Dolomite rhombs and secondary porosity relationship.Depth=4699 feet (1432,25 M . ), magnification=100x,scale=100 microns.
Reproduced with permission of the copyright owner. Further reproduction prohibited without permission.
75
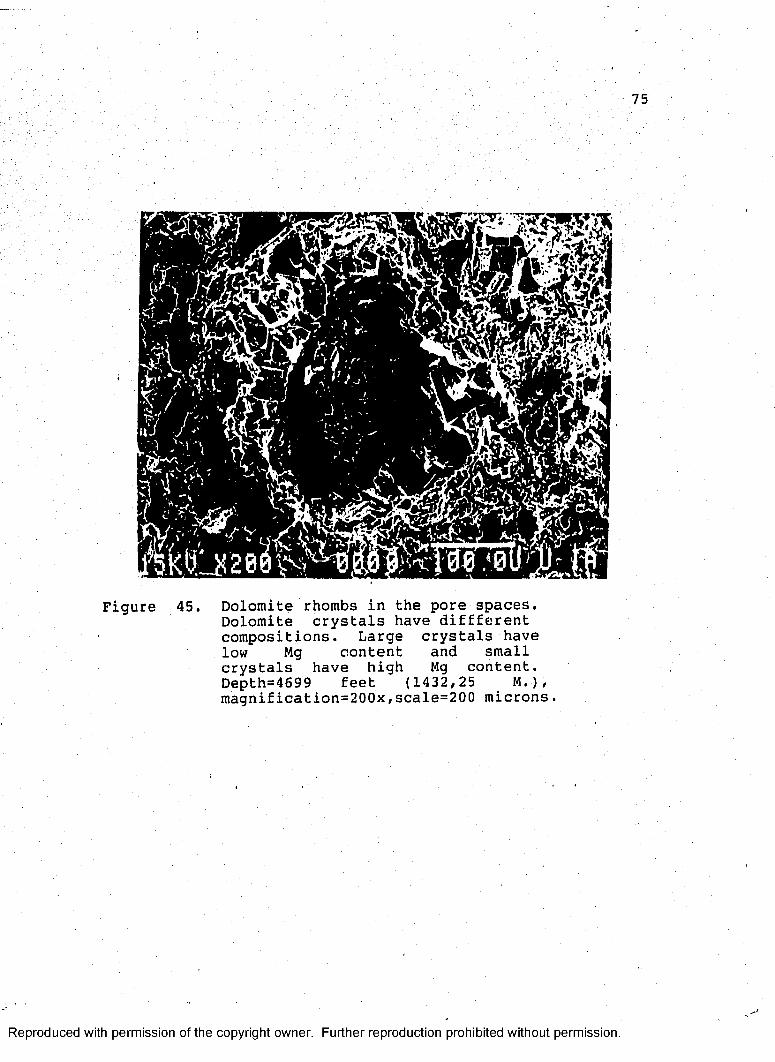
Figure 45. Dolomite rhombs in the pore spaces.Dolomite crystals have diffferent compositions. Large crystals have low Mg content and small crystals have high Mg content. Depth=4699 feet (1432,25 M . ) , magnification=200x,scale=200 microns.
Reproduced with permission of the copyright owner. Further reproduction prohibited without permission.

Figure 46. Dolomite rhombs in the pore spaces. Depth=4699 feet (1432,25 M.j magnification=200x, scale=200 microns.
Reproduced with permission of the copyright owner. Further reproduction prohibited without permission.

Figure 47. Two sizes of dolomite crystals.At the center, large and small crystals are seen. In the small crystal, Mg content is high, in the large crystal Mg content is low.
Reproduced with permission of the copyright owner. Further reproduction prohibited without permission.

Figure
Figure
MgCa (L) Ca (B)
48. Small dolomite crystal dolomite crystal. SEM result are given below.
on large counts and
47-48 Large crystal 1 2 3
1518 280717450 239392633 3482 3989
2917 1281529365 37205
Small crystal 1 2 3
13209 1751535150 38423
4601 4271 4465
Reproduced with permission of the copyright owner. Further reproduction prohibited without permission.

79
1) McQuire 1-22 Big Creek Field T25N R2E'Oscoda Co.,Michigan
McQuire 1-22, located in the Big Creek Field (SE SE SW),
was completed as a dry hole. In this well, the Richfield
Member is characterized by micritic limestone with little
porosity and subaqueous type-anhydrite (Figure 49).
CORE
41684170 ;
4250 :
l ly lo t lte e
Snliy^rAl* cry.
Mud atone eery IhUl .laminated
C loieU packed anhydrite ety»
Thin laminated mudelenc.
4367
DEPOSITIONAL EIMV.
DENSITY (Pb)
HIOH LOW
Figure 49. Core description of McGuire 1-22, Oscoda County.
Reproduced with permission of the copyright owner. Further reproduction prohibited without permission.

80
Fi,gure 50. Micritic limestone and salt crystals. In the micritic limestone these elements have been counted;Na = 9646 Cl =90012 Mg = 505Si = 701Ca = 7440As it seen besides the NaCl the samples contains a few dolomite crystals and Si which was also found in the Anderson 1-31 as a trace element. Depth=4169 feet (1270,71.m),magnification=1000x scale-10 microns."
Reproduced with permission of the copyright owner. Further reproduction prohibited without permission.
81
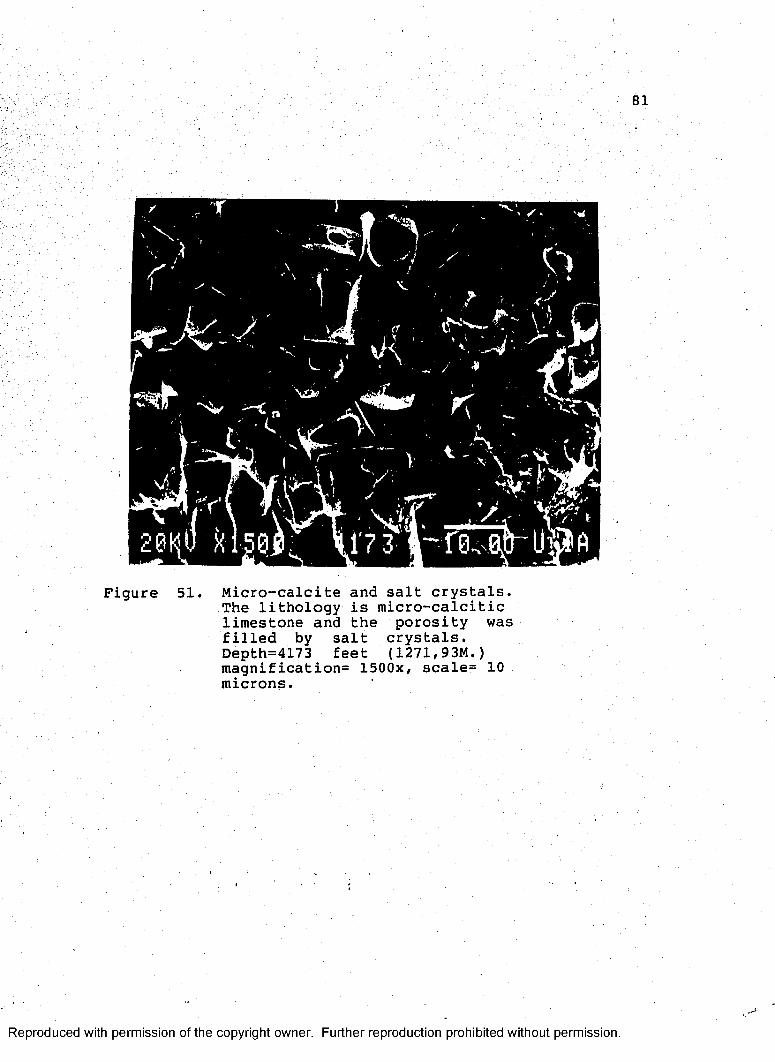
Figure 51. Micro-calcite and salt crystals.The lithology is micro-calcitic limestone and the porosity was filled by salt crystals. Depth=4173 feet (1271,93M.) magnification= 1500x, scale= 10 microns.
Reproduced with permission of the copyright owner. Further reproduction prohibited without permission.

82
Figure 52. Anhydrite crystals in micritic limestone . These elements have been counted.Ca = 51318 S = 47696 Si = 578Depth=4178 feet(1273,45M.),magnificati9 n= 6 0 x, scale=100 microns.
Reproduced with permission of the copyright owner. Further reproduction prohibited without permission.

Figure 53. Salt crystals and partly dolomitic limestone.SEM counting results are given ; Ca = 30603 Mg = 6449Depth=4180 feet(1274 M.), magnification=2000x, scale=10 microns.
Reproduced with permission of the copyright owner. Further reproduction prohibited without permission.
84
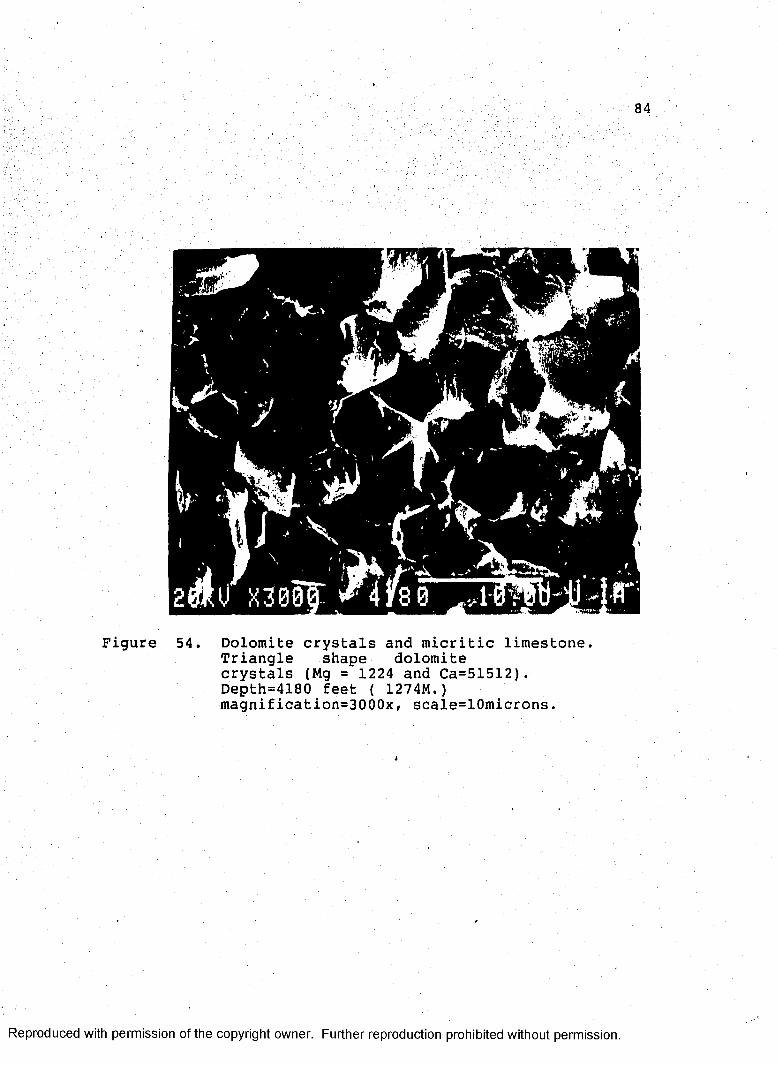
Figure 54. Dolomite crystals and micritic limestone. Triangle shape dolomite crystals (Mg = 1224 and Ca=51512). Depth=4180 feet ( 1274M.) magnification=3000x, scale=10microns.
Reproduced with permission of the copyright owner. Further reproduction prohibited without permission.
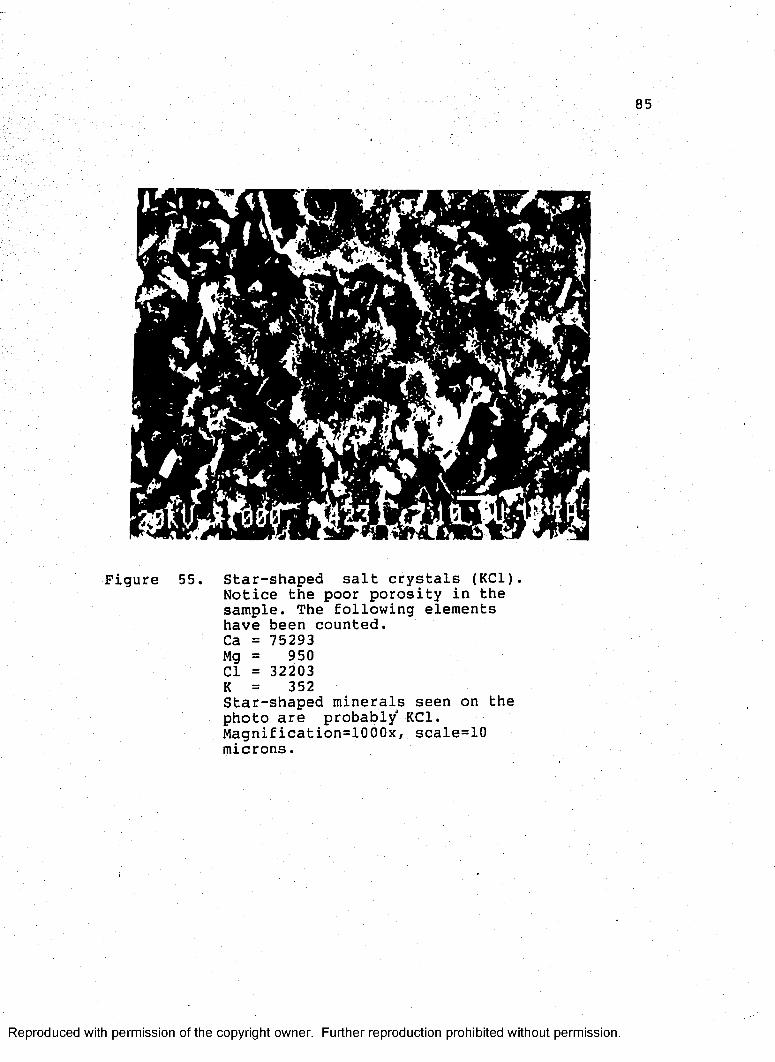
Figure 55. Star-shaped salt crystals (KC1).Notice the poor porosity in the sample. The following elements have been counted.Ca = 75293 Mg = 950Cl = 32203 K = 352Star-shaped minerals seen on the photo are probably KC1.Magnification=1000x, scale=10 microns.
Reproduced with permission of the copyright owner. Further reproduction prohibited without permission.
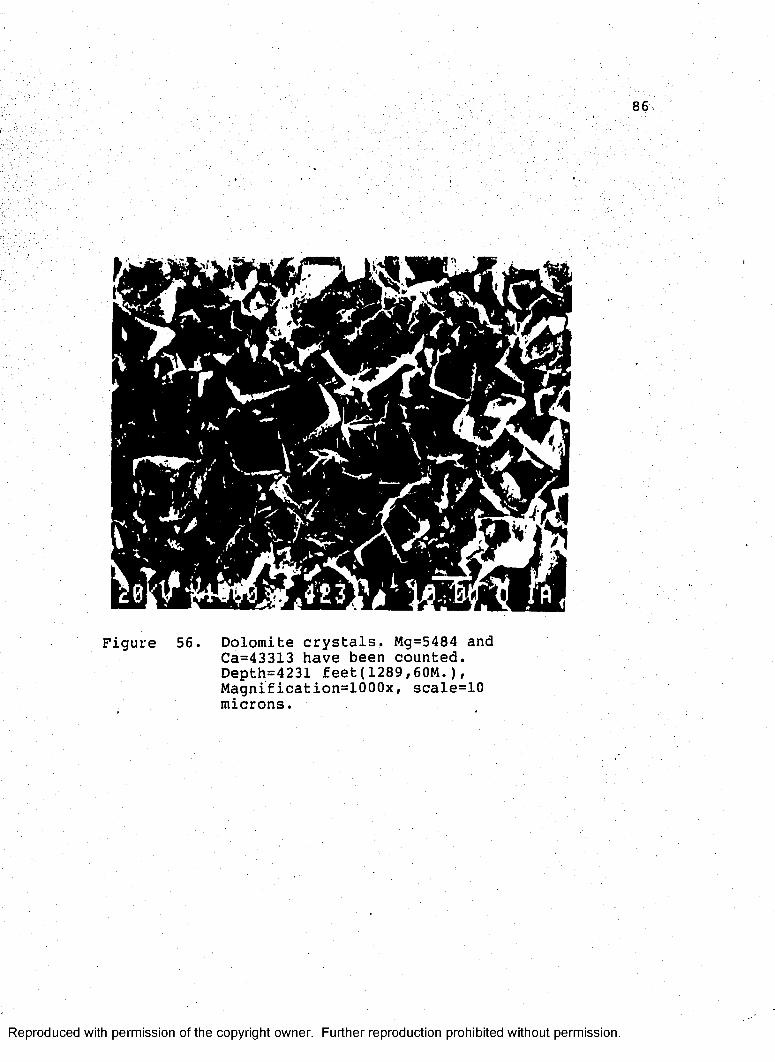
86
Figure 56. Dolomite crystals. Mg=5484 and Ca=43313 have been counted. Depth=4231 feet(1289,60M.), Magnification=1000x, scale=10 microns.
Reproduced with permission of the copyright owner. Further reproduction prohibited without permission.

87i
Figure 57. Micribic limestone.No Mg has been found . Notice the intercrystaline porosity in the sample. Depth=4201 feet(1280,46M.), magnification=100x,scale=100 microns.
Reproduced with permission of the copyright owner. Further reproduction prohibited without permission.
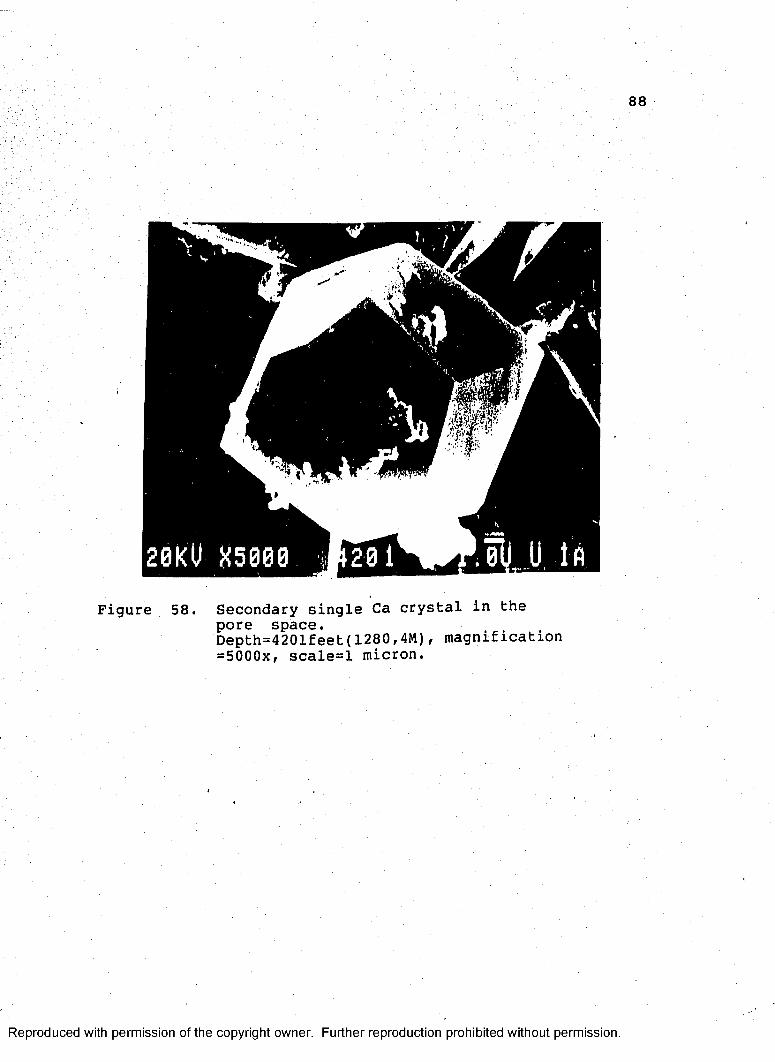
88
2 0 KU 8 5 0 0 0
Figure 58. Secondary single Ca crystal in the pore space.Depth=4201feet(1280,4M), magnification =5000x, scale=l micron.
Reproduced with permission of the copyright owner. Further reproduction prohibited without permission.

89
According to SEM results, the Richfield Member has a complex diagenetic history. In the central part of the basin, which is the major oil producing area, dolomitization resulted in high intercrystalline porosity. The oil wells occur in the central, deep part of basin as seen on the structure map, are mostly productive. Some are non productive in spite of their high porosity. The reason is that they are either off structure or that anhydrite beds, laterally extended in a different interval, did not let hydrocarbons migrate upward. It seems that different producing zones in the central part of the basin were caused by lateral extention of anhydrite beds.As is clearly seen, porosity, structure, and anhydrite beds are the most important factors controlling the production in the central part of basin. On the eastern flank of the basin, the Richfield has a different character than in the central part of the basin as is seen in the McQuire 1-22.In comparing production, the eastern flank has a lower potential of hydrocarbon accumulation. Micritic limestone was deposited in this part of basin, which was mostly a
subtidal environment during the Richfield depositional period. According to SEM results, poor dolomitization was the reason for low porosity development on the east flank of the basin. The conditions of a low energy environment of deposition, poor dolomitization, and low porosity make the area less important in hydrocarbon production.
Reproduced with permission of the copyright owner. Further reproduction prohibited without permission.

CONCLUSION
The Richfield Member of Lucas Formation was deposited in a coastal, shallow marine setting which included sabkha and lagonal facies. It overlies the "Black Limestone"which represents an open marine shelf facies. Early Richfielddeposition contains some fossils such as brachiopods,ostracods, and marine plankton. This organic-rich lower part of Richfield could, along with the "Black Limestone", have been the source of the hydrocarbons in the Richfield. After the basal part of the Richfield was deposited, the area became a restricted environment and the salinity of water increased. In this depositional period several cycles of emergence and submergence affected the basin. As a result of this cyclicity, basin-wide depositional conditions on the west flank and central part of basin produced interbedded sabkha type sediments of mixed carbonate and anhydrite. On the east flank of the basin, subtidal types of limestone beds were deposited. Sabkha-type deposits are characterized by nodular andsubaqueous-type anhydrite, algal-laminated and micritic
limestone, and dolomite beds.Sabkha and seepage reflux-type of dolomitization
occurred by replacement of carbonate in the sabkhaenvironment and two types of dolomite crystals were
90
Reproduced with permission of the copyright owner. Further reproduction prohibited without permission.

formed during two separate stages. High concentration of sulfate ions inhibited the dolomitization in the eastern flank of the basin. In the upper part of the Richfield, a thick accumulation of "Big Anhydrite" indicates that a hypersaline lagoon depositional environment covered the basin. This anhydrite bed sealed the previous Richfield deposits as a cap rock. Above the "Big Anhydrite" the Richfield is characterized by a carbonate bed. It was deposited in less saline water that again flooded the basin.
Hydrocarbon production mostly comes from the porous
dolomitic carbonate zones. Trapping by various anhydrite beds on structurally high positions yield the production from the different dolomitic zones. More detail mapping of local facies distribution and geologic or geophysical mapping of structures should help to increase oil and gas production in the near future in the Michigan basin.
Reproduced with permission of the copyright owner. Further reproduction prohibited without permission.
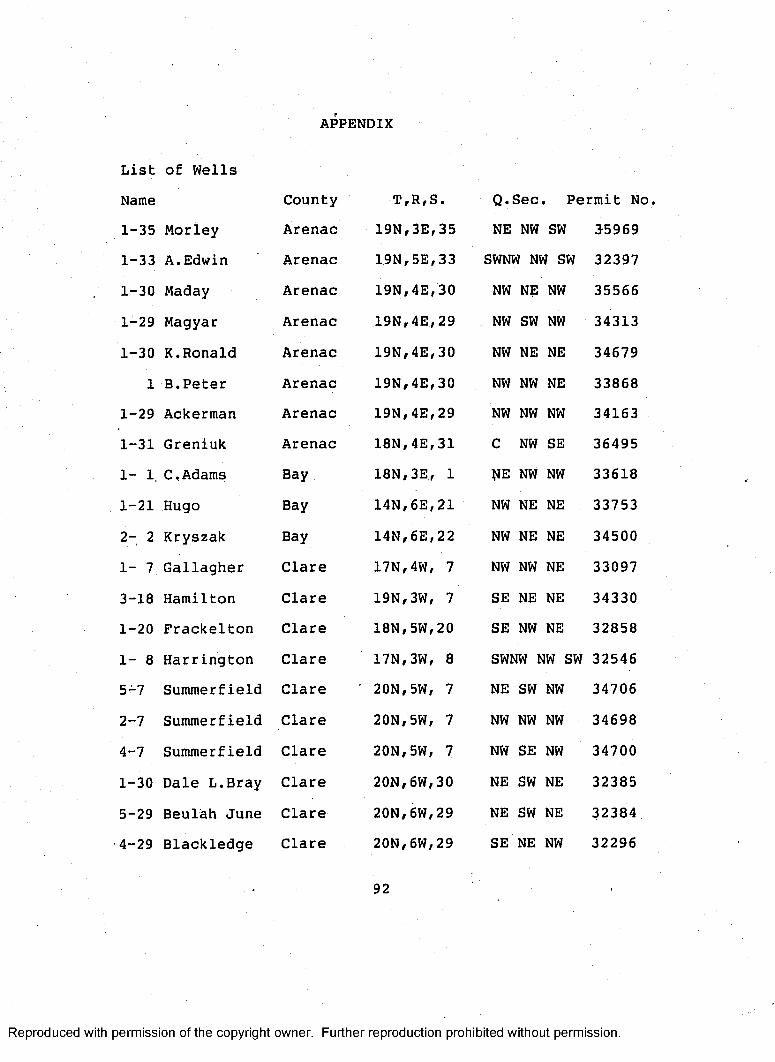
APPEN D IX
List of WellsName County T rR,S. Q.Sec Permit No1-35 Morley Arenac 19N,3Ef 35 NE NW SW 35969
1-33 A.Edwin Arenac 19Nr5E,33 SWNW NW SW 32397
1-30 Maday Arenac 19N,4E,30 NW NE NW 35566
1-29 Magyar Arenac 19N,4E,29 NW SW NW 34313
1-30 K.Ronald Arenac 19N,4E,30 NW NE NE 34679
1 B.Peter Arenac 19N,4E,30 NW NW NE 33868
1-29 Ackerman Arenac 19N,4E,29 NW NW NW 34163
1-31 Greniuk Arenac 18N,4E,31 C NW SE 36495
1- 1. C ,Adams Bay 18N,3E, 1 (IE NW NW 33618
1-21 Hugo Bay 14N,6E,21 NW NE NE 33753
2- 2 Kryszak Bay 14N,6E,22 NW NE NE 34500
1 - 7 Gallagher Clare 17N,4W, 7 NW NW NE 33097
3-18 Hamilton Clare 19N,3W, 7 SE NE NE 34330
1-20 Prackelton Clare 18N,5W,20 SE NW NE 32858
1- 8 Harrington Clare 17N,3W, 8 SWNW NW SW 32546
5-7 Summerfield Clare ’ 20N,5W, 7 NE SW NW 34706
2-7 Summerfield Clare 20N,5W, 7 NW NW NW 34698
4-7 Summerfield Clare 20N,5W/ 7 NW SE NW 34700
1-30 Dale L.Bray Clare 20N,6W,30 NE SW NE 32385
5-29 Beulah June Clare 20N,6W,29 NE SW NE 32384
4-29 Blackledge Clare 20N,6W,29 SE NE NW 32296
Reproduced with permission of the copyright owner. Further reproduction prohibited without permission.
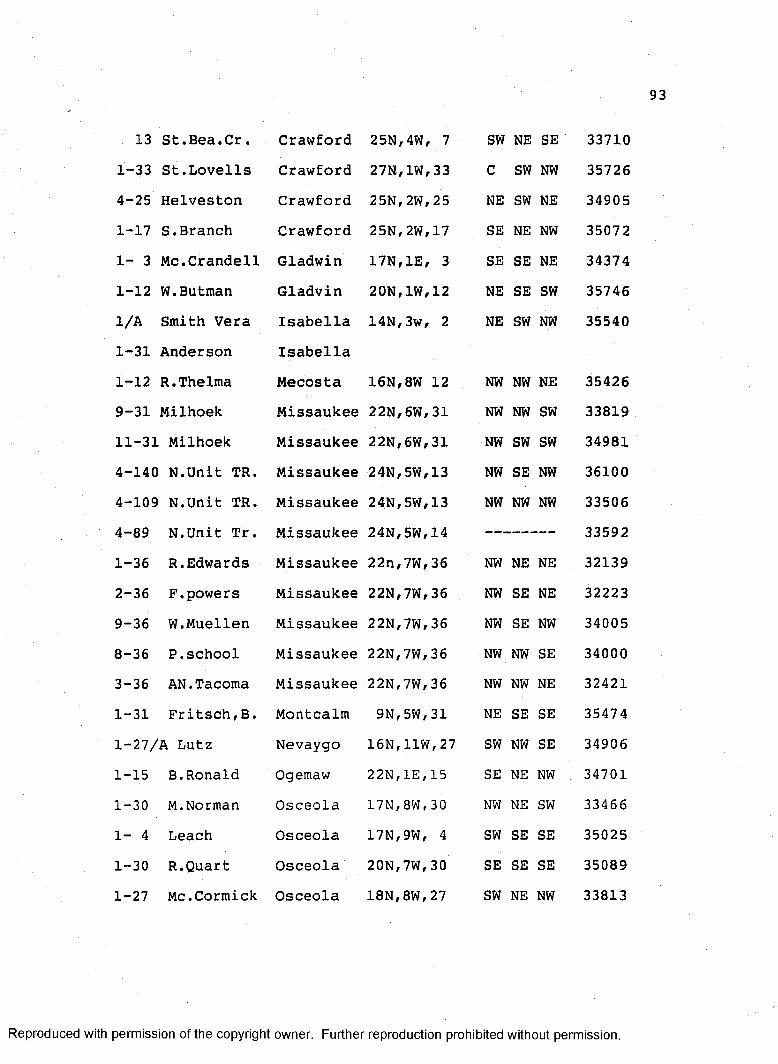
93
13 St.Bea.Cr. Crawford 25N,4W, 7 SW NE SE 337101-33 St.Lovells Crawford 27N, 1W, 33 C SW NW 357264-25 Helveston Crawford 25N,2W,25 NE SW NE 349051-17 S.Branch Crawford 25N,2W,17 SE NE NW 350721- 3 Mc.Crandell Gladwin 17N,1E, 3 SE SE NE 343741-12 W. Butman Gladvin 20N,1W,12 NE SE SW 357461/A Smith Vera Isabella 14N,3w, 2 NE SW NW 355401-31 Anderson Isabella1-12 R.Thelma Mecosta 16N,8W 12 NW NW NE 354269-31 Milhoek Missaukee 22N/6W/31 NW NW SW 3381911-31 Milhoek Missaukee 22N,6W,31 NW SW SW 349814-140 N.Unit TR. Missaukee 24N,5W,13 NW SE NW 361004-109 N.Unit TR. Missaukee 24N,5W,13 NW NW NW 335064-89 N.Unit Tr. Missaukee 24N,5W,14 33592
1-36 R.Edwards Missaukee 22n,7W,36 NW NE NE 321392-36 F.powers Missaukee 22N,7Wf 36 NW SE NE 32223
9-36 W.Muellen Missaukee 22N,7Wf36 NW SE NW 34005
8-36 P.school Missaukee 22N,7Wf 36 NW NW SE 340003-36 A N .Tacoma Missaukee 22N,7Wf 36 NW NW NE 32421
1-31 Fritsch,B. Montcalm 9N,5W,31 NE SE SE 35474
1-27/A Lutz Nevaygo 16N,11W,27 SW NW SE 34906
1-15 B.Ronald Ogemaw 22N,IE,15 SE NE NW 34701
1-30 M.Norman Osceola 17N,8Wr 30 NW NE SW 33466
1- 4 Leach Osceola 17N,9W, 4 SW SE SE 35025
1-30 R.Quart Osceola 20N,7W,30 SE SE SE 35089
1-27 Mc.Cormick Osceola 18N,8W,27 SW NE NW 33813
Reproduced with permission of the copyright owner. Further reproduction prohibited without permission.

94
1-19 Gerber Osceola 17N,10W,19 SW SE SW 35997
1-15 Schalm Osceola 17N,10W,15 SE SE SE 33505
1-23 USA Big.Cr. Oscoda 25N,2E,23 SW NE SW 34748
1-22 USA Big Cr. Oscoda 25n,2E,22 SW SW SE 35131
7-23 USA Big Cr. Oscoda 25N,2E,23 SE NE SE 35765
2-23 USA Big Cr. Oscoda 25N,2E,23 NE SW SE 34749
1-22 Me.Quire Oscoda 25N,2E,22 SE SE SW 35069
48-15 Helen Unit Roscommon 24N,1W,30 SW NE NE 35443
50-15 Helen Unit Roscommon 24N,1W,28 SW NW NW 35385
1-28 St.Backus Roscommon 22N,2W,28 NW NE SE 36310
2-27 St.Backus Roscommon 22N,2W,27 NE SW NW 36269
6 Enterp.Unit Roscommon 23N,4W,18 SE SW NW 35767
16-6 Norwich U. Roscommon 24N,4W, 7 S2 SW NE 33683
F-l St.Lyons Roscommon 24N,4W, 6 S2 S2 NW 30978
17-6 Norwich U. Roscommon 24N,4W,18 S2 NW NE 34061
1-20 St.Lyons Roscommon 24N,4W,20 SE SE SE 36166
13-6 Norwich U. Roscommon 24N,4W, 7 33339
15-6 Norwich U. Roscommon 24N,4W,18 SW SW NW 33681
1-17 Ida Hogan Roscommon 22N,4W,17 NE NE NW 32356
1- 8 Ida Hogan Roscommon 22N,4W, 8 NE SE SW 32355
Reproduced with permission of the copyright owner. Further reproduction prohibited without permission.

BIBLIOGRAPHY
Adams,J.E. and M.L.Rhodes. (1960). Dolomitization by Seepage Refluxion. American Association of Petroleum Geologists Bulletin, 44, 1912-1920.Bluck,B.J. (1965). Sedimentation of Middle Devonian Carbonates,Southeastern Indiana. Journal of Sedimentary Petrology, 35, 656-682.
Briggs,L.I. and W.A.Haney. (1964). Cyclicity of Textures in Evaporite Rocks of the Lucas Formation. Kansas Geological Survey Bulletin, 169, 191-197.Butler,G.P. (1968). Modern Evaporite Deposition and Geochemistry of Coexisting Brines,The Sabkha,Trucial coast,Arabian Gulf. Journal of Sedimentary Petrology, 39, 70-89.
Dott,R.H. and R.L.Batten. (1981). Evolution of the Earth. New York: McGraw Hill, 515.Ehmann,D.A. (1964). Detroit River Group in Michigan Basin. Master Thesis , University of Michigan.Fagerstrom,J.A. (1983). Petrology and Regional Significance of a Devonian Carbonate/Evaporite Complex, Eastern Michigan Basin. Journal of Sedimentary Petrology, 53, 295-317.
Fisher,J.H. (1979). Hydrocarbon Potential of the Michigan Basin. Michigan Basin Geological Society, 6.
Gardner,W.C. (1974). Middle Devonian Stratigraphy AndDepositional Environments in the Michigan Basin. Michigan Basin Geological Society, 1, 138.Hager,D. (1949). Tectonics of North Central States.American Association of Petroleum Geologists Bulletin, 33, 1198-1205.
Hautaii,G. (1954). Richfield is a Major Oil Zone forMichigan. World Oil, 139, 100-104.
Kastner,M. (1983). Origin of Dolomite and Its Spatialand Chronological Distribution - A New Insight [abst].
95
Reproduced with permission of the copyright owner. Further reproduction prohibited without permission.
96
American Association of Petroleum Geologists Bulletin, 67, 2156.Kendall,C. and E.Skipwith (1968). Recent Algal Mats of a Persian Gulf Lagoon. Journal of Sedimentary Petrology, 38, 1040-1058.Krauskopf,K.B. (1979). Introduction to Geochemistry, Second Edition. New York: McGraw Hill , 617.Landes,K.E. (1951). Detroit River Group in the Michigan Basin. U.S. Geological Survey, 133, 23.Loucks,R.G. and M.W.Longman. (1982). Lower Cretaceous Ferry Lake Anhydrite, Fairwey Field, East Texas. S.E.P.M. Core Workshop, 3, 165.Matthews,R.D. (1977). Evaporite Cycles and Lithologies in Lucas Formation, Detroit River Group,Midland,Michigan. American Association of Petroleum Geologists Bulletin, Studies m Geology, N.5, 73-93.Melvin,J. (1984). Depositional Systems of the Richfield Member in Gladwin and Clare counties, Michigan.Unpublished Manuscripts.Patterson,R.J. and D.J.J.Kinsman. (1982). Formation of Diagenetic Dolomite in Coastal Sabkha Along Arabian (Persian) Gulf. American Association of Petroleum Geologists Bulletin, 66, 28-43.Riley,C.M. and J.V.Byrne. (1961). Genesis of Primary Structures in Anhydrite. Journal of Sedimentary Petrology, 31, 553-559.Schreiber,B.C. (1981). Sedimentary Environments AndFacies. Department of Earth And EnvironmentalSciences,Queens College,Flushing,New York, 100Shearman,D.J. (1978). Evaporites of Coastal Sabkhas: Marine Evaporites. Society of Economic Paleontologists and Mineralogists, SEPM Short Course, 4, 6-20.Wilson,J.L. (1975). Carbonate Facies in Geologic History. Berlin: Springer Verlag Publishers, 471.
Reproduced with permission of the copyright owner. Further reproduction prohibited without permission.