successful evaluation strategies: california sharon sugerman, ms, rd, fada cancer prevention and...
TRANSCRIPT
Successful Evaluation Strategies: California
Sharon Sugerman, MS, RD, FADA•Cancer Prevention and Nutrition Section; California Department of Public HealthFebruary 21, 2008
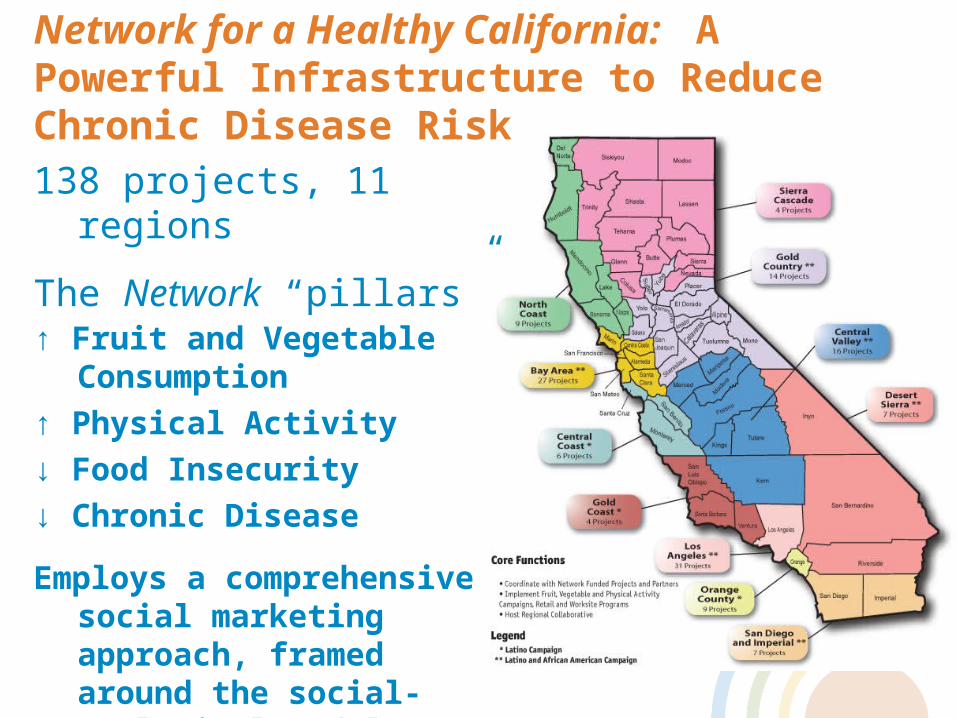
138 projects, 11 regions
The Network “pillars”↑ Fruit and Vegetable
Consumption
↑ Physical Activity
↓ Food Insecurity
↓ Chronic Disease
Employs a comprehensive social marketing approach, framed around the social-ecological model
Network for a Healthy California: A Powerful Infrastructure to Reduce Chronic Disease Risk
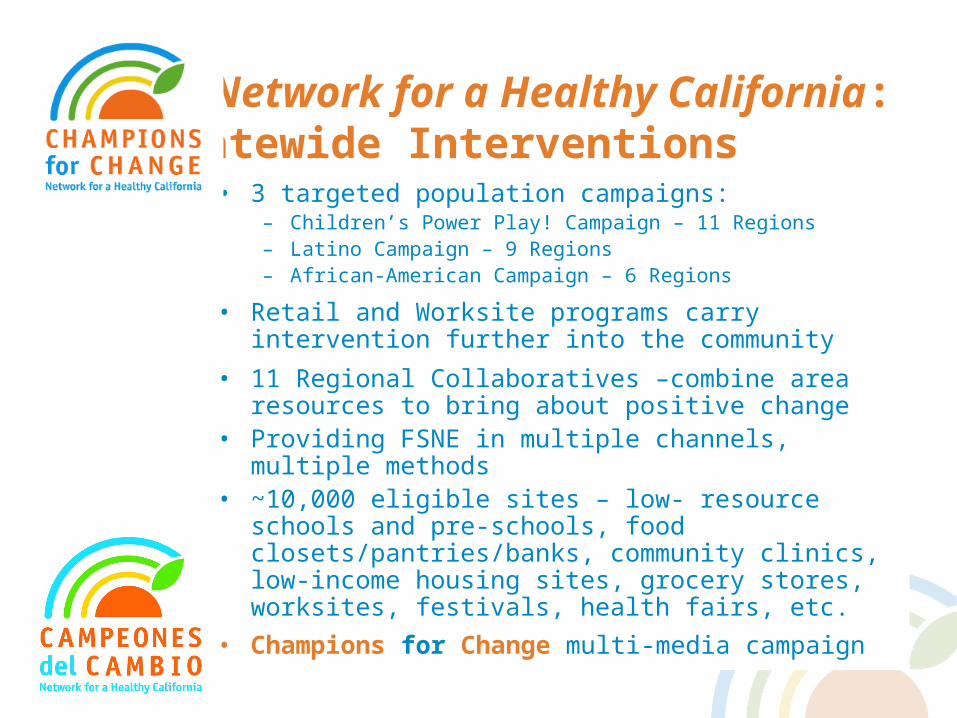
Network for a Healthy California: Statewide Interventions
• 3 targeted population campaigns:– Children’s Power Play! Campaign – 11 Regions– Latino Campaign – 9 Regions– African-American Campaign – 6 Regions
• Retail and Worksite programs carry intervention further into the community
• 11 Regional Collaboratives –combine area resources to bring about positive change
• Providing FSNE in multiple channels, multiple methods• ~10,000 eligible sites – low- resource schools and pre-
schools, food closets/pantries/banks, community clinics, low-income housing sites, grocery stores, worksites, festivals, health fairs, etc.
• Champions for Change multi-media campaign
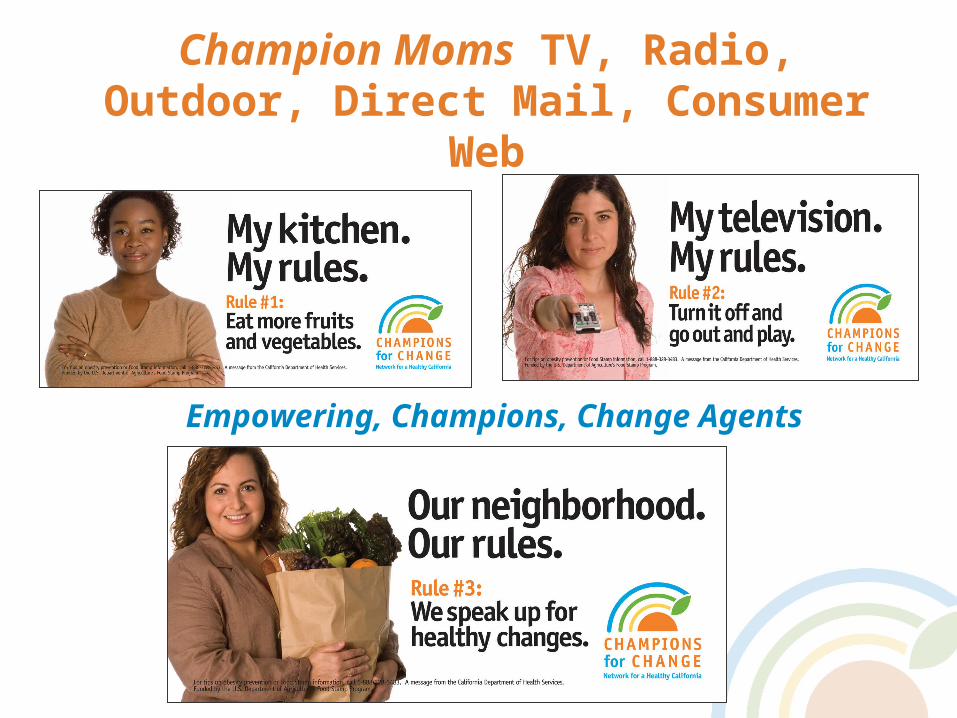
Champion Moms TV, Radio, Outdoor, Direct Mail, Consumer Web
Empowering, Champions, Change Agents

Fruits & Vegetable School-Based Education – Cafeteria and Classroom
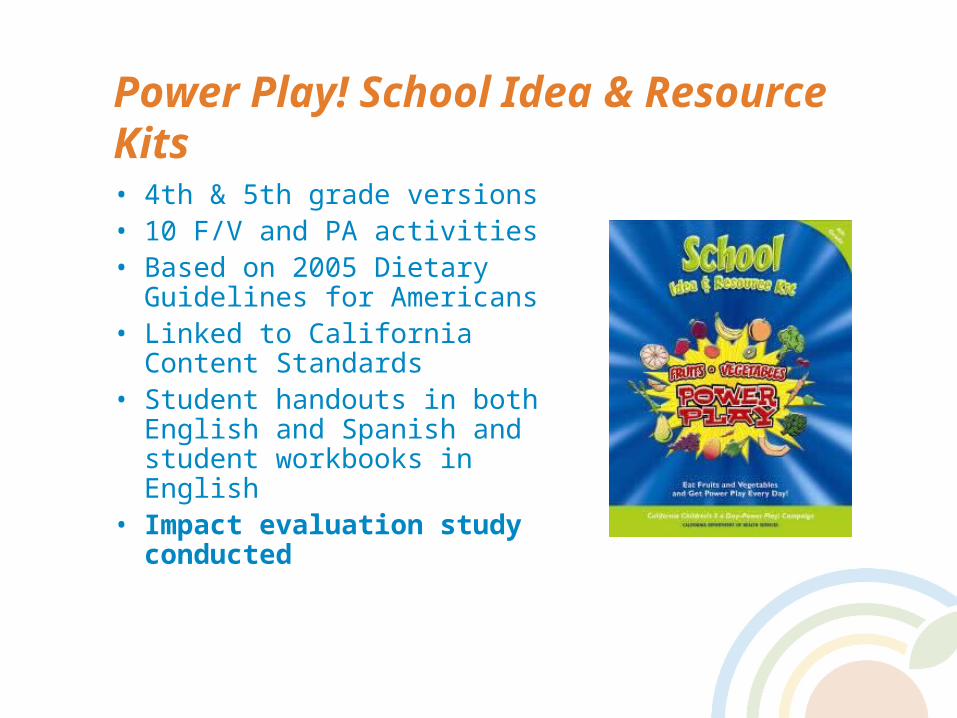
Power Play! School Idea & Resource Kits• 4th & 5th grade versions • 10 F/V and PA activities • Based on 2005 Dietary
Guidelines for Americans• Linked to California Content
Standards• Student handouts in both
English and Spanish and student workbooks in English
• Impact evaluation study conducted
Core Elements• Educator newsletters• Menu slicks• Family newsletters• Press release templates• Poster (must be ordered)• Strategies• Resources• Major process evaluation and individual
school impact evaluation projects conducted
Network Approaches to Evaluation• Surveillance – statewide population-based surveys, internal & external
• Process evaluation/activity tracking – Semi-Annual Activity Reporting (SAAR), Regional Network SAAR
• Formative – New project development & feedback
• Impact/outcome evaluation to evaluate and improve the operation of a given local project intervention
• Impact/outcome evaluation to rigorously test a social marketing campaign controlled intervention developed by the State
• Media/Communications strategy evaluation – Benchmark
• Case Studies – Non-profit LIAs, Regional Nutrition Networks
• Special Tools to enable evaluation – GIS and CX3 (Communities of Excellence); Compendium of validated tools; Food Behavior Checklist; Fruit and Vegetable Checklist
• Support of external research projects
• Technical assistance to awardees and collaboratives who request help in evaluating their projects
Evaluation of CPNS Projects:Key Behavioral Outcomes
• Fruit and vegetable consumption and determinants in adults and children/youth, ages 9 and older, to recommended levels
• Daily physical activity and determinants to at least 30 minutes in adults and 60 minutes in children and youth
• Access to and utilization of appropriate food assistance programs, especially Food Stamps
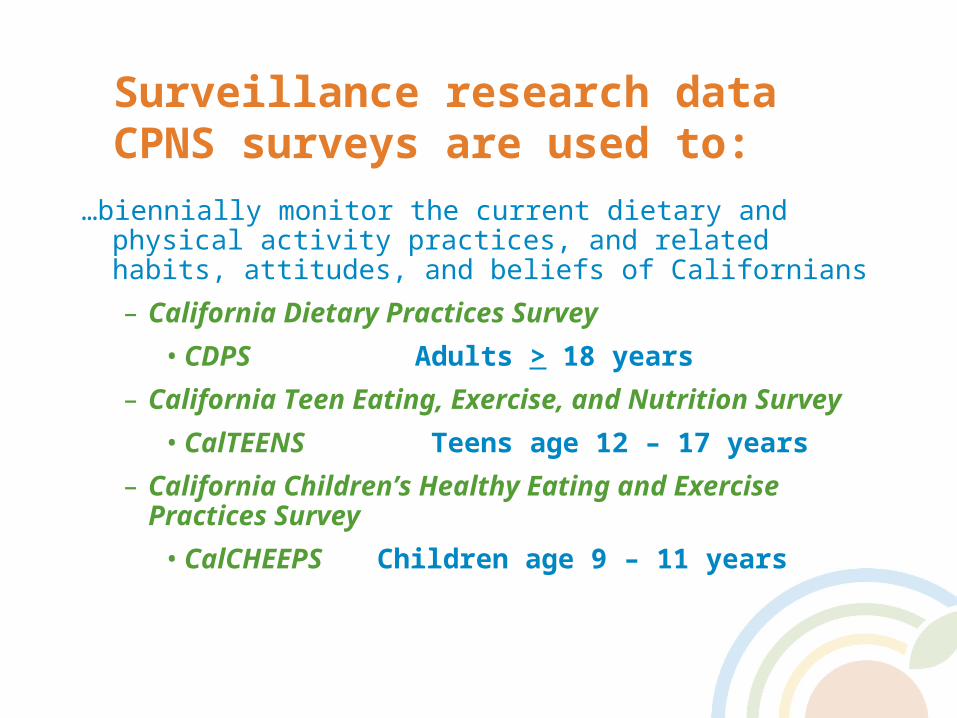
Surveillance research data CPNS surveys are used to:
…biennially monitor the current dietary and physical activity practices, and related habits, attitudes, and beliefs of Californians
– California Dietary Practices Survey
• CDPS Adults > 18 years
– California Teen Eating, Exercise, and Nutrition Survey
• CalTEENS Teens age 12 – 17 years
– California Children’s Healthy Eating and Exercise Practices Survey
• CalCHEEPS Children age 9 – 11 years
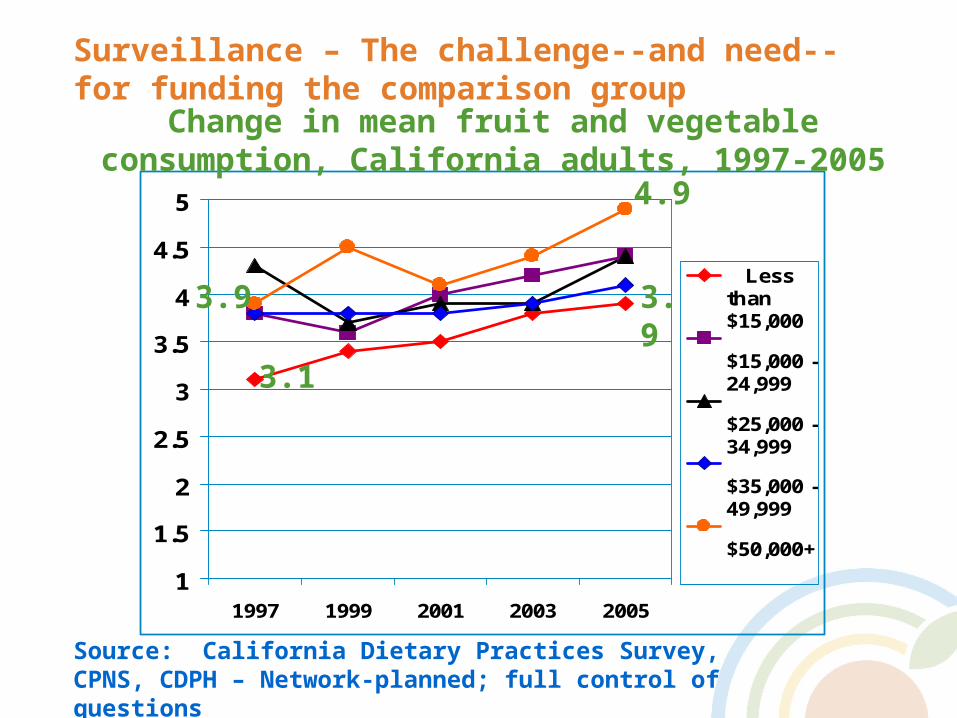
Surveillance – The challenge--and need--for funding the comparison group
1
1.5
2
2.5
3
3.5
4
4.5
5
1997 1999 2001 2003 2005
Lessthan$15,000 $15,000 -24,999 $25,000 -34,999 $35,000 -49,999 $50,000+
Source: California Dietary Practices Survey, CPNS, CDPH – Network-planned; full control of questions
3.1
3.93.9
4.9
Change in mean fruit and vegetable consumption, California adults, 1997-2005
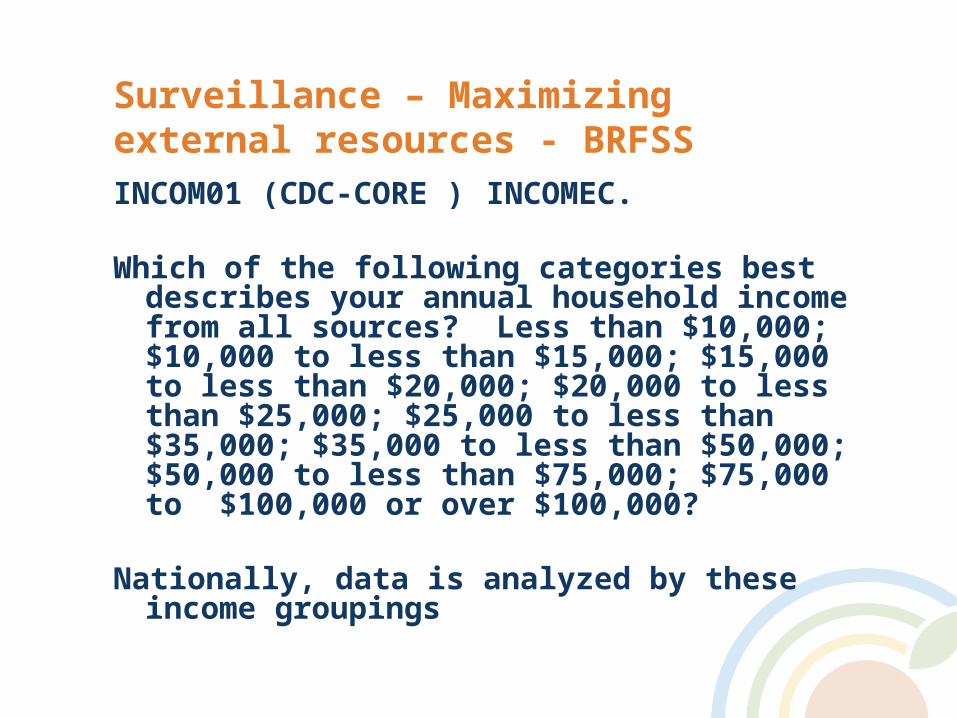
Surveillance – Maximizing external resources - BRFSS
INCOM01 (CDC-CORE ) INCOMEC.
Which of the following categories best describes your annual household income from all sources? Less than $10,000; $10,000 to less than $15,000; $15,000 to less than $20,000; $20,000 to less than $25,000; $25,000 to less than $35,000; $35,000 to less than $50,000; $50,000 to less than $75,000; $75,000 to $100,000 or over $100,000?
Nationally, data is analyzed by these income groupings
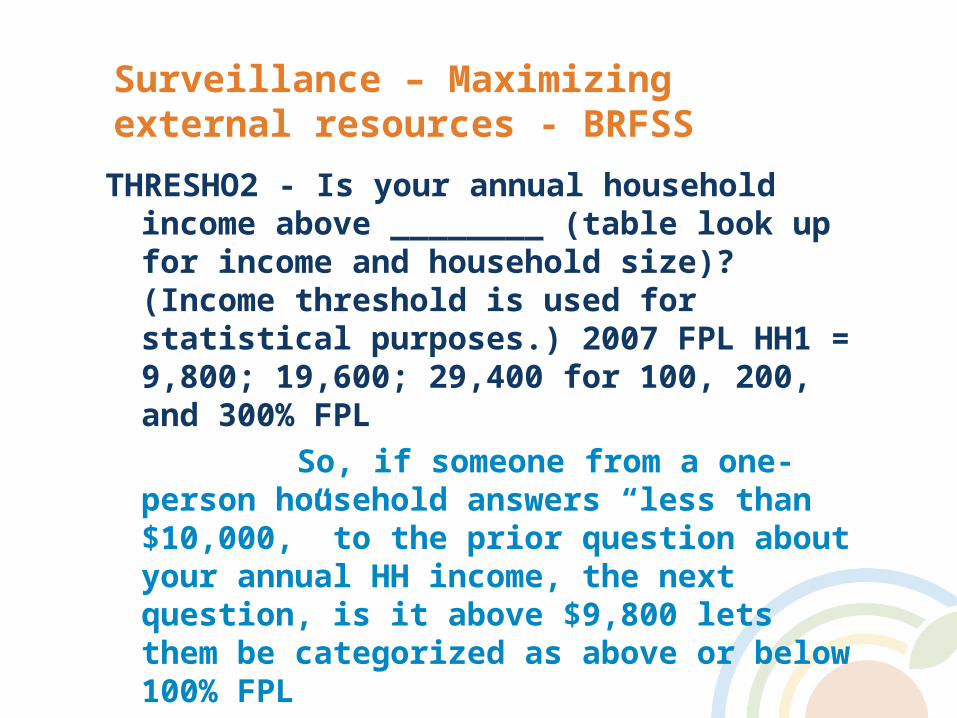
Surveillance – Maximizing external resources - BRFSS
THRESHO2 - Is your annual household income above ________ (table look up for income and household size)? (Income threshold is used for statistical purposes.) 2007 FPL HH1 = 9,800; 19,600; 29,400 for 100, 200, and 300% FPL
So, if someone from a one-person household answers “less than $10,000,” to the prior question about your annual HH income, the next question, is it above $9,800 lets them be categorized as above or below 100% FPL
We worked with our state BRFSS administrators to build the threshold cut-points for 130% and 185% FPL into this question and added “use of FSP past 12 months” question to BRFSS
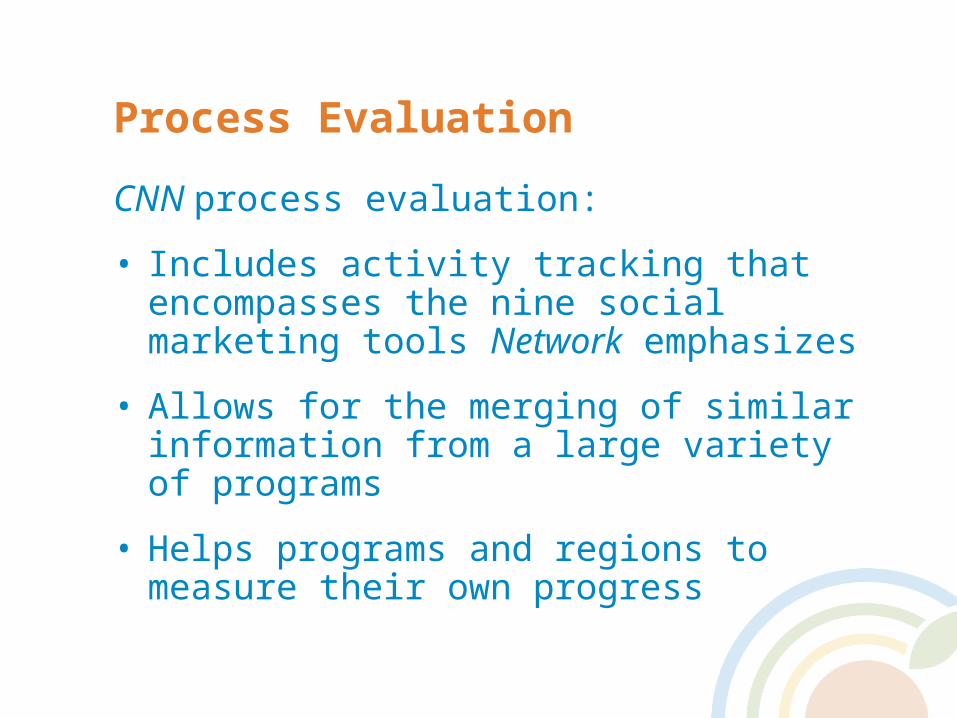
Process Evaluation
CNN process evaluation:
• Includes activity tracking that encompasses the nine social marketing tools Network emphasizes
• Allows for the merging of similar information from a large variety of programs
• Helps programs and regions to measure their own progress

Semi-Annual Activity Report(SAAR and RN SAAR)
• Program information
• Summary of program activities
• Materials distributed
• Partnership development
• Formative research and planning
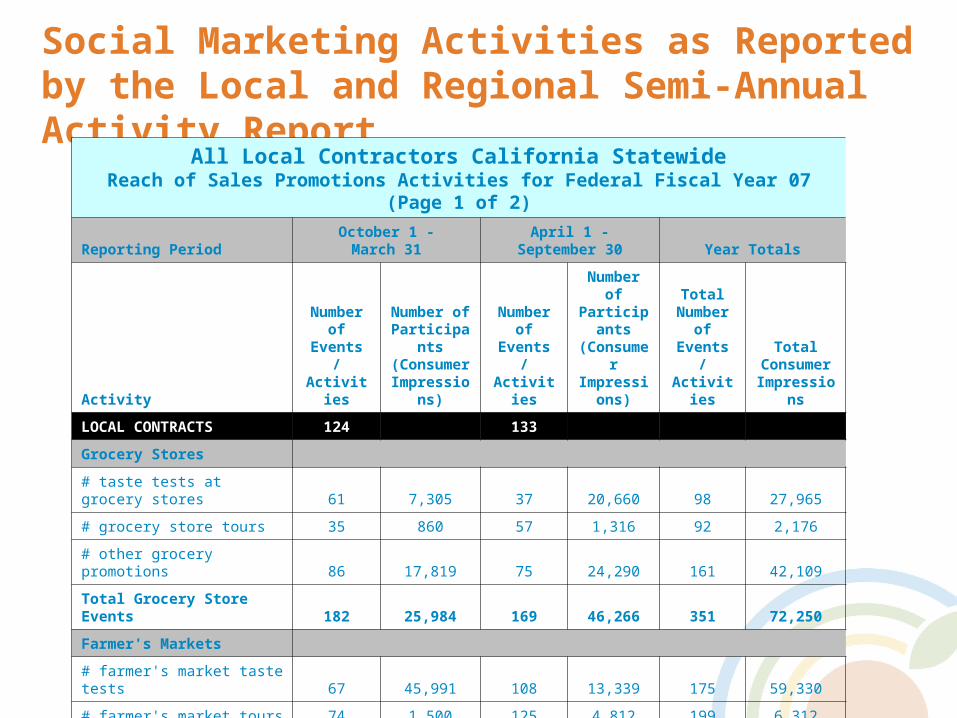
Social Marketing Activities as Reported by the Local and Regional Semi-Annual Activity Report
All Local Contractors California StatewideReach of Sales Promotions Activities for Federal Fiscal Year 07 (Page 1
of 2)
Reporting Period October 1 -March 31
April 1 -September 30 Year Totals
Activity
Number of
Events / Activiti
es
Number of
Participants
(Consumer
Impressions)
Number of
Events / Activiti
es
Number of
Participants
(Consumer
Impressions)
Total Number
of Events / Activiti
es
Total Consume
r Impressio
ns
LOCAL CONTRACTS 124 133
Grocery Stores
# taste tests at grocery stores 61 7,305 37 20,660 98 27,965
# grocery store tours 35 860 57 1,316 92 2,176
# other grocery promotions 86 17,819 75 24,290 161 42,109
Total Grocery Store Events 182 25,984 169 46,266 351 72,250
Farmer's Markets
# farmer's market taste tests 67 45,991 108 13,339 175 59,330
# farmer's market tours 74 1,500 125 4,812 199 6,312
# other farmers market events 127 18,319 160 17,628 287 35,947
Total Farmers Market Events 268 65,810 393 35,779 661 101,589
Reach of Sales Promotions Activities continued on the next page
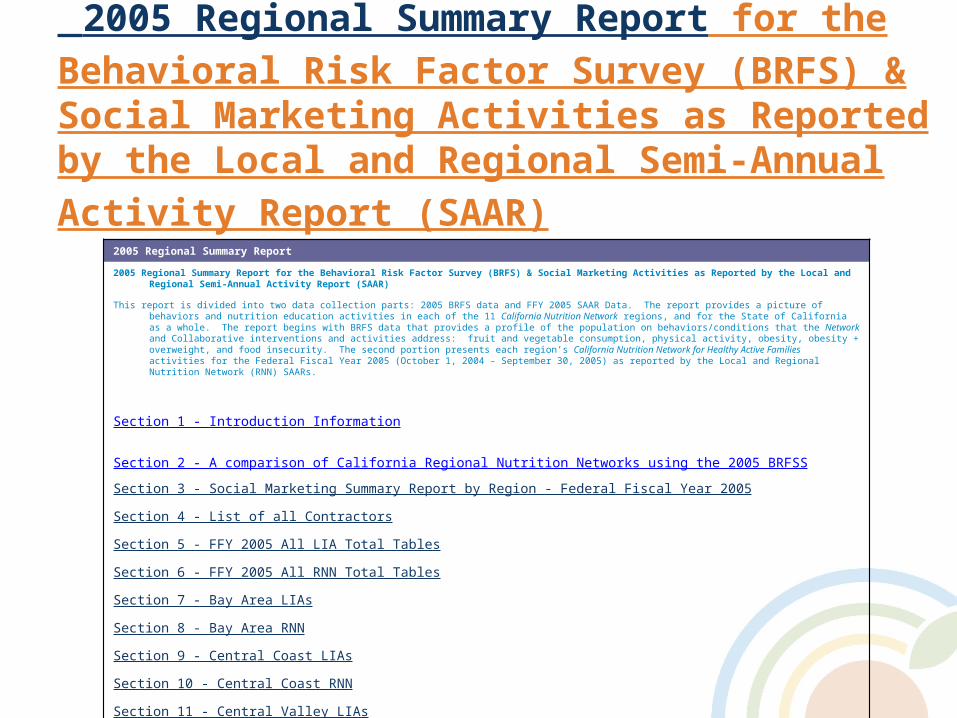
2005 Regional Summary Report for the Behavioral Risk Factor Survey (BRFS) & Social Marketing Activities as Reported by the Local and
Regional Semi-Annual Activity Report (SAAR) 2005 Regional Summary Report
2005 Regional Summary Report for the Behavioral Risk Factor Survey (BRFS) & Social Marketing Activities as Reported by the Local and Regional Semi-Annual Activity Report (SAAR)
This report is divided into two data collection parts: 2005 BRFS data and FFY 2005 SAAR Data. The report provides a picture of behaviors and nutrition education activities in each of the 11 California Nutrition Network regions, and for the State of California as a whole. The report begins with BRFS data that provides a profile of the population on behaviors/conditions that the Network and Collaborative interventions and activities address: fruit and vegetable consumption, physical activity, obesity, obesity + overweight, and food insecurity. The second portion presents each region’s California Nutrition Network for Healthy Active Families activities for the Federal Fiscal Year 2005 (October 1, 2004 – September 30, 2005) as reported by the Local and Regional Nutrition Network (RNN) SAARs.
Section 1 - Introduction Information
Section 2 - A comparison of California Regional Nutrition Networks using the 2005 BRFSS
Section 3 - Social Marketing Summary Report by Region - Federal Fiscal Year 2005
Section 4 - List of all Contractors
Section 5 - FFY 2005 All LIA Total Tables
Section 6 - FFY 2005 All RNN Total Tables
Section 7 - Bay Area LIAs
Section 8 - Bay Area RNN
Section 9 - Central Coast LIAs
Section 10 - Central Coast RNN
Section 11 - Central Valley LIAs

Formative Evaluation
• Development of social marketing campaigns, materials, and interventions
• Exploration of new target population or health problem
• Data sources: focus groups, key informant interviews, pilot tests, satisfaction surveys
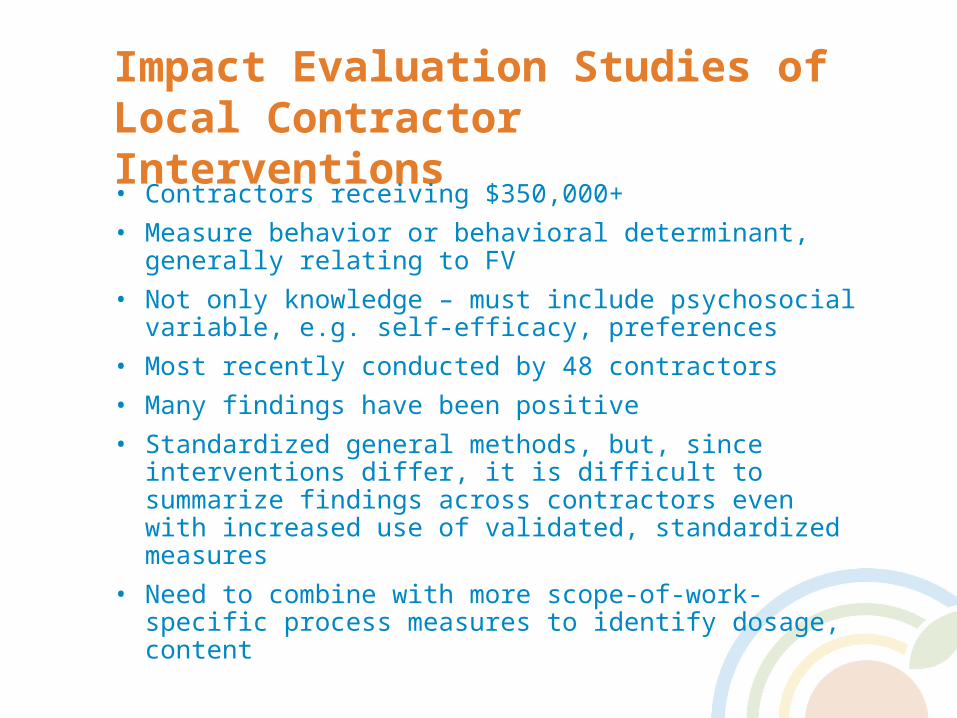
Impact Evaluation Studies of Local Contractor Interventions• Contractors receiving $350,000+
• Measure behavior or behavioral determinant, generally relating to FV
• Not only knowledge – must include psychosocial variable, e.g. self-efficacy, preferences
• Most recently conducted by 48 contractors
• Many findings have been positive
• Standardized general methods, but, since interventions differ, it is difficult to summarize findings across contractors even with increased use of validated, standardized measures
• Need to combine with more scope-of-work-specific process measures to identify dosage, content
20
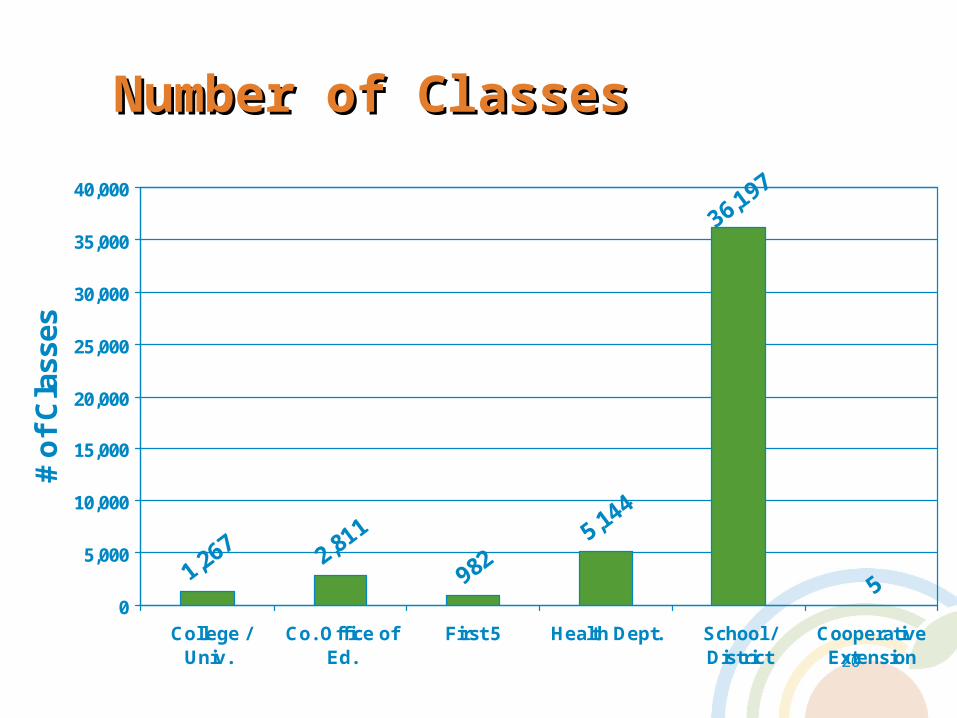
Number of ClassesNumber of Classes
1,267982
5,144
36,197
52,811
0
5,000
10,000
15,000
20,000
25,000
30,000
35,000
40,000
College /Univ.
Co. Office ofEd.
First 5 Health Dept. School /District
CooperativeExtension
# o
f C
lass
es
21
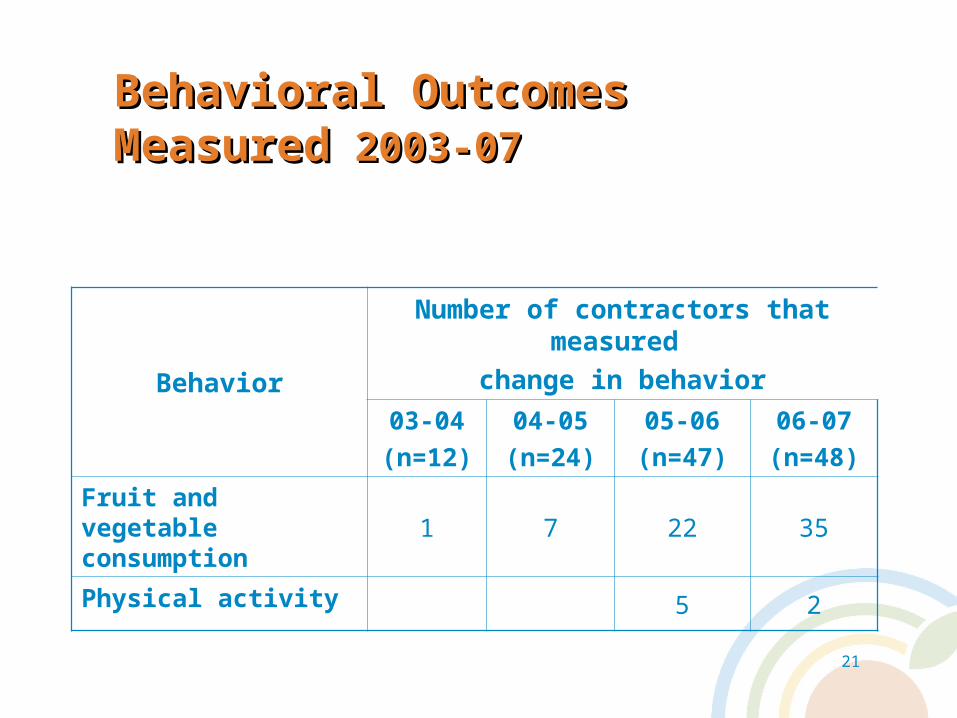
Behavioral Outcomes MeasuredBehavioral Outcomes Measured 2003-072003-07
Behavior
Number of contractors that measured
change in behavior
03-04
(n=12)
04-05
(n=24)
05-06
(n=47)
06-07
(n=48)
Fruit and vegetable consumption
1 7 22 35
Physical activity 5 2
22
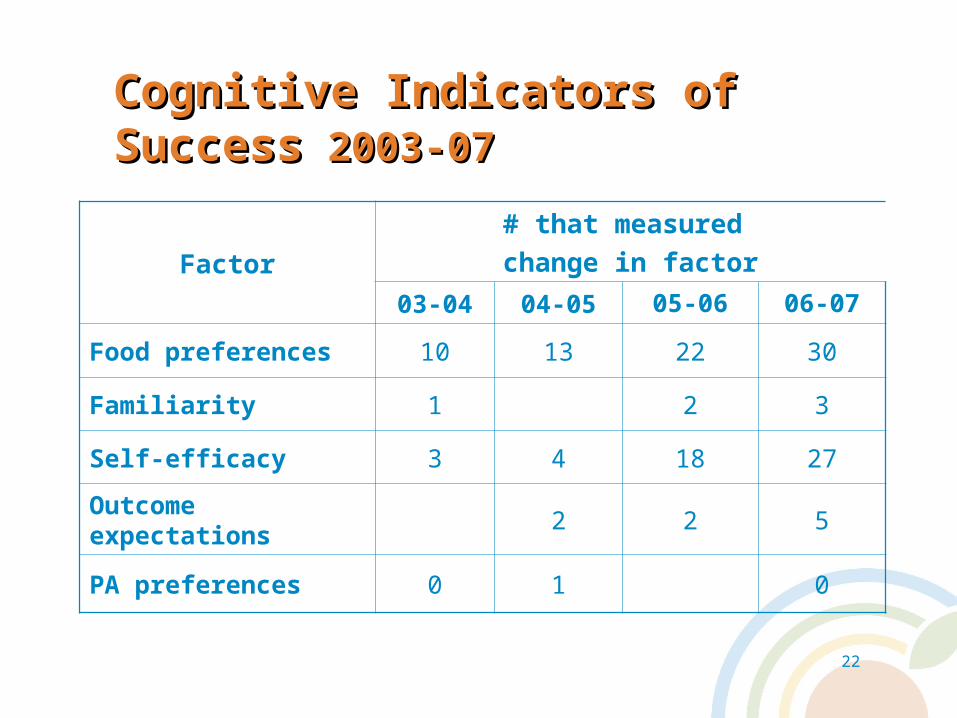
Cognitive Indicators of SuccessCognitive Indicators of Success 2003-072003-07
Factor
# that measured
change in factor
03-04 04-05 05-06 06-07
Food preferences 10 13 22 30
Familiarity 1 2 3
Self-efficacy 3 4 18 27
Outcome expectations 2 2 5
PA preferences 0 1 0
23
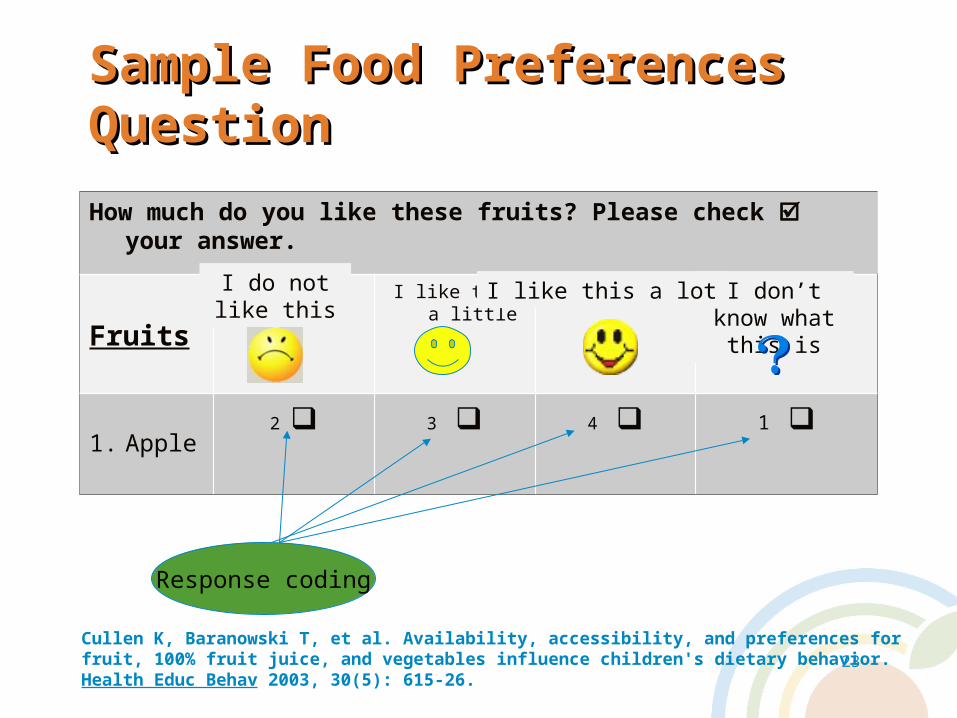
Sample Food Preferences Sample Food Preferences QuestionQuestion
How much do you like these fruits? Please check your answer.
Fruits
I like this a little
1. Apple2 3 4 1
Cullen K, Baranowski T, et al. Availability, accessibility, and preferences for fruit, 100% fruit juice, and vegetables influence children's dietary behavior. Health Educ Behav 2003, 30(5): 615-26.
Response coding
I don’t know what this is
I like this a lotI do not like this
24
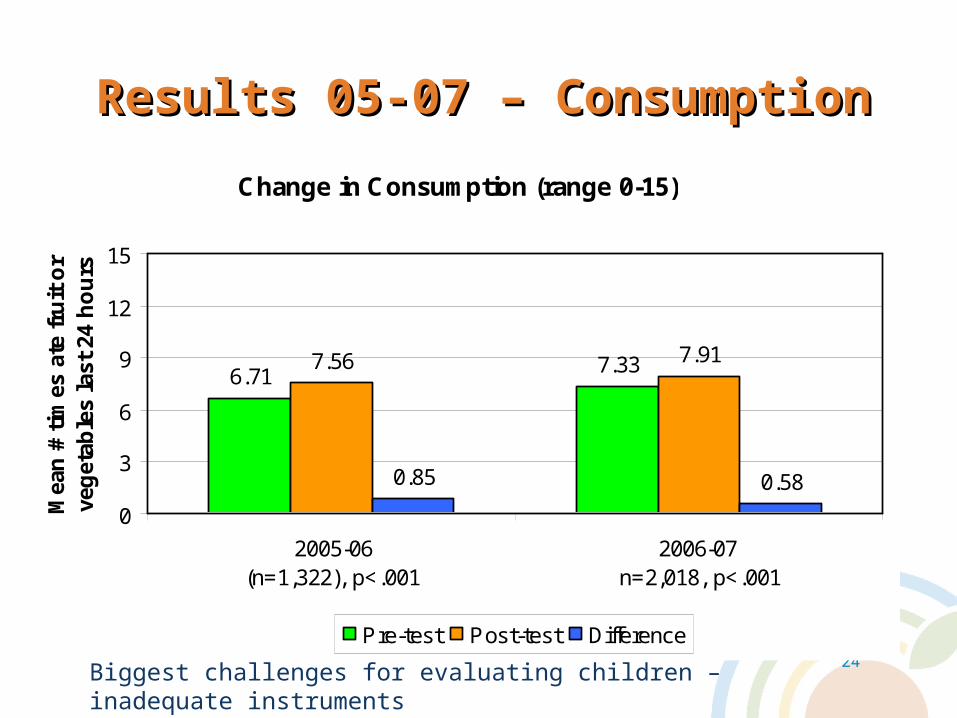
Results 05-07 – ConsumptionResults 05-07 – Consumption
Change in Consumption (range 0-15)
6.71 7.337.56 7.91
0.85 0.58
0
3
6
9
12
15
2005-06(n=1,322), p<.001
2006-07 n=2,018, p<.001
Mea
n #
tim
es a
te f
ruit
or
veg
etab
les
last
24
ho
urs
Pre-test Post-test Difference
Biggest challenges for evaluating children – inadequate instruments
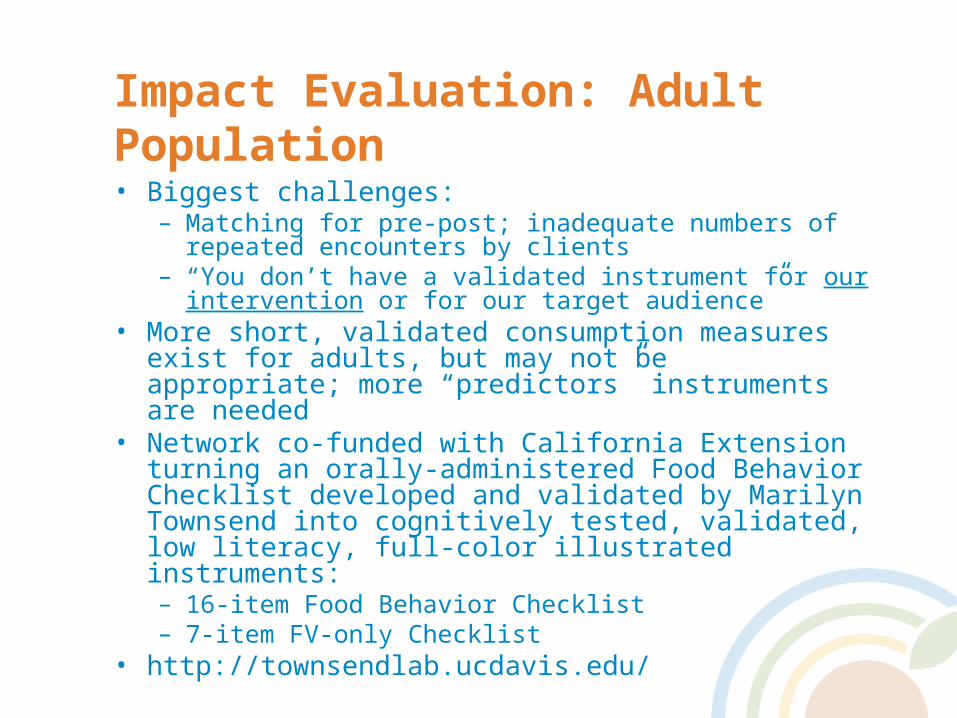
Impact Evaluation: Adult Population• Biggest challenges:
– Matching for pre-post; inadequate numbers of repeated encounters by clients
– “You don’t have a validated instrument for our intervention or for our target audience”
• More short, validated consumption measures exist for adults, but may not be appropriate; more “predictors” instruments are needed
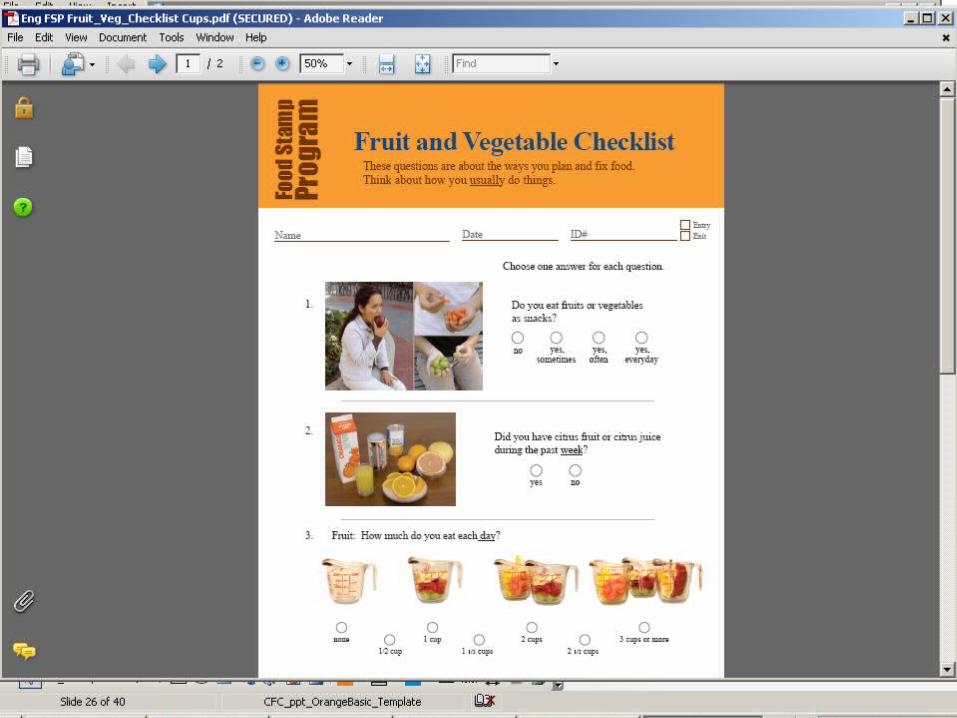
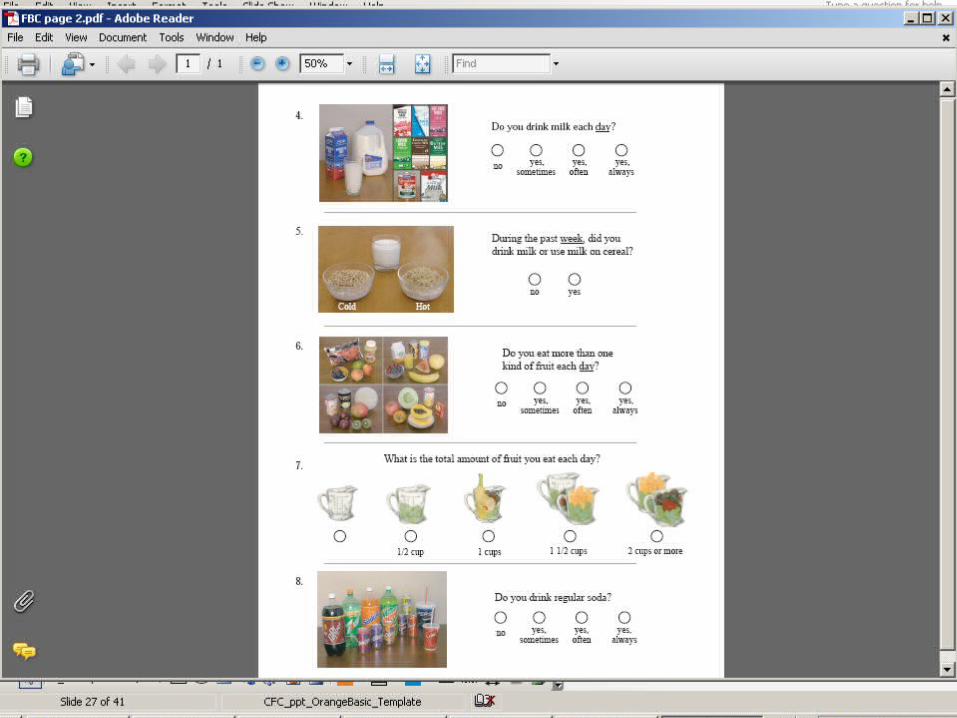
• Network co-funded with California Extension turning an orally-administered Food Behavior Checklist developed and validated by Marilyn Townsend into cognitively tested, validated, low literacy, full-color illustrated instruments:– 16-item Food Behavior Checklist– 7-item FV-only Checklist
• http://townsendlab.ucdavis.edu/
26
Sample Food Preferences Sample Food Preferences QuestionQuestion
Cullen K, Baranowski T, et al. Availability, accessibility, and preferences for fruit, 100% fruit juice, and vegetables influence children's dietary behavior. Health Educ Behav 2003, 30(5): 615-26.
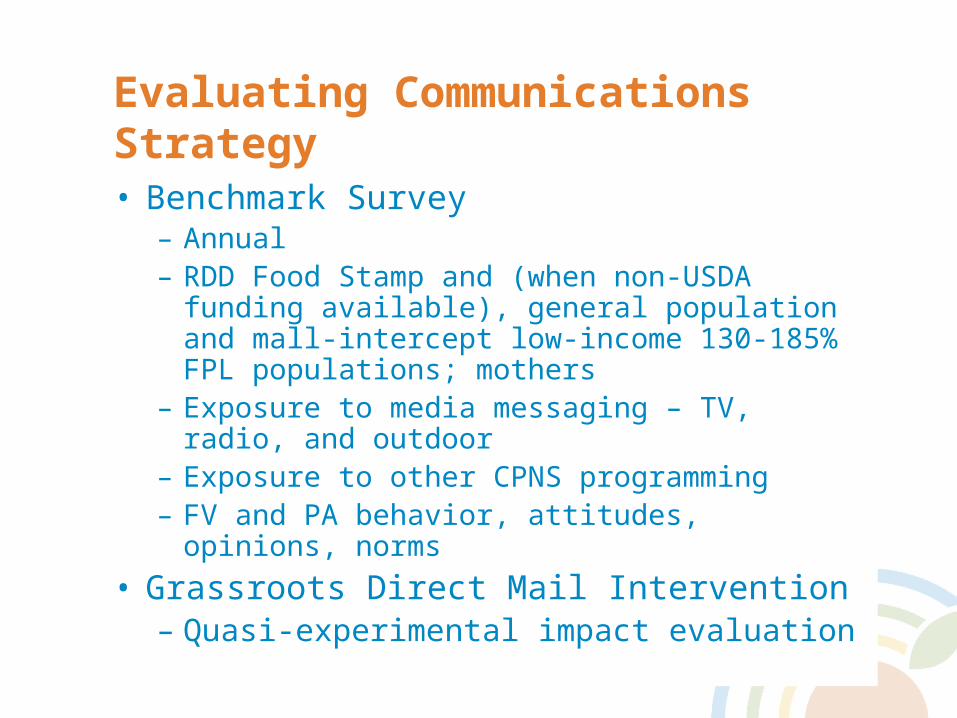
Evaluating Communications Strategy• Benchmark Survey
– Annual– RDD Food Stamp and (when non-USDA
funding available), general population and mall-intercept low-income 130-185% FPL populations; mothers
– Exposure to media messaging – TV, radio, and outdoor
– Exposure to other CPNS programming– FV and PA behavior, attitudes, opinions, norms
• Grassroots Direct Mail Intervention– Quasi-experimental impact evaluation
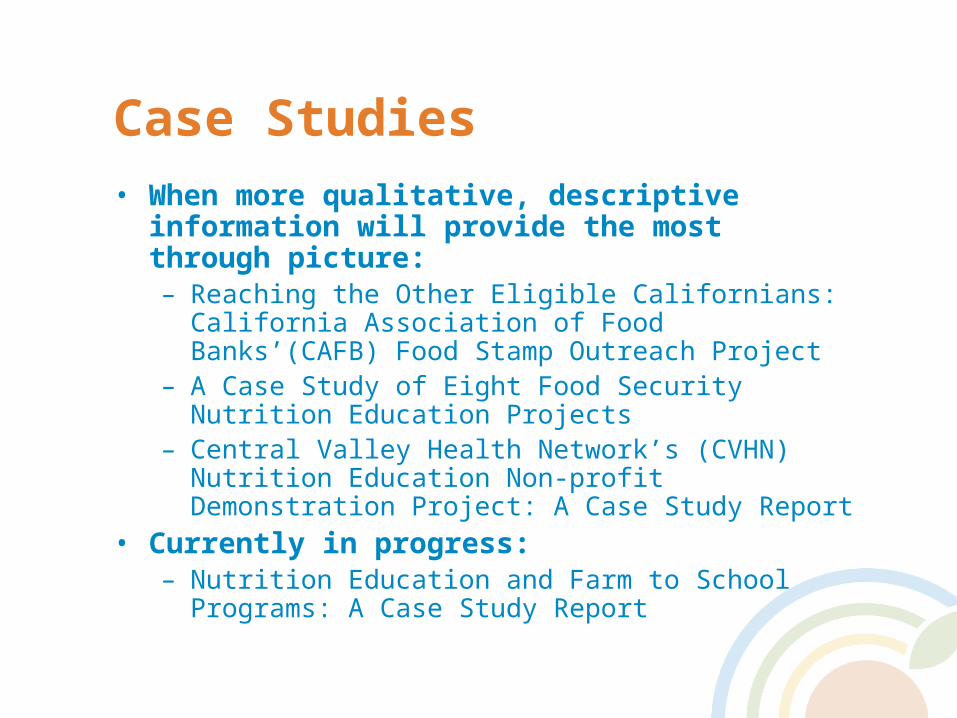
Case Studies• When more qualitative, descriptive information will
provide the most through picture:– Reaching the Other Eligible Californians: California
Association of Food Banks’(CAFB) Food Stamp Outreach Project
– A Case Study of Eight Food Security Nutrition Education Projects
– Central Valley Health Network’s (CVHN) Nutrition Education Non-profit Demonstration Project: A Case Study Report
• Currently in progress:– Nutrition Education and Farm to School Programs: A
Case Study Report
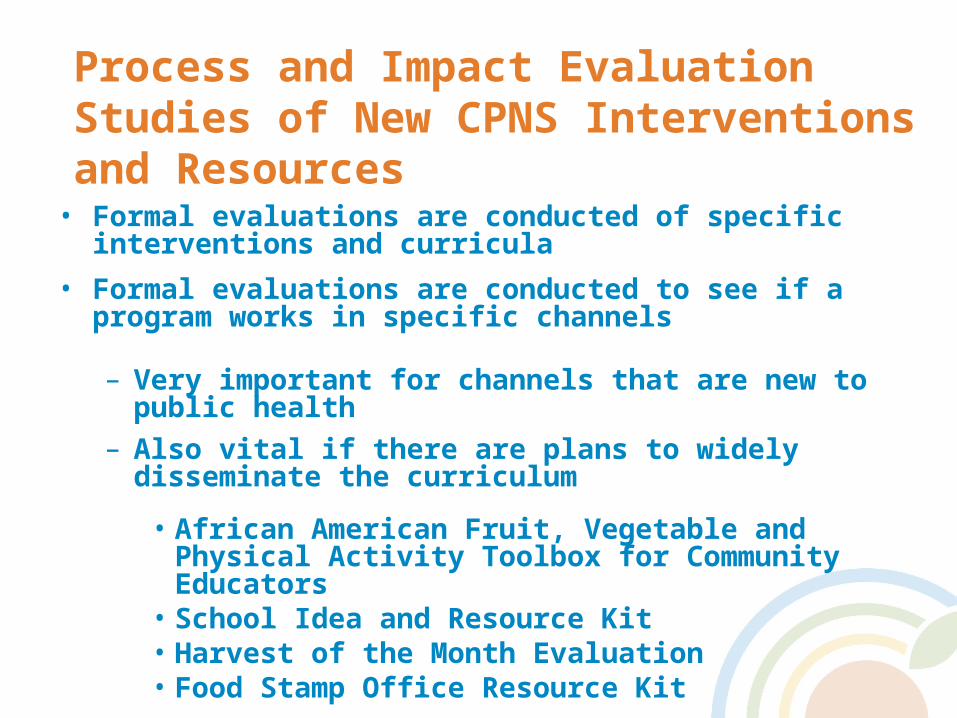
Process and Impact Evaluation Studies of New CPNS Interventions and Resources
• Formal evaluations are conducted of specific interventions and curricula
• Formal evaluations are conducted to see if a program works in specific channels
– Very important for channels that are new to public health
– Also vital if there are plans to widely disseminate the curriculum
• African American Fruit, Vegetable and Physical Activity Toolbox for Community Educators
• School Idea and Resource Kit• Harvest of the Month Evaluation• Food Stamp Office Resource Kit
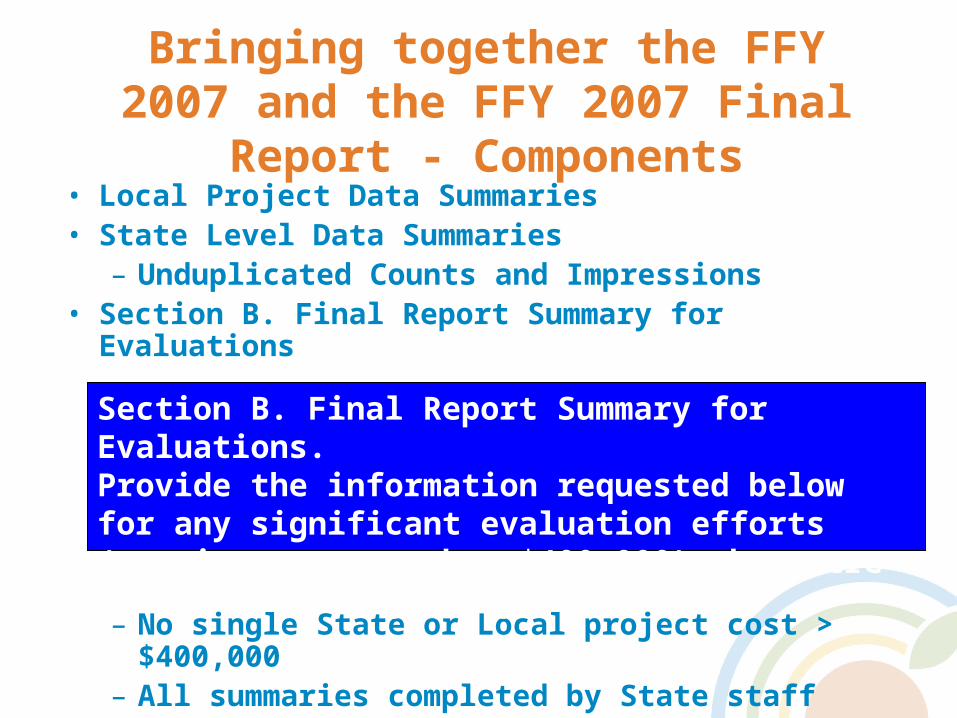
Bringing together the FFY 2007 and the FFY 2007 Final Report -
Components• Local Project Data Summaries• State Level Data Summaries
– Unduplicated Counts and Impressions• Section B. Final Report Summary for Evaluations
– No single State or Local project cost > $400,000
– All summaries completed by State staff
Section B. Final Report Summary for Evaluations. Provide the information requested below for any significant evaluation efforts (costing greater than $400,000) that were completed during the previous year.
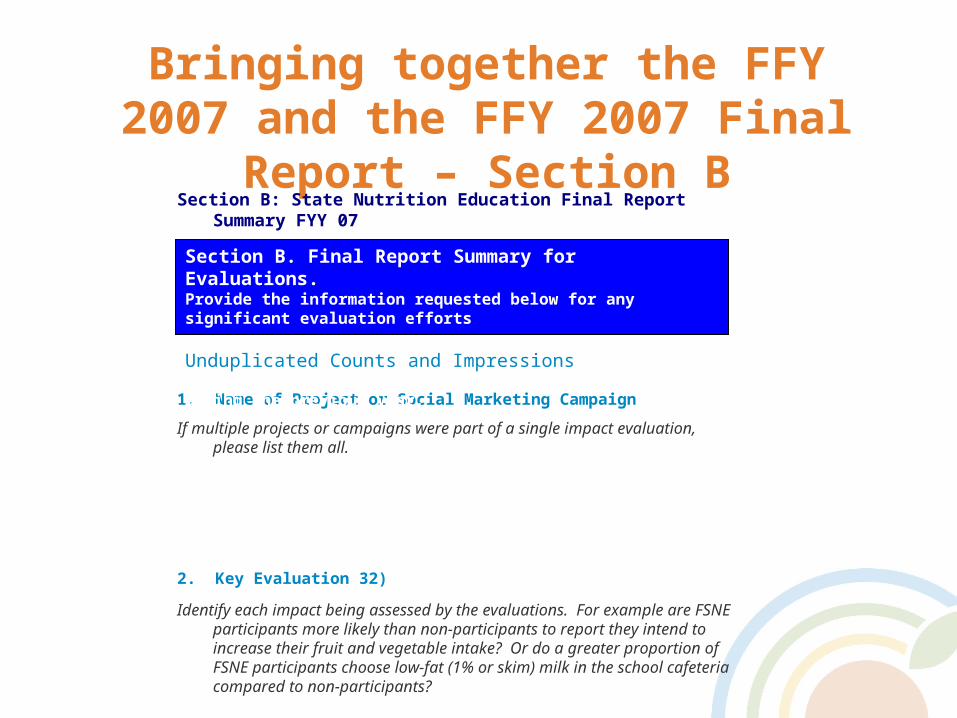
Bringing together the FFY 2007 and the FFY 2007 Final Report –
Section BSection B: State Nutrition Education Final Report Summary FYY 07
1. Name of Project or Social Marketing Campaign
If multiple projects or campaigns were part of a single impact evaluation, please list them all.
2. Key Evaluation 32)
Identify each impact being assessed by the evaluations. For example are FSNE participants more likely than non-participants to report they intend to increase their fruit and vegetable intake? Or do a greater proportion of FSNE participants choose low-fat (1% or skim) milk in the school cafeteria compared to non-participants?
3. Evaluation participants.
Section B. Final Report Summary for Evaluations. Provide the information requested below for any significant evaluation efforts
Unduplicated Counts and Impressions(costing greater than $400,000) that were completed during the previous year.
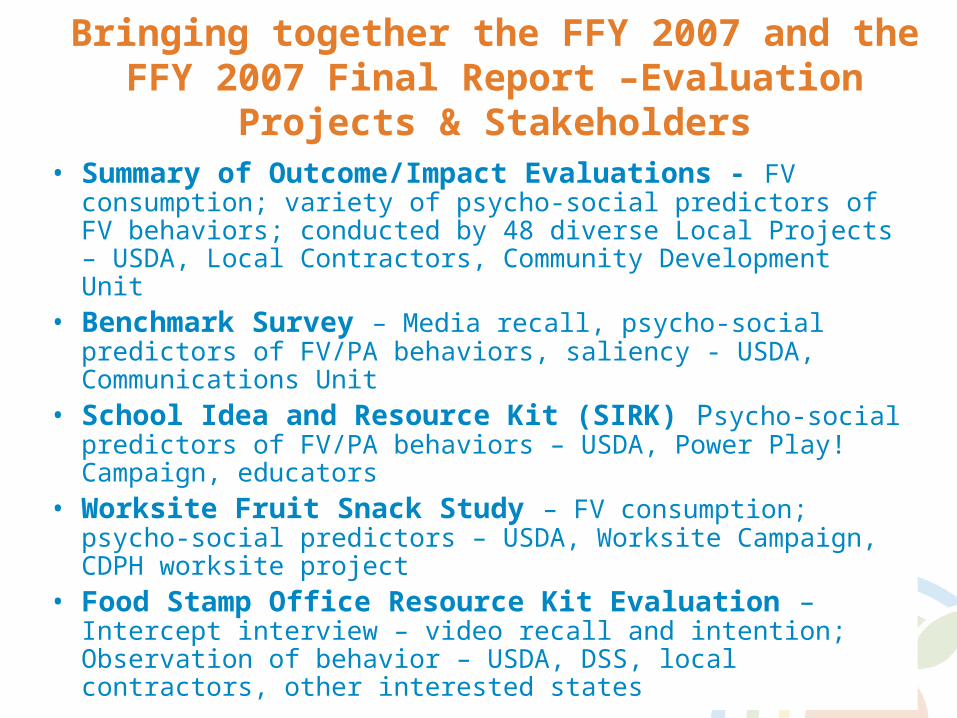
• Summary of Outcome/Impact Evaluations - FV consumption; variety of psycho-social predictors of FV behaviors; conducted by 48 diverse Local Projects – USDA, Local Contractors, Community Development Unit
• Benchmark Survey – Media recall, psycho-social predictors of FV/PA behaviors, saliency - USDA, Communications Unit
• School Idea and Resource Kit (SIRK) Psycho-social predictors of FV/PA behaviors – USDA, Power Play! Campaign, educators
• Worksite Fruit Snack Study – FV consumption; psycho-social predictors – USDA, Worksite Campaign, CDPH worksite project
• Food Stamp Office Resource Kit Evaluation – Intercept interview – video recall and intention; Observation of behavior – USDA, DSS, local contractors, other interested states
Bringing together the FFY 2007 and the FFY 2007 Final Report –Evaluation Projects & Stakeholders
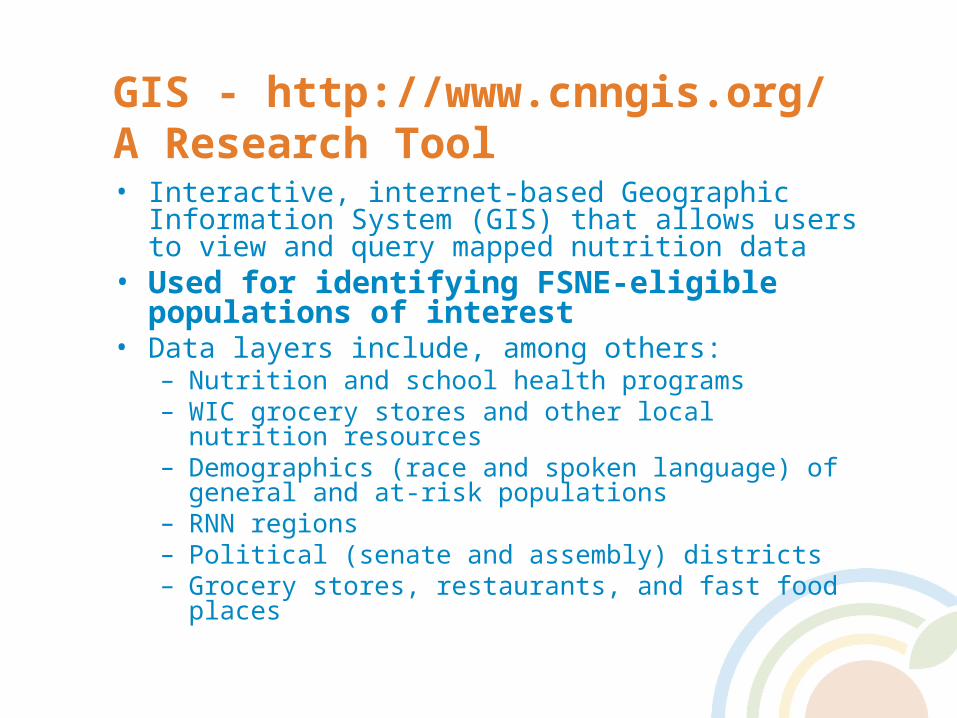
GIS - http://www.cnngis.org/A Research Tool• Interactive, internet-based Geographic Information
System (GIS) that allows users to view and query mapped nutrition data
• Used for identifying FSNE-eligible populations of interest
• Data layers include, among others:– Nutrition and school health programs – WIC grocery stores and other local nutrition resources – Demographics (race and spoken language) of general
and at-risk populations – RNN regions – Political (senate and assembly) districts – Grocery stores, restaurants, and fast food places
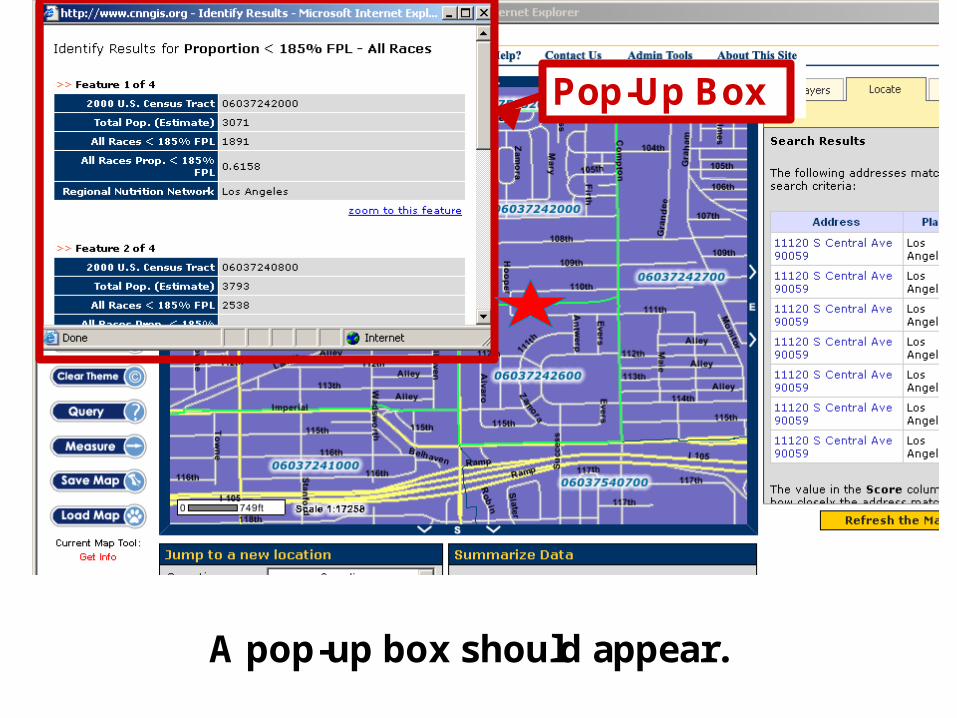
A pop-up box should appear.
Pop-Up Box
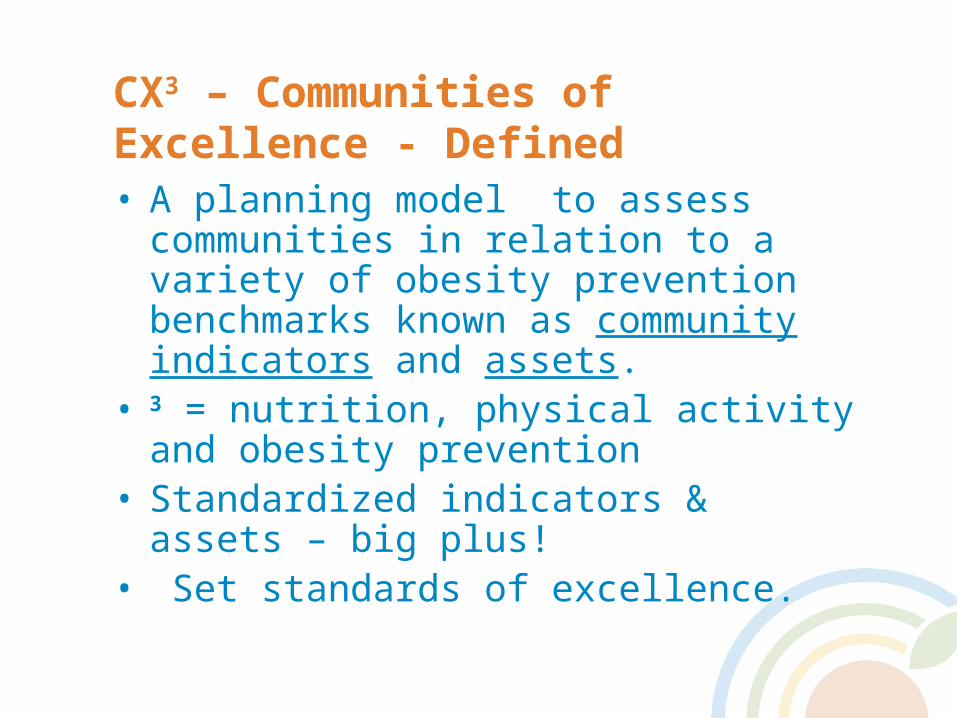
CX3 – Communities of Excellence - Defined• A planning model to assess communities
in relation to a variety of obesity prevention benchmarks known as community indicators and assets.
• 3 = nutrition, physical activity and obesity prevention
• Standardized indicators & assets – big plus!
• Set standards of excellence.
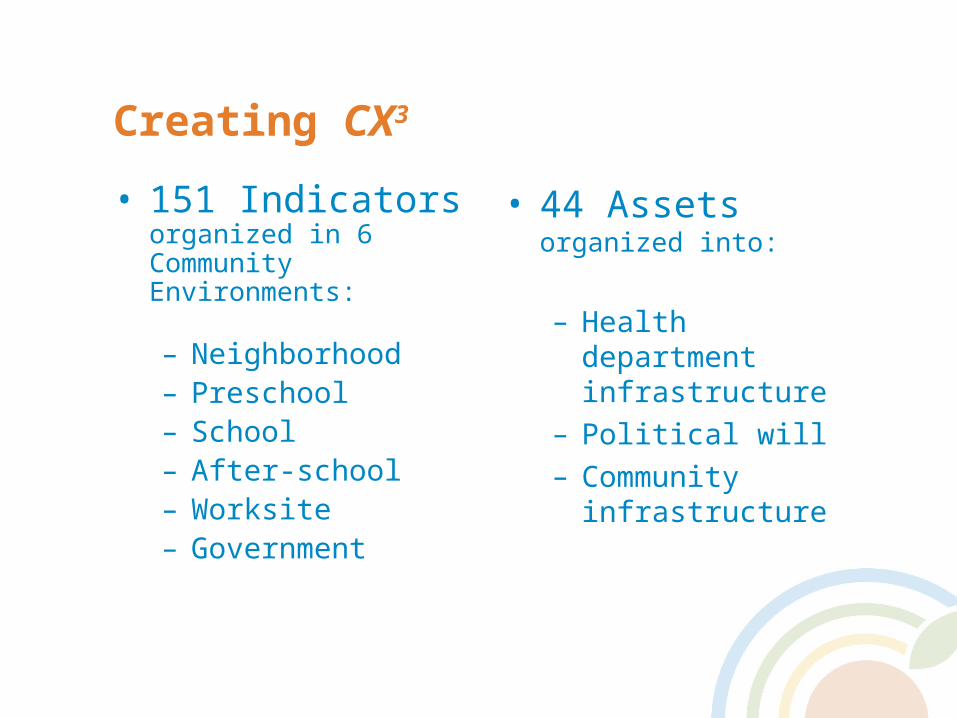
Creating CX3
• 151 Indicators organized in 6 Community Environments:
– Neighborhood– Preschool– School– After-school– Worksite– Government
• 44 Assets organized into:
– Health department infrastructure
– Political will
– Community infrastructure
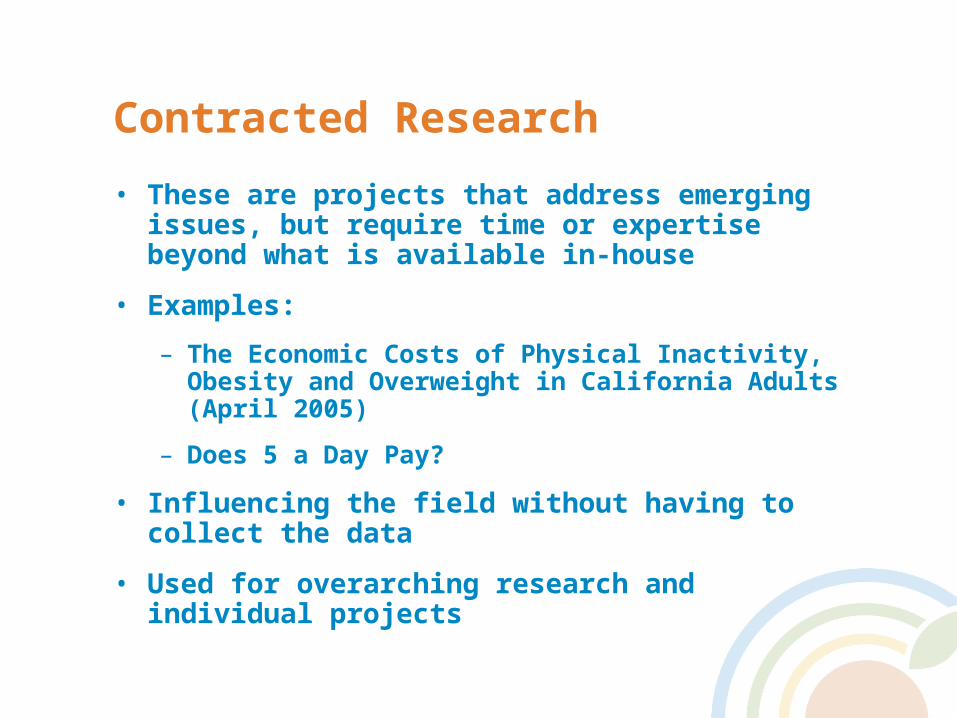
Contracted Research
• These are projects that address emerging issues, but require time or expertise beyond what is available in-house
• Examples:
– The Economic Costs of Physical Inactivity, Obesity and Overweight in California Adults (April 2005)
– Does 5 a Day Pay?
• Influencing the field without having to collect the data
• Used for overarching research and individual projects
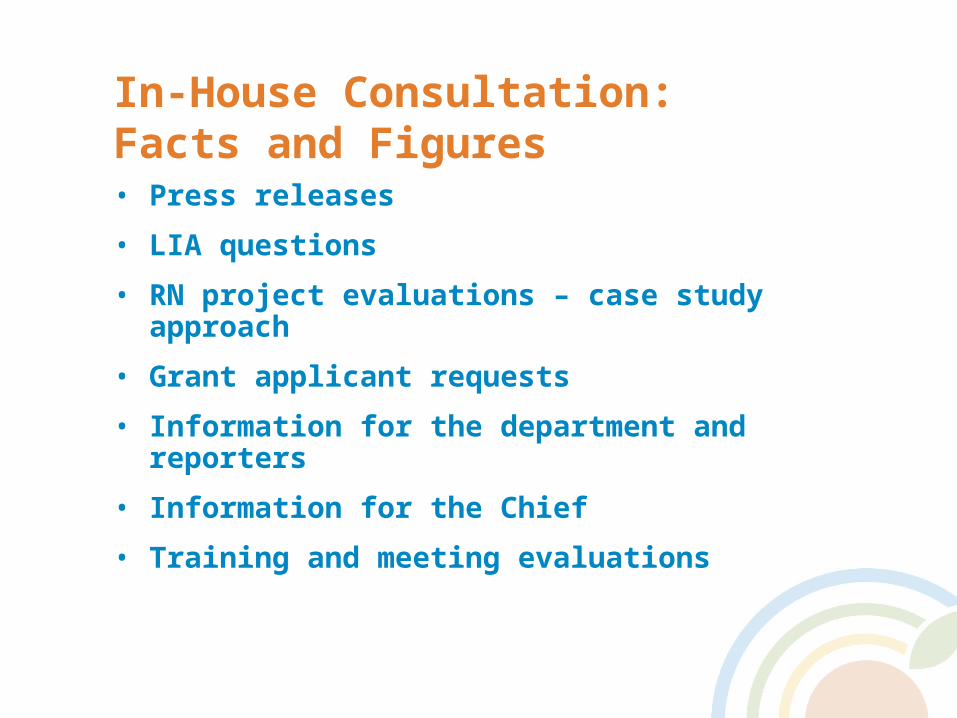
In-House Consultation: Facts and Figures• Press releases
• LIA questions
• RN project evaluations – case study approach
• Grant applicant requests
• Information for the department and reporters
• Information for the Chief
• Training and meeting evaluations
A Key Evaluation Question
How to most effectively evaluate the combined efforts of local projects, targeted campaigns and media?
RWJF interviews held with “experts in the field” during 2007 – report in progress
For partners, professionals and links to campaigns, programs and resources —www.networkforahealthycalifornia.net
In particular, the Research and Evaluation web pages
http://www.dhs.ca.gov/ps/cdic/cpns/research/default.htm
New and growing! Consumer educational material for parents and youth, in English and Spanish –www.cachampionsforchange.net
For More on Interventions and Evaluation, Please Visit Us—