sudden cardiac death and pump failure death...
TRANSCRIPT

RESEARCH ARTICLE
Sudden cardiac death and pump failure death
prediction in chronic heart failure by
combining ECG and clinical markers in an
integrated risk model
Julia Ramırez1*, Michele Orini2,3, Ana Minchole4, Violeta Monasterio5,
Iwona Cygankiewicz6, Antonio Bayes de Luna7, Juan Pablo Martınez8,9, Pablo Laguna8,9☯,
Esther Pueyo8,9☯
1 Clinical Pharmacology Department, William Harvey Research Institute, John Vane Science Centre, Queen
Mary University of London, Charterhouse Square, London, United Kingdom, 2 Institute of Cardiovascular
Science, University College London, London, United Kingdom, 3 Barts Heart Centre, St Bartholomeus
Hospital, London, United Kingdom, 4 Department of Computer Science, University of Oxford, Oxford, United
Kingdom, 5 Universidad San Jorge, Campus Universitario, Villanueva de Gallego, Spain, 6 Department of
Electrocardiology, Medical University of Lodz, Sterling Regional Center for Heart Diseases, Lodz, Poland,
7 Catalan Institute of Cardiovascular Sciences, Santa Creu I Sant Pau Hospital, Barcelona, Spain,
8 Biomedical Signal Interpretation and Computational Simulation (BSICoS) group, Aragon Institute of
Engineering Research, IIS Aragon, University of Zaragoza, Zaragoza, Spain, 9 Biomedical Research
Networking Center in Bioengineering, Biomaterials and Nanomedicine (CIBER-BBN), Zaragoza, Spain
☯ These authors contributed equally to this work.
Abstract
Background
Sudden cardiac death (SCD) and pump failure death (PFD) are common endpoints in
chronic heart failure (CHF) patients, but prevention strategies are different. Currently used
tools to specifically predict these endpoints are limited. We developed risk models to specifi-
cally assess SCD and PFD risk in CHF by combining ECG markers and clinical variables.
Methods
The relation of clinical and ECG markers with SCD and PFD risk was assessed in 597
patients enrolled in the MUSIC (MUerte Subita en Insuficiencia Cardiaca) study. ECG indi-
ces included: turbulence slope (TS), reflecting autonomic dysfunction; T-wave alternans
(TWA), reflecting ventricular repolarization instability; and T-peak-to-end restitution (ΔαTpe)
and T-wave morphology restitution (TMR), both reflecting changes in dispersion of repolari-
zation due to heart rate changes. Standard clinical indices were also included.
Results
The indices with the greatest SCD prognostic impact were gender, New York Heart Associa-
tion (NYHA) class, left ventricular ejection fraction, TWA, ΔαTpe and TMR. For PFD, the indi-
ces were diabetes, NYHA class, ΔαTpe and TS. Using a model with only clinical variables,
the hazard ratios (HRs) for SCD and PFD for patients in the high-risk group (fifth quintile of
PLOS ONE | https://doi.org/10.1371/journal.pone.0186152 October 11, 2017 1 / 15
a1111111111
a1111111111
a1111111111
a1111111111
a1111111111
OPENACCESS
Citation: Ramırez J, Orini M, Minchole A,
Monasterio V, Cygankiewicz I, Bayes de Luna A, et
al. (2017) Sudden cardiac death and pump failure
death prediction in chronic heart failure by
combining ECG and clinical markers in an
integrated risk model. PLoS ONE 12(10):
e0186152. https://doi.org/10.1371/journal.
pone.0186152
Editor: Vincenzo Lionetti, Scuola Superiore
Sant’Anna, ITALY
Received: June 7, 2017
Accepted: September 26, 2017
Published: October 11, 2017
Copyright: © 2017 Ramırez et al. This is an open
access article distributed under the terms of the
Creative Commons Attribution License, which
permits unrestricted use, distribution, and
reproduction in any medium, provided the original
author and source are credited.
Data Availability Statement: All relevant data are
within the paper and its Supporting Information
files.
Funding: This work was supported by projects
TIN2013-41998-R to EP, PL, and JR, and
DPI2016-75458-R to JPM, EP, and PL from the
Spanish Ministry of Economy and Competitiveness
(MINECO), Spain, the MULTITOOLS2HEART from
CIBER-BBN through Instituto de Salud Carlos III,

risk score) with respect to patients in the low-risk group (first and second quintiles of risk
score) were both greater than 4. HRs for SCD and PFD increased to 9 and 11 when using a
model including only ECG markers, and to 14 and 13, when combining clinical and ECG
markers.
Conclusion
The inclusion of ECG markers capturing complementary pro-arrhythmic and pump failure
mechanisms into risk models based only on standard clinical variables substantially
improves prediction of SCD and PFD in CHF patients.
Introduction
Sudden cardiac death (SCD) and pump failure death (PFD) are both common endpoints in
patients with chronic heart failure (CHF) [1]. Prevention of these two different modes of death
requires different treatment, including implantable cardioverter defibrillators (ICDs) to reduce
SCD mortality [2] and cardiac resynchronization therapy to decrease PFD rate [3]. Effective
techniques for risk stratification, able to specifically target functional (PFD) or arrhythmic
(SCD) risk are needed.
Chronic heart failure is a complex clinical syndrome that can result from a number of func-
tional or structural cardiac disorders, impairing the ventricle’s ability to fill with or eject blood
[4]. A common finding in CHF patients is chronic sympathetic over-activity [5], a risk factor
for both SCD and PFD [6, 7]. Initial sustained sympathetic activation increases the vulnerabil-
ity to ventricular arrhythmias by enhancing the spatio-temporal heterogeneity of repolariza-
tion [8] and the ventricular response to heart rate changes [9]. Enduring sympathetic
activation facilitates withdrawal of vagal activity [10] and a weakened ventricular response
[11]. Considering the interaction of multiple factors in SCD and PFD, the combination of indi-
ces reflecting complementary mechanisms rather than the use of individual markers may
improve SCD and PFD risk stratification.
Risk models based on clinical variables have been proposed for risk stratifying CHF patients
at risk of SCD or PFD [12, 13, 14] and can be utilized as a first step to identify SCD or PFD
risk subgroups [15]. In this study, we hypothesized that integrated models combining standard
clinical variables with ECG markers assessing autonomic nervous system (ANS) imbalance
and cardiac electrophysiological abnormalities would improve both SCD and PFD risk stratifi-
cation, thus providing a tool to better discriminate between SCD and PFD risk. On top of the
analysis on the general study population, separate analyses were performed in subpopulations
of patients with reduced left ventricular ejection fraction (LVEF)�35% (HFrEF group) and
with preserved LVEF>35% (HFpEF group).
Methods
Study population
The original study population consisted of 992 consecutive patients with symptomatic CHF
corresponding to NYHA classes II and III enrolled in the MUSIC (MUerte Subita en Insufi-
ciencia Cardiaca) study, a prospective, multicenter study designed to assess risk predictors for
cardiovascular mortality in ambulatory CHF patients [13]. Patients were enrolled from the
specialized CHF clinics of eight University Hospitals between April 2003 and December 2004.
Clinical and ECG risk models for SCD and PFD prediction
PLOS ONE | https://doi.org/10.1371/journal.pone.0186152 October 11, 2017 2 / 15
Spain to JPM, EP, and PL, the European Social
Fund (EU) and Aragon Government through
BSICoS group (T96) to JPM, EP, and PL, and by
the European Research Council (ERC) through
project ERC-2014-StG 638284 to EP.
Competing interests: The authors have declared
that no competing interests exist.

A two- (3%) or three-lead (97%) 24-h Holter ECG sampled at 200 Hz was recorded in each
patient at enrolment using ELA Medical equipment (Sorin Group, Paris, France). The original
cohort included patients in atrial fibrillation, in sinus rhythm, in flutter and in pacemaker
rhythm. In this work, only data from patients in sinus rhythm (n = 651) were analyzed. The
MUSIC study included patients with both reduced and preserved LVEF. Patients with pre-
served LVEF were included if they had CHF symptoms, a prior hospitalization for CHF or
objective CHF signs confirmed by chest X-ray and/or echocardiography. Patients were
excluded if they had recent acute coronary syndrome or severe valvular disease amenable for
surgical repair. Patients with atrial fibrillation, flutter, paced rhythm and absence of ventricular
ectopic beats were excluded due to restrictions for reliable calculation of ECG markers [16,
17]. Then, the final sample where all ECG indices could be calculated was composed of 597
patients. All patients signed informed consent and the study protocol was approved by all the
institutional investigation committees from the following participant hospitals: Valme Hospi-
tal (Dr Juan Leal del Ojo, Dr Antonio Fernandez, and Dr Dolores Garcıa-Medina), Santiago
de Compostela Hospital (Dr Pilar Mazon), Son Dureta Hospital (Dr Miquel Fiol and Dr Carlos
Fernandez), Arrixaca Hospital (Dr Mariano Valdes), Gregorio Marañon Hospital (Dr Roberto
Muñoz, Dr Jesus Almendral and Dr Marta Dominguez), Joan XXIII Hospital (Dr Alfredo Bar-
dajı and Dr Pilar Valdovinos), Insular Las Palmas Hospital (Dr Vicente Nieto, Dr Ricardo
Huerta), Sant pau Hospital (Dr Agustina Castellvı-Griso, Dr Maite Domingo, and Dr Mariana
Noguero) [13].
Follow-up visits were conducted on an outpatient basis every 6 months, for a median of 44
months. Primary endpoints were SCD and PFD. Cardiac death (CD) was divided into SCD
and PFD. Death was defined as SCD if it was: (i) a witnessed death occurring within 60 min
from the onset of new symptoms, unless a cause other than cardiac was obvious; (ii) an unwit-
nessed death (<24h) in the absence of preexisting progressive circulatory failure or other
causes of death; or (iii) a death during attempted resuscitation. Deaths occurring in hospitals
as a result of refractory progressive end-stage CHF, or CHF patients undergoing heart trans-
plantation, were defined as PFD. Endpoints were reviewed and classified by the MUSIC Study
Endpoint Committee [13].
Clinical and ECG markers
The clinical variables used in this study are listed in Table 1. ECG markers reflecting spatio-
temporal dispersion of repolarization (IAA), repolarization restitution (ΔαQT, ΔαTpe, TMR)
and sympathovagal balance (TS) were computed and used to develop the risk models, together
with other commonly used ECG variables (see Table 1). Detailed descriptions of IAA, ΔαQT,
ΔαTpe, TMR and TS are presented in Table 2. Previous studies on this dataset have shown that
IAA is associated with SCD when dichotomized at 3.7μV [16] and TS predicts SCD and PFD
when dichotomized at 2.5 ms/RR [17]. ΔαQT and ΔαTpe have been shown to be associated with
SCD when dichotomized at 0.228 and 0.028, respectively [18, 19], while ΔαTpe has been shown
to predict PFD when dichotomized at 0.022 [19]. TMR, a novel index of T-wave morphology
restitution, was calculated by time-warping the morphology of the T-waves [20] at different
RR interval values and was found to predict SCD when dichotomized at TMR = 0.040 [21].
Statistical analyses
The primary outcomes of interest were time to SCD and time to PFD, calculated from the time
of enrollment in the MUSIC study. Patients who died from causes not included in the end-
points or from competing risks were censored at the time of death.
Clinical and ECG risk models for SCD and PFD prediction
PLOS ONE | https://doi.org/10.1371/journal.pone.0186152 October 11, 2017 3 / 15

As a first step in the development of the risk models, univariable analyses using Cox regres-
sion were performed in the sample population in order to determine the relationship between
each potential risk marker and SCD or PFD. Multivariable Cox regression analyses were sub-
sequently performed, with risk markers significantly associated with outcomes in the univari-
able analysis being selected and placed into backward stepwise elimination models and risk
markers associated with p>0.05 being eliminated from the models. Three different models
were fit for SCD and PFD separately: a clinical model (including clinical variables only), an
ECG-based model (including ECG markers only) and a combined model (combining clinical
and ECG markers). Finally, a point scoring system was constructed in which points were
assigned to each marker using beta-coefficients from each of the final multivariable Cox
regression models [22, 23, 24]. A risk score was calculated for each patient by adding the points
associated with each marker (see S1 Appendix). For each risk model, three risk groups were
identified based on the distribution of the scores: low-risk (first and second quintiles), middle-
Table 1. Characteristics of patients according to their outcome. Data are represented as median (interquartile range) for continuous variables and as
number (percentage) for dichotomized variables.
Variable Survivors and non-CD victims
(n = 486)
SCD
(n = 49)
PFD
(n = 62)
Clinical variables
Age [years] 63 (18) † 67 (13) 69 (15) †
Male gender 323 (70%) 41 (84%) † 46 (74%)
Diabetes 163 (35%) † 20 (41%) 33 (53%) †
NYHA class III 62 (13%) † 14 (29%) † 21 (34%) †
Ischemic etiology 220 (48%) † 28 (57%) 37 (60%)
ARB or ACE inhibitors 419 (91%) 40 (82%) 51 (82%)
Beta-blockers 337 (73%) † 36 (74%) 35 (57%) †
Amiodarone 32 (7%) † 6 (12%) 8 (13%)
LVEF�35% 238 (51%) † 36 (74%) † 42 (68%) †
LVEF [%] 35 (16) † 30 (16) † 30 (15) †
ECG variables
Median RR [s] 0.86 (0.18) 0.85 (0.21) 0.84 (0.21)
RR range [s] 0.43 (0.19) † 0.37 (0.27) 0.35 (0.16)†
QRS>120 ms 184 (40%) 23 (47%) 28 (45%)
CIA 105 (23%) † 18 (37%) 24 (39%) †
ΔαTpe�0.036 142 (31%) 27 (55%) † 14 (23%)
ΔαTpe�0.022 206 (45%) 14 (29%) † 39 (63%) †
ΔαTpe [adim.] 0.024 (0.03) 0.039 (0.04) † 0.019 (0.03)
ΔαQT�0.228 152 (33%) 24 (49%) † 21 (34%)
ΔαQT [adim.] 0.197 (0.09) † 0.216 (0.10) 0.205 (0.11)
IAA�3.7μV 100 (22%) † 20 (41%) † 15 (24%)
IAA [μV] 2.921 (1.18) 3.207 (2.21) 2.758 (1.31)
TS�2.5 ms/RR 186 (40%) † 33 (67%) † 49 (79%) †
TS [ms/RR] 3.250 (4.53)† 1.597 (4.28) † 1.245 (1.61) †
TMR�0.040 208 (45%) † 35 (71%) † 26 (42%)
TMR [adim.] 0.038 (0.02)† 0.046 (0.03) † 0.037 (0.03)
ACE: Angiotensin-Converting Enzyme; ARB: Angiotensin Receptor Blocker; CIA = complex index of arrhythmia; IAA = Index of Average Alternans;
LVEF = Left Ventricular Ejection Fraction; NYHA = New York Heart Association; PFD = Pump Failure Death; SCD = Sudden Cardiac Death; TMR = T-wave
Morphology Restitution; TS = Turbulence Slope;† p<0.05 for comparison against the group formed by the other outcomes.
https://doi.org/10.1371/journal.pone.0186152.t001
Clinical and ECG risk models for SCD and PFD prediction
PLOS ONE | https://doi.org/10.1371/journal.pone.0186152 October 11, 2017 4 / 15

risk (third and fourth quintiles) and high-risk (fifth quintile). Association between SCD risk
groups and the SCD outcome was evaluated using the survival probability estimated by the
Kaplan-Meier method using the log-rank test. Association between PFD risk groups and the
PFD outcome was evaluated in the same way. Hazard ratios (HRs) were calculated using the
low-risk group as a reference. A p-value<0.05 was considered as statistically significant. Statis-
tical analysis was performed using SPSS version 22.0 (SPSS, Inc. Chicago IL).
The area under the receiver operating curve (ROC), denoted by AUC, was calculated by
considering the Sensitivity and Specificity of the three risk models (clinical, ECG and com-
bined) in identifying patients associated with a specific outcome (SCD or PFD) at any time
during the follow-up.
Results
Clinical characteristics and cardiac events
There were 425 men and 172 women in the sample population (aged 18–89, 63 ± 12 years).
The majority of patients (83%) were in NYHA class II, while the remaining 17% were in
NYHA class III and LVEF was 37% ± 14%. The detailed characteristics of the study population
are shown in Table 1. During follow-up, there were 134 deaths (22%), including 111 CD (19%)
and 23 non-CD (4%). Among the 111 CDs, 49 were SCD and 62 were PFD.
Associations with SCD and PFD
SCD victims were more frequently men (p = 0.048), were in NYHA class III (p = 0.047) and
had LVEF�35% (p = 0.010), while PFD victims were more likely older than the rest of patients
(p = 0.013), were more frequently diabetic (p = 0.009), in NYHA class III (p = 0.001), were not
treated with beta-blockers (p = 0.012) and also had low LVEF (p = 0.044). Ischemic etiology
was not associated with SCD or PFD (Table 1).
ECG analysis showed that SCD victims were associated with higher ΔαTpe (p = 0.002),
ΔαQT (p = 0.041), IAA (p = 0.008) and TMR (p = 0.001) and lower TS (p = 0.004). PFD victims
Table 2. ECG variables used for SCD or PFD risk prediction.
ECG
marker
Short methodological description Mechanism References
IAA First, selection of signal segments suitable for automatic analysis (128 beats with a 50%
overlap between adjacent segments). Then, estimation of T-wave alternans amplitude in
those segments with a multi-lead scheme that combines periodic component analysis with
the Laplacian likelihood ratio method. Finally, computation of the average of all segment’s
T-wave alternans amplitudes.
Average T-wave alternans activity in
24-h
[16]
TS Maximum positive slope of a regression line assessed over any of 5 consecutive RR
intervals within the first 20 sinus RR intervals after a VPB.
Initial phase of sinus rhythm
deceleration
[17]
ΔαQT Derivative of the QT interval with respect to a surrogate of the RR interval that accounts
for the QT memory dependence on RR.
Ventricular depolarization and
repolarization restitution
[18]
ΔαTpe Derivative of the Tpe interval with respect to a surrogate of the RR interval that accounts
for the Tpe memory dependence on RR.
Dispersion of repolarization
restitution
[19]
TMR First, calculation of the histogram of the RR series and division of the histogram into 10
ms wide pairs of bins distributed symmetrically around the median, and exclusion of those
bins with less than 50 values. Next, calculation of a mean warped T-wave for the two bins
in the pair with the highest separation in RR from the remaining ones. Then, quantification
of the morphological variability between both signal-averaged T-waves [20]. Finally, TMR
was defined as the morphological variability, normalized by the difference between the
longest and shortest RR.
T-wave morphological change per
RR range increment.
[21]
IAA = Index of Average Alternans; TMR = T-wave Morphology Restitution; TS = Turbulence Slope; VPB = Ventricular Premature Beat.
https://doi.org/10.1371/journal.pone.0186152.t002
Clinical and ECG risk models for SCD and PFD prediction
PLOS ONE | https://doi.org/10.1371/journal.pone.0186152 October 11, 2017 5 / 15
were associated with lower RR range (p<0.001), ΔαTpe (p = 0.003), TS (p<0.001) and a higher
rate of a complex index of arrhythmia (CIA) composed of non-sustained ventricular tachycar-
dia (NSVT) and more than 240 ventricular premature beats (VPBs) in 24 h (p = 0.014). QRS
duration was not associated with SCD or PFD.
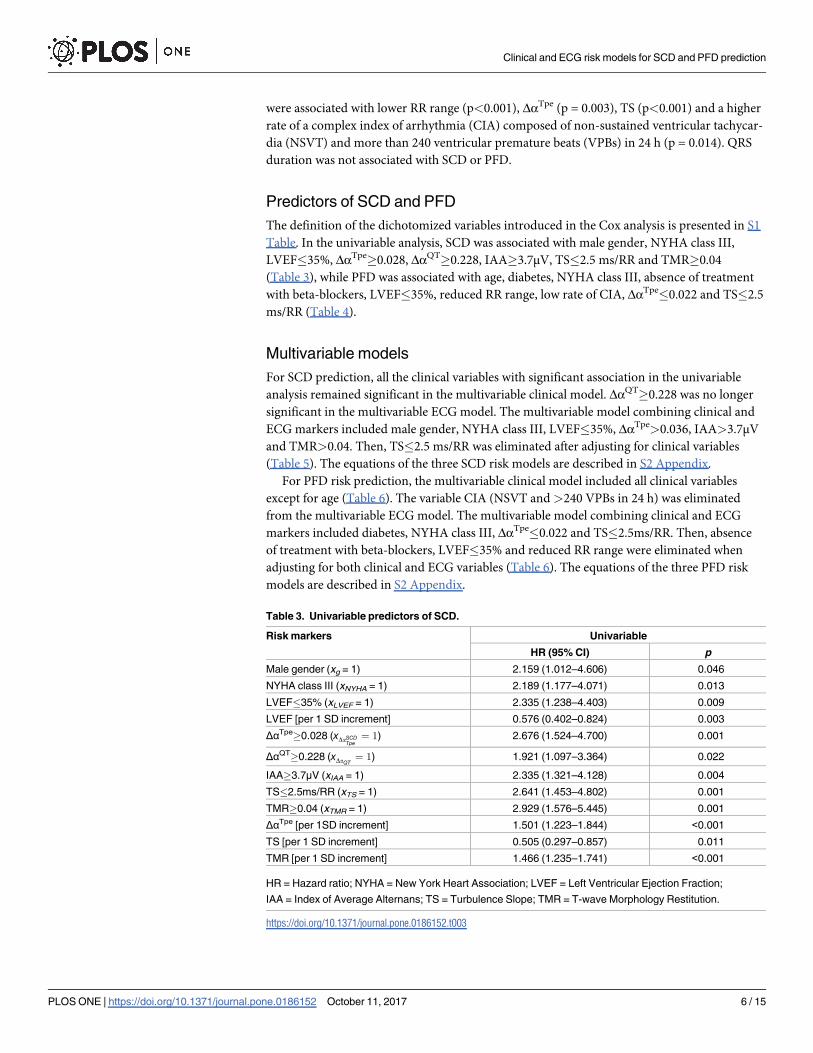
Predictors of SCD and PFD
The definition of the dichotomized variables introduced in the Cox analysis is presented in S1
Table. In the univariable analysis, SCD was associated with male gender, NYHA class III,
LVEF�35%, ΔαTpe�0.028, ΔαQT�0.228, IAA�3.7μV, TS�2.5 ms/RR and TMR�0.04
(Table 3), while PFD was associated with age, diabetes, NYHA class III, absence of treatment
with beta-blockers, LVEF�35%, reduced RR range, low rate of CIA, ΔαTpe�0.022 and TS�2.5
ms/RR (Table 4).
Multivariable models
For SCD prediction, all the clinical variables with significant association in the univariable
analysis remained significant in the multivariable clinical model. ΔαQT�0.228 was no longer
significant in the multivariable ECG model. The multivariable model combining clinical and
ECG markers included male gender, NYHA class III, LVEF�35%, ΔαTpe>0.036, IAA>3.7μV
and TMR>0.04. Then, TS�2.5 ms/RR was eliminated after adjusting for clinical variables
(Table 5). The equations of the three SCD risk models are described in S2 Appendix.
For PFD risk prediction, the multivariable clinical model included all clinical variables
except for age (Table 6). The variable CIA (NSVT and >240 VPBs in 24 h) was eliminated
from the multivariable ECG model. The multivariable model combining clinical and ECG
markers included diabetes, NYHA class III, ΔαTpe�0.022 and TS�2.5ms/RR. Then, absence
of treatment with beta-blockers, LVEF�35% and reduced RR range were eliminated when
adjusting for both clinical and ECG variables (Table 6). The equations of the three PFD risk
models are described in S2 Appendix.
Table 3. Univariable predictors of SCD.
Risk markers Univariable
HR (95% CI) p
Male gender (xg = 1) 2.159 (1.012–4.606) 0.046
NYHA class III (xNYHA = 1) 2.189 (1.177–4.071) 0.013
LVEF�35% (xLVEF = 1) 2.335 (1.238–4.403) 0.009
LVEF [per 1 SD increment] 0.576 (0.402–0.824) 0.003
ΔαTpe�0.028 (xDaSCDTpe¼ 1) 2.676 (1.524–4.700) 0.001
ΔαQT�0.228 (xDaQT¼ 1) 1.921 (1.097–3.364) 0.022
IAA�3.7μV (xIAA = 1) 2.335 (1.321–4.128) 0.004
TS�2.5ms/RR (xTS = 1) 2.641 (1.453–4.802) 0.001
TMR�0.04 (xTMR = 1) 2.929 (1.576–5.445) 0.001
ΔαTpe [per 1SD increment] 1.501 (1.223–1.844) <0.001
TS [per 1 SD increment] 0.505 (0.297–0.857) 0.011
TMR [per 1 SD increment] 1.466 (1.235–1.741) <0.001
HR = Hazard ratio; NYHA = New York Heart Association; LVEF = Left Ventricular Ejection Fraction;
IAA = Index of Average Alternans; TS = Turbulence Slope; TMR = T-wave Morphology Restitution.
https://doi.org/10.1371/journal.pone.0186152.t003
Clinical and ECG risk models for SCD and PFD prediction
PLOS ONE | https://doi.org/10.1371/journal.pone.0186152 October 11, 2017 6 / 15

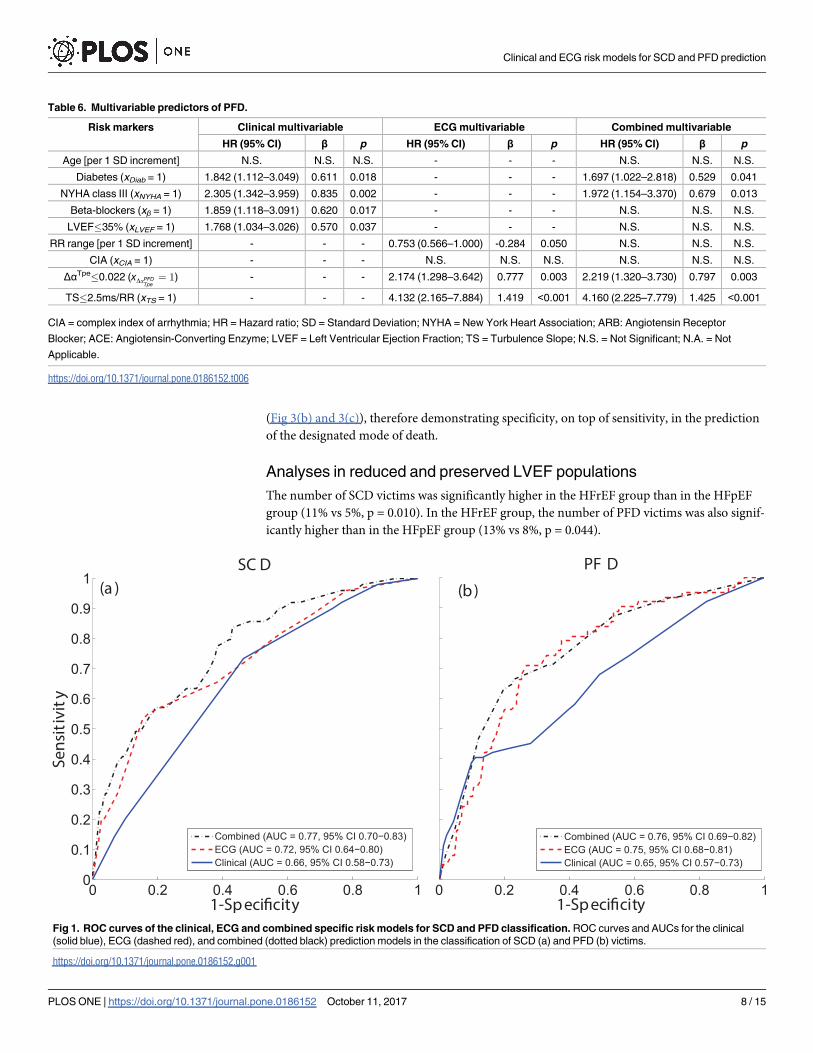
SCD and PFD prediction
According to ROC analysis, ECG markers provided a more accurate prediction of both SCD
and PFD with respect to clinical markers (Fig 1). Accuracy further increased for SCD predic-
tion when combining clinical and ECG markers.
Kaplan-Meier analysis showed that SCD probability for the high-risk group was higher in
the ECG model than in the clinical model and it further increased in the combined model (Fig
2(a)–2(c)). Moreover, in the combined model, SCD probability for the low-risk group was
lower than in the ECG and clinical models, therefore further increasing the distance between
low and high-risk curves. Regarding PFD, the distance between low- and high-risk groups was
significant for all three models, but larger for the combined one (Fig 2(d)–2(f)).
Both SCD and PFD prediction improved when clinical and ECG markers where integrated
into the combined model. HRs for SCD was equal to 4.0, 8.9 and 13.8 for clinical, ECG and
combined models, respectively (Fig 3(a)), and HRs for PFD equal to 4.1, 11.4 and 13.1 for
clinical, ECG and combined models, respectively (Fig 3(d)). Importantly, models designed to
predict SCD did not predict PFD and models designed to predict PFD did not predict SCD
Table 4. Univariable predictors of PFD.
Risk marker Univariable
HR (95% CI) p
Age [per 1 SD increment] 1.378 (1.047–1.813) 0.022
Diabetes (xDiab = 1) 2.011 (1.221–3.312) 0.006
NYHA class III (xNYHA = 1) 2.892 (1.709–4.896) <0.001
Beta-blockers (xβ = 1) 0.498 (0.302–0.823) 0.007
LVEF�35% (xLVEF = 1) 1.792 (1.052–3.053) 0.032
RR range [per 1 SD increment] 0.587 (0.451–0.764) <0.001
CIA (xCIA = 1) 2.034 (1.220–3.391) 0.006
ΔαTpe�0.022 (xDaPFDTpe¼ 1) 2.068 (1.235–3.462) 0.006
TS�2.5ms/RR (xTS = 1) 4.975 (2.698–9.172) <0.001
TS [per 1 SD increment] 0.410 (0.242–0.696) 0.001
CIA = complex index of arrhythmia; HR = Hazard ratio; SD = Standard Deviation; NYHA = New York Heart
Association; LVEF = Left Ventricular Ejection Fraction; TS = Turbulence Slope.
https://doi.org/10.1371/journal.pone.0186152.t004
Table 5. Multivariable predictors of SCD.
Risk markers Clinical Multivariable ECG Multivariable Combined Multivariable
HR (95% CI) β p HR (95% CI) β p HR (95% CI) β p
Male gender (xg = 1) 2.248 (1.050–4.814) 0.810 0.037 - - - 2.750 (1.276–5.927) 1.012 0.010
NYHA class III (xNYHA = 1) 2.221 (1.189–4.150) 0.798 0.012 - - - 2.499 (1.328–4.702) 0.916 0.005
LVEF�35% (xLVEF = 1) 2.165 (1.146–4.092) 0.772 0.017 - - - 1.997 (1.052–3.792) 0.692 0.035
ΔαTpe�0.028 (xDaSCDTpe¼ 1) - - - 2.365 (1.329–4.210) 0.861 0.003 2.550 (1.440–4.515) 0.936 0.001
ΔαQT�0.228 (xDaQT¼ 1) - - - N.S. N.S. N.S. N.S. N.S. N.S.
IAA�3.7μV (xIAA = 1) - - - 2.377 (1.339–4.221) 0.866 0.003 2.271 (1.278–4.035) 0.820 0.005
TS�2.5ms/RR (xTS = 1) - - - 2.180 (1.193–3.986) 0.780 0.011 N.S. N.S. N.S.
TMR�0.04 (xTMR = 1) - - - 2.193 (1.162–4.140) 0.785 0.015 2.883 (1.531–5.429) 1.059 0.001
HR = Hazard ratio; NYHA = New York Heart Association; LVEF = Left Ventricular Ejection Fraction; NSVT = Non-Sustained Ventricular Tachycardia;
VPB = Ventricular Premature Beat; IAA = Index of Average Alternans; TS = Turbulence Slope; TMR = T-wave Morphology Restitution; N.S. = Not
Significant, N.A. = Not Applicable.
https://doi.org/10.1371/journal.pone.0186152.t005
Clinical and ECG risk models for SCD and PFD prediction
PLOS ONE | https://doi.org/10.1371/journal.pone.0186152 October 11, 2017 7 / 15
(Fig 3(b) and 3(c)), therefore demonstrating specificity, on top of sensitivity, in the prediction
of the designated mode of death.
Analyses in reduced and preserved LVEF populations
The number of SCD victims was significantly higher in the HFrEF group than in the HFpEF
group (11% vs 5%, p = 0.010). In the HFrEF group, the number of PFD victims was also signif-
icantly higher than in the HFpEF group (13% vs 8%, p = 0.044).
Table 6. Multivariable predictors of PFD.
Risk markers Clinical multivariable ECG multivariable Combined multivariable
HR (95% CI) β p HR (95% CI) β p HR (95% CI) β p
Age [per 1 SD increment] N.S. N.S. N.S. - - - N.S. N.S. N.S.
Diabetes (xDiab = 1) 1.842 (1.112–3.049) 0.611 0.018 - - - 1.697 (1.022–2.818) 0.529 0.041
NYHA class III (xNYHA = 1) 2.305 (1.342–3.959) 0.835 0.002 - - - 1.972 (1.154–3.370) 0.679 0.013
Beta-blockers (xβ = 1) 1.859 (1.118–3.091) 0.620 0.017 - - - N.S. N.S. N.S.
LVEF�35% (xLVEF = 1) 1.768 (1.034–3.026) 0.570 0.037 - - - N.S. N.S. N.S.
RR range [per 1 SD increment] - - - 0.753 (0.566–1.000) -0.284 0.050 N.S. N.S. N.S.
CIA (xCIA = 1) - - - N.S. N.S. N.S. N.S. N.S. N.S.
ΔαTpe�0.022 (xDaPFDTpe¼ 1) - - - 2.174 (1.298–3.642) 0.777 0.003 2.219 (1.320–3.730) 0.797 0.003
TS�2.5ms/RR (xTS = 1) - - - 4.132 (2.165–7.884) 1.419 <0.001 4.160 (2.225–7.779) 1.425 <0.001
CIA = complex index of arrhythmia; HR = Hazard ratio; SD = Standard Deviation; NYHA = New York Heart Association; ARB: Angiotensin Receptor
Blocker; ACE: Angiotensin-Converting Enzyme; LVEF = Left Ventricular Ejection Fraction; TS = Turbulence Slope; N.S. = Not Significant; N.A. = Not
Applicable.
https://doi.org/10.1371/journal.pone.0186152.t006
Fig 1. ROC curves of the clinical, ECG and combined specific risk models for SCD and PFD classification. ROC curves and AUCs for the clinical
(solid blue), ECG (dashed red), and combined (dotted black) prediction models in the classification of SCD (a) and PFD (b) victims.
https://doi.org/10.1371/journal.pone.0186152.g001
Clinical and ECG risk models for SCD and PFD prediction
PLOS ONE | https://doi.org/10.1371/journal.pone.0186152 October 11, 2017 8 / 15

In the HFrEF group, SCD victims were less frequently under ARB or ACE inhibitors
(p = 0.027) and were associated with higher ΔαTpe (p = 0.008) and TMR (p = 0.001) but lower
TS (p = 0.025), while PFD victims were more frequently diabetic (p = 0.001), in NYHA class
III (p = 0.001) and showed lower RR range (p = 0.003), ΔαTpe (p = 0.005) and TS values
(p<0.001) but a higher rate of CIA (p = 0.030). Univariable Cox analyses showed that the only
clinical variable significantly associated with SCD in the HFrEF group was administration of
ARB or ACE inhibitors (S2 Table). Hence, the clinical model included just this single variable.
Univariable results for clinical and ECG variables for PFD prediction are shown in S3 Table.
The ECG variables that remained significantly associated with SCD in a multivariable Cox
analysis and were included in the ECG model were ΔαTpe�0.028, IAA�3.7μV, TS�2.5 ms/RR
and TMR�0.04 (S4 Table), as in the general population analysis. The AUC of the ECG model
was 0.72 (0.63–0.81), p<0.001. The combined model for SCD included the four above-men-
tioned ECG-derived variables and administration of ARB or ACE inhibitors (S4 Table) (AUC
of 0.73 (0.64–0.81), p<0.001). Based on multivariable Cox regression analysis for PFD in the
HFrEF group, the clinical model included diabetes, NYHA class III and administration of
ARB or ACE inhibitors (AUC of 0.69 (0.60–0.78), p<0.001), the ECG model included reduced
RR range, ΔαTpe�0.022 and TS�2.5 ms/RR (S5 Table) (AUC of 0.76 (0.68–0.83), p<0.001),
while the combined model included the three variables from the clinical model, ΔαTpe�0.022
and TS�2.5 ms/RR (S5 Table) (AUC of 0.79 (0.71–0.86), p<0.001).
When dividing the HFrEF group into three risk groups according to the models, SCD pre-
diction improved when clinical and ECG markers where integrated into the combined model.
However, the combined model for PFD showed lower predictive power than the ECG model.
Additionally, the combined model designed to predict SCD also predicted PFD and vice versa.
Fig 2. SCD and PFD probability curves of the clinical, ECG and combined specific risk models. Probability curves of the three risk groups, low (solid
blue), middle (dotted green) and high (dashed red) defined in the clinical (left), ECG (middle) and combined (right) specific risk models for SCD (top) and PFD
(bottom).
https://doi.org/10.1371/journal.pone.0186152.g002
Clinical and ECG risk models for SCD and PFD prediction
PLOS ONE | https://doi.org/10.1371/journal.pone.0186152 October 11, 2017 9 / 15

In the HFpEF group, SCD victims were associated with a higher rate of CIA (p = 0.024)
and higher values of ΔαQT (p = 0.028), while PFD victims were characterized by higher age
(p = 0.012) and lower values of TS (p = 0.005). Univariable Cox analyses showed that no clini-
cal variable was significantly associated with SCD or PFD (S2 and S3 Tables). Consequently,
no clinical models for either SCD or PFD were obtained in this population (S4 Table). The
multivariable ECG model for SCD consisted of the variable CIA and ΔαQT�0.228 (AUC of
0.72 (0.55–0.89), p = 0.008). The ECG model for PFD included only TS�2.5 ms/RR, as this
was the only variable significantly associated with PFD along follow-up. For SCD, no multivar-
iable combined model could be calculated. The multivariable combined model for PFD
included age and TS (S4 and S5 Tables) (AUC of 0.64 (0.51–0.78), p = 0.033).
When dividing the HFpEF group into three risk groups, the high SCD risk group in the
ECG-derived model was significantly associated with SCD (HAR 2.219 (1.217–4.045),
p = 0.009), with no significant association with PFD. Also, the high PFD risk group in the
Fig 3. SCD and PFD hazard ratios of the clinical, ECG and combined specific risk models. Hazard
ratios of SCD ((a) and (b)) and PFD ((c) and (d)) for the three risk groups, low (blue square), middle (green
circle) and high (red diamond) defined in the clinical, ECG and combined specific models. * and **indicate
p<0.05 and p<0.005 with respect to the low risk group, respectively.
https://doi.org/10.1371/journal.pone.0186152.g003
Clinical and ECG risk models for SCD and PFD prediction
PLOS ONE | https://doi.org/10.1371/journal.pone.0186152 October 11, 2017 10 / 15

combined model was significantly associated with PFD (HAR 2.578 (1.453–4.573), p = 0.001),
with no significant association with SCD.
Discussion
The main result of this study is that in mild-to-moderate CHF patients the combination of
clinical and ECG markers significantly improves prediction of both SCD and PFD, as com-
pared to the use of clinical variables only. This indicates a possible new strategy to identify
CHF patients specifically at risk of SCD or PFD.
In a combined model, the clinical variables that predicted SCD were male gender, NYHA
class III and LVEF�35%. Previous studies have also shown that men have higher SCD risk
than women [25, 26], while the contribution of NYHA class to SCD risk is still unclear [27,
28]. Impaired LVEF is at present the only risk factor considered for ICD implantation in high
SCD risk patients, but its specificity is insufficient [29].
Diabetes, NYHA class III, absence of treatment with beta-blockers and LVEF�35% pre-
dicted PFD in a multivariable clinical model. These results confirm previous findings reporting
the relation between end-stage CHF and low cardiac output and LVEF, diabetes due to
increased congestion as well as advanced stages of NYHA class [30]. Also, treatment with beta-
blockers or limiting neuro-hormonal activation has been shown to be especially important in
delaying CHF progression [31].
The ECG variables that independently predicted SCD in the ECG model were ΔαTpe, IAA,
TS and TMR. Our results confirm that SCD risk is associated with increased dispersion of
repolarization restitution [32, 33], increased variability of temporal dispersion of repolariza-
tion [34] and baroreceptor-heart rate reflex sensitivity [17, 35]. More importantly, our results
confirm the hypothesis that a combination of ECG markers capturing complementary infor-
mation about arrhythmic substrates could improve SCD prediction. Future studies could
include additional risk indices into the proposed models.
The ECG markers that independently predicted PFD in the ECG model were ΔαTpe, TS and
the range of RR. This indicates that PFD is also characterized by baroreceptor-heart rate reflex
sensitivity [17, 35]. However, lower values of ΔαTpe indicative of higher PFD risk suggest that
PFD victims experience a reduction in the ability of the ventricles to adapt to changes in heart
rate, as opposed to SCD victims [36].
The ECG models for SCD and PFD showed better prognostic value than the clinical mod-
els. The combination of clinical and ECG markers synergistically improved the prognostic
value for both SCD and PFD. For PFD prediction the improvement achieved by combining
clinical and ECG markers was only marginal with respect to the results of the ECG model.
This suggests that clinical variables do not add complementary information to ECG markers
for PFD risk prediction. More importantly, the ECG and combined risk models demonstrated
high sensitivity (association with the designated mode of death) and specificity (no association
with the alternative mode of death) for SCD and PFD prediction, while the clinical risk model
for SCD prediction lacked specificity and predicted PFD in addition to SCD.
Separately considering HFrEF and HFpEF subpopulations, the number of SCD and PFD
victims was significantly higher in the HFrEF group than in the HFpEF group, supporting pre-
vious studies [37]. A larger number of ECG-derived markers were predictive of SCD or PFD
in HFrEF patients as compared to HFpEF patients. Still, in this work we found that an ECG-
derived model including a higher rate of non-sustained ventricular arrhythmia and enhanced
spatio-temporal inhomogeneity of ventricular repolarization (higher ΔαQT) demonstrated spe-
cific SCD predictive value in the HFpEF group. These results support previous studies where
ECG-derived arrhythmic markers were found to be predictive of SCD in patients with
Clinical and ECG risk models for SCD and PFD prediction
PLOS ONE | https://doi.org/10.1371/journal.pone.0186152 October 11, 2017 11 / 15
preserved LVEF [38]. For PFD prediction, a multivariable combined model including age and
TS predicted PFD in this group, supporting previous results in the literature where autonomic
markers have shown capacity to predict PFD in patients with preserved LVEF [39, 40]. Overall,
our results in the HFrEF group were very similar to those in the general study population, with
the exception of the individual association of the clinical variables with SCD, since only admin-
istration of ARB or ACE inhibitors showed predictive value in the HFrEF group. In a com-
bined model including clinical variables and ECG-derived markers for PFD risk prediction,
the autonomic index TS was included as well when analyzing the HFrEF subpopulation, in
agreement with previous studies in the literature investigating mortality due to pump failure
in patients with reduced LVEF [41].
Limitations
Due to the low number of SCD and PFD victims, a division of the sample population into
training and test groups for validation of the results was not performed. Moreover, the pro-
posed risk scores were calculated in patients in sinus rhythm, which limits its applicability,
especially in patients with reduced LVEF, where the incidence of AF is significant. Further
studies may consider modifications of ECG markers to assess the proposed models in CHF
patients with other rhythms. The assessment of clinical and combined models integrating
additional variables deserves further investigation. The results obtained in this work are not
directly comparable with those of a previous publication reporting clinical scores on the
MUSIC study [13], because the sample population analyzed in the present paper is limited to
CHF patients in sinus rhythm. Also, since only a Holter ECG recording per patient was avail-
able, reproducibility was not studied in the present work. In addition, we found more SCD
and PFD victims with NYHA class III, as compared to NYHA class II, supporting previously
published results [42]. However, it should be noted that the evaluation of the relationship
between NYHA class and SCD or PFD was limited in this study since only CHF patients in
NYHA classes II and III were available in the population. Finally, the prognostic discriminative
power of the clinical models may be reduced because the clinical indices available for this
study did not include information about neuro-hormonal activation, natriuretic peptides, dia-
stolic function or peak oxygen consumption. The inclusion of these other indices may to some
extent impact the prediction of SCD and, most likely, PFD.
Conclusion
This study demonstrates that two risk prediction models combining clinical and ECG markers
of electrophysiological and autonomic abnormalities specifically predict SCD and PFD. For
SCD, the combination of clinical and ECG markers substantially improved risk prediction as
compared to the use of only clinical or ECG markers. For PFD, the use of only ECG markers
demonstrated its superiority over the use of clinical markers. The combination of clinical and
ECG variables only marginally improved the PFD predictive value of the ECG model.
Supporting information
S1 Appendix. Construction of the models.
(DOCX)
S2 Appendix. Final models.
(DOCX)
Clinical and ECG risk models for SCD and PFD prediction
PLOS ONE | https://doi.org/10.1371/journal.pone.0186152 October 11, 2017 12 / 15

S1 Table. Definition of the dichotomized variables used to build SCD and PFD risk mod-
els.
(DOCX)
S2 Table. Univariable predictors of SCD in both reduced and preserved LVEF populations.
(DOCX)
S3 Table. Univariable predictors of PFD in both reduced and preserved LVEF populations.
(DOCX)
S4 Table. Multivariable predictors of SCD in both reduced and preserved LVEF populations.
(DOCX)
S5 Table. Multivariable predictors of PFD in both reduced and preserved LVEF popula-
tions.
(DOCX)
S6 Table. Clinical and ECG data.
(XLSX)
Author Contributions
Conceptualization: Julia Ramırez, Michele Orini, Juan Pablo Martınez, Pablo Laguna, Esther
Pueyo.
Data curation: Julia Ramırez, Ana Minchole, Violeta Monasterio, Iwona Cygankiewicz.
Formal analysis: Julia Ramırez, Michele Orini, Juan Pablo Martınez, Pablo Laguna, Esther
Pueyo.
Funding acquisition: Juan Pablo Martınez, Pablo Laguna, Esther Pueyo.
Investigation: Julia Ramırez, Michele Orini, Juan Pablo Martınez, Pablo Laguna, Esther
Pueyo.
Methodology: Julia Ramırez, Michele Orini, Ana Minchole, Juan Pablo Martınez, Pablo
Laguna, Esther Pueyo.
Project administration: Julia Ramırez, Pablo Laguna, Esther Pueyo.
Resources: Julia Ramırez, Ana Minchole, Violeta Monasterio, Iwona Cygankiewicz, Antonio
Bayes de Luna.
Software: Julia Ramırez.
Supervision: Pablo Laguna, Esther Pueyo.
Validation: Julia Ramırez.
Visualization: Julia Ramırez.
Writing – original draft: Julia Ramırez.
Writing – review & editing: Julia Ramırez, Michele Orini, Ana Minchole, Violeta Monasterio,
Iwona Cygankiewicz, Juan Pablo Martınez, Pablo Laguna, Esther Pueyo.
References1. Zannad F, Garcia AA, Anker SD, Armstrong PW, Calvo G, Cleland JG, et al. Clinical outcome endpoints
in heart failure trials: a European Society of Cardiology Heart Failure Association consensus document.
Eur J Heart Fail 2013; 15:1082–1094. https://doi.org/10.1093/eurjhf/hft095 PMID: 23787718
Clinical and ECG risk models for SCD and PFD prediction
PLOS ONE | https://doi.org/10.1371/journal.pone.0186152 October 11, 2017 13 / 15

2. Mark DB, Nelson CL, Anstrom KJ, Al-Khatib SM, Tsiatis AA, Cowper PA, et al. Cost-effectiveness of
defibrillator therapy or amiodarone in chronic stable heart failure: results from the sudden cardiac death
in heart failure trial (SCD-heft). Circulation 2006; 114:135–42. https://doi.org/10.1161/
CIRCULATIONAHA.105.581884 PMID: 16818817
3. Neragi-Miandoab S. Non-transplant surgical therapy options of heart failure. Minerva Cardioangiol
2014; 62:481–96. PMID: 25420501
4. Figueroa MS, Peters JI. Congestive heart failure: diagnosis, pathophysiology, therapy, and implications
for respiratory care. Respir Care 2006; 51:403–412. PMID: 16563194
5. Rang HP. Pharmacology. In: Edinburgh: Churchill Livingstone; 2003:127. PMID: 14512698
6. Curtis BM, O’Keefe JH. Autonomic tone as a cardiovascular risk factor: The dangers of chronic fight or
flight. Mayo Clin Proc 2002; 77:45–54. https://doi.org/10.4065/77.1.45 PMID: 11794458
7. Fisher JP, Young CN, Fadel PJ. Central sympathetic overactivity: Maladies and mechanisms. Auton
Neurosci 2009; 148:5–15. https://doi.org/10.1016/j.autneu.2009.02.003 PMID: 19268634
8. Selvaraj RJ, Suszko AM, Subramanian A, Nanthakumar K, Chauhan VS. Adrenergic stimulation
increases repolarization dispersion and reduces activation-repolarization coupling along the RV endo-
cardium of patients with cardiomyopathy. Europace 2009; 11:1529–1535. https://doi.org/10.1093/
europace/eup295 PMID: 19815540
9. Qin M, Liu T, Hu H, Wang T, Yu S, Huang C. Effect of isoprenaline chronic stimulation on APD restitu-
tion and ventricular arrhythmogenesis. J Cardiol 2013; 61:162–168. https://doi.org/10.1016/j.jjcc.2012.
08.016 PMID: 23085034
10. Florea VG, Cohn JN. The autonomic nervous system and heart failure. Circ Res 2014; 114:1815–1826.
https://doi.org/10.1161/CIRCRESAHA.114.302589 PMID: 24855204
11. Ogletree-Hughes ML, Stull LB, Sweet WE, Smedira NG, McCarthy PM, Moravec CS. Mechanical
unloading restores beta-adrenergic responsiveness and reverses receptor downregulation in the failing
human heart. Circulation 2001; 104:881–886. PMID: 11514373
12. Mozaffarian D, Anker SD, Anand I, Linker DT, Sullivan MD, Cleland JGF, et al. Prediction of mode of
death in heart failure: the Seattle heart failure model. Circulation 2007; 116:392–398. https://doi.org/10.
1161/CIRCULATIONAHA.106.687103 PMID: 17620506
13. Vazquez R, Bayes-Genıs A, Cygankiewicz I, Pascual-Figal D, Grigorian-Shamagian L, Pavon R, et al.
The MUSIC Risk score: a simple method for predicting mortality in ambulatory patients with chronic
heart failure. European Heart Journal 2009; 30:1088–1096. https://doi.org/10.1093/eurheartj/ehp032
PMID: 19240065
14. Ky B, French B, Levy WC, Sweitzer NK, Fang JC, Wu AHB, et al. Multiple biomarkers for risk prediction
in chronic heart failure. Cir Heart Fail 2012; 5:183–190.
15. Viles-Gonzalez JF, Goldberger JJ. Population risk stratification for sudden cardiac death: Searching for
the needle in the haystack? Heart Rhythm 2017; 14:79–80. https://doi.org/10.1016/j.hrthm.2016.11.007
PMID: 27833008
16. Monasterio V, Laguna P, Cygankiewicz I, Vazquez R, Bayes-Genıs A, de Luna AB, et al. Average T-
wave alternans activity in ambulatory ECG records predicts sudden cardiac death in patients with
chronic heart failure. Heart Rhythm 2012; 9:383–9. https://doi.org/10.1016/j.hrthm.2011.10.027 PMID:
22024149
17. Cygankiewicz I, Zareba W, Vazquez R, Vallverdu M, Gonzalez-Juanatey JR and Valdes M. Heart rate
turbulence predicts all-cause mortality and sudden death in congestive heart failure patients. Heart
Rhythm 2008; 5 (8):1095–1102. https://doi.org/10.1016/j.hrthm.2008.04.017 PMID: 18675217
18. Ramırez J, Laguna P, de Luna AB, Malik M, Pueyo E. QT/RR and T-peak-to-end/RR curvatures and
slopes in chronic heart failure: Relation to sudden cardiac death. J Electrocardiol 2014; 47:842–848.
https://doi.org/10.1016/j.jelectrocard.2014.08.013 PMID: 25200899
19. Ramırez J, Monasterio V, Minchole A, Llamedo M, Lenis G, Cygankiewicz I, et al. Automatic SVM clas-
sification of sudden cardiac death and pump failure death from autonomic and repolarization ECG
markers. Journal of Electrocardiology 2015; 48:551–557. https://doi.org/10.1016/j.jelectrocard.2015.
04.002 PMID: 25912974
20. Ramırez J, Orini M, Tucker JD, Pueyo E, Laguna P. Variability of ventricular repolarization dispersion
quantified by time-warping the morphology of the T-waves. IEEE Transactions on Biomedical Engineer-
ing 2016; Forthcoming.
21. Ramırez J, Orini M, Minchole A, Monasterio V, Cygankiewicz I, De Luna AB, et al. T-wave morphology
restitution predicts sudden cardiac death in patients with chronic heart failure. J Am Heart Assoc 2017;
6(5):e005310. https://doi.org/10.1161/JAHA.116.005310 PMID: 28526702
22. Concato J, Feinstein AR, Holford TR. The risk of determining risk with multivariable models. Ann Intern
Med 1993; 118:201–210. PMID: 8417638
Clinical and ECG risk models for SCD and PFD prediction
PLOS ONE | https://doi.org/10.1371/journal.pone.0186152 October 11, 2017 14 / 15

23. Walter LC, Brand RJ, Counsell SR, Palmer RM, Landefeld CS, Fortinsky RH, et al. Development and
validation of a prognostic index for 1-year mortality in older adults after hospitalization. JAMA 2001;
285:2987–2994. PMID: 11410097
24. Carey EC, Covinsky KE, Lui LY, Eng C, Sands LP, Walter LC. Prediction of mortality in community-liv-
ing frail elderly people with long-term care needs. J Am Geriatr Soc 2008; 56:68–75. https://doi.org/10.
1111/j.1532-5415.2007.01496.x PMID: 18031487
25. Dahlberg ST. Gender difference in the risk factors for sudden cardiac death. Cardiology 1990; 77 Suppl
2:31–40.
26. Chugh SS, Reinier K, Teodorescu C, Evanado A, Kehr E, Al Samara M, et al. Epidemiology of sudden
cardiac death: clinical and research implications. Prog Cardiovasc Dis 2008; 51:213–228. https://doi.
org/10.1016/j.pcad.2008.06.003 PMID: 19026856
27. Zipes DP, Wellens HJJ. Sudden cardiac death. Circulation 1998; 98:2334–2351. PMID: 9826323
28. Lane RE, Cowie MR, Chow AWC. Prediction and prevention of sudden cardiac death in heart failure.
Heart 2005; 91:674–680. https://doi.org/10.1136/hrt.2003.025254 PMID: 15831662
29. Buxton AE. Not everyone with an ejection fraction <30% should receive an implantable cardioverter-
defibrillator. Circulation 2005; 111:2537–2549.
30. Mosterd A, Hoes AW. Clinical epidemiology of heart failure. Heart 2007; 93:1137–1146. https://doi.org/
10.1136/hrt.2003.025270 PMID: 17699180
31. Klapholz M. Beta-blocker use for the stages of heart failure. Mayo Clin Proc 2009; 84:718–729. https://
doi.org/10.4065/84.8.718 PMID: 19648389
32. Pak H, Hong SJ, Hwang GS, Lee HS, Park S, Ahn JC, et al. Spatial dispersion of action potential dura-
tion restitution kinetics is associated with induction of ventricular tachycardia/fibrillation in humans. Jour-
nal of Cardiovascular Electrophysiology 2004; 15:1357–1363. https://doi.org/10.1046/j.1540-8167.
2004.03569.x PMID: 15610278
33. Nash MP, Bradley CP, Sutton PM, Clayton RH, Kallis P, Hayward MP, et al. Whole heart action poten-
tial duration restitution properties in cardiac patients: a combined clinical and modelling study. Experi-
mental Physiology 2006; 91:339–354. https://doi.org/10.1113/expphysiol.2005.031070 PMID:
16452121
34. Verrier RL, Kumar K, Nearing BD. Basis for sudden cardiac death prediction by T-wave alternans from
an integrative physiology perspective. Heart Rhythm 2009; 6:416–422. https://doi.org/10.1016/j.hrthm.
2008.11.019 PMID: 19251221
35. La Rovere MT, Maestri R, Pinna GD, Sleight P, Febo O. Clinical and haemodynamic correlates of heart
rate turbulence as a non-invasive index of baroreflex sensitivity in chronic heart failure. Clin Sci (Lond)
2011; 121:279–284.
36. Glukhov AV, Fedorov VV, Lou Q, Ravikumar VK, Kalish PW, Schuessler RB, et al. Transmural disper-
sion of repolarization in failing and nonfailing human ventricle. Circ Res 2010; 106:981–991. https://doi.
org/10.1161/CIRCRESAHA.109.204891 PMID: 20093630
37. Dunlay SM, Roger VL and Redfield MM. Epidemiology of heart failure with preserved ejection fraction.
Nat Rev Cardiol 2017; In press.
38. Ikeda T, Yoshino H, Sugi K, Tanno K, Shimizu H, Watanabe J, et al. Predictive value of microvolt T-
wave alternans for sudden cardiac death in patients with preserved cardiac function after acute myocar-
dial infarction. J Am Coll Cardiol 2006; 48:2268–2274. https://doi.org/10.1016/j.jacc.2006.06.075
PMID: 17161258
39. Bauer A, Barthel P, Schneider R, Ulm K, Muller A, Joeinig A, et al. Improved stratification of autonomic
regulation for risk prediction in post-infarction patients with preserved left ventricular function (ISAR-
Risk). Eur Heart J 2009; 30(5):576–583. https://doi.org/10.1093/eurheartj/ehn540 PMID: 19109245
40. Bauer A, Barthel P, Muller A, Ulm K, Huikuri H, Malik M, et al. Risk prediction by heart rate turbulence
and deceleration capacity in postinfarction patients with preserved left ventricular function retrospective
analysis of 4 independent trials. J Electrocardiol 2009; 42(6): 597–601. https://doi.org/10.1016/j.
jelectrocard.2009.07.013 PMID: 19853731
41. Marynissen T, Flore V, Heidbuchel H, Nuyens D, Ector J and Willems R. Heart rate turbulence predicts
ICD-resistant mortality in ischaemic heart disease. Europace 2014; 16:1069–1077. https://doi.org/10.
1093/europace/eut303 PMID: 24196450
42. Deo R and Albert CM. Epidemiology and genetics of sudden cardiac death. Circulation 2012; 125:620–
637. https://doi.org/10.1161/CIRCULATIONAHA.111.023838 PMID: 22294707
Clinical and ECG risk models for SCD and PFD prediction
PLOS ONE | https://doi.org/10.1371/journal.pone.0186152 October 11, 2017 15 / 15