suggested citation delaware vital statistics annual report, 2010 delaware department ...€¦ ·...
TRANSCRIPT

Suggested Citation:Delaware Health Statistics Center. Delaware Vital Statistics Annual Report, 2010.
Delaware Department of Health and Social Services, Division of Public Health: 2013.

Intentionally left blank

INFANT MORTALITY
Between 2005-2009 and 2006-2010, Delaware’s infant mortality rate (IMR) decreased to 8.0 infant deaths per 1,000 live births, resulting in a total decline of 13.7 percent from its 2000-2004 peak of 9.3 infant deaths per 1,000 live births. At 6.5, the U.S. rate remained significantly lower than the Delaware rate.
Though IMRs for each of the three counties decreased in 2006-2010, Wilmington’s IMR increased for the second straight year. The combination of Wilmington’s high IMR and a higher IMR in the balance of New Castle County, resulted in New Castle County’s IMR being higher than the IMRs of both Sussex and Kent Counties. In 2006-2010, the balance of New Castle County’s IMR was 7.7, Wilmington’s IMR was 14.1, Kent County’s IMR was 6.5, and Sussex County’s IMR was 7.
Delaware Vital Statistics Annual Report, 2010 111 Delaware Health Statistics Center

INFANT MORTALITY
Black infants experienced significantly higher mortality rates than white infants, and from 1990-1994 to 2006-2010, black IMRs were anywhere from 2.2 to 2.8 times that of white IMRs.
Significant disparities existed between black non-Hispanics and each of the two other groups, white non-Hispanics and Hispanics. Black non-Hispanics had the highest IMRs in all three time periods, and their rate of 14.1 in 2006-2010 was more than double the white non-Hispanic rate of 5.4 and nearly twice the Hispanic rate of 7.4 infant deaths per 1,000 live births.
Delaware Vital Statistics Annual Report, 2010 112 Delaware Health Statistics Center

INFANT MORTALITY
In 2006-2010, New Castle County had the highest IMRs and Kent County had the lowest. Black IMRs in New Castle County have hovered around 16 since 2002-2006, and in 2006-2010 the black IMR was 15.8 infant deaths per 1,000 live births. White IMRs decreased for the third straight year to 6.1 in 2006-2010. Black IMRs in Kent County peaked at 17 in 2001-2005; the recent drop in 2006-2010 resulted in a 40 percent reduction in black IMRs between 2001-2005 and 2006-2010. Despite increasing from their 2005-2009 rate, the white IMR in Kent County was 34 percent lower in 2006-2010 than in 2001-2005. Sussex County’s black IMR dropped to 12.6 in 2006-2010, its lowest rate since 1996-2000, and a 34 percent reduction from the 2001-2005 peak of 19. Sussex County’s white IMR has fluctuated between 5 and 6 since 1999-2003, and in 2006-2010 the rate moved up to 5.4 infant deaths per 1,000 births.
Source: Delaware Health Statistics Center
Delaware Vital Statistics Annual Report, 2010 113 Delaware Health Statistics Center

INFANT MORTALITY- Leading Causes of Death
In 2006-2010 the five leading causes of infant death were:
▪ Disorders related to short gestation and fetal malnutrition (prematurity and low birthweight), which
accounted for 22.6 percent of infant deaths.
▪ Congenital anomalies (birth defects), which accounted for 14.9 percent of infant deaths.
▪ Sudden infant death syndrome (SIDS), which accounted for 10.4 percent.
▪ Newborn affected by maternal complications of pregnancy, which accounted for 8.9 percent of infant
deaths. Of the 42 deaths attributed to this cause, 41 were due to the newborn being affected by incompetent cervix and premature rupture of membranes.
▪ Newborn affected by complications of placenta, cord, and membranes (4.9 percent).
In sum, the five most common causes of infant death accounted for 61.7 percent, or 290 of the 470 total infant deaths.
The most frequent causes of death by race are shown in the graphs below and on the following page. SIDS and disorders related to short gestation and low birthweight were listed in the top three most frequent causes of death for both black and white infants. Though the proportions of deaths by race were similar for many of the causes of death, notable exceptions were birth defects, disorders due to prematurity and low birthweight, and SIDS. While birth defects were responsible for 21 percent of all white infant deaths, they accounted for only 7.6 percent of black infant deaths. Conversely, infant deaths due to disorders related to prematurity and low birthweight and SIDS accounted for larger percentages of black infant deaths than white infant deaths (29 versus 16 percent for prematurity and low birthweight, and 12.5 versus 8.8 percent for SIDS).
-
5
10
15
20
25
30
35
Prematurity and low
birthweight
SIDS Maternal complications
Birth defects Cord complications
Respiratory distress
Accidents Bacterial sepsis
Pe
rce
nt o
f in
fan
t d
ea
ths
Most Frequent Causes of Black Infant DeathDelaware, 2006-2010
Source: Delaware Health Statistics Center
Delaware Vital Statistics Annual Report, 2010 114 Delaware Health Statistics Center

INFANT MORTALITY- Leading Causes of Death
In 1989-1993, Hispanics accounted for 3.6 percent of all live births and 3.4 percent of infant deaths; since that time the proportion of births to Hispanic mothers has quadrupled. In the most recent five-year period, 2006-2010, 14.9 percent of all live births were to Hispanic mothers, and 13.8 percent of all infant deaths were of Hispanic origin. Two causes of death accounted for the greatest number of Hispanic infant deaths: birth defects and disorders related to prematurity and low birthweight.
Delaware Vital Statistics Annual Report, 2010 115 Delaware Health Statistics Center

INFANT MORTALITY - Leading Causes of Death
▪ Prematurity and low birthweight accounted for the greatest number of infant deaths in 2006-2010; all but two of
these deaths occurred in the neonatal period.
▪ Sudden infant death syndrome (SIDS) was the only one of the top five causes of death that had the majority of
deaths occurring in the postneonatal period, with a mean age at death of 103 days. Though fewer infants died in 2006-2010 compared to 2005-2009, more infants died due to SIDS, moving it up to the third leading cause of infant death in 2006-2010.
37 percent (18 out of 49) of the SIDS deaths were associated with co-sleeping and/or sleeping on soft surfaces, such as couches and adult beds.
▪ During that same time period there were 22 additional infant deaths, coded under a different cause of death,
that were associated with co-sleeping and/or sleeping on a soft surface. In total, 8.5 percent of all infant deaths in 2006-2010 were associated with co-sleeping and/or unsafe sleep practices.
Approximately 92 percent of all infant deaths occurred within the first six months of life, 70 percent of all infant deaths occurred within the first 28 days of life, and 42 percent occurred within 24 hours of birth. The graph below displays deaths by specific cause and the infant’s age classification at death: neonatal (<28 days), or postneonatal (28-364 days).
0 20 40 60 80 100 120
Disorders related to prematurity and low birthweight
Birth defects
SIDS
Maternal complications
Cord complications
Respiratory distress of newborn
Diseases of the circulatory system
Accidents (unintentional injuries)
Atelectasis
Bacterial sepsis of newborn
Intrauterine hypoxia and birth asphyxia
Neonatal hemorrhage
Septicemia
Complications of labor and delivery
Necrotizing enterocolitis of newborn
Diarrhea and gastroenteritis of infectious origin
Gastrointestinal complications
Renal failure and other disorders of kidney
Interstitial emphysema and related conditions
Assault (homicide)
Number of deaths
Most Frequent Causes of Infant Death Delaware, 2006-2010
<28 days
28-364 days
Source: Delaware Health Statistics Center
Delaware Vital Statistics Annual Report, 2010 116 Delaware Health Statistics Center

INFANT MORTALITY - Live Birth Cohort
Though only 1 percent of all live births in 2005-2009 were infants weighing less than 1000 grams, they accounted for over half (59 percent) of all infant deaths. In total, 9 percent of all live births in 2005-2009 were infants of low birthweight (under 2500 grams) and 78 percent of infant deaths were low birthweight.
Gestation and infant death demonstrated the same relationship as birthweight and infant death; infants born at the youngest gestational age made up a very small percentage of live births, yet they accounted for the majority of infant deaths.
One percent of live births in 2005-2009 were less than 28 weeks gestation at birth, but they accounted for 59 percent of all infant deaths. In total, 14 percent of all live births in 2005-2009 were born preterm (<37 weeks of gestation) and 78 percent of infant deaths were born preterm.
Distribution by Birthweight, Delaware Live Birth Cohort, 2005-2009
Distribution by Gestation, Delaware Live Birth Cohort, 2005-2009
Source: Delaware Health Statistics Center
Source: Delaware Health Statistics Center
Delaware Vital Statistics Annual Report, 2010 117 Delaware Health Statistics Center

INFANT MORTALITY - Live Birth Cohort
Birthweight and gestation are considered to be the most important predictors of infant health and mortality risk. Infants born too small or too early have a much greater risk of mortality than those who reach a normal birthweight (2500+ grams) or full-term gestation (37+ weeks). The IMR for very low birthweight (VLBW) black infants increased for the second year, while the IMR for VLBW white infants decreased for the fourth straight year. In 2005-2009, IMRs for white and black VLBW infants were 262 and 299 infant deaths per 1,000 live births. IMRs for moderately LBW infants of all races rose nearly 10 percent between 2000-2004 and 2005-2009; during that time, black IMRs increased 17 percent to 17.5, and white IMRs increased 6 percent to 13.9 infant deaths per 1,000 live births. IMRs for normal birthweight infants have been trending down since 2000-2004. During that time, white IMRs decreased 21 percent and black IMRs decreased 29 percent. In 2005-2009, the black IMR for normal birthweight infants was 2.8, versus 1.7 for white infant of normal birthweight.
Five-year Average Infant Mortality Rate by Birthweight and Race Delaware, 1990-2009 Live Birth Cohort
0
5
10
15
20
90-94
91-95
92-96
93-97
94-98
95-99
96-00
97-01
98-02
99-03
00-04
01-05
02-06
03-07
04-08
05-09
De
ath
s p
er
1,0
00
liv
e b
irth
s
Moderately low birthweight (1500-2499 grams)
200
220
240
260
280
300
320
340
360
380
90-94
91-95
92-96
93-97
94-98
95-99
96-00
97-01
98-02
99-03
00-04
01-05
02-06
03-07
04-08
05-09
De
ath
s p
er
1,0
00
liv
e b
irh
ts
Very low birthweight (<1500 grams)
0
1
2
3
4
5
90-94
91-95
92-96
93-97
94-98
95-99
96-00
97-01
98-02
99-03
00-04
01-05
02-06
03-07
04-08
05-09
De
ath
s p
er
1,0
00
liv
e b
irth
s
All Races White Black
Normal birthweight (2500+ grams)
Source: Delaware Health Statistics Center
Delaware Vital Statistics Annual Report, 2010 118 Delaware Health Statistics Center

INFANT MORTALITY - Live Birth Cohort
From 1992-1996 to 1997-2001, IMRs for plural births increased 77 percent, to 53.1 deaths per 1000 live births; during the same time, IMRs for singleton births increased by 4 percent. Since then, plural IMRs have decreased 23 percent, with the majority of the decrease occurring in the most recent time period. IMRs for singleton births experienced a slight decrease of 4 percent. In 2005-2009, the infant mortality rate for plural births was 5.9 times that of singleton births (41 versus 7).
The magnitude of difference between singleton and plural IMRs remained the same regardless of race, though rates for black infants, both singleton and plural, were more than double those of white infants.
Delaware Vital Statistics Annual Report, 2010 119 Delaware Health Statistics Center

Intentionally left blank
Delaware Vital Statistics Annual Report, 2010 120 Delaware Health Statistics Center

Area/Race 1993 1994 1995 1996 1997 1998 1999 2000 2001 2002 2003 2004 2005 2006 2007 2008 2009 2010
U.S. All Races 33466 31710 29583 28237 28045 28371 27937 28035 27568 28034 28025 27936 28440 28527 29138 28059 26412 24548* White 21497 20504 19490 18749 18539 18561 18067 18144 17955 18369 18440 18231 18514 18403 18807 18164 16817 15933* Black 10887 10072 9118 8490 8496 8726 8822 8771 8498 8524 8402 8494 8695 8858 8944 8543 8312 7388* Other 1082 1134 975 998 1010 1084 1048 1120 1115 1141 1183 1211 1231 1266 1387 1352 1283 1227*
Delaware All Races 94 70 79 77 81 103 81 102 114 96 107 97 106 99 91 101 91 88 White 44 40 46 43 42 54 31 65 60 57 53 51 48 50 52 49 30 47 Black 50 27 32 32 36 49 49 37 53 35 53 44 55 44 38 52 54 36 Other 0 3 1 2 3 0 1 0 1 4 1 2 3 5 1 0 7 5
Kent All Races 11 15 18 17 14 18 10 21 19 27 16 17 21 13 9 18 18 15 White 5 10 10 11 4 13 4 16 10 22 8 8 6 7 4 10 6 12 Black 6 5 7 6 10 5 6 5 9 5 8 8 14 5 4 8 12 3 Other 0 0 1 0 0 0 0 0 0 0 0 1 1 1 1 0 0 0
New Castle All Races 68 37 45 48 48 65 61 67 72 55 78 60 68 68 60 70 57 58 White 32 20 24 21 26 27 22 40 37 30 37 33 35 31 33 32 18 24 Black 36 15 21 26 20 38 38 27 35 22 40 27 31 35 27 38 34 30 Other 0 2 0 1 2 0 1 0 0 3 1 0 2 2 0 0 5 4
Wilmington All Races 24 15 11 19 14 18 20 16 17 12 18 12 18 16 17 19 18 18 White 4 3 2 1 4 2 4 4 2 2 4 4 3 2 3 7 0 4 Black 20 11 9 18 10 16 16 12 15 10 14 8 15 14 14 12 16 13 Other 0 1 0 0 0 0 0 0 0 0 0 0 0 0 0 0 2 1
Balance of NC County All Races 44 22 34 29 34 47 41 51 55 43 60 48 50 52 43 51 39 40 White 28 17 22 20 22 25 18 36 35 28 33 29 32 29 30 25 18 20 Black 16 4 12 8 10 22 22 15 20 12 26 19 16 21 13 26 18 17 Other 0 1 0 1 2 0 1 0 0 3 1 0 2 2 0 0 3 3
Sussex All Races 15 18 16 12 19 20 10 14 23 14 13 20 17 18 22 13 16 15 White 7 10 12 11 12 14 5 9 13 5 8 10 7 12 15 7 6 11 Black 8 7 4 0 6 6 5 5 9 8 5 9 10 4 7 6 8 3 Other 0 1 0 1 1 0 0 0 1 1 0 1 0 2 0 0 2 1
TABLE E-1NUMBER OF INFANT DEATHS BY RACE
U.S., DELAWARE, COUNTIES AND CITY OF WILMINGTON, 1993-2010
Notes: 1. *Based on NCHS estimate. 2. Infant deaths refer to deaths to children under one year of age. Sources: National Center for Health Statistics Delaware Health Statistics Center
INFANT1
Delaware Vital Statistics Annual Report, 2010 121 Delaware Health Statistics Center

Area/Race 1993 1994 1995 1996 1997 1998 1999 2000 2001 2002 2003 2004 2005 2006 2007 2008 2009 2010
U.S. All Races 21174 20250 19155 18326 18524 18918 18728 18776 18265 18749 18893 18593 18770 18989 19058 18211 17255 16167* White 13506 13100 12644 12252 12269 12406 12164 12201 12013 12354 12495 12238 12239 12302 12333 11843 11054 10603* Black 7044 6499 5940 5483 5637 5824 5920 5843 5585 5646 5640 5495 5740 5876 5842 5523 5374 4760* Other 624 651 571 591 618 688 644 732 667 749 758 860 791 811 883 845 827 804*
Delaware All Races 69 48 47 53 55 74 58 71 82 79 75 63 79 72 65 68 66 58 White 33 28 26 28 26 33 21 45 44 48 36 33 36 36 37 32 19 27 Black 36 18 20 24 27 41 37 26 37 28 38 28 40 33 28 36 40 26 Other 0 2 1 1 2 0 0 0 1 3 1 2 3 3 0 0 7 5
Kent All Races 6 7 10 13 10 9 8 15 15 22 8 11 14 7 6 12 14 11 White 2 3 6 7 1 6 3 11 10 18 3 5 3 4 3 7 4 9 Black 4 4 3 6 9 3 5 4 5 4 5 5 10 3 3 5 10 2 Other 0 0 1 0 0 0 0 0 0 0 0 1 1 0 0 0 0 0
New Castle All Races 56 28 26 33 33 47 44 50 54 47 56 39 54 52 43 48 42 36 White 27 17 12 14 19 15 14 29 27 26 27 21 28 22 23 20 13 9 Black 29 9 14 18 13 32 30 21 27 19 28 18 24 28 20 28 24 23 Other 0 2 0 1 1 0 0 0 0 2 1 0 2 2 0 0 5 4
Wilmington All Races 17 10 6 14 6 12 14 13 14 9 10 9 15 12 10 10 14 10 White 2 3 0 1 3 1 2 4 1 1 1 3 3 1 1 3 0 0 Black 15 6 6 13 3 11 12 9 13 8 9 6 12 11 9 7 12 9 Other 0 1 0 0 0 0 0 0 0 0 0 0 0 0 0 0 2 1
Balance of NC County All Races 39 18 20 19 27 35 30 37 40 38 46 30 39 40 33 38 28 26 White 25 14 12 13 16 14 12 25 26 25 26 18 25 21 22 17 13 9 Black 14 3 8 5 10 21 18 12 14 11 19 12 12 17 11 21 12 14 Other 0 1 0 1 1 0 0 0 0 2 1 0 2 2 0 0 3 3
Sussex All Races 7 13 11 7 12 18 6 6 13 10 11 13 11 13 16 8 10 11 White 4 8 8 7 6 12 4 5 7 4 6 7 5 10 11 5 2 9 Black 3 5 3 0 5 6 2 1 5 5 5 5 6 2 5 3 6 1 Other 0 0 0 0 1 0 0 0 1 1 0 1 0 1 0 0 2 1
TABLE E-2NUMBER OF NEONATAL DEATHS BY RACE
U.S., DELAWARE, COUNTIES AND CITY OF WILMINGTON, 1993-2010
Notes: 1. *Based on NCHS estimate. 2. Neonatal deaths refer to deaths of children under 28 days of age. Sources: National Center for Health Statistics
INFANT2
Delaware Vital Statistics Annual Report, 2010 122 Delaware Health Statistics Center

Area/Race 1993 1994 1995 1996 1997 1998 1999 2000 2001 2002 2003 2004 2005 2006 2007 2008 2009 2010
U.S. All Races 12292 11460 10428 9911 9521 9453 9209 9259 9303 9285 9132 9343 9670 9538 10080 9848 9157 8381* White 7991 7404 6846 6497 6270 6155 5903 5943 5942 6015 5945 5993 6275 6101 6474 6321 5763 5330* Black 3843 3573 3178 3007 2859 2902 2902 2928 2913 2878 2762 2999 2955 2982 3102 3020 2938 2628* Other 458 483 404 407 392 396 404 388 448 392 425 351 440 455 504 507 456 423*
Delaware All Races 25 22 32 24 26 29 23 31 32 17 32 34 27 27 26 33 25 30 White 11 12 20 15 16 21 10 20 16 9 17 18 12 14 15 17 11 20 Black 14 9 12 8 9 8 12 11 16 7 15 16 15 11 10 16 14 10 Other 0 1 0 1 1 0 1 0 0 1 0 0 0 2 1 0 0 0
Kent All Races 5 8 8 4 4 9 2 6 4 5 8 6 7 6 3 6 4 4 White 3 7 4 4 3 7 1 5 0 4 5 3 3 3 1 3 2 3 Black 2 1 4 0 1 2 1 1 4 1 3 3 4 2 1 3 2 1 Other 0 0 0 0 0 0 0 0 0 0 0 0 0 1 1 0 0 0
New Castle All Races 12 9 19 15 15 18 17 17 18 8 22 21 14 16 17 22 15 22 White 5 3 12 7 7 12 8 11 10 4 10 12 7 9 10 12 5 15 Black 7 6 7 8 7 6 8 6 8 3 12 9 7 7 7 10 10 7 Other 0 0 0 0 1 0 1 0 0 1 0 0 0 0 0 0 0 0
Wilmington All Races 7 5 5 5 8 6 6 3 3 3 8 3 3 4 7 9 4 8 White 2 0 2 0 1 1 2 0 1 1 3 1 0 1 2 4 0 4 Black 5 5 3 5 7 5 4 3 2 2 5 2 3 3 5 5 4 4 Other 0 0 0 0 0 0 0 0 0 0 0 0 0 0 0 0 0 0
Balance of NC County All Races 5 4 14 10 7 12 11 14 15 5 14 18 11 12 10 13 11 14 White 3 3 10 7 6 11 6 11 9 3 7 11 7 8 8 8 5 11 Black 2 1 4 3 0 1 4 3 6 1 7 7 4 4 2 5 6 3 Other 0 0 0 0 1 0 1 0 0 1 0 0 0 0 0 0 0 0
Sussex All Races 8 5 5 5 7 2 4 8 10 4 2 7 6 5 6 5 6 4 White 3 2 4 4 6 2 1 4 6 1 2 3 2 2 4 2 4 2 Black 5 2 1 0 1 0 3 4 4 3 0 4 4 2 2 3 2 2 Other 0 1 0 1 0 0 0 0 0 0 0 0 0 1 0 0 0 0
TABLE E-3NUMBER OF POSTNEONATAL DEATHS BY RACE
U.S., DELAWARE, COUNTIES AND CITY OF WILMINGTON, 1993-2010
Notes: 1. *Based on NCHS estimate. 2. Postneonatal deaths refer to deaths of children 28 to 364 days of age. Sources: National Center for Health Statistics Delaware Health Statistics Center
INFANT3
Delaware Vital Statistics Annual Report, 2010 123 Delaware Health Statistics Center

Area/ 1990 1991 1992 1993 1994 1995 1996 1997 1998 1999 2000 2001 2002 2003 2004 2005 2006Race -1994 -1995 -1996 -1997 -1998 -1999 -2000 -2001 -2002 -2003 -2004 -2005 -2006 -2007 -2008 -2009 -2010
U.S. All Races 8.6 8.3 8.0 7.7 7.5 7.3 7.1 7.0 7.0 6.9 6.9 6.9 6.8 6.8 6.7 6.7 6.5 White 7.0 6.8 6.5 6.4 6.2 6.0 5.9 5.8 5.8 5.7 5.7 5.7 5.7 5.7 5.6 5.6 5.5 Black 17.0 16.4 15.8 15.3 14.8 14.6 14.4 14.2 14.3 14.2 14.0 14.0 13.8 13.6 13.3 13.1 12.7
Delaware All Races 9.3 8.9 7.9 7.8 7.9 8.1+ 8.4+ 9.0+ 9.2+ 9.1+ 9.3+ 9.3+ 8.8+ 8.6+ 8.4+ 8.3+ 8.0+ White 6.6 6.4 5.6- 5.6 5.9 5.7 6.2 6.6 6.9+ 6.9+ 7.3+ 6.9+ 6.5+ 6.4 6.2 5.7 5.8 Black 18.2 17.0 15.8 14.7 14.4 15.8 15.9 17.1+ 16.7+ 16.7+ 16.1 17.1+ 16.1+ 15.7+ 15.3 15.6+ 14.2
Kent All Races 9.5 8.6 8.6 8.2 9.0 8.4 8.6 8.7 9.9 9.5 10.2 10.0 9.1 7.1 7.1 7.1 6.5 White 7.3 6.5 6.8 5.8 7.1 6.3 7.0 6.9 9.5 8.6 9.2 7.6 7.0 4.4 4.6 4.3 5.1 Black 17.6 15.5 15.2 16.6 15.9 15.7 14.3 15.2 12.7 13.4 13.9 17.0 14.9 13.6 13.2 14.0 10.2
New Castle All Races 9.5 9.0 7.8 7.3 7.3 7.9 8.5 9.1 9.2 9.5 9.4 9.4 9.2 9.2 9.0 9.0 8.8 White 6.5 6.3 5.0 4.9 4.8 4.9 5.6 6.2 6.4 6.8 7.3 7.1 6.8 7.0 6.9 6.4 6.1 Black 19.8 18.3 17.5 15.3 15.1 17.4 17.7 18.2 18.0 18.0 16.5 16.7 16.3 16.3 15.7 16.1 15.8
Wilmington All Races 18.0 16.6 15.2 13.6 12.8 13.7 14.4 14.0 13.5 13.5 12.4 12.8 12.3 13.0 13.0 13.8 14.1 White 9.7 10.1 --- --- --- --- --- --- --- --- --- --- --- --- --- --- --- Black 22.7 20.4 20.5 17.8 16.8 18.0 18.7 18.0 17.9 17.6 15.9 17.0 16.3 17.3 16.3 18.0 18.0
Balance of NC County All Races 7.5 7.2 6.1 5.9 6.0 6.7 7.2 8.1 8.3 8.6 8.8 8.7 8.5 8.5 8.2 8.0 7.7 White 6.2 5.9 4.8 4.8 4.7 4.8 5.4 6.1 6.4 6.8 7.3 7.2 6.9 7.0 6.8 6.4 6.0 Black 16.3 16.0 14.4 12.9 13.6 16.8 16.8 18.5 18.1 18.2 17.0 16.6 16.3 15.8 15.3 14.9 14.5
Sussex All Races 8.3 8.7 7.9 9.0 9.5 8.5 8.1 9.0 8.3 7.4 8.1 8.2 7.5 7.9 7.6 7.2 7.0 White 6.2 6.8 6.8 8.0 8.9 8.0 7.5 7.6 6.5 5.5 5.9 5.5 5.1 6.2 5.7 5.2 5.6 Black 13.7 13.8 10.4 11.1 10.4 9.9 10.4 14.4 15.9 15.4 16.9 19.0 16.9 15.7 16.0 15.6 12.6
TABLE E- 4FIVE-YEAR AVERAGE INFANT MORTALITY RATES BY RACE
U.S., DELAWARE, COUNTIES AND CITY OF WILMINGTON, 1990-2010
Notes: 1. 2006-2010 U.S. data are based on NCHS estimates. 2. Infant mortality rates represent the number of deaths of children under one year of age per 1000 live births. 3. '+' indicates that the Delaware rate is significantly higher than the U.S. rate. '-' indicates that the Delaware rate is significantly lower than the U.S. rate. 4. "---" Indicates rate does not meet standard of reliability or precision; based on fewer than 20 deaths in the numerator. 5. No statistical comparisons were made between the county rates and the U.S. rate due to small numbers. See Appendix C for details. Sources: National Center for Health Statistics Delaware Health Statistics Center
INFANT4
Delaware Vital Statistics Annual Report, 2010 124 Delaware Health Statistics Center

0
2
4
6
8
10
12
14
16
18
20
90-94 91-95 92-96 93-97 94-98 95-99 96-00 97-01 98-02 99-03 00-04 01-05 02-06 03-07 04-08 05-09 06-10
Dea
ths
per 1
,000
Liv
e B
irths
Five-Year Intervals
Figure E-1 Five-Year Average Infant Mortality Rates by Race
Delaware, 1990-2010
All Races
White
Black
Source: Delaware Health Statistics Center
Delaware Vital Statistics Annual Report, 2010 125 Delaware Health Statistics Center

12.6
18.0
15.8
10.2
14.2
5.6
6.1
5.1
5.8
7.0
14.1
8.8
6.5
8.0
0 2 4 6 8 10 12 14 16 18 20
Sussex
Wilmington
New Castle
Kent
DE
Deaths per 1,000 Live Births
Figure E-2 Five-Year Average Infant Mortality Rates by Race
Delaware, Counties and the City of Wilmington, 2006-2010
All Races
White
Black
Source: Delaware Health Statistics Center
Delaware Vital Statistics Annual Report, 2010 126 Delaware Health Statistics Center

Area/ 1990 1991 1992 1993 1994 1995 1996 1997 1998 1999 2000 2001 2002 2003 2004 2005 2006Race -1994 -1995 -1996 -1997 -1998 -1999 -2000 -2001 -2002 -2003 -2004 -2005 -2006 -2007 -2008 -2009 -2010
U.S. All Races 5.4 5.3 5.1 5.0 4.9 4.8 4.7 4.7 4.7 4.6 4.6 4.6 4.6 4.5 4.4 4.4 4.3 White 4.4 4.3 4.2 4.1 4.0 4.0 3.9 3.9 3.9 3.9 3.8 3.8 3.8 3.8 3.7 3.7 3.6 Black 10.9 10.6 10.2 9.9 9.7 9.6 9.5 9.5 9.5 9.5 9.3 9.2 9.1 9.0 8.7 8.6 8.3
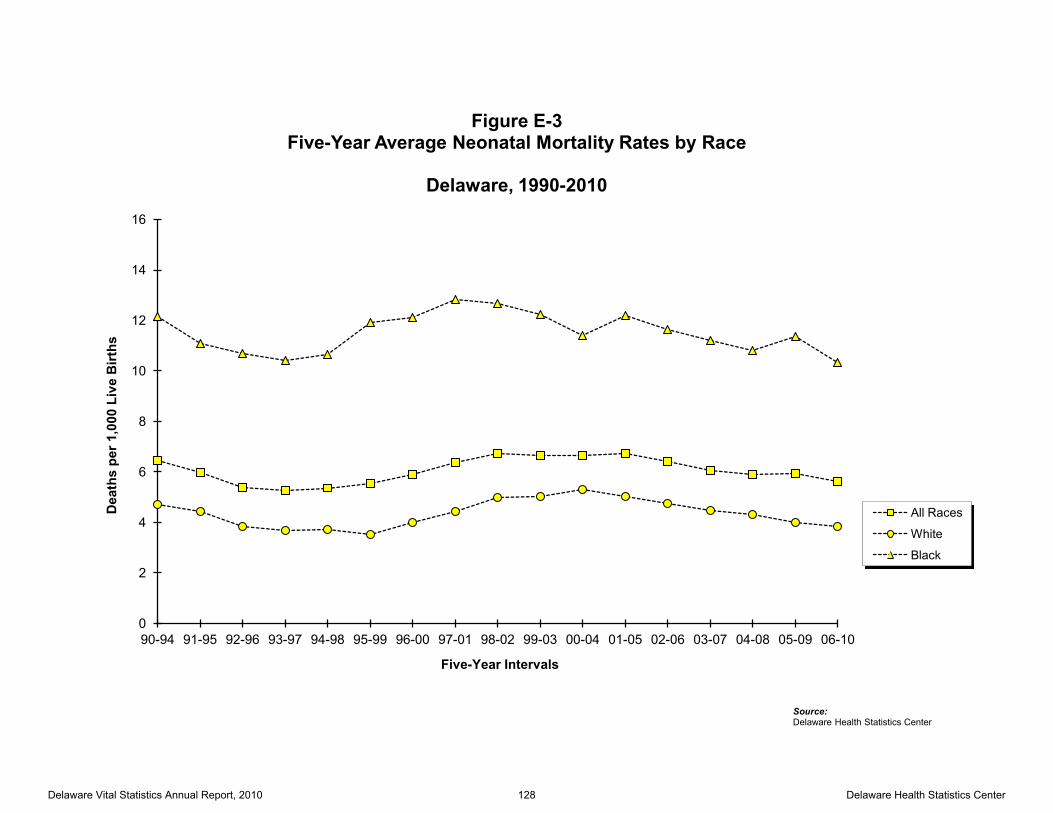
Delaware All Races 6.4+ 6.0+ 5.4 5.3 5.4 5.5+ 5.9+ 6.4+ 6.7+ 6.7+ 6.7+ 6.7+ 6.4+ 6.1+ 5.9+ 5.9+ 5.6+ White 4.7 4.5 3.8 3.7 3.7 3.5 4.0 4.4 5.0+ 5.0+ 5.3+ 5.0+ 4.8+ 4.5+ 4.3 4.0 3.8 Black 12.1 11.1 10.7 10.4 10.6 11.9+ 12.1+ 12.8+ 12.7+ 12.2+ 11.4+ 12.2+ 11.6+ 11.2+ 10.8+ 11.4+ 10.3+
Kent All Races 5.6 4.9 5.0 5.0 5.4 5.5 5.9 6.1 7.2 7.0 7.2 7.0 6.0 4.3 4.6 4.7 4.4 White 4.4 3.6 3.8 --- 3.4 3.4 4.1 4.6 7.0 6.5 6.8 5.5 4.5 --- 2.9 2.7 3.5 Black 10.0 --- --- 12.7 12.1 12.0 12.1 11.3 8.9 9.3 9.2 11.2 10.0 9.1 8.8 10.1 7.3
New Castle All Races 6.9 6.4 5.6 5.2 5.0 5.4 6.1 6.6 6.9 7.1 7.0 7.1 6.9 6.8 6.5 6.7 6.2 White 4.8 4.6 3.6 3.6 3.1 3.0 3.7 4.3 4.5 5.0 5.3 5.3 5.1 5.0 4.8 4.6 3.9 Black 13.9 12.6 12.4 10.8 10.8 13.0 13.5 14.2 14.5 13.9 12.4 12.5 12.3 12.1 11.7 12.1 11.8
Wilmington All Races 12.7 11.1 10.5 8.7 8.0 8.7 9.8 9.7 10.1 9.8 9.1 9.5 8.9 9.0 8.9 9.6 9.0 White 8.1 --- --- --- --- --- --- --- --- --- --- --- --- --- --- --- --- Black 15.2 13.0 14.2 11.2 10.2 11.8 12.5 12.5 13.8 13.4 12.1 13.1 12.3 12.5 11.6 12.9 12.5
Balance of NC County All Races 5.5 5.3 4.5 4.5 4.3 4.7 5.3 6.0 6.3 6.6 6.5 6.6 6.5 6.3 6.0 6.0 5.6 White 4.5 4.3 3.5 3.5 3.1 3.0 3.6 4.2 4.6 5.1 5.4 5.5 5.2 5.2 4.8 4.7 4.0 Black 12.3 12.1 10.6 10.3 11.4 14.1 14.4 15.6 15.1 14.2 12.5 12.1 12.3 11.8 11.8 11.6 11.5
Sussex All Races 5.6 5.5 5.0 5.6 6.8 6.0 5.3 5.8 5.5 4.6 5.1 5.5 5.3 5.6 5.2 4.9 4.9 White 4.6 4.8 4.8 5.1 6.2 5.5 5.0 4.9 4.5 3.6 3.8 3.7 3.9 4.6 4.3 3.7 4.1 Black 8.3 --- --- --- --- --- --- --- --- --- 9.9 12.1 10.8 10.3 9.3 9.8 ---
TABLE E-5FIVE-YEAR AVERAGE NEONATAL MORTALITY RATES BY RACE
U.S., DELAWARE, COUNTIES AND CITY OF WILMINGTON, 1990-2010
Notes: 1. 2006-2010 U.S. data are based on NCHS estimates. 2. Neonatal mortality rates represent the number of deaths of children under 28 days of age per 1000 live births. 3. '+' indicates that the Delaware rate is significantly higher than the U.S. rate. 4. "---" Indicates rate does not meet standard of reliability or precision; based on fewer than 20 deaths in the numerator. 5. No statistical comparisons were made between the county rates and the U.S. rate due to small numbers. See Appendix C for details. Sources: National Center for Health Statistics Delaware Health Statistics Center
INFANT5
Delaware Vital Statistics Annual Report, 2010 127 Delaware Health Statistics Center
0
2
4
6
8
10
12
14
16
90-94 91-95 92-96 93-97 94-98 95-99 96-00 97-01 98-02 99-03 00-04 01-05 02-06 03-07 04-08 05-09 06-10
Dea
ths
per 1
,000
Liv
e B
irths
Five-Year Intervals
Figure E-3 Five-Year Average Neonatal Mortality Rates by Race
Delaware, 1990-2010
All Races
White
Black
Source: Delaware Health Statistics Center
Delaware Vital Statistics Annual Report, 2010 128 Delaware Health Statistics Center

Area/ 1990 1991 1992 1993 1994 1995 1996 1997 1998 1999 2000 2001 2002 2003 2004 2005 2006Race -1994 -1995 -1996 -1997 -1998 -1999 -2000 -2001 -2002 -2003 -2004 -2005 -2006 -2007 -2008 -2009 -2010
U.S. All Races 3.2 3.0 2.9 2.7 2.6 2.5 2.4 2.4 2.3 2.3 2.3 2.3 2.3 2.3 2.3 2.3 2.2 White 2.6 2.5 2.4 2.3 2.1 2.0 2.0 1.9 1.9 1.9 1.9 1.9 1.9 1.9 1.9 1.9 1.9 Black 6.0 5.8 5.6 5.4 5.1 5.0 4.8 4.8 4.8 4.7 4.8 4.8 4.7 4.6 4.6 4.5 4.4
Delaware All Races 2.9 2.9 2.5 2.5 2.6 2.6 2.5 2.6 2.4 2.5 2.6 2.5 2.4 2.5 2.5 2.3 2.4 White 1.9- 2.0- 1.8- 1.9 2.2 2.2 2.2 2.2 2.0 1.9 2.1 1.8 1.8 1.9 1.9 1.7 2.0 Black 6.1 5.9 5.1 4.3 3.8- 3.9 3.8 4.3 4.1 4.5 4.7 4.9 4.5 4.5 4.5 4.2 3.9
Kent All Races 3.9 3.7 3.5 3.2 3.6 3.0 2.7 2.7 2.7 2.6 2.9 3.0 3.1 2.8 2.6 2.3 2.0 White 2.9 3.0 3.0 3.1 3.7 --- 2.9 --- --- --- --- --- --- --- --- --- --- Black --- --- --- --- --- --- --- --- --- --- --- --- --- --- --- --- ---
New Castle All Races 2.7 2.6 2.2 2.1 2.3 2.5 2.4 2.5 2.2 2.3 2.4 2.3 2.3 2.5 2.5 2.3 2.6 White 1.7 1.7 1.4 1.4 1.7 1.9 1.8 2.0 1.8 1.8 1.9 1.8 1.7 2.0 2.1 1.9 2.3 Black 5.9 5.7 5.1 4.5 4.3 4.4 4.2 4.0 3.5 4.1 4.2 4.2 4.0 4.3 4.0 4.0 3.9
Wilmington All Races 5.3 5.5 4.8 4.9 4.8 5.0 4.6 4.3 3.4 3.7 3.3 3.3 3.4 4.0 4.1 4.2 5.1 White --- --- --- --- --- --- --- --- --- --- --- --- --- --- --- --- --- Black 7.5 7.3 6.3 6.5 6.6 6.3 6.2 5.5 --- --- --- --- --- --- --- 5.1 5.5
Balance of NC County All Races 2.0 1.9 1.6 1.5 1.7 1.9 1.9 2.1 2.0 2.0 2.3 2.1 2.0 2.2 2.1 1.9 2.1 White 1.7 1.6 1.3 1.3 1.6 1.8 1.8 1.9 1.8 1.6 1.9 1.7 1.6 1.9 2.0 1.7 2.0 Black --- --- --- --- --- --- --- --- --- 4.0 4.4 4.4 4.0 4.0 3.5 3.3 3.1
Sussex All Races 2.7 3.2 2.9 3.4 2.7 2.5 2.8 3.3 2.9 2.8 3.0 2.7 2.2 2.3 2.4 2.3 2.2 White --- --- --- --- --- --- --- --- --- --- --- --- --- --- --- --- --- Black --- --- --- --- --- --- --- --- --- --- --- --- --- --- --- --- ---
TABLE E-6FIVE-YEAR AVERAGE POSTNEONATAL MORTALITY RATES BY RACE
U.S., DELAWARE, COUNTIES AND CITY OF WILMINGTON, 1990-2010
Notes: 1. 2006-2010 U.S. data are based on NCHS estimates. 2. Postneonatal mortality rates represent the number of deaths of children 28 to 364 days of age per 1000 live births. 3. '-' indicates that the Delaware rate is significantly lower than the U.S. rate. 4. "---" Indicates rate does not meet standard of reliability or precision; based on fewer than 20 deaths in the numerator. 5. No statistical comparisons were made between the county rates and the U.S. rate due to small numbers. See Appendix C for details. Sources: National Center for Health Statistics Delaware Health Statistics Center
INFANT6
Delaware Vital Statistics Annual Report, 2010 129 Delaware Health Statistics Center

0
1
2
3
4
5
6
7
90-94 91-95 92-96 93-97 94-98 95-99 96-00 97-01 98-02 99-03 00-04 01-05 02-06 03-07 04-08 05-09 06-10
Dea
ths
per 1
,000
Liv
e B
irths
Five-Year Intervals
Figure E-4 Five-Year Average Postneonatal Mortality Rates by Race
Delaware, 1990-2010
All Races
White
Black
Source: Delaware Health Statistics Center
Delaware Vital Statistics Annual Report, 2010 130 Delaware Health Statistics Center

TABLE E-7
Risk RaceFactor All Races White Black
Birth Weightof Child <2500 70.6 58.5 89.5 <1500 279.3 262.0 298.9 1500-2499 15.2 13.9 17.5 2500+ 1.9 1.7 2.8
Age of Mother <20 11.8 8.6 16.5 20-24 8.9 6.5 13.9 25-29 7.9 5.8 14.6 30+ 6.8 4.8 15.3
Marital Statusof Mother Married 5.6 4.2 13.9 Single 11.2 8.4 15.2
Educationof Mother <12 years 10.5 8.0 17.1 H.S. diploma 9.7 7.1 14.3 1+ years college 5.9 4.1 13.1
Interval SinceLast Live Birth <18 months 11.5 --- 20.6 18+ months 6.0 4.2 10.9
RATES BY SELECTED RISK MARKERS AND RACE OF MOTHERFIVE-YEAR AVERAGE INFANT MORTALITY
DELAWARE, 2005-2009 LIVE BIRTH COHORT
Notes: 1. Infant mortality rates represent the number of deaths to children under one year of age per 1,000 live births. Source: Delaware Health Statistics Center
COHRATES
Delaware Vital Statistics Annual Report, 2010 131 Delaware Health Statistics Center

Leading causes of death Very preterm
Moderately preterm Term Unknown Total
Disorders related to short gestation and low birth weight, not elsewhere classified 116 0 1 3 120 96.7 96.7Congenital malformations, deformations, and chromosomal abnormalities 17 17 27 0 61 27.9 55.7Newborn affected by maternal complications of pregnancy 44 3 0 0 47 93.6 100.0Sudden infant death syndrome 2 13 29 0 44 4.5 34.1Newborn affected by complications of placenta, cord, and membranes 21 0 1 0 22 95.5 95.5Respiratory distress of newborn 14 0 0 0 14 100.0 100.0Bacterial sepsis of newborn 12 1 0 0 13 92.3 100.0Diseases of the circulatory system 2 4 6 0 12 16.7 50.0Atelectasis 10 0 0 0 10 100.0 100.0Accidents (unintentional injuries) 3 3 4 0 10 30.0 60.0Septicemia 4 2 2 0 8 50.0 75.0Intrauterine hypoxia and birth asphyxia 6 1 0 1 8 75.0 87.5Newborn affected by other complications of labor and delivery 7 0 0 0 7 100.0 100.0Neonatal hemorrhage 7 0 0 0 7 100.0 100.0Renal failure and other disorders of kidney 4 1 0 0 5 80.0 100.0Necrotizing enterocolitis of newborn 4 1 0 0 5 80.0 100.0Gastritis, duodenitis, and noninfective enteritis and colitis 4 0 0 0 4 100.0 100.0Interstitial emphysema and related conditions originating in the perinatal period 4 0 0 0 4 100.0 100.0Pulmonary hemorrhage originating in the perinatal period 4 0 0 0 4 100.0 100.0Hernia of abdominal cavity and intestinal obstruction without hernia 0 1 2 0 3 0.0 33.3All other causes 30 13 30 1 74 40.5 58.1TOTAL 315 60 102 5 482 65.4 77.8
TABLE E-8
DELAWARE, 2005-2009 LIVE BIRTH COHORT
LEADING CAUSES OF INFANT DEATH BY GESTATIONAL AGE CATEGORY
% Born Very Preterm
% Born Preterm
Gestational Age Category
INFLCOD Notes: 1. Leading causes of infant death are categorized using NCHS rankable causes of infant death, specific ICD-10 codes are shown in Appendix D. 2. Very preterm is defined as less than 32 weeks of gestation. 3. Moderately preterm is defined as between 32 and 36 weeks of gestation. 4. Term is defined as 37 and greater weeks of gestation. 5. The percent born preterm includes both the very preterm and moderately preterm groups. Source: Delaware Health Statistics Center
Delaware Vital Statistics Annual Report, 2010 132 Delaware Health Statistics Center

Parameter/ 1990 1991 1992 1993 1994 1995 1996 1997 1998 2000 2001 2002 2003 2004 2005Race -1994 -1995 -1996 -1997 -1998 -1999 -2000 -2001 -2002 -2004 -2005 -2006 -2007 -2008 -2009
2500+ All Races 2.6 2.6 2.3 2.3 2.5 2.4 2.4 2.5 2.3 2.5 2.2 2.2 2.3 2.0 1.9 White 2.1 2.1 2.0 2.1 2.4 2.4 2.3 2.4 2.1 2.1 1.9 1.7 1.9 1.8 1.7 Black 4.1 4.1 3.3 2.9 2.8 2.8 2.8 3.0 3.0 3.9 3.5 3.6 3.5 2.9 2.8
<2500 All Races 83.8 76.4 68.7 65.4 64.8 66.5 69.5 75.2 76.4 73.1 74.5 69.9 68.8 69.2 70.6 White 70.0 66.3 58.4 56.9 55.4 53.9 55.9 63.2 68.7 68.8 68.4 64.3 60.8 60.0 58.5 Black 102.9 91.1 85.3 78.9 78.8 86.0 88.2 93.7 90.5 83.0 88.0 80.9 82.2 83.9 89.5
<1500 All Races 337.3 307.1 272.9 255.2 258.5 262.7 270.9 304.8 316.2 306.2 313.9 289.4 285.8 286.8 279.3 White 311.4 282.1 239.3 229.8 223.2 219.3 231.5 281.9 303.4 316.8 321.2 295.3 289.0 280.2 262.0 Black 355.0 328.4 306.1 280.3 296.8 315.8 312.1 329.8 335.5 301.5 315.7 289.4 286.0 291.9 298.9
37+ weeks All Races 2.6 2.7 2.3 2.4 2.6 2.6 2.5 2.5 2.3 2.4 2.2 2.2 2.3 2.0 2.0 White 2.1 2.3 2.2 2.3 2.6 2.6 2.4 2.3 2.1 2.0 1.7 1.8 1.9 1.8 1.8 Black 3.9 3.8 2.8 2.8 2.8 2.7 2.8 3.1 2.9 4.0 3.4 3.4 3.4 2.9 2.7
<37 weeks All Races 62.9 56.2 50.3 47.1 45.6 45.9 48.2 53.0 54.3 52.6 53.5 49.1 47.1 47.0 47.3 White 51.4 45.6 38.1 37.2 35.4 33.6 35.7 41.8 45.5 46.5 45.2 40.5 37.5 36.2 34.9 Black 79.8 73.4 72.3 65.3 64.1 69.6 70.5 73.5 72.5 67.7 72.7 68.2 66.9 68.3 71.1
<32 weeks All Races 260.8 238.6 212.4 196.5 199.8 201.3 214.9 238.1 249.6 239.4 249.1 232.4 220.4 220.4 216.9 White 260.0 231.0 186.3 177.7 179.4 174.0 191.5 228.4 249.2 244.0 248.3 223.0 202.7 193.2 184.8 Black 258.2 242.8 239.1 215.4 222.2 235.6 238.7 250.4 255.4 239.8 259.4 250.0 246.4 255.2 258.8
Single All Races 8.2 7.7 7.0 6.7 6.7 6.8 6.9 7.3 7.3 7.5 7.4 7.1 7.2 7.0 7.0 White 5.4 5.4 5.0 5.0 5.1 5.1 4.9 5.2 5.4 5.6 5.4 5.1 5.2 5.2 4.9 Black 16.8 14.8 13.3 12.1 11.5 12.2 12.9 13.4 13.4 13.5 13.6 13.0 12.8 12.2 12.7
Plural All Races 45.6 43.1 30.0 33.5 39.3 41.6 45.4 53.1 52.9 50.3 52.0 47.0 44.0 40.3 41.0 White 41.9 37.9 24.5 28.9 30.4 28.6 35.1 43.4 48.0 49.2 49.9 44.0 36.6 29.6 30.6 Black --- --- --- --- 68.7 84.6 73.0 80.7 68.5 54.1 64.6 59.1 63.5 67.7 69.5
No All Races 8.1 7.8 7.0 7.1 7.1 7.4 7.6 8.1 8.0 8.2 8.2 7.9 7.7 7.4 7.6 White 5.5 5.4 5.0 5.3 5.2 5.3 5.3 5.7 5.8 6.2 6.1 6.0 5.7 5.4 5.3 Black 15.9 15.0 13.4 12.6 12.7 14.0 14.3 15.3 14.8 14.3 14.7 13.7 13.4 13.2 13.9
Yes All Races 13.3 12.1 10.3 9.2 10.6 10.6 11.3 13.4 15.1 14.8 15.1 13.4 13.9 13.3 12.1 White 9.5 9.6 8.2 7.4 9.4 9.3 9.8 12.2 14.2 13.3 13.0 10.2 10.7 10.7 8.9 Black 27.4 21.3 18.6 16.2 15.3 16.3 17.3 18.0 18.9 19.5 22.0 23.9 23.8 21.2 21.5
PLURALITY
SMOKING DURING PREGNANCY
TABLE E-9FIVE-YEAR AVERAGE INFANT MORTALITY RATES BY RACE AND SELECTED RISK MARKERS
DELAWARE LIVE BIRTH COHORT, 1990-2009
BIRTHWEIGHT
GESTATION
Delaware Vital Statistics Annual Report, 2010 133 Delaware Health Statistics Center

Parameter/ 1990 1991 1992 1993 1994 1995 1996 1997 1998 1999 2001 2002 2003 2004 2005Race -1994 -1995 -1996 -1997 -1998 -1999 -2000 -2001 -2002 -2003 -2005 -2006 -2007 -2008 -2009
HS Grad or less All Races 10.6 10.4 9.5 9.4 9.9 10.4 10.3 11.1 11.5 11.4 11.1 10.7 10.8 10.1 10.0 White 7.4 7.6 6.9 7.2 8.0 8.0 7.8 8.4 9.1 8.8 8.7 8.3 8.4 7.8 7.6 Black 17.8 16.8 15.7 14.3 14.3 15.8 15.6 16.8 16.9 17.2 17.2 16.6 16.4 15.4 15.4
1+ yrs college All Races 6.5 5.7 5.0 4.9 4.9 4.9 5.5 6.1 6.0 6.0 6.3 5.8 5.4 5.6 5.9 White 4.6 4.2 4.0 3.9 3.7 3.6 4.1 4.6 4.7 4.7 5.0 4.5 4.1 4.2 4.1 Black 16.9 13.0 9.9 10.2 10.5 11.8 13.5 13.9 12.6 12.2 12.0 11.1 10.9 11.4 13.1
Medicaid All Races NA 11.7 10.1 10.0 10.3 10.9 9.9 10.6 10.1 9.5 10.2 9.6 10.4 10.2 9.9 White NA 8.5 7.3 7.9 8.8 9.1 7.7 8.6 8.3 7.1 7.7 7.1 8.0 8.0 7.5 Black NA 15.4 13.8 12.9 12.7 13.6 13.1 13.8 13.0 13.3 14.7 14.0 14.4 14.1 14.1
Private Insurance All Races NA 6.1 5.5 5.3 5.5 5.7 6.5 6.8 7.4 7.7 7.6 7.4 6.7 6.4 6.6 White NA 4.8 4.4 4.2 4.2 4.3 4.9 5.2 5.7 5.9 5.8 5.6 5.0 4.6 4.5 Black NA 14.1 12.6 11.6 12.8 13.7 14.8 15.6 16.5 17.1 17.0 16.6 15.3 15.0 16.4
PAYMENT FOR DELIVERY
TABLE E-9 (continued)FIVE-YEAR AVERAGE INFANT MORTALITY RATES BY RACE AND SELECTED RISK MARKERS
DELAWARE LIVE BIRTH COHORT, 1990-2009
EDUCATION
Notes: 1. See the Basic Definitions' section for definitions of birthweight, gestation, prenatal care attainment, and plurality. 2. "---" indicates rate does not meet standards of reliability or precision; based on fewer than 20 deaths in the numerator. 3. Primary source of payment for delivery not available prior to 1991. Source: Delaware Health Statistics Center
COTREND
Delaware Vital Statistics Annual Report, 2010 134 Delaware Health Statistics Center

0
10
20
30
40
50
60
70
80
90
94-98 95-99 96-00 97-01 98-02 99-03 00-04 01-05 02-06 03-07 04-08 05-09
Dea
ths
per 1
,000
Liv
e B
irths
Five-year Interval
Figure E-5 Five-year Average Infant Mortality Rates by Race and Plurality
Delaware, 1994-2009 Live Birth Cohort
White single
White plural
Black single
Black plural
Source: Delaware Health Statistics Center
Delaware Vital Statistics Annual Report, 2010 135 Delaware Health Statistics Center

All Races, Non-Smokers
0
5
10
15
20
25
30
35
89-93 90-94 91-95 92-96 93-97 94-98 95-99 96-00 97-01 98-02 99-03 00-04 01-05 02-06 03-07 04-08 05-09
Dea
ths
per 1
,000
Liv
e B
irths
Five-year Interval
Figure E-6 Five-year Average Infant Mortality Rates by Race of Mothers who Smoked during
Pregnancy versus all Non-smoking Mothers
Delaware, 1989-2009 Live Birth Cohort
Black
All Races
White
Source: Delaware Health Statistics Center
Delaware Vital Statistics Annual Report, 2010 136 Delaware Health Statistics Center

0
2
4
6
8
10
12
14
16
18
91-95 92-96 93-97 94-98 95-99 96-00 97-01 98-02 99-03 00-04 01-05 02-06 03-07 04-08 05-09
Dea
ths
per 1
,000
Birt
hs
Five-year Interval
Figure E-7 Five-year Average Infant Mortality Rates by Race and
Source of Payment for Delivery
Delaware, 1991-2009 Live Birth Cohort
BL Medicaid
BL Insurance
WH Medicaid
WH Insurance
Source: Delaware Health Statistics Center
Delaware Vital Statistics Annual Report, 2010 137 Delaware Health Statistics Center

Race and SexPlurality/ All Races White Black Other
Birth Weight Both Both Both BothSexes Male Female Sexes Male Female Sexes Male Female Sexes Male
All Births 482 256 226 233 129 104 231 117 114 18 10 <2500 376 197 179 169 95 74 193 94 99 14 8 <1500 312 169 143 136 82 54 165 81 84 11 6 <500 150 76 74 50 28 22 96 46 50 4 2 500-999 134 73 61 68 41 27 61 30 31 5 2 1000-1499 28 20 8 18 13 5 8 5 3 2 2 1500-1999 30 12 18 17 6 11 12 6 6 1 0 2000-2499 34 16 18 16 7 9 16 7 9 2 2 2500+ 102 56 46 62 33 29 37 22 15 3 1 2500-2999 42 23 19 27 16 11 14 7 7 1 0 3000-3499 37 22 15 17 8 9 18 13 5 2 1 3500-3999 18 8 10 14 6 8 4 2 2 0 0 4000-4499 3 2 1 3 2 1 0 0 0 0 0 4500+ 2 1 1 1 1 0 1 0 1 0 0 Unknown 4 3 1 2 1 1 1 1 0 1 1
Single Births 396 209 187 190 100 90 190 100 90 16 9 <2500 296 153 143 128 67 61 155 79 76 13 7 <1500 235 127 108 96 55 41 129 67 62 10 5 <500 116 58 58 34 18 16 78 38 40 4 2 500-999 99 56 43 50 29 21 44 25 19 5 2 1000-1499 20 13 7 12 8 4 7 4 3 1 1 1500-1999 30 12 18 17 6 11 12 6 6 1 0 2000-2499 31 14 17 15 6 9 14 6 8 2 2 2500+ 97 54 43 60 32 28 35 21 14 2 1 2500-2999 38 22 16 25 15 10 13 7 6 0 0 3000-3499 36 21 15 17 8 9 17 12 5 2 1 3500-3999 18 8 10 14 6 8 4 2 2 0 0 4000-4499 3 2 1 3 2 1 0 0 0 0 0 4500+ 2 1 1 1 1 0 1 0 1 0 0 Unknown 3 2 1 2 1 1 0 0 0 1 1
Plural Births 86 47 39 43 29 14 41 17 24 2 1 <2500 80 44 36 41 28 13 38 15 23 1 1 <1500 77 42 35 40 27 13 36 14 22 1 1 <500 34 18 16 16 10 6 18 8 10 0 0 500-999 35 17 18 18 12 6 17 5 12 0 0 1000-1499 8 7 1 6 5 1 1 1 0 1 1 1500-1999 0 0 0 0 0 0 0 0 0 0 0 2000-2499 3 2 1 1 1 0 2 1 1 0 0 2500+ 5 2 3 2 1 1 2 1 1 1 0 2500-2999 4 1 3 2 1 1 1 0 1 1 0 3000-3499 1 1 0 0 0 0 1 1 0 0 0 3500-3999 0 0 0 0 0 0 0 0 0 0 0 4000-4499 0 0 0 0 0 0 0 0 0 0 0 4500+ 0 0 0 0 0 0 0 0 0 0 0 Unknown 1 1 0 0 0 0 1 1 0 0 0
TABLE E-10
DELAWARE, 2005-2009 LIVE BIRTH COHORT
NUMBER OF INFANT DEATHS BY PLURALITY, BIRTH WEIGHT IN GRAMS, RACE OF MOTHER AND SEX OF CHILD
PLBWRCSX Note: Infant deaths refer to deaths of children under one year of age. Source: Delaware Health Statistics Center
Delaware Vital Statistics Annual Report, 2010 138 Delaware Health Statistics Center

Race and SexPlurality/ All Races White Black Other
Birth Weight Both Both Both BothSexes Male Female Sexes Male Female Sexes Male Female Sexes Male
All Births 346 192 154 160 93 67 174 93 81 12 6 <2500 316 173 143 142 84 58 163 84 79 11 5 <1500 286 158 128 126 77 49 151 77 74 9 4 <500 150 76 74 50 28 22 96 46 50 4 2 500-999 113 65 48 61 37 24 48 27 21 4 1 1000-1499 23 17 6 15 12 3 7 4 3 1 1 1500-1999 15 6 9 8 3 5 6 3 3 1 0 2000-2499 15 9 6 8 4 4 6 4 2 1 1 2500+ 27 17 10 16 8 8 10 8 2 1 1 2500-2999 12 8 4 9 5 4 3 3 0 0 0 3000-3499 10 8 2 4 2 2 5 5 0 1 1 3500-3999 2 0 2 1 0 1 1 0 1 0 0 4000-4499 2 1 1 2 1 1 0 0 0 0 0 4500+ 1 0 1 0 0 0 1 0 1 0 0 Unknown 3 2 1 2 1 1 1 1 0 0 0
Single Births 269 147 122 120 65 55 138 77 61 11 5 <2500 241 130 111 103 57 46 128 69 59 10 4 <1500 212 116 96 87 50 37 117 63 54 8 3 <500 116 58 58 34 18 16 78 38 40 4 2 500-999 81 48 33 44 25 19 33 22 11 4 1 1000-1499 15 10 5 9 7 2 6 3 3 0 0 1500-1999 15 6 9 8 3 5 6 3 3 1 0 2000-2499 14 8 6 8 4 4 5 3 2 1 1 2500+ 26 16 10 15 7 8 10 8 2 1 1 2500-2999 11 7 4 8 4 4 3 3 0 0 0 3000-3499 10 8 2 4 2 2 5 5 0 1 1 3500-3999 2 0 2 1 0 1 1 0 1 0 0 4000-4499 2 1 1 2 1 1 0 0 0 0 0 4500+ 1 0 1 0 0 0 1 0 1 0 0 Unknown 2 1 1 2 1 1 0 0 0 0 0
Plural Births 77 45 32 40 28 12 36 16 20 1 1 <2500 75 43 32 39 27 12 35 15 20 1 1 <1500 74 42 32 39 27 12 34 14 20 1 1 <500 34 18 16 16 10 6 18 8 10 0 0 500-999 32 17 15 17 12 5 15 5 10 0 0 1000-1499 8 7 1 6 5 1 1 1 0 1 1 1500-1999 0 0 0 0 0 0 0 0 0 0 0 2000-2499 1 1 0 0 0 0 1 1 0 0 0 2500+ 1 1 0 1 1 0 0 0 0 0 0 2500-2999 1 1 0 1 1 0 0 0 0 0 0 3000-3499 0 0 0 0 0 0 0 0 0 0 0 3500-3999 0 0 0 0 0 0 0 0 0 0 0 4000-4499 0 0 0 0 0 0 0 0 0 0 0 4500+ 0 0 0 0 0 0 0 0 0 0 0 Unknown 1 1 0 0 0 0 1 1 0 0 0
TABLE E-11
DELAWARE, 2005-2009 LIVE BIRTH COHORT
NUMBER OF NEONATAL DEATHS BY PLURALITY, BIRTH WEIGHT IN GRAMS, RACE OF MOTHER AND SEX OF CHILD
Note: Neonatal deaths refer to deaths of children under 28 days of age. Source: Delaware Health Statistics Center
NEOPLBW
Delaware Vital Statistics Annual Report, 2010 139 Delaware Health Statistics Center