suggestions for unit financial management
TRANSCRIPT

Suggestions for Unit Financial ManagementWednesday, 4/6/11
10:30 – 11:45 and 3:15 – 4:30

Workshop Presenters• Name: Barb Geissler
Title: Assistant Dean for Administration and Finance, College of EducationContact Information: [email protected] (244-3386)
• Name: Pat HoeyTitle: Director, Budget Operations & Analysis Contact Information: [email protected] (244-0542)
• Name: Bob KesslerTitle: Assistant to the Head, Department of Agricultural and Consumer EconomicsContact Information: [email protected] (333-5516)
2

Please …
• Turn your cell phones to silent.
• Sign the attendance roster.
• Complete the evaluation at the end of the workshop.
• Questions are welcomed at anytime during the presentation.
3

Workshop Objectives
• Understand the state and ICR funds allocation process from campus, college and department perspectives
• Recognize restricted fund types: evaluating financial position and considerations for restricted funds in unit financial management
• Highlight sources of information useful in creation of financial and managerial reporting.
4

UIUC FY11 Unrestricted Permanent Budget($885.5 million)
5
Income Fund
$518.8
State Approp $249.5
Inst Funds $117.2
By source:
Academic Units
$567.4
Admin Units, $67.1
Utilities $68.7
F&S $41.4
Fin Aid $26.9
Campus General $114.0
By use:

UIUC FY01 Unrestricted Permanent Budget($519.9 million)
6
Income Fund $150.4
State Approp $309.2
Inst Funds $60.3
Academic Units $378.2
Admin Units, $48.1
Utilities $24.3
F&S $30.0
Campus General $37.5

Annual College Budget Allocation (State Funds)
• Incremental process: Prior year budget is starting point, allocation indicates additions and deductions
• Total campus-wide allocations to college-level units equals budgeted change in state appropriation and income fund
• Allocations deal with recurring funds only
• College allocations itemized on allocation sheet-sample allocation sheet next slide
7

8
RATE INCREASE:
Base Amount
Academic 5,762.0 Filled $86.4
Additional Academic (CMER) * 4,307.3 $21.5
Assistants 959.9 X .95 $13.7
Nonacademic 591.2 X .95 $8.4
Wages X .95
Subtotal: $130.0
Promotion Funds $17.5
1116-02 Instructional Award; $1.5
1047-03 CAPE Award;
1019 CAEPE Award
TOTAL RATE INCREASE: $149.0
Excess or deficiency in earned funds from income fund. $297.8
OTHER CHANGES:
1312-03 FE $140.0
1381-01 TOP $62.0
1381-01 Dual $5.2
1381-01 Dual $15.0
2279-01 Retention $20.0
2299-02 MPH funding $200.0
TOTAL OTHER CHANGES: $442.2
REDUCTIONS:
Academic Base 10,367.2
Assessment for core operations
(deferred maint. Debt service,
Library materials, network
infrastructure, building maintenance
restoration, programmatic
initiatives) (2.1%) ($217.7)
Assessment for base energy
program, TOP/Faculty
Excellence/Spousal program,
Medicare and Workers Comp
(1.0%) (103.7)
TOTAL REDUCTIONS: ($321.4)
STATE ALLOCATION (GRF & Income Fund) $567.6
College of XXX
2008-2009 BUDGET ALLOCATION
(thousands of dollars)
Updated 7/29/2008

Components of State Allocation
• Rate Increase – most years
• Increased salary expenses accompany this budget increase
• Sample:
9
RATE INCREASE:
Base Amount
Academic 5,762.0 Filled $86.4
Additional Academic (CMER) * 4,307.3 $21.5
Assistants 959.9 X .95 $13.7
Nonacademic 591.2 X .95 $8.4
Wages X .95
Subtotal: $130.0
Promotion Funds $17.5
Instructional Award; $1.5
CAPE Award;
CAEPE Award
TOTAL RATE INCREASE: $149.0
State funded filled
budgeted positions
Typically filled state
faculty base
Banner permanent
budget base

Components of State Allocation (continued)
• Earned income-tuition distributed to unit
• Single line on allocation sheet; increase or decrease to unit’s budget
• Does not have direct link to increased expenses in the way that salary rate funds do
• Complicated calculation; simplifications to increase predictability and relevancy in coming years
10

Components of State Allocation (continued)
• Calculation shown on revenue generation sheet:
• Calculation detailed in tuition distribution files on Budget web site (http://www.obfs.uillinois.edu/budgeting/urbana-champaign-campus/budget-reform/) 11
Unit: XXX Amount
Required above/(below)
FY08 FY09 FY09 Salary need
Income Fund
Undergraduate Tuition 7,543.3 7,543.3 7,756.0 212.7
Graduate Tuition 416.1 416.1 501.0 84.9
Self-Supporting Tuition - - - -
Differential Tuition - - - -
Teacher Ed. Instruction 23.4 23.4 24.1 0.7
Extramural & Other 2.1 2.1 1.7 (0.5)
Total 7,984.9 7,984.9$ 8,282.7 297.8$
Total Income Fund 297.8$
Excess or deficiency in earned funds from income fund. $297.8
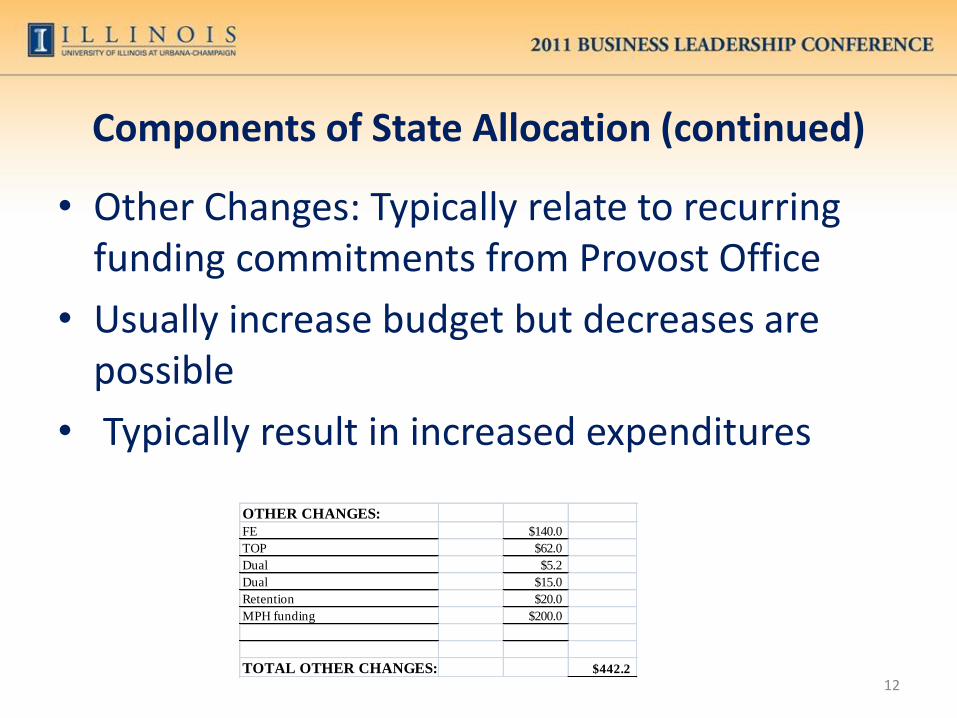
Components of State Allocation (continued)
• Other Changes: Typically relate to recurring funding commitments from Provost Office
• Usually increase budget but decreases are possible
• Typically result in increased expenditures
12
OTHER CHANGES:
FE $140.0
TOP $62.0
Dual $5.2
Dual $15.0
Retention $20.0
MPH funding $200.0
TOTAL OTHER CHANGES: $442.2

Components of State Allocation (continued)
• Budget Reductions-calculated as a % of permanent budget base
• % has varied over years; in FY11, reduction % depended on whether funding was self-generated or allocated
13
REDUCTIONS:
Academic Base 10,367.2
Assessment for core operations
(deferred maint. Debt service,
Library materials, network
infrastructure, building maintenance
restoration, programmatic
initiatives) (2.1%) ($217.7)
Assessment for base energy
program, TOP/Faculty
Excellence/Spousal program,
Medicare and Workers Comp
(1.0%) (103.7)
TOTAL REDUCTIONS: ($321.4)
Permanent state and
allocated ICR

Components of State Allocation (continued)
• Budget reductions create budget shortfall that has to be covered by generating new revenue to cover shortage or by reducing permanent costs
• Recurring obligations must be matched with recurring funding sources to avoid structural deficit
• Non-recurring funding available for non-recurring uses or as temporary buffer against structural imbalance
14

CoE Budget Changes over Time
15
-
2,000.0
4,000.0
6,000.0
8,000.0
10,000.0
12,000.0
14,000.0
16,000.0
18,000.0
(2,500.0)
(2,000.0)
(1,500.0)
(1,000.0)
(500.0)
-
500.0
1,000.0
2002 2003 2004 2005 2006 2007 2008 2009 2010 2011Salary Program
Tuition (excluding AO)
Other Changes
Cuts & Taxes
Budget excluding AO
Budget including AO*

Education Budget Lines
• Academic Salaries
• Staff Salaries
• Assistant Salaries
• Materials and Supplies
16

Principles for Allocation to Departments
• Vacant faculty lines (academic salaries) revert to a ‘pool’ for allocation based upon discussion by academic unit heads
• Staff salary lines distributed to departments in accordance with prior year allocation
• Allocation of Assistant Salaries funding to departments dependant upon budget availability
• Materials and supplies made after all others and according to budget availability
17

Summary of Expenditures
18

State Recurring $ - Source
19
~ $4 Million
Tuition differential$1,500 per student
50-50 share with College$90,000

State Expenditures exceed State Sources
20
$ 95,000 Supplies and expenses
86,986 AP Salaries
185,643 Instructor led teaching
40,000 TA costs exceeding budget
$ 407,629

Meet the deficit?
• Beg
$189,550 Non-recurring provided by College
• Gifts, ICR, Hatch Reserves & Other
$ 218,029
21

State Funds Earned and Allocated
• Budgets recorded in Banner state fund (100011) include state appropriations (GRF) and income fund (tuition)—source of funding is not discernible in Banner
• Campus budgeting does not separately identify GRF and tuition
• Interest has increased recently in understanding what portion of a unit’s budget is self-generated and what portion is “allocated”
• Answering this requires estimates and assumptions
22

State Funds Earned and Allocated (continued)
• Approach taken for FY11 budget:1. Assign all tuition to tuition-generating units by allocating
100% of tuition according to campus distribution policies
2. Identify overhead functions that are funded partially using tuition; estimate the portion of funding from tuition and identify an allocation base for charging the cost to tuition-generating units
3. A unit’s self-generated funding is the result of #1 - #2; the fully-attributed tuition less the unit’s share of tuition-funded overheads
• Calculation done at college-level for all tuition-generating units
23

State Funds Budget Process
• State budget process demo available at:
(http://www.uillinois.edu/our/media/budgetprocess.html)
• Discusses key steps and timeline for state budget process to University as a whole and may be of interest for background
24

Other Unrestricted Fund Sources
• FY11 recurring institutional funds budget:
25
Indirect cost Recoveries 101.2$
Admininstrative Allowances 14.3
Royalties 1.7
Total 117.2$
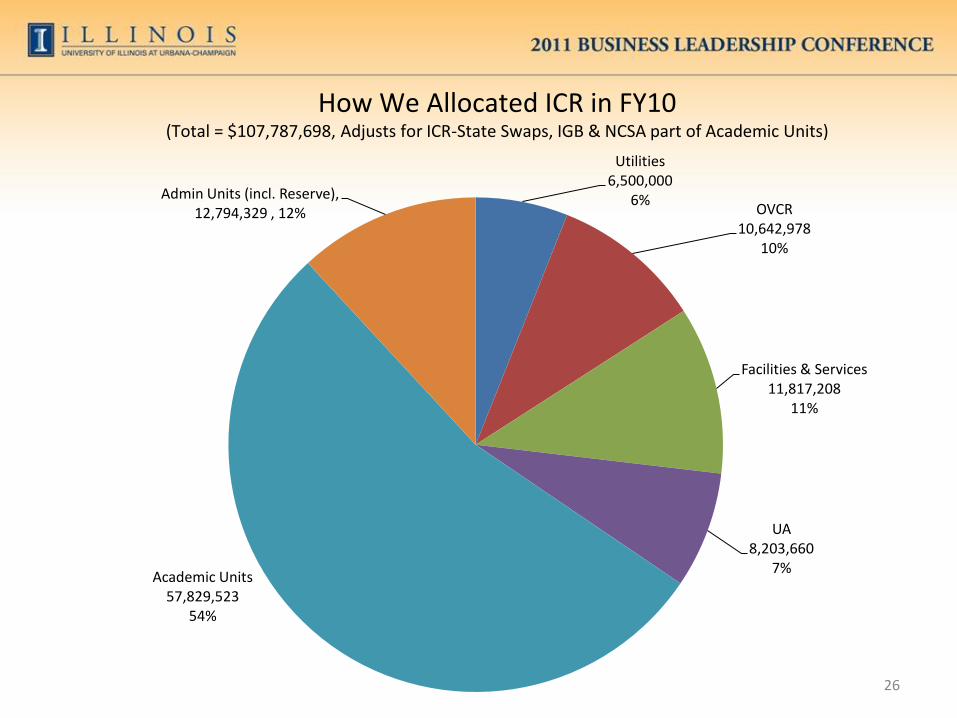
26
Utilities6,500,000
6%OVCR
10,642,97810%
Facilities & Services11,817,208
11%
UA8,203,660
7%Academic Units
57,829,52354%
Admin Units (incl. Reserve), 12,794,329 , 12%
How We Allocated ICR in FY10(Total = $107,787,698, Adjusts for ICR-State Swaps, IGB & NCSA part of Academic Units)

ICR Funds
27
$0
$500,000
$1,000,000
$1,500,000
$2,000,000
$2,500,000
$3,000,000
FY2007 FY2008 FY2009 FY2010 FY2011
College of Education5 Year ICR Trend
Allocated
Earned
Generated

College ICR Policy
Allocated ICR and college share of Earned ICR College priorities
Department share of Earned ICR shared between the department and the grant PI Dept 60%/PI 40%
Tuition remission adjustment College 25%/Dept 75%
28

Restricted Fund Types
• Sponsored program-Allowable expenditures governed by terms of award
Faculty AY salary on sponsored projects “releases” permanent state funds
29
$-
$100,000.00
$200,000.00
$300,000.00
$400,000.00
$500,000.00
$600,000.00
FY06 FY07 FY08 FY09 FY10
CoE Funds Released
Funds Released to Department
Funds Released to College

Restricted Fund Types
• Self-supporting-Expenditures must be related to underlying activity
• Self-supporting budgets are estimates and do not impact financial position of fund
• Fund financial position is assessed via cash and fund balance which are impacted by revenues, expenses and collections
• Funds should be self-sufficient and should not be subsidized by other fund sources; full costs should be charged to funds and rates should be set to fully recover costs.
30

Restricted Fund Types
• Gift/Endowment-Expenditures must comply with donor intent
• Financial position assessed based on cash/fund balance for GL (fund) and BBA for SL (C-FOP)
• To extent donor intent allows, gift funds may provide means of coping with reductions in other fund sources.
31

Budgeting in a challenging environment
• Understand what you do and how to pay for it
• Diversify your funding sources; view budget and assess financial position holistically
• Match recurring costs to recurring sources
• Have a multi-year planning horizon, seek equilibrium over time
• Have a process – identify your strategy, resources, priorities, schedule, opportunity costs
• Periodically review outcomes and actual costs and revenues
32

33

34

Useful Sources of Financial Information
• Canned statements
• Banner forms
• Banner self-service budget queries function
• Queries against EDW (typically Business Objects)
• DMI
35

Canned Statements
• Accesible via:
-Eddie (https://eddie.ds.uillinois.edu/); requires training and access
-View Direct (https://docdirectpweb.admin.uillinois.edu/ddrint/servlet/ddrint)
• Limitations: Standard format, non-adaptable
36

Banner Forms
37
• Quickly accessible
• Often can review further levels of detail
• Not adaptable
• Cannot specify period
• Budget not split by permanent and temporary components

Several Useful Banner Forms
Form Form Title Purpose
FGIBDST Organization Budget StatusAdjusted Budget, YTD Activity, Commitments, Avail Balance
FGIBDSR Executive Summary Same as FGIBDST but fund roll-up
FGITBSR Trial Balance SummaryCash & Current Fund Balance
including roll-up ability
FGITBAL General Ledger Trial Balance Cash & Fund Balance
FGIBSUM Organization Budget Summary Account type roll-up of activity
FGIDOCR Document Retrieval Inquiry View banner journal vouchers
38

Banner Self-Service Budget Queries
• Accessible through Finance menu within the Web For Employees section of Banner: (https://apps.uillinois.edu/EmpSelfService.html/)
• Query results downloadable to Excel
• Several reporting alternatives available
• Drill-down capability through finance hierarchy levels
• Not as customizable as Business Objects
• Presentation regarding use available at: (http://adminconference.illinois.edu/presentations.html#7 )
39

Business Objects Queries of EDW
• Training and access via Decision Support (http://www.ds.uillinois.edu/web/)
• Highly customizable
• Easy to learn and use
• Strong support system
• Results downloadable to Excel
• Wide array of data available
• Several canned queries available at: (http://www.obfs.uillinois.edu/budgeting/urbana-champaign-campus/financial-query-resources/)
40

41
Division of Management Information
• Very useful & informative site (http://www.dmi.illinois.edu/) includes:
• Campus Profile: “The UIUC Factbook” – 10 years of measures on various topics at campus, college, school, dept. level, highly customizable
• Current campus and UA org structures and staffing
• Various student enrollment reports
• Budget reform data; include tuition and waiver by college & dept.
• Tuition, waiver & Appt. information; customizable tuition data by term, student level and unit. Access restricted to authorized users.
• Many other topics

Expenditures by Fund Type
0%
10%
20%
30%
40%
50%
60%
70%
80%
90%
100%
1999-00 2000-01 2001-02 2002-03 2003-04 2004-05 2005-06 2006-07 2007-08 2008-09
% Self Supporting
% Gifts & Endowment
% Grants & Contracts
% Institutional
% State Approp & Tuition
Financial/Managerial Reporting Examples

Financial/Managerial Reporting Examples
43
$0
$2,000,000
$4,000,000
$6,000,000
$8,000,000
$10,000,000
$12,000,000
$14,000,000
$16,000,000
02 03 04 05 06 07 08 09
COE Allocation of State Budget
Other Released TT Fac Salaries Other Ac Salaries Staff Salaries

FY09 Graduate Tuition & Enrollment by Degree*
Net Tuition
Degree Number Enrolled
EDM 584
MA 26
MS 19
CAS 23
EDD 92
PHD 434
Total 1178 $0
$500
$1,000
$1,500
$2,000
$2,500
$3,000
$3,500
$4,000
EDM MA MS CAS EDD PHD
Tuition Per Enrollee
EDM 71%
MA 1%
MS 1%
CAS 3%
EDD 10%
PHD 14%
Degree Assessed Tuition Waived Tuition Net Tuition
EDM $ 3,310,051 $ 1,173,551 $ 2,136,500
MA $ 249,670 $ 232,413 $ 17,257
MS $ 167,173 $ 137,169 $ 30,004
CAS $ 127,741 $ 42,586 $ 85,155
EDD $ 435,331 $ 132,519 $ 302,812
PHD $ 5,747,740 $ 5,311,602 $ 436,138
Total $10,037,706.00 $7,029,840.00 $3,007,866.00
*Includes AO tuition
Financial/Managerial Reporting Examples

FY10 Selected Unit Expenditures
Unit Budget Total Expenditures
Advancement 216,038.00 224,272.43
BER 351,253.00 332,211.70
Budget Office 475,838.00 473,260.84
C&I 175,822.00 182,614.05
Center for Education in Small 0.00 334,441.84
Dean's Office 473,325.00 369,719.48
EPS 68,543.10
EPSY 144,658.00 121,251.68
Matching Fellowship 14,865.00 14,865.03
MSTE 182,189.00 205,725.44
OCIO 642,843.00 737,449.83
SAAO 527,943.00 473,374.97
Service Center 212,452.00 221,461.35
Sped 176,548.00 140,979.18
unspecified 8,656.00 80,839.08
Grand Total 3,602,430.00 3,981,009.98
-600000
-500000
-400000
-300000
-200000
-100000
0
2003 2004 2005 2006 2007 2008 2009 2010
Deficit History
C&I
Ed-Admin
EPS
OCIO
Term Sick
TT Faculty salaries
61%
Staff & AP salaries
32%
Other7%
FY11 Allocation of State Budget

FY11
FY11
Percentage FY10
FY10
Percentage
Base State Budget (excluding AO tuition rev) 13,400,527 14,373,392
Portion Attributed to Reg Tuition 4,003,000 30% 4,225,480 29%
Portion Attributed to General Revnue Funds 9,397,527 70% 10,147,912 71%
Total Budget Perm Positions 13,224,459 14,077,775
Total Budget Perm Positions as a Percentage 99% 98%
FTE TenSYS Faculty DMI (1030) 73.33 82.35
Tuition Generation by FTE 54,589 51,311
Net Tuition UG
UG Tuition Enrollment Portion 1,125,683 41% 1,125,180 39%
UG Tuition Instructional Units Portion 1,580,279 58% 1,621,540 56%
UG Tuition Summer Session 41,188 1% 148,816 5%
Total UG = 2,747,151 2,895,536
Net Tuition Grad
Grad Tuition 925,800 965,490 94%
Grad Tuition Summer Session 108,100 60,353 6%
Total Grad = 1,033,900 1,025,843
Net Tuition Other
Correspond/Extramural/Other Income = 222,000 304,101
Total Net Tuition 4,003,051 4,225,480
Net Change Income Funds (416,754)
Percent Change -8.98%
Tuition Attributed By Department G/UG/SMR
Ed Admin** 118,133 3% 564,816 13%
Special Education 404,528 10% 489,734 12%
Curriculum and Instruction 2,154,560 54% 1,764,059 42%
Educational Psychology 386,953 10% 488,739 12%
Educational Policy Studies 392,852 10% 383,235 9%
Ed Organization and Leadership 247,704 6% 259,084 6%
Human Resource Education 298,323 7% 275,814 7%
Total Tuition Allocated = 4,003,053 100% 4,225,480 100%