sulphur river basin area non-hazardous solid waste ...the amount of solid waste generated in the...
TRANSCRIPT

SULPHUR RIVER BASIN AUTHORITY
Sulphur River Basin Area Non-Hazardous
Solid Waste Management Plan for
Protection of Water Resources 1990 - 2010
FINAL REPORT
April 1990
© Copyright 1990
Sulphur River Basin Authority
Taylor and Associates, Inc. CONSULTING ENGINEERS· TEXARKANA. TEXAS
Alan Plummer and Associates, Inc. ClVILjENVJRONloIENTAL ENGINEERS· ARLINGTON- AUSTIN- FORT lfORTIi. TEXAS

TABLE OF CONTENTS
EXECUTIVE SUMMARY
INTRODUCTION EXISTING CONDITIONS FUTURE NEEDS • ALTERNATIVES •• , RECOMMENDATIONS
CHAPTER I - INTRODUCTION
BACKGROUND PURPOSE SCOPE
CHAPTER II - EXISTING CONDITIONS
POPULATION Area Population and Economy • Cities ••••. Counties •••.• Basin Area Only .•
WATER QUALITY AND QUANTITY Sunmary Surface Water • • • Groundwater • • . •
SOLID WASTE GENERATORS •• Residential and Commercial Industrial •••••••• Water and Wastewater Treatment Plants
SOLID WASTE LANDFILLS ••••••••••••• SUl1I1lary ••••••••••••••• Current Landfill Status ••.••••• Geologic Suitability of Landfill Sites Solid Waste Haulers
ON-SITE DISPOSAL • • . . Solid Waste Septic Tank Waste
i
· . . · . . . . .
. .
· . .
ES-l ES-l ES-3 ES-5 ES-6
1-1 1-7 1-7
II-I II-I II-2 II-2
I1-10 11-10 II-I0 II-12 II-17 II-20 II-20 II-22 11-26 11-30 11-30 11-31 11-42 11-43 II-47 11-47 II-47

TABLE OF CONTENTS (continued)
CHAPTER III - FUTURE NEEDS
POPULATION Cities •••• Counties ••• Basin Area Only.
PROJECTED SOLID WASTE • Source .•. • • Characteristics. Quantities •••
PREDICTED FUTURE LANDFILL REQUIREMENTS Subtitle D Criteria for Landfills Projected Needs for Landfill Space
PREDICTED WATER QUALITY AND QUANTITY CONCERNS • Surface Water • Groundwater . • . • • . . . • • . • • •
CHAPTER IV - ALTERNATIVES
NON-HAZARDOUS WASTE DISPOSAL ALTERNATIVES. . . . . . . . . . . Hierarchy of Preferred Solid Waste Management Methods. Waste Minimization •.•••••• Recycling and Reuse •.•••••• Incinceration with Energy Recovery Sanitary Landfilling
SLUDGE DISPOSAL ALTERNATIVES TRANSPORTATION • • • • • • • PERMITS REQUIRED • • • • • • MANAGEMENT ALTERNATIVES •••
Public Ownership and Operation Public Ownership and Private Operation Private Ownership and Public Operation Private Ownership and Operation Multijurisdictional Approaches ••••
ii
. . . .
. . .
111-1 111-1 111-4 111-4
111-10 111-10 111-10 II 1-11 111-13 II 1-13 111-17 111-19 111-19 111-23
IV-l IV-l IV-2 IV-5
IV-ll IV-16 IV-IS IV-2I IV-29 IV-34 IV-35 IV-36 IV-36 IV-37 IV-37

TABLE OF CONTENTS (continued)
CHAPTER IV - ALTERNATIVES (Continued)
FINANCING ALTERNATIVES • • • • • General Obligation Bonds Revenue Bonds • • • • • • Industrial Development Bonds Leveraged Leasing •••• Current Revenue Financing Bank Loans •• . Lease Agreements ••• •
COST CRITERIA • • • • • • • • • . Collection/Primary Haul • Intermediate Processing/Secondary Haul Ultimate Disposal •
REGIONAL PLAN ALTERNATIVES •.••••.•••
CHAPTER V - RECOMMENDATIONS
RECOMMENDED ALTERNATIVE. Subregional Facilities Solid Waste Loadings Costs
MANAGEMENT OPTIONS ••••• Regulation .•••• MuniCipal Solid Waste Collection Transfer Station Management • Landfill Management •••••
ADDITIONAL LOCAL GOVERNMENT ACTIONS • Water and Wastewater Sludges Septic Tanks •••••.•• Illegal Dumping •.•.••• Waste Minimization ••••• Reuse and Recycling Programs Public Education ••••••
iii
Page
IV-39 IV-40 IV-40
· . IV-41 IV-43 IV-44 IV-44 IV-44
· . IV-45 · . IV-46 · . IV-47
IV-50 · . IV-52
V-I V-I V-3
· . . V-9 V-12 V-13 V-13 V-13 V-14
· . V-IS · . V-16 · . V-16
V-16 V-17 V-17 V-17

BIBLIOGRAPHY
APPENDIX A WATER QUALITY DATA
TABLE OF CONTENTS (continued)
APPENDIX B MANUFACTURERS IN PLANNING AREA
APPENDIX C STUDY QUESTIONNAIRE RESPONSE SUMMARIES
APPENDIX D TDH PERMIT APPLICATION FORMS/DOCUMENTS
APPENDIX E COMMUNITY BASED RECYCLING PROGRAM/RECYCLE MARKET CONTACTS
iv

Number
1-1 1-2 1-3
II-I 11-2
11-3 11-4 11-5 11-6 11-7 11-8 11-9
11-10 11-11 11-12 11-13 11-14 11-15
111-1 111-2
111-3
111-4 111-5 111-6
IV-l IV-2 IV-3 IV-4 IV-5 IV-6 IV-7
LIST OF TABLES
Title
Sulphur River Basin Authority Board of Directors Contributions and Pledges Steering Committee Members .•••
Existing Condition City Populations EXisting Condition Populations County Unincorporated/
Incorporated Areas • • • • • • • • • • • • • • County and Census Division Population Densities EXisting Condition Basin Population by County Sulphur Basin Water Quality Standards •••• Solid Waste Unit Loading - Various Size Cities 1987 Estimated Solid Waste Loadings ••••• Major Manufacturers in the Planning Area ••• Current Study Questionnaire Reported Sludge Disposal
Practices ••••.••••••.•• Permitted Landfill Data - 1987 TDH Report Estimated Landfill Data Updated Per TDH Percent Coverage of Suitable/Unsuitable Mineral Land Units Summary of Solid Waste Hauler Survey Information ••••• County Septic Tank/Sewage Disposal Regulations •••••• Estimated Number of Septic Tank/Drain Field Facilities for
County Rural Population and TDH Registered Haulers •••
Projected City Populations ••••••••••••••••• Projected Populations - County Unincorporated/Incorporated
Areas .................. . County and Census Division Projected Population
Densities ................ . Projected Basin Population by County ••••• County Solid Waste Projections/Landfill Requirements Potential Surface Water Supply and Projected
Requirements
Permit Requirements Regional Solid Waste Planning - Alternative No.1 Regional Solid Waste Planning - Alternative No.2 Regional Solid Waste Planning - Alternative No.3 Regional Solid Waste Planning - Alternative No.4 Regional Solid Waste Planning - Alternative No.5 Regional Solid Waste. Planning - Alternative No.6
v
1-2 1-3 1-5
11-3
11-5 11-7
11-11 11-14 11-21 11-23 11-24
11-28 11-32 11-38 11-44 11-45 11-49
II-51
111-3
111-5
111-7 111-9
111-18
111-21
IV-17 IV-58 IV-60 IV-62 IV-64 IV-66 IV-68
Number
V-I V-2 V-3 V-4
LIST OF TABLES (continued)
Title
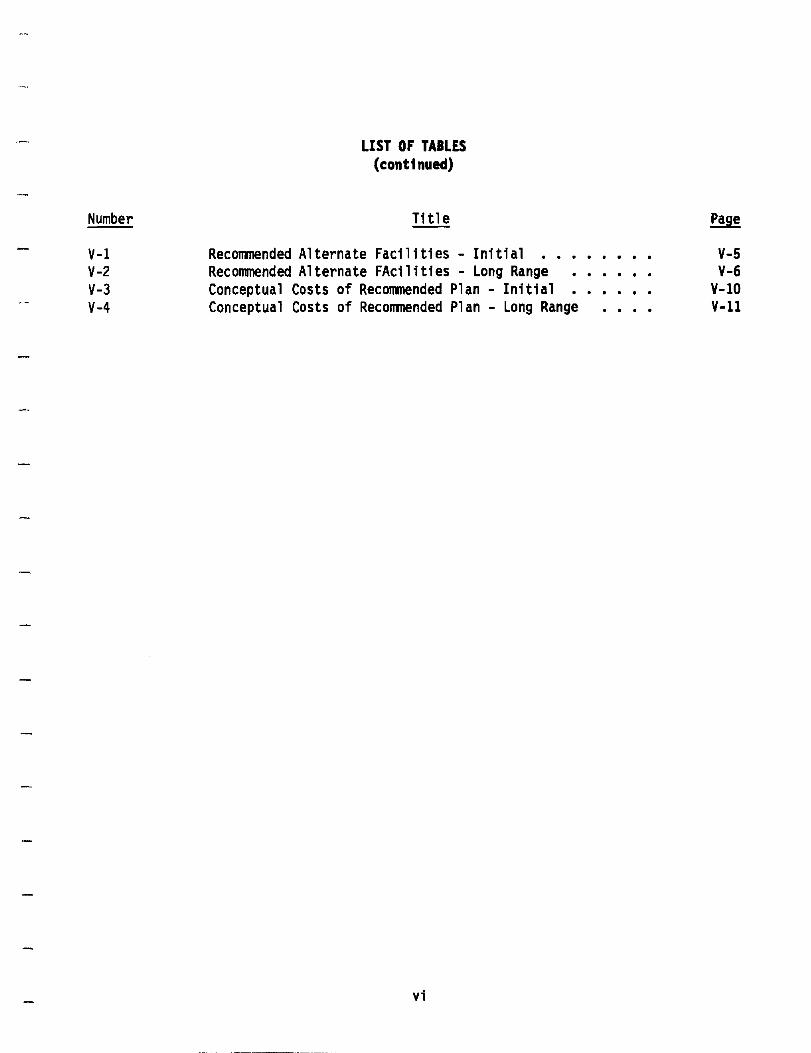
Recommended Alternate Facilities - Initial Recommended Alternate FAcilities - Long Range Conceptual Costs of Recommended Plan - Initial Conceptual Costs of Recommended Plan - Long Range
vi
V-5 V-6
V-IO V-ll

Number
I-I
II-I II-2 II-3 II-4 II-5 II-6
III-l 111-2 111-3
IV-l IV-2 IV-3 IV-4 IV-5
IV-6
IV-7
IV-8
IV-9
IV-I0
V-I V-2 V-3
LIST OF FIGURES
Title
Project Planning Area
County Census Divisions Existing Surface Water Resources Groundwater Aquifers •••••• Available Landfill Area vs. Planning Year - TDH Data Location of Existing Landfills ••••• Updated Landfill Area vs. Planning Year
Planning Area Projected Populations Planning Area Solid Waste Projections Future Surface Water Resources
Elements of a Modern Landfill Generalized Unit Costs of Transfer Stations Generalized Unit Costs of Landfills
. . . . Monthly Residential Charge vs. Equivalent Dollars Per Ton Regional Solid Waste Management Plan Layout -
Alternative No.1 •••••••••••• Regional Solid Waste Management Plan Layout -
Alternative No.2 ••.••••••••• Regional Solid Waste Management Plan Layout -
Alternative No.3 •••••••••••• Regional Solid Waste Management Plan Layout -
Alternative No.4 •••••••••••• Regional Solid Waste Management Plan Layout -
Alternative No.5 .••••••••••• Regional Solid Waste Management Plan Layout -
Alternative No.6 ••••••••••
2010 Solid Waste Loadings - County Census Divisions Recommended Plan Schematic Layout - Initial Recommended Plan Schematic Layout - Long Range ••
vii
. . . .
1-8
II-9 11-13 II-18 II-35 II-37 II-41
III-2 III-12 III-22
IV-17 IV-49 IV-51 IV-53
IV-59
IV-61
IV-63
IV-65
IV-67
IV-69
V-4 V-7 V-8

EXECUTIVE SUMMARY
This Plan was undertaken in response to the need to protect present and future water
suppl i es in the Sul phur Ri ver Basi n. Its purpose is to prevent water poll uti on from
improper waste disposal by developing a non-hazardous waste management plan for
10 counties which lie wholly or partially within the Basin: Bowie, Cass, Delta,
Frankl in, Hopkins, Hunt, Lamar, Morris, Red River and Titus. The planning period is
from 1990 to the year 2010. This work is funded by the Texas Water Development Board,
through a grant to the Sulphur River Basin Authority, and by participating local
governments and industries.
The report is presented in five chapters, outlined as follows:
INTRODUCTION
This chapter contains background information on the Sulphur River Basin Authority and
the need to protect water supplies through proper solid waste and sludge management.
Recent regulatory and legislative activities at the federal and state levels that make
solid waste management planning very timely are briefly outlined. Thirteen specific
tasks to be completed during the present study are outlined in the scope.
EXISTING CONDITIONS
Population figures are presented for 1980 and 1987 (the latest available figures).
Figures are presented for the following areas: the entire 10-county planning area, the
Sulphur River Basin area, each of the 56 cities in the planning area, and for each of
the 10 counties including the whole county, the unincorporated area only, and the 1980
census divisions. Population and housing densities are presented by county and by
census divisions within each county. The population of the 6,630 square-mile planning

ES-2
area was 316.850 in 1987. an increase of 9.6 percent since 1980. The basin-only
population was estimated at 161.330. up 7.7 percent from 1980. Sixty-one percent of
the population lives in cities. but there are only six cities with more than
10.000 residents. Thus the planning area is primarily rural.
The Sulphur River Basin is an excellent surface water resource for the State of Texas.
with potential for development of additional water supplies. Surface water quality is
generally good in the basin. according to Texas Water Commission data for the six
designated stream segments in the area. Existing water quality problems in the
Sul phur/South Sul phur Ri ver and Days Creek segments are bei ng addressed by
improvements in sewage treatment plants. The general characteristics of Wright Patman
Lake and Cooper Lake (under construction) are presented. as well as the
characteristics of the six aquifers contributing to the groundwater supply in the
Basin. Groundwater supplies are limited in further development potential and are of
marginal quality.
The amount of solid waste generated in the planning area is estimated to be
206.000 tons per year. of which 133.000 tons are generated in cities and 73.000 tons
in unincorporated areas. This is mixed residential. commercial. and industrial waste.
Separate estimates could not be made for industrial waste. but this is taken into
account by using a higher per capita generation rate for larger cities. Infonnation
regarding some 300 manufacturers in the area is presented.
There are 148 pennitted di schargers in the pl ann; ng area. whi ch produce an estimated
15.600 tons per year of water and wastewater treatment plant sludge. Current sludge
disposal practices rely heavily on land application or landfilling at treatment plant
sites.

ES-3
There are currently 34 permitted landfills in the 10-county planning area. but only 24
of these are active. The 24 active landfills have a combined area of approximately
907 acres and have expected closure dates that vary from 1990 to 2030. Pending
federal regulations are expected to drastically change this picture within the next
year. Only five landfills are expected to remain open once the regulations are
fi na 1 i zed. Of these. three are in Hunt County. and one each in Lamar and Titus
Counties. Their combined acreage would be 1.064 acres assuming planned expansions are
approved. Under this scenario. 81 percent of the landfill area would be under private
ownership. with 19 percent operated by public entities. This is a significant change
from the present rati o. whi ch is about 50 percent pri vate and 50 percent pub 1 i c.
About 52 percent of the study area is geologically suitable for landfilling.
Available information indicates that collection services are provided more frequently
by private operations than by local governments. About 10 percent of the cities and
probably much of the unincorporated areas offer no organized collection.
There is some on-site disposal of solid waste in the region which is a potential water
quality concern. This may be as much as 40 percent of the amount generated in rural
areas. Septic tank use is common in rural areas for on-site sewage disposal. The
number of septic tanks in the planning area is estimated to be about 33.000. which
produce an estimated seven mill i on gall ons per year of septage requi ri ng off-site
disposal. Some illegal disposal of sept age is thought to occur in the area and is a
current water quality concern.
FUTURE NEEDS
Population projections are presented for the 1990-2010 planning period. An increase
of 25 percent to 421.465 is expected for the planning area during the 20-year period.
Projected population and housing densities are also given by county and census

ES-4
division within each county. Population distribution within each county was assumed
to be simi 1 ar to that based on the 1980 census si nce more recent data were not
available, but this should be verified after the 1990 census is published.
Sol id waste projections have been made for the area and by county based on the
population projections and an assumed per capita generation rate based on size of
communities. The projected solid waste produced in the area will be 286,000 tons per
year by 2010; however if the EPA's National Waste Reduction Goal of 25 percent by the
year 1992 could be met, this amount would be reduced to 215,000 tons per year.
Assuming all solid waste is 1andfilled, 437 acres of landfill would be used by the
year 2010 with current generation rates; 338 acres would be required if the EPA
reduction goal were met. While both figures are well below the 1069 acres available
in the region, the landfills are concentrated in the western portion of the planning
area. This indicates that a system of transfer stations will be necessary, with
possible construction of at least one new landfill to service the eastern part of the
region.
The predicted future siting and operating criteria for landfills (Subtitle 0
Requirements) are outlined in detail. These requirements, expected to be adopted in
1990, will make 1andfi11ing a much more difficult and expensive solid waste disposal
option than it is now.
Wastewater treatment plants and new landfills under the stringent regulations will
cause even less water quality problems than in the past. Thus, the main concern
regarding future water quality in the region is illegal dumping of wastes. The impact
of illegal dumping is impossible to predict, but local governments can minimize it by
strong enforcement and public education programs.

ES-5
ALTERHATIVES
The Texas Legislature has outlined a preferred hierarchy of management techniques for
solid waste. It is:
1. Minimization of waste production
2. Reuse or recycling of waste
3. Treatment for energy or other resource recovery
4. Land disposal as the least preferred option
These management methods are discussed in detail.
Current available practices for the disposal of water and wastewater treatment plant
sludge are presented. These include management practices for beneficial reuse of this
material. Pending regulations affecting programs for sewage sludge reuse are also
briefly discussed.
An analysis of collection and transportation options for solid waste management is
presented.
Several permits may be required for solid waste facilities. These are summarized for
different types of facilities. The Texas Department of Health has primary
responsibility for permitting solid waste disposal or processing sites. but depending
on the type of facility. permits may be required from the Texas Air Control Board. the
Texas Water Commission. or local agencies.
Management alternatives for solid waste programs are discussed. Analysis is made of
the pros and cons of publi c ownershi p and operati on. publ i c ownershi p wi th private
operation. private ownership with public operation. private ownership and operation.

ES-6
and multijurisdictional approaches.
Financing alternatives for solid waste management projects are presented including the
following: general obligation bonds, revenue bonds, industrial development bonds,
leveraged leasing, current revenue financing, bank loans, and lease agreements.
Generalized cost criteria are presented, including analysis of
transportation/collection costs, intermediate processing (transfer station) costs, and
ultimate disposal costs. The total costs are related to residential fees, so that if
the total cost for collection, transportation, processing, and disposal can be
defined, this can readily be translated to a per-household cost.
Finally, six alternative regional solid waste management plans are outlined. Each
alternative divides the region into subareas and identifies which landfills would
service them and what transfer stations would be needed for collection and transport.
All the alternatives would require a system of regional landfills served by transfer
stations. For each alternative, the landfill acreage required and currently available
is presented by subarea.
RECOfI4ENDATIONS
The recommended regional plan is based on dividing the planning area and solid waste
di sposal requi rements into three subareas for i niti al development and four subareas
for long-range development. Each subarea is served by a 1 andfi 11 and one or more
transfer stations. Initially, the three subareas will be served by existing landfills
in Hunt, Lamar, and Titus Counties, and the fourth subarea will be created when a new
regional landfill is developed in Bowie County. All solid waste will be compacted
prior to ultimate disposal at the landfill, either at the appropriate transfer station
for its service area or by a compactor station located adjacent to the landfill for

ES-7
the di rect haul servi ce areas. Facil i ty site development costs are based on 2010
solid waste generation requirements for the appropriate service area and the initial
collection. equipment. and transfer operation costs are based on 1990 sol id waste
disposal requirements. A landfill tipping fee based on a modern landfill capable of
meeting all of the proposed Subtitle D requirements was utilized in the costing
analYSis. Projected costs per ton were equated to monthly residential charges based
on typical household solid waste generation quantities. Cost per ton ranged from
$52.10 to $140.90 for initial development which equated to a monthly residential
charge of $7.50 to $20.10.
It is recommended that the management of the solid waste disposal in the Sulphur River
Basin be a combination of different entities.
Overall regulation is the responsibll fty of the Texas Department of Health (TDH)
through their Regions 5 and 7. Region 5. located in Arlington. is responsible for
Hunt County. Region 7. located in Tyler. is responsible for the other nine counties.
The Sulphur River Basin Authority should work in conjunction with TDH to insure that
the water quality is protected.
Municipal solid waste collection is the responsibility of the city in incorporated
areas and of the county in rural areas for counties with population greater that
30.000. Cities and counties should provide for collection within their jurisdiction
either with their own forces or by arrangement with private entities. Several
counties in the study area have populations less than 30.000. However. all of these
counties should consider providing solid waste collection for all residents.
Transfer stations can be owned and operated by the local government. by a regional
entity. or by private enterprise but the ultimate responsfbi1ity belongs to the local

ES-B
government. Each city and county should insure that a transfer facility is available
for its constituents either by furnishing the service or by contract.
Both the public and private sectors are already involved in the management of
landfills in the region. Operations should continue and cities and counties in the
area should make long-term contracts with the landfill operator to insure disposal
space in the future.
The landfill southwest of Mount Pleasant is presently owned and operated by the City
of Mount Pleasant. Ownership and operation can be continued by the City. or it could
be transferred to a regional entity such as the Sulphur River Basin Authority (SRBA).
or some other special purpose entity for ownership/operation. Action will need to be
initiated to increase the load limits of the bridges and upgrade the roads leading to
the site to allow heavy transfer truck traffic an easier access.
Pl anni ng for the proposed 1 andfi 11 in Bowi e County shoul d be i ni ti ated as soon as
possible. The evaluation of a specifiC landfill site is beyond the scope of this
study. Because of the regi ona 1 servi ce provi ded by the proposed new 1 andfi 11. it is
important that planning for the facility be accomplished by a regional entity.
It is recommended that local governments adopt regulations and educate the public to
promote the proper disposal of waste.
All water and wastewater treatment plant operators should be encouraged to find a
beneficial use for the sludge. The cost for hauling waste sludges to municipal
landfills will be the responsibility of the operator and should not be considered in
this study.

ES-9
Regulations should be adopted by all counties and cities to insure that septic tanks
are properly installed and maintained. County sanitarians should be given the ability
and authori ty to enforce the standards. Waste water treatment pl ants shoul d be
required to provide for and accept septic tank waste for disposal. Septic tank waste
haulers should be held accountable for their loads.
Local regulations should be adopted and enforced to discourage illegal dumping. Law
enforcement officials should issue citations and collect fines for offenders.
Existing illegal dump sites will need to be cleaned up and disposed of in a permitted
1 andfill.
Local governments should adopt programs to encourage waste minimization. Some examples
include prohibiting grass clippings from landfills by regulation, encouraging
composting of yard wastes, encouraging citizens to buy products in recyclable
containers and those that create less waste.
Paper, aluminum, ferrous metal, plastic, and glass can all be recycled. Composting is
also an attractive alternate method of recycling because up to 80 percent of the
municipal waste stream consists of organic material. All of the above can be
implemented at the local level either voluntarily or by legislation.
There is no energy recovery program that makes economical sense for the Sulphur River
Basin area in the near future. However, local and regional governments should
continuously update technology and cost information because technologies are improving
and the cost of landfilling is increasing.

BACKGROUND
CHAPTER I
INTRODUCTION
The Sulphur River Basin Authority was established by the Texas Legislature in August
1985 to provide for conservation and development of the State's natural resources
withi n the Sul phur Ri ver Watershed. A li st of the present members of the Sul phur
River Bas1n Authority Board of D1rectors is included as Table 1-1. The Sulphur River
Basin is one of the few areas in Texas where major amounts of potential surface water
supply still remain to be developed. Previous studies indicate that. with adequate
reservoir storage. the basin may be able to provide as much as 1.4 million acre-feet
per year of dependable yield. Less than one fourth of that potential supply will have
been developed when construction of the U.S. Army Corps of Engineers' Cooper Reservoir
project is compl eted in 1991. The Texas Water Pl an outl; nes a program of reservo; r
constructi on to meet all in-basi n water requ; rements and to provi de approximately
485.000 acre-feet per year for export to other basins through the year 2030.
The protection of the quality of these valuable water resources in a "water-short"
state such as Texas is of utmost importance. Accordingly. the Texas Water Development
Board (TWDB) determined that the development and implementation of a non-hazardous
waste management program was necessary to adequately manage watershed runoff and to
protect the quality of exi sti ng and potenti al surface water and groundwater suppli es
in the Sulphur River Basin. On December 15. 1988. the Sulphur River Basin Authority
submitted a successful application to the TWDB for planning grant assistance to
prepare a non-hazardous waste management program to protect the water resources of the
Sulphur River Basin. Fifty percent of the cost is borne by participating local
governments and industries listed in Table 1-2.

TABLE I-I
SULPHUR RIVER BASIN AUTHORITY BOARD OF DIRECTORS
DISTRICT I: Bowie, Red River Counties
DISTRICT 2: Cass, Franklin, Morris, Titus, Hunt Counties
DISTRICT 3: Delta, Hopkins, Lamar Counties
-----------------
President Mr. C.B. Wheeler P.O. Box 1838 500 Texarkana National Bank Building Texarkana, Texas 75501 214-792-2848
Vice President Mr. William o. Morriss 518 Pine Texarkana, Texas 75501
Secretary/Treasurer Ms. Vatra Solomon P.O. Box 1218 Mt. Pleasant, Texas 75455 214-572-1887 512-463-0101 (Austin, Texas)
Mrs. Lanny R. Ramsey P.O. Box 382 Mt. Vernon, Texas 75457 214-537-4567
Mr. David Baucom 1308 Azalea Lane Sulphur Springs, Texas 75482 214-885-4256 (Home) 214-885-9537 (Office)
Mr. Curtis Fendley 554 Church Street Paris, Texas 75460 214-784-5353 (Home) 214-784-0836 (Office)

TABLE 1-2
CONTRIBUTIONS AND PLEDGES TO
SULPHUR RIVER BASIN AUTHORITY NON-HAZARDOUS SOLID WASTE MANAGEMENT PLAN
Contributions
Bowie County Red River County Frank1i n County Hopkins County Morri s County Hunt County Queen City Hughes Spri ngs Daingerfield New Boston Paris Detroit Avery Bogata C1 arksvi 11 e International Paper DeKa1b Maud Nash Avinger Lone Star Comnerce Sulphur Springs Mt. Pleasant Red River Army Depot Leary Texarkana Naples Hooks Mt. Vernon
Pledges
Ti tus County Bloomburg Wake Village Omaha Deport

1-4
Table 1-3 contai ns a li st of members of the steeri ng cOl1111i ttee from representati ve
sections of the region. They provided helpful insight and direction in the
development of the recommendations from a regional perspective.
In recent years, much legislation at both the federal and state levels has been
adopted to address the increasing solid waste problems. As a nation, America
generates more than 160 million tons of solid waste per year and the garbage deluge
coul d reach 193 mi 11 i on tons a year by 2000. Almost 80 percent of thi s amount is
landfilled, yet landfill capacity is decreaSing, as evidenced by a recent situation
whi ch i nvol ved a New York "gar-barge" that sail ed the East and Gulf coasts searchi ng
in vain for a dump site; the problem is fast approaching a critical stage. In
February 1988, the U.S. Environmental Protection Agency (USEPA) created the Municipal
Solid Waste Task Force to define the solid waste problem, identify potential solutions
and develop a framework to address these problems in coordination with States,
industry, and others. The Task Force adopted a preferred hierarchy for attacking the
solid waste problem. It includes, in order of preference, reduction of waste at the
source, recycling, incineration, and lastly landfilling. It recol1111ended a waste
reduction target of 25 percent through minimization and recycling programs.
The USEPA will soon finalize new regulations affecting solid waste landfilling. These
rul es, whi ch have stri ct techni cal requi rements desi gned to protect 1 and and water
resources and human health, will probably result in the closure of many existing
landfills and will cause .the cost of waste disposal to rise sharply.
Texas has placed increasing emphasis on solid waste management in recent years. A
Comprehensive Municipal Solid Waste Management, Resource Recovery and Conservation Act
was adopted in 1983 but was not funded for six years. In 1987, the State Legislature
mandated the following priority for solid waste management, to be considered in
planning to the maximum extent feasible: I} Minimization of waste production;

TABLE 1-3
STEERING COMMITTEE MEMBERS
Honorable Jamie Rawls, Mayor City of Queen City P.O. Box 301 Queen City, Texas 75572 214-796-7986
Mr. Van James, City Manager City of Mount Pleasant P.O. Box 231 Mount Pleasant, Texas 214-572-3412
Mr. Roger Powell, Planner City of Sulphur Springs 125 South Davis Sulphur Springs, Texas 75482 214-885-7541
Mr. Charles R. Wilcox, P.E. Environmental Engineer
Red River Army Depot Texarkana, Texas 75507 214-334-2111
Mr. Anthony Bethel, Registered Sanitarian
Paris/Lamar County Health Dept. 740 Sixth SW Paris, Texas 75460 214-785-4561
Ms. Elaine Wray, Regional Development Specialist
Ark-Tex Council of Governments P.O. Box 5703 911 U.S. Hwy 59 Centre West, Bldg. A Texarkana, Texas 75505 214-832-8636
Mr. Stuart Daniels, Asst. Director Texarkana Chamber of Commerce 819 State Line Avenue Texarkana, Texas 75501 214-792-7191
Mr. Bill Dean, Executive Director NE Texas Municipal Utility Division P.O. Box 955 Hughes Springs, Texas 75656 214-639-7538
Mr. Dwight Moss, Ad Hoc Member Manager, Technical Services
International Paper P.O. Box 870 Texarkana, Texas 75504 214-796-7101

1-6
2} Reuse or recycl i ng of waste; 3} Treatment for energy or other resource recovery.
and 4} Land disposal as the least preferred option. This is very similar to the USEPA
recommendations.
In 1988, Texas formed a Task Force on Waste Management Pol icy to develop speci fi c
recommendations to address the solid waste dilemma at the state level. Some of the
Task Force's recommendations have already been passed into law, including a small fee
per ton of waste disposed which will boost dramatically the enforcement and planning
budget of the Solid Waste Division of the Texas Department of Health. When available,
funds from this fee will be used to assist in the development of regional and local
solid waste management plans and to establish a state office of waste minimization and
recycling to provide technical assistance to local governments to develop programs.
Counties of over 30,000 population and all cities are required to ensure solid waste
services to citizens throughout their jurisdictions.
The severity and complexity of the solid waste problem requires the complementary use
of the four waste management practices of waste minimization, recycling, energy or
other resource recovery, and 1 andfi lli ng. thus the term II integrated waste management·
is used to describe this approach. To be most effective, an integrated waste
management system shoul d ensure that all parti cipants--governments, industry, groups
and associations. and ind1viduals--play active roles. Using such an approach. a
system can be designed for each locality to meet its needs, taking into account local
demographi cs and waste stream characteri sti cs. Proper pl anni ng ensures that each
waste treatment or disposal method complements rather than competes with other
methods.

1-7
PURPOSE
In accordance with the December 2, 1988, notice which appeared in the Texas Register,
the purpose of this project is to develop a regional plan to manage non-hazardous
waste in all or parts of Bowie, Cass, Morris, Titus, Red River, Franklin, Hopkins,
Delta, Lamar, and Hunt Counties comprising the Sulphur River Basin. Figure 1-1 shows
the Sul phur Ri ver Basi nand 10 counti es whi ch compri se the sol i d waste management
planning area. The plan will document service needs for mixed solid and recyclable
wastes, water and wastewater plant sludges, and septic tank waste; identify feasible
collection, transfer and hauling, and disposal alternatives, including alternatives
for reducing waste generation and resource recovery; establish facility design
criteria, preliminary locations for facility alternatives, and service frequency;
develop capital and operating cost estimates by implementation phase for feasible
alternatives; and assess financing and management arrangements to provide
non-hazardous waste management service. Planning shall be primarily for incorporated
and unincorporated cORlnunities and rural areas but may include non-hazardous waste
streams from industrial operations. The planning period for the project shall extend
from 1990 through the year 2010.
SCOPE
The scope of the project is to develop a non-hazardous waste management plan which
will identify specific measures, including disposal operations, that must be
implemented to prevent pollution of the basin's water resources by improper disposal
of waste. The plan will address disposal of solid waste (refuse), water and
wastewater treatment pl ant sl udge, and septi c tank waste. The scope of the project
i ncl udes the foll owi ng di scernabl e tasks in accordance with TWDB Contract
No. 9-483-721 between the TWDB and the Sulphur River Basin Authority:

/ -/. \ /
'"
t 0 5 10 20 HAHAH
SCALE IN MILES
FIGURE 1-) PROJECT PLANNING AREA
~

1-9
Examine Population and Demographic Patterns - Oevelop popul ati on projections
for counties within the Sulphur River Basin, excluding Fannin County, and for
the cities within these counties. Information from the TWOB, cities,
counties, the Ark-Tex Council of Governments, and the North Central Texas
Council of Governments will be utilized for this task.
• Determine Current and Future Waste Characteristics - Identify the
current and future waste
applicable to the study area.
generation rates and characteristics
The sources of the waste, whether from
res i dent i a 1, commerci a 1 or i ndustri a 1 generators, wi 11 be determi ned.
These will be used to project future (to the year 2010) waste
characteristics.
• Establish Criteria for Landfill Disposal - Establish criteria for
1 andfi 11 si ti ng, desi gn, and operati on. The criteri a wi 11 be based on
current and pending regulations. Special emphasis will be placed on
protecting the quality of surface water and groundwater supplies.
• Evaluate Existing Facilities - Identify and evaluate existing water and
wastewater treatment plants, and their sludge disposal practices in the
study area. An assessment of on-site sewage disposal facilities will
a 1 so be performed. Speci a 1 emphas is wi 11 be placed on the
determination of the potential hazards to surface water and groundwater
supplies.

•
•
1-10
Eval uate Future Non-hazardous Waste Disposal Al ternatives - Efforts
will focus on 1 andf1l1 di sposa 1 of non-hazardous waste, but
consideration will be given to resource recovery as a possible
alternative to provide for long-term disposal. Special emphasis will
be placed on the protection of future surface and groundwater in the
project area.
Evaluate Future 51 udge Disposal Al ternatives - Efforts will focus on
1 andfi 11 disposal of sludge, but consideration will be given to
resource recovery as a possible alternative to provide for long-term
disposal. Special emphasis will be pl aced on the protection of future
surface and groundwater in the project area.
• Evaluate Transportatfon Needs - Evaluate the cost of transporting waste
from the waste generation centers to disposal sites. The evaluation
will consider transfer stations as well as transportation reqUirements.
• Develop Cost Estfmates - Develop the probable costs associated with the
transport and disposal of waste in the Sulphur River Basin Solid Waste
Management Planning Area.
• Identffy Permft Requfrements - Identify the permits required to
implement the individual waste disposal sites but not to include any
permit applications.

1-11
• Select Disposal Alternatives - Select the most cost-effective waste
transport and disposal alternatives.
• Evaluate Management Alternatives - Identify and evaluate both private
and public entities that could implement and operate the waste disposal
system(s) and assess current local regulation of existing landfills as
well as on-site sewage disposal facil ities and identify entities to
enforce regulations as required.
• Project Communication/Coordination - Provide for project communication!
coordination with the incorporated cities. the counties. the Authority.
and the TWOB to promote adequate communication to enhance the qual ity
of the project to insure it properly addresses local needs.
• Prepare Report Prepare a report presenting the findings and
recommendations of this project.
The Solid Waste Management Planning Area considered in this study includes all
of the 10 counties listed above as opposed to the Sulphur Basin only. This is
because much information is available by county and also because future local
pl ans will encompass each county as a whole. Using the drainage basin divide
to describe the planning area would not accomplish the goals of the waste
management plan.

POPULATION
SlftIary
CHAPTER II
EXISTING CONDITIONS
This section presents population figures for 1980 and 1987. including the percent
change in popul ati on duri ng the seven-year peri od. Figures are presented for the
following areas: the entire 10-county planning area. the Sulphur River Basin area.
each of the 56 cities in the planning area. and each of the 10 counties including the
whole county. the unincorporated area only. and the 1980 county census divisions.
Population densities are presented by county and by census divisions within each
county.
Area Population and Economr
The population of the 10-county planning area. which includes 6.630 square miles. was
291.286 in 1980 and was estimated to be 316.851 in 1987. Of this number. about
149.800 were living within the Sulphur River Basin in 1980, increasing to about
161,330 in 1987. The largest city in the basin is Texarkana, with a 1980 population
of 31,262 in the Texas portion of the city, which grew to 33,000 in 1987. Existing
condition populations presented in this section are based on 1987 population estimates
published by the Ark-Tex Council of Governments (for nine counties) and the North
Central Texas Council of Governments (for Hunt County only).
The economy of the area is based primarily on agriculture, agribusiness, and to a
lesser extent on manufacturing, government employment. and tourism. Hopkins County is
one of the leading dairy counties in Texas. Mineral activities in the basin are
principally confined to Oil, gas, lignite, and clay production.

11-2
Cities
There are 56 incorporated cities in the 10-county area with a combined 1987 estimated
population of 193,717, or 61 percent of the planning area total. Of these,
approximately 15 percent reside in 38 communities of fewer than 2,000 people,
21 percent reside in 12 communities between 2,000 and 10,000 population, and
64 percent live in six cities of greater than 10,000 population. Of the
56 communities, only seven have populations of more than 5,000.
Table 11-1 shows EXisting Condition City Populations, including the 1987 estimates as
well as the 1980 Census data. It also gives the percent change in population from
1980 to 1987 for each city in the planning area. Cities are listed alphabetically by
county. The average population change from 1980 to 1987 was an increase of
9.6 percent; it varied from a decrease of 11.7 percent for Omaha in Morris County to
an increase of 65.9 percent for Reno in Lamar County. The population shown for
Texarkana is for the Texas portion only.
Counties
The 10-county area population was estimated at 316,851 in 1987, an increase of
8.8 percent from 291,286 in 1980. Table 11-2 shows the 1980 and 1987 populations of
each county as well as the percent change from 1980 to 1987. This information is also
broken down for the unincorporated and incorporated areas of each county.
Estimated 1987 population and housing densities per square mile are shown in
Table 11-3 for each county and for county divisions used in the 1980 census. These
county divisions are mapped in Figure 11-1. The county-wide population densities vary
from a low of 15 persons per square mile for Red River County to a high of 89 persons
per square mile for Bowie County. The county division densities vary from a low of

TABLE II-l
EXISTING CONDITION CITY POPULATIONS
1980-87 1980 1987 Percent
Ent ity Census Estimate Change
Bowie County DeKalb 2,217 2,163 -2.4 Hooks 2,507 2,617 +4.4 Leary 253 257 +1.6 Maud 1,059 1,100 +3.9 Nash 2,022 2,507 +2.4 New Boston 4,628 4,817 +4.1 Texarkana 31,262 33,000 +5.6 Wake Village 3,865 4,413 +14.2
Cass County Atlanta 6,272 6,352 +1. 3 Avinger 671 664 -1.0 Bloomburg 419 404 -3.6 Domino 249 234 -6.0 Douglassville 228 212 -7.0 Hughes Springs 2,196 2,281 +3.9 Linden 2,443 2,439 -0.2 Marietta 169 162 -4.1 Queen City 1,748 1,831 +4.7
Delta County Cooper 2,338 2,315 -1.0 Pecan Gap 250 243 -2.8
Franklin County Mount Vernon 2,025 2,117 +4.5 Winnsboro 862 1,028 +19.3
Hopkins County Como 554 613 +10.6 Cumby 647 690 +6.6 Sulphur Springs 12,804 14,461 +12.9 Tira 249 281 +12.9
Hunt County Caddo Mills 1,060 1,302 +22.8 Campbell 549 643 +17.1 Celeste 716 869 +21.4 Commerce 8,136 10,033 +23.3 Greenvi 11 e 22,161 27,750 +25.2 Lone Oak 467 529 +13.3 Neylandville 168 217 +29.2 Quinlan 1,002 1,240 +23.8 West Tawakoni 840 1,016 +21.0 Wolfe City 1,594 1,914 +20.1
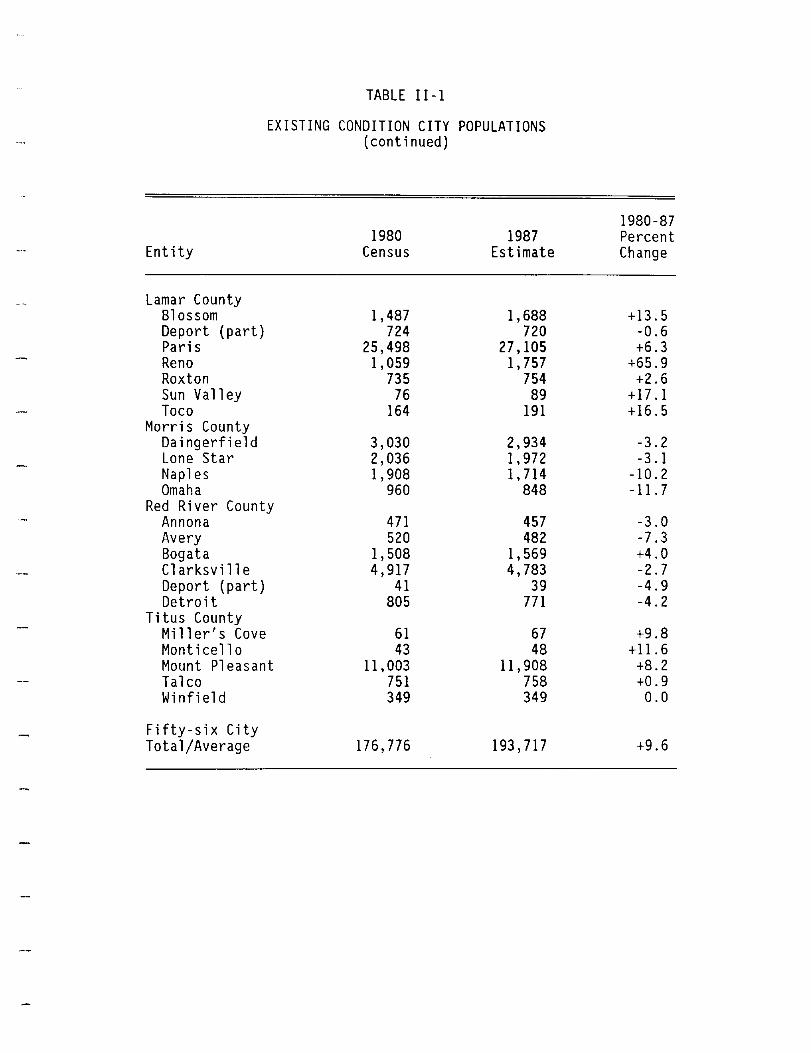
TABLE 11-1
EXISTING CONDITION CITY POPULATIONS (continued)
1980 1987 Ent ity Census Estimate
Lamar County Blossom 1,487 1,688 Deport (part) 724 720 Paris 25,498 27,105 Reno 1,059 1,757 Roxton 735 754 Sun Valley 76 89 Toco 164 191
Morris County Daingerfield 3,030 2,934 Lone Star 2,036 1,972 Naples 1,908 1,714 Omaha 960 848
Red River County Annona 471 457 Avery 520 482 Bogata 1,508 1,569 Cl arksvi 11 e 4,917 4,783 Deport (part) 41 39 Detroit 805 771
Titus County Miller's Cove 61 67 Mont i ce 11 0 43 48 Mount Pleasant 11,003 11,908 Talco 751 758 Winfield 349 349
Fifty-six City Total/Average 176,776 193,717
1980-87 Percent Change
+13.5 -0.6 +6.3
+65.9 +2.6
+17 .1 +16.5
-3.2 -3.1
-10.2 -11. 7
-3.0 -7.3 +4.0 -2.7 -4.9 -4.2
+9.8 +11.6 +8.2 +0.9 0.0
+9.6

TABLE II-2
EXISTING CONDITION POPULATIONS
COUNTY UNINCORPORATED/INCORPORATED AREAS
1980 1987 Census Estimate
Bowie County 75,301 79,137 City Population 47,813 50,874 Unincorporated Areas 27,488 28,263
Cass County 29,430 30,294 City Population 14,395 14,579 Unincorporated Areas 15,035 15,715
De lta County 4,839 4,857 City Popul ation 2,588 2,588 Unincorporated Areas 2,251 2,299
Franklin County 6,893 7,648 City Population 2,887 3,145 Unincorporated Areas 4,006 4,503
Hopkins County 25,247 28,588 City Population 14,254 16,045 Unincorporated Areas 10,993 12,543
Hunt County 55,248 68,829 City Popul ation 36,693 45,513 Unincorporated Areas 18,555 23,316
Lamar County 42,156 45,272 City Popul ation 29,743 32,304 Unincorporated Areas 12,413 12,968
Morris County 14,629 13,609 City Popul ation 7,934 7,468 Unincorporated Areas 6,695 6,141
Red River County 16,101 15,488 City Popul at ion 8,262 8,101 Unincorporated Areas 7,839 7,387
1980-87 Percent Change
+5.1 +6.4 +2.8
+2.9 +1.3 +4.5
+0.4 0
+2.1
+11.0 +8.9
+12.4
+13.2 +12.6 +14.1
+24.6 +24.0 +25.7
+7.4 +8.6 +4.5
-7.0 -6.2 -9.0
-3.8 -2.0 -6.1

TABLE II-2
EXISTING CONDITION POPULATIONS COUNTY UNINCORPORATED/INCORPORATED AREAS
(continued)
1980 1987 Census Estimate
Titus County 21,442 23,129 City Popul ation 12,207 13,130 Unincorporated Areas 9,235 9,999
Study Area Total 291,286 316,851 Study Area City Population 176,776 193,717 Study Area Unincorporated Areas 114,510 123,134
- --.-_ ... _-----
1980-87 Percent Change
+7.9 +7.6 +8.3
+8.8 +9.6 +7.5

TABLE II-3
COUNTY AND CENSUS DIVISION POPULATION DENSITIES
1987 ESTIMATES
County Census Persons Per Estimated Houses Divisions Square Mile Per Square Mile
Bowie County 89 37 Dalby Springs-Simms 13 5 DeKalb 26 12 Hooks 42 18 Maud-Ell iot Creek 39 16 New Boston 84 34 Texarkana 410 169
Cass County 32 14 Atlanta 67 28 Bivins-McLeod 16 7 Hughes Springs-Avinger 37 16 Linden 23 10 Marietta-Douglassville 13 6
Delta County 18 8 Cooper 34 16 Pecan Gap 7 3
Franklin County 26 12 Mount Vernon 25 11 Winnsboro 31 14
Hopkins County 36 16 Cumby 19 8 North Hopkins-Sulphur Bl uff 10 4 Pickton-Pine Forest 24 10 Seymour 21 8 Sulphur Springs III 50

TABLE II-3
COUNTY AND CENSUS DIVISION POPULATION DENSITIES
1987 ESTIMATES (continued)
County Census Persons Per Estimated Houses Divisions Square Mile Per Square Mile
Hunt County 83 35 Caddo Mills 43 17 Celeste 23 10 Commerce 142 63 Greenvi 11 e 162 68 Lone Oak 26 11 Quinlan 67 29 Wolfe City 43 19
Lamar County 51 22 Biardstown 10 4 Blossom 30 12 Deport 25 11 Howland 13 5 Paris 283 127 Powderly 24 9 Roxton 16 8 Sumner 14 5
Morris County 52 21 Daingerfield 77 30 Naples 32 14
Red River County 15 7 Annona-Avery 10 5 Bogata 16 7 Cl arksvi 11 e 41 18 Detroit 12 5 Manchester 4 2
Titus County 55 24 Cookville 25 10 Mount Pleasant 147 63 Talco 16 7 Winfield 30 13
----------------------

-'-
i i i
i i i i i
SUMNER
~ i i i i
LONE OAK I CUMBY
QUINLAN
L._._._._._._._._.
! I i
,._.L._._._ .
.I
i . i FranIdln Co.! . I I . i Iv.1NFlELD I .
PICKTON- • I PINE FOREST! i
!
f o 5 W ~ HA
SCALE IN IULES
1 I NAPlES
! I COO!<IIIU£ I MoITIa Co.l
Vi
ATLANTA
i I i DAlNGERFlELD \ :.:::::::::::::. \ UNDEN
. i
I .J,...._._._._._.
FIGURE II-I COUNTY CENSUS DIVISIONS
,
I
i
I --------------------------------------------------------)
II-I0
four persons per square mile for the Manchester Division in the northern part of Red
River County to a high of 410 persons per square mile in the Texarkana Division of
Bowie County.
aasin Area Only
Existing condition populations for the basin area only have also been estimated.
Table 1I-4 gives the basin population by county for 1980 and 1987 and indicates the
1980 through 1987 percent change. The 1984 Texas Water Pl an publi shed in November
1984 by the Texas Department of Water Resources indicated the 1980 basin population to
be 154,000 i ncl udi n9 Fanni n County. The Fanni n County porti on of the basi n was
estimated to include 4,200 persons based on 1980 Census County Subdivision data. This
amount was deducted from the total to give the 149,800 basin population for 1980 shown
in Table II-4. The Sulphur River Basin drainage area includes about 3,267 square
miles or 49.3 percent of the 10-county study area of 6,630 square miles and contains
about 50.9 percent of its 1987 estimated population.
WATER QUALITY AND QUANTITY
s ..... ry
The Sulphur River Basin is an excellent surface water resource for the State of Texas,
with potential for development of additional water supplies. Surface water quality is
generally good in the basin, according to Texas Water Commission data for six
designated stream segments in the area. Existing water quality problems in the
Sulphur/South Sulphur River and Days Creek segments which are influenced by municipal
discharges are being addressed by improvements in sewage treatment plants. The
general characteristics of Wright Patman Lake and Cooper Lake (under construction) are

TABLE 11-4
EXISTING CONDITION BASIN POPULATION BY COUNTY
SulQhur River Basin Portion 1980-87 Percent
County 1980 Census 1987 Estimate Change
Bowie 54,620 57,370 +5.0 Cass 7,560 7,790 +3.0 Delta 4,840 4,860 +0.4 Franklin 5,080 5,640 +11.0 Hopkins 21,310 24,130 +13.2 Hunt 17,440 21,750 +24.7 Lamar 13,240 14,220 +7.4 Morris 4,390 4,080 -7.1 Red River 12,940 12,450 -3.8 Titus 8,380 9,040 +7.9
Total/Average 149,800 161,330 +7.7

II-12
presented, as well as the characteristics of the six aquifers contributing to the
groundwater supply in the Basin.
Surface Water
The surface water resources of the pl anni ng area are excell ent, parti cul arly when
compared to other areas of Texas. Due to favorable hydrologic conditions, the Sulphur
River Basin is potentially one of the State's major water supply areas. Development
of these resources is being carefully considered as a source of supply in some of the
long-range water supply planning studies underway for densely populated areas of North
Central Texas.
The surface waters of the Sulphur River Basin are generally of good quality. Treated
municipal and industrial waste discharges are small, particularly in the western part
of the basi n where the North Sul phur, Hi ddl e Sul phur, and South Sul phur Ri vers
originate.
The Texas Water Commission has divided the Sulphur River Basin into six segmented
reaches totalling 261 stream miles and maintains six routine stream monitoring
stations within the basin. Appendix Tables A-I through A-5 present water quality data
for Segments 0301 through 0305, respectively, as excerpted from the Texas Water
Quality Inventory. Data are not yet available for Segment 0306 which was recently
designated for the upper portion of the South Sulphur River. Figure II-2 shows
locations of these stream segments. Water quality standards established by the Texas
Water Commission for the Sulphur River Basin are shown in Table 11-5.
No significant water quality problems are identified for two segments, the Sulphur
River below Wright Patman Lake and the North Sulphur River. In the other four

Co.)
)
\ \1 ~~
t o 5 10 20
SCALE IN WILES
Da.1IS O" .. .t
FIGURE II-2 EXISTING SURFACE WATER RESOURCES

TABLE II-5
SULPHUR RIVER BASIN WATER QUALITY STANDARDS
USES
v .. .. ... u ... ~
~ -"'" 0 SULPHUK IIVEI IASDI ~
......... ! .. ... 00: .. ... ... ...
~ .. - g
~ ~ u .. .... Q ..
~ ... .. u
~ e S ... Ii; ... ~ ...
~ S!CHDIT SEQUr !WE ~ IIUtIIU
0301 Sulphur River .. 1_ ""ilht ret_n Lake CR H 12Cl
0302 Wri,ht 'et8en Lake CR H rs 75
0303 Sulphur/South Sulphur Riyer CR H 8el
0304 OIlY. Creek CR I 525
0305 North Sulphur liYer. CR H 19~
0306 Upper South Sulphur Riyer CR I 8e ---_._---- ----
Source: Revisions to Texas ~Jater Quality Standards, Texas I~ater Commission, 1988. Legend: CR - Contact Recreation
H - High Quality Aquatic Habitat I - Intermediate Quality Aquatic Habitat
PS - Public Water Supply
CRlTEllA
-v "",v .. -.:: -c .. ,... ~: l! .! ::t ~ • II • .. 8 u." '" • -_ 0
~ 3 ~ ......... ... ." ... ... ....... . .. ...... ... z .... u -.. ..... ~ ~ (j
9 -1= u • 0 ~~ _ c
c ~ ~ .. 0
~ r. 5 : e ..... ~3 ~ ... . :0: ... >.'"
~ : o .. C>. ..... 0 Col ...
'" . 8~C ~: II> > ... '" . ... . fA >.
Q
~E .... ... ... '" • ~ ~
... ;J Q
I:!~ ] ~ ~ 100 500 5.0 6.0-8.5 200 90
75 400 5.0 6.0-8.5 200 90
180 600 5.0 6.0-8.5 200 93
75 850 4.0 6.0-8.5 200 90
475 1,320 S.O 6.0-8.5 200 9l
180 600 4.0 6.5-8.0 200 93

II-IS
segments, some violations of state water quality standards have been documented;
problems considered significant by the Texas Water Commission are the following:
Wright Patman Lake - occasional low dissolved oxygen and elevated pH.
Sul phur/South Sul phur River - low di ssol ved oxygen and el eva ted pH in about 15
percent of samples, and periodic high fecal coliform counts.
Days Creek - frequent low dissolved oxygen and periodic high fecal coliform
counts.
The occasional problems in Wright Patman Lake are attributed to overproduction of
algae, a cOl1l1lOn occurrence in Texas lakes. This does not impair the quality of the
lake water for public water supply purposes.
The water quality problems in the Sulphur/South Sulphur River and in Days Creek are
due to treated sewage effluent, non-point source runoff, and the sluggish nature of
the streams. New sewage treatment plants completed by the cities of COl11Tlerce and
Sulphur Springs are expected to result in improved water quality in the Sulphur/South
Sulphur River segment. Advanced sewage treatment facilities for the City of Texarkana
have been recently constructed, so water quality in Days Creek is also expected to
improve.
The amount of surface water available each year varies with climatic conditions.
Average annual runoff for the Sulphur River Basin in Texas during the 1941 to 1970
period varied from approximately 600 acre-feet per square mile in the western part to
1,000 acre-feet per square mile in the eastern most part of the basin. Lowest flows
in consecutive years for the 1941 to 1956 period occurred during 1955 and 1956, when
average annual runoff was 230 and 162 acre-feet per square mile, respectively.

11-16
Runoff rates in the western part of the basin were 146 and 124 acre-feet per square mile in 1955 and 1956, respectively.
Due to channel rectification of the North Sulphur River, floods in this stream differ
greatly from those in the South Sulphur River. Floods in the North Sulphur River
characteristically rise and fall rapidly, rarely go beyond bank full, and have high
flow velocities. The South Sulphur River and its tributaries have small main channels
and wide, timbered floodplains. Consequently, floodwaters have lower velocities and
extend beyond bankfull levels for long periods of time.
There are currently two major reservoir projects in the basin. as shown on
Figure II-2, one existing and the other under construction. They provide for a safe
annual water supply yield of about 369,000 acre-feet (329.5 MGD). Wright Patman Lake,
whose dam is located on the Sul phur Ri ver about ei ght mil es southwest of Texarkana,
was completed in 1956. It extends through portions of BoWie, Cass, Morris, Red River,
and Ti tus Counti es. The reservoi r has 145,300 acre-feet of conservati on storage at
elevation 220.0 feet MSL with an area of 20,300 acres. There are 2.5 million
acre-feet of flood control storage at elevation 259.5 feet MSL with an area of
119.700 acres. At normal level, the reservoir has an average depth of about 12 feet
with shorel i ne 1 ength of about 165 mil es and is an important recreati on resource in
the area. The U.S. Army Corps of Engineers has indicated that the annual number of
visitors has increased from about 100,000 in 1956 to about 2.5 million in 1986.
The project under construction is Cooper Lake, whose dam is located on the South
Sul phur River near Cooper. The impounded reservoi r will extend through porti ons of
Delta and Hopkins County and will include 310,000 acre-feet of conservation storage at
elevation 440 MSL with an area of 19,305 acres and 131,400 acre-feet of flood control
storage at elevation 446.2 MSL with an area of 22,740 acres. The project is scheduled
for completion in 1991.

II-17
Groundwater
Six aquifers are tapped for water supply throughout the planning area. Their
approximate locations are shown in Figure 11-3.
The Tri nity Group Aqui fer occurs in the western part of the Sul phur Ri ver Basi n.
Total thickness ranges to approximately 1.000 feet. Yields of large-capacity wells
drawing from the aquifer in adjacent basins average about 430 gallons per minute
(gpm). The quality of their water ranges from about 1.000 to 3.000 mg/L total
dissolved solids.
The Carri zo-Wil cox Aqui fer occurs in the south and eastern parts of the basi n.
Thickness ranges from about 500 to 900 feet. Yields of large-capacity wells average
about 275 gpm. but locally wells produce up to 700 gpm. Groundwater in the aquifer
generally contains less than 500 mg/L total dissolved solids.
The Woodbine Aquifer occurs in a small area in the western part of the basin. Total
thi ckness ranges from 400 to 600 feet. Yi el ds of 1 arge-capacity well s compl eted in
the aquifer in nearby basi ns average about 150 gpm wi th water qual i ty generally
exceeding 1.000 mg/L total dissolved solids.
The Blossom Sand Aqui fer occurs ina narrow band across the northern edge of the
basin. Maximum thickness is about 400 feet. Yields of high-capacity wells range
upward to a maximum of about 500 gpm. but the average yield of most wells is much
lower. The quality of water in the aquifer ranges from 1.000 to 3.000 mg/L total
dissolved solids.
The Nacatoch Sand Aqui fer occurs ina narrow band across the western part of the
basin. Total thickness ranges from 350 to 500 feet. It produces usable-quality water

-/ . \ j
~/
LEGEND
1///;::::1 Carrizo-Wilcox ~ Blossom Sand ~ Nocotoch Sand
CJ Queen City ~ Trinity OJ]] Woodbine
Co.)
o t 6 10 20
SCALE IN MILES
FIGURE II-3 GENERAL LOCATION OF
GROUt~D WATER AQUlf U,

11-19
in most places to a depth of about 800 feet. Maximum yields of large-capacity wells
reach 500 gpm but average considerably less. The water in the aquifer generally
contains less than 1,000 mg/L total dissolved sol ids, but sal inity increases with
depth.
The Queen City Aquifer occurs in the southeastern part of the basin. The aquifer
ranges to about 500 feet in total thickness. Well yields are generally less than 250
gpm. Water in the aquifer generally contains less than 500 mg/L total dissolved
solids; salinity increases with depth.
Water in the Carrizo-Wilcox and Queen City Aquifers in the Sulphur River Basin is
generally suitable for most purposes; however, both aquifers produce water with
relatively high iron concentrations. Water in the Queen City Aquifer is generally
corrosive, as is water in the Carrizo-Wilcox Aquifer. In some locations, the
concentration of fluoride in the Woodbine, Nacatoch, and Blossom Aquifers exceeds the
Interim Primary Drinking Water Standards promulgated by the Environmental Protection
Agency-Texas Department of Health.
Saline-water encroachment is a potential problem within the basin due to local heavy
withdrawals of groundwater from the Woodbine, Nacatoch, and Blossom Aquifers. As
noted, many wells in the planning area produce water above the 1,000 mg/L total
di ssol ved sol ids secondary standard ci ted in the Safe Dri nki ng Water Act. TDH
regulations allow the 1,000 mg/L TDS for municipal purposes only if a better quality
source is not available. Thus, future water needs should be supplied by surface water
development rather than increased groundwater use.

II-20
SOLID WASTE GENERATORS
Residential and Commercial
Infonnation was solicited from operating landfllls in the area during this study.
However, the responses received (contained in Appendix C) were inadequate to provide
definitive values for solid waste generation within the planning area. Insufficient
data was provi ded regardi ng popul at ions served and many of the smaller 1 andfill s do
not maintain weight records. Also, wastes from some localities are disposed of
outside the planning area while some landfills receive waste imported into the region.
Therefore, estimates of waste produced are based on population and assumed per capita
rates of generation.
Much of the solid waste generated in the 10-county planning area is domestic,
originating in urban residential and/or rural areas. As previously stated, there are
56 incorporated cities in the planning area which account for 61 percent of the total
area population. Of these, six cities have a population greater than 10,000. 12 have
a population between 2,000 and 10,000. and 38 have a population of 2,000 or less.
National studies have used a sliding scale of per capita generation rates based on
city size to estimate solid waste loading from community populations, as presented in
Table 11-6. Studies done by the Ark-Tex Council of Governments in 1979 utilized this
methodology.
The per capita rate of solid waste generation increases with city size; the generation
rate from the largest cities is 20 percent higher than that from the smallest. This
is due to greater amounts of commercial waste being generated in larger cities. The
smaller communities typically have only such commercial establishments as grocery
stores and service stations whereas the larger cities serve the region as trade,

TABLE 1I-6
ESTIMATED SOLID WASTE UNIT LOADINGS FOR VARIOUS SIZE CITIES
City Population
less than 5,000
5,000 - 19,999
20,000 - 99,999
Pounds Per Capita Per Day
3.3
3.6
4.1

U-22
educati onal. and health centers and have comnerci al establi shments to support these
activities. Some of the difference may also be due to the fact that not all solid
waste is disposed of in smaller cities and rural areas. whose residents may practice
limited on-site disposal.
These di fferenti al generati on rates were used to compute the amounts of sol id waste
produced in the study area during 1987. presented in Table 11-7. The estimated solid
waste quantities from the cities is about 64 percent of the total. Rural per capita
generation was estimated using the rate for the smallest cities. The total amount
produced in the study area is 206.000 tons per year. or 3.56 pounds per person per
day.
Industrial
Appendix B lists some 300 manufacturers by counties and cities in the 10-county
pl anni ng area accordi ng to the 1988 Edi ti on of the Di rectory of Texas Manufacturers.
Most of them are fairly small and do not significantly impact solid waste projections.
In Table 11-8. 37 manufacturers with annual sales above $10 million or more. their
1 ocati ons. and products are listed. The major i ndustri al soli d waste generators in
the planning area are International Paper Company in Cass County. Red River Army Depot
and Lone Star Army Ammunition Plant in Bowie County. Campbell Soup and Kimberly-Clark
in Lamar County. and Pilgrim's Pride and the Texas Electric Monticello Power Plant in
Titus County. Of these only Campbell Soup and Kimberly Clark utllize landfills
available to the public. The others operate their own landfills. Hopkins County is
one of the leading dairy counties in Texas. but most dairy wastes are disposed of
on-site.
Separate projecti ons for i ndustri a 1 sol i d waste were not developed due to 1 ack of
existing solid waste data for various types of generators as well as the generally

TABLE 11-7
1987 ESTIMATED SOLID WASTE LOADINGS
City Size Computed Tons Tons % Distribution Number Population Lbs Per Day Per Wk Per Yr Distribution
Less than 5,000 49 63,108 208,000 730 38,000 18
5,000 to 19,999 4 42,754 154,000 540 28,000 14
20,000 to 99,999 ~ 87,855 360,000 1,300 67,000 -.n Subtota 1, Cit i es 56 193,717 722,000 2,570 133,0001 65
Other Rural Unincorporated
73,0002 Areas 123,134 406,000 1,400 --B
Total, Cities and Unincorporated
206,0003 Areas 316,851 1,128,000 3,970 100
1Equivalent to an average of 3.76 pounds per person per day.
2Equivalent to 3.25 pounds per person per day per year.
3Equivalent to 3.56 pounds per person per day per year.

Location
Bowie County
New Boston Texarkana Texarkana Texarkana Texarkana Texarkana Texarkana Texarkana
Hopkins County
Como Dike Sulphur Springs Sulphur Springs Sulphur Springs Sulphur Springs Sulphur Springs Sulphur Springs
Hunt County
Commerce Commerce Greenville Greenville Greenville Greenville Greenville Greenville
Lamar County
Paris Paris Pari s Paris Paris
TABLE II-8
MAJOR MANUFACTURERS IN PLANNING AREAl
Manufacturer
International Paper Alumax Mill Products Borden, Inc. International Paper Kerr-McGee Mid South Bottling NL Baroid Picoma Industries
Warren Petroleum Phillips Petroleum Associated Milk Producers Borden, Inc. A.P. Green Refractories Northeast Texas Farmer's Coop. Ocean Spray Cranberries Rockwe 11 I nternat i ona 1
SNE Enterprises U.S. Brass E-Systems Inc. Fiberite Corp. Henson-Kickernick, Inc. Serv-Air Inc Walker-McDonald Co. Wing Industries
Babcock and Wilcox Campbell Soup Kimberly-Clark Merico Inc. Packaging UARCO Inc.
Product
Lumber Aluminum Sheets Dairy Products Cardboard Treated Wood Soft Drinks Drilling Supplies Pipe Fittings
Liquid Petroleum, Sulphur Liquid Petroleum, Sulphur Dairy Products Dairy Products Brick Livestock Feed Fruit Products Control Valves
Doors Brass Fittings Computer, Aircraft Parts Epoxy Resins Clothing Ai rcraft Parts Dri 11 Bits Doors
Boiler Products Canned Foods Disposable Diapers Cartons Business Forms

Location
Morris County
Daingerfield Lone Star
Red River County
Clarksville Cl arksvi 11 e
Titus County
Mount Pleasant Mount Pleasant Mount Pleasant
TABLE II-8
MAJOR MANUFACTURERS IN PLANNING AREAl (continued)
Manufacturer
Georgia Pacific Lone Star Steel
Red Kap Industries Scotch Craft Bldg. Products
Fluorcarbon Co. Kwik-Way Corp. Pilgrims Pride
Product
Roofing Products Steel Products
Clothing Aluminum Doors and
Windows
Wire Products Wood Millwork Poultry Products
IBased on annual sales of $10 million or more based on information from 1988 Directory of Texas Manufacturers.

11-26
rural nature of planning area. Also, generation of solid waste by industries is
directly related to their manufacturing production rates, and future production rates
depend on economic conditions which are not predictable. Non-hazardous industrial
waste is therefore assumed to be accounted for throughout the planning period by the
higher per capita generation rates used for larger cities in calculating
residential/commercial waste production. Hazardous waste is disposed of separately
and does not enter the waste stream considered in this plan.
Water and Wastewater Treatment Plants
Sludge Production
Sludge refers to the solids that are removed from raw water and wastewater (sewage)
during treatment. They are defined as municipal solid wastes by the state Solid Waste
Disposal Act and must be disposed of properly. Sludge from water treatment plants
contains fewer contaminants and is produced in smaller amounts than that from
wastewater treatment pl ants. Informati on regardi ng water and wastewater treatment
plant sludges for the study area is not readily available, and responses to
questionnaires distributed to permitted dischargers during the current study provided
only minimal data. (Copies of questionnaire response summaries received are found in
Appendix C).
Appendix Table C-l lists the TWC permitted water and wastewater treatment plants for
the study area by county and stream segment and estimates sludge produced based on
rates of 0.2 tons/MGD and 1.2 tons/MGD for water and wastewater treatment plants,
respectively. The listing includes 148 TWC permitted Waste Control Order dischargers
in the lO-county study area. Of these, 50 are municipalities, 22 are other local
agency or private plants serving domestic requirements, three are agricultural
di schargers, and the remai n; ng 73 are i ndustri a 1 di schargers. Of the 50 perm; tted

II-27
municipal dischargers, 48 are wastewater treatment plants, and two are water treatment
plants. The table also incl udes three municipal water treatment plants which do not
operate under a TWC Waste Control Order as point discharges are not made. Estimated
sludge producti on for these three pl ants are based on data furni shed by the current
study questionnaire.
Total estimated sludge production is about 15,600 tons per year for the lO-county
study area, of which 7,500 tons per year originate in the Sulphur River Basin proper.
This compares to 206,000 tons per year of total solid waste produced in the region.
Of the 10-county area sludge total, about 13,750 tons per year (88 percent) are from
wastewater treatment plants, and about 1,850 tons per year (12 percent) are from water
treatment plants. About 5 percent of the wastewater treatment plant sludge is
industrial and 95 percent is municipal or domestic. These quantities are estimates
only since they are based on "rule of thumb" sludge production rates in the absence of
more detailed information for each plant. Actual production rates may vary due to
plant size and efficiency of operation as well as characteristics of the wastewater or
raw water being treated.
Sludge Disposal
Questionnaires soliciting information on sludge disposal practices were sent to all
148 municipal and industrial water and wastewater permitted dischargers in the study
area, but only 46 responses were received. The responses, found in Appendix C, are
summarized in Table II-9. Most plants reporting dispose of their sludge on-site by
landspreading or landfilling. Of the 46 dischargers responding, only 9 (about
20 percent) stated that they dispose of sludge at off-site landfills. None indicated
a management program for reuse of sludge. Table II-9 also includes the permitted
plant flow rate (maximum monthly average) and permitted daily average BOD levels for
the responding wastewater treatment plants.

Pennit Owner number
Alumax 2742-001 Alumax 2742-002 Avery 10733-002 Avinger 10646-001 Bogata 10065-001 Caddo M1lls 10475-001
Campbe 11 Soup Cel este 10146-001 Commerce 10555-001 Commerce Daingerfield 10499-001 DeKalb 10062-002
Deport 10741-001 Detroit 10724-001 Greenville 10485-002 Hughes Spri ngs 10415-001 Hunt County Oil 11721-001 Kimberly Clark 2648-001
Lone Star 12411-001 Luxury Lodges 10981-001 Maud 10767-001 A.M. Miller 11750-001 Mt. PI easant 10575-002 Mt. Pleasant 10575-001
Mt. Pleasant Mt. Vernon 11122-001 Mt. Vernon 11122-002 North Texas
Comm. ColI ege 13070-001 New Boston 10482-001 PariS 10479-001
Pecan Gap 10744-001 Pl1 grim's Pri de 3017-001 Red River Army Depot 2206-001/203 Red River Army Depot 2206-001/203 Reno 12162-001 Roxton 10204-001
'WWTP - Wastewater Treatment PI ant ~aximum monthly average 'Daily average 'Pounds per day
TABLE II-9
CURRENT STUDY QUESTIONNAIRE REPORTED SLUDGE DISPOSAL PRACTICES
Type Plant eennit limits
plant' Flow rate' BOD' Sludge disposal method (MGD) (mg/L)
IMP O.OOS 1.3' Private hauler - location not available WWTP 0.127 Private hauler - location not available IMP 0.144 20 On-site landfill IMP 0.12 20 Cl ty landfill IMP 0.34 30 Facultative-stabilization ponds IMP 0.15 30 Not available
IMP 13.0 Land application IMP 0.0795 30 On-site landfill IMP 2.0 10 On-site landfill WTP 1.5 Ci ty landfill IMP 0.471 10 Lone Star landfill IMP 0.35 20 Land application
IMP 0.183 30 Not available IMP O.lOS 20 Land application IMP 4.23 20 North Texas Services landfill IMP 0.49 20 On-site landfill IMP 0.007 20 Greenvill e WWTP WTP 0.325 Bas Landf111
IMP 0.44 10 Ci ty landfill WTP 0.065 20 Texarkana IMP IMP 0.08 10 Not available IMP 0.038 20 Winfield WWTP WTP 0.40 20 Land application IMP 1.50 20 Land application
WTP 12.0 Ci ty I andf111 WTP 1.50 Ci ty I andf111 WTP 0.425 20 Ci ty I andf1ll
IMP 0.02 20 Land application IMP 0.60 20 Land application WTP 18.0 Land application
IMP 0.04 30 On-site landfill IMP 2.0 Land application IMP 3.0 250' On-site landfill WWTP 0.35 On-site landfill WWTP 0.261 20 Land application WWTP 0.10 20 Land application
WTP - Water Treatment Plant

Penn1t OWner number
Southwestern Electr1 c 01811-0301
UN Lone Star 13326-001 Talco 10869-001 Tenaska 03021-001 Texas H1ghway Dept. 11987-001 Texas H1ghway Dept. 12009-002
Texarkana Trey Corporat1on 00378-001 U.S. Government -
Camp Maxey 13249-001 West Tawokon1 11331-001 W1nf1eld 12146-001
TABLE II-9
CURRENT STUDY QUESTIONNAIRE REPORTED SLUDGE DISPOSAL PRACTICES
(cont 1 nued)
Type Plant eerm1t 11m1ts
plant' Flow rate' BOD' Sludge d1sposal method (MGD) (mg/L)
WWTP 1.425 Da1ngerf1eld WWTP WWTP 0.0065 20 Lone Star WWTP WWTP 0.125 20 On-s1te landf111 WWTP 0.36 Not avall ab 1 e WWTP 0.015 20 Land appl1cat1on WWTP 0.0075 20 Land appl1cat1on
IiTP 22.5 C1ty WWTP WWTP 0.345 Plant closed 1n 1985
WWTP 0.007 30 Stab111zat1on pond WWTP 0.30 10 On-s1te landf111 WWTP 0.084 20 On-s1te landf111
'WWTP - Wastewater Treatment Plant IiTP - Water Treatment Plant 'Max1mum monthly average 'Da11 y average 'Pounds per day

II-30
Regul atory authori ty for sludge management programs is di vi ded between the Texas
Department of Health (TDH) and the Texas Water Commission (TWC). Sludge disposed at
municipal landfills falls under TDH regulations. TDH also regulates land application
programs run by pri vate sl udge management compani es. TWC regul ates any compost
production and programs that apply sludge at wastewater treatment plant sites or other
land owned or leased by cities.
Vari ous possi b 1 e methods of sl udge di sposal are di scussed in Chapter IV. Sl udge
Disposal Alternatives. However. the 1 imited questionnaire response level (less than
35 percent) and data available on sludge disposal methods at existing plants has
accordingly provided limited input data required to evaluate sludge disposal
alternatives.
SOLID WASTE LANDFILLS
Sunaary
There are currently 34 pennitted landfills in the 10-county planning area. but only
24 of these are active. The 24 active landfills have a combined area of approximately
907 acres and have expected closure dates that vary from 1990 to 2030. Pendi ng
federal regulations are expected to drastically change this picture within the next
year. On ly fi ve 1 andfi 11 s are expected to remai n open once the regul ati ons are
final ized. Of these. three are in Hunt County. and one each in Lamar. Titus. and
Morris Counties. Their combined acreage would be 1.069 acres assuming planned
expansions are approved. Under this scenario. 81 percent of the landfill area would
be under private ownership. with 19 percent operated by public entities. This is a
significant change from the present ratio. which is about 50 percent private and
50 percent public.

1I-31
Current Landftll Status
During the initial studies of the 10-county planning area, some 40 landfill/dump sites
were identified. The 1987 Annual Facility Report published by the Texas Department of
Health (TDH) on July 25, 1988, indicates 34 permitted solid waste landfills listed in
Table 11-10. Of the 34 permitted landfills, seven have been closed according to the
TDH report. Two more were reported to be closed and one was reported to be i nacti ve
in responses received to questionnaires mailed as part of the current study. (Copies
of questionnaire response summaries are included in Appendix C).
The TDH Annual Report also indicates remaining landfill area and estimated closure
dates. The remaining 24 active permitted landfills in the 10-county planning area
have a combined area of approximately 907 acres based on the 1987 Annual Report.
However, approximately 65 percent of this amount is in Hunt County with nearly
30 percent in one large rural landfill operated by Wallace Hefner near Commerce. Two
counties, Delta and Hopkins, do not have any permitted landfills available and Red
River and Franklin Counties only have 10 acres of remaining permitted landfill area
each.
The closure dates for the active landfills vary from 1990 to 2030. It is interesting
to note that nine landfills, totaling 50 acres, are scheduled to close prior to 1995,
and three more, totaling 91 acres, are scheduled to close prior to 2000, together
representing approximately 15 percent of the remaining permitted landfill area.
Figure II-4 is a plot of the available landfill area versus planning year. Of
interest is that of the 907 acres remai ni ng in 1987, 445 acres or 49 percent is
included in the six landfills owned by private industry, and 462 acres or 51 percent
~ ~---------------

Service area
Bowie Count~
Texarkana Dekalb Maud Government Depot Government Depot New Boston
Cass Count~
Avinger Atlanta Linden Bloomburg County County County County Queen City Domino
Delta Count~
Cooper
Legend:
Permit No.
1022 650 756
1315 1313 576
285 359 530 387 879 882 883
1956 604 881
1014
TABLE II-10
PERMITTED SOLID WASTE LANDFILL DATA FROM 1987 TDH ANNUAL REPORT
Operator Type Status
Western Waste Ind. 5 0 Ci ty of Dekalb 1 A City of Maud 3 A Red Ri ver Army Depot 5 C Red River Army Depot 1 A City of New Boston 1 A
City of Avinger 3 A City of Atlanta 1 A City of Linden 2 A* City of Bloomburg 3 A Cass County - Pct. #3 3 A Cass County - McLeod 3 C Cass County - Pct. #1 3 A Cass County - Pct. #3 3 A City of Queen City 2 A City of Domino 3 A
City of Cooper 2 C
*Questionnaire response indicates landfill recently closed.
Landfill Type:
Landfill size Total Remain.
(acres) (acres)
(Transfer station) 15 6 20 8 Closed 40 5 96 18
2 1 10 2 50 13 4 1 3 2 Closed 2 1 3 3 36 23 2 1
Closed
1 - Municipal landfill serving a population equivalent of 5000 persons or more. 2 - Municipal landfill serving a population equivalent between 1500 and 5000 persons. 3 - Municipal landfills serving less than a population equivalent of 1500 persons. 4 - Landfill for construction debris. brush disposal. 5 - Separate solid waste processing sites. transfer stations.
Status:
A - Actively receiving waste C - Closed; not receiving waste o - Open; not actively receiving waste
Closure year
1992 1998
1989 2015
1989 1990 1999 1991 1993
1993 1995 2040 2000

Service area
Franklin Count.!:
Talco
Permit No.
862 Mount Vernon/County 563 County 1423
H02kins Count.!:
Sulphur Springs 209
Hunt Count.!:
Commerce/Greenville 421 Greenvill e 473 Greenvill e 1503
Greenville 475
Sulphur Springs and Greenvill e 1195 Celeste 1320
Legend:
TABLE 11-10
PERMITTED SOLID WASTE LANDFILL DATA FROM 1987 TDH ANNUAL REPORT
(continued)
Operator Type Status
City of Talco 3 A* City of Mount Vernon 2 A Kings Country 3 C
City of Sulphur Spri ngs 1 C
City of Commerce 1 A City of Greenville 4 C North Texas Services.
Inc. 1 A North Texas Service.
Inc. 1 A
Wa 11 ace Hefner 1 A Ci ty of Cel este 3 A
*Questionnaire response indicates landfill recently closed.
Landfi 11 Type:
Landfill size Total Remain.
(acres) (acres)
13 8 20 10 Closed
Closed
179 159 Closed
186 112
61 22
328 278 54 42
1 - Municipal landfill serving a population equivalent of 5000 persons or more. 2 - Municipal landfill serving a population equivalent between 1500 and 5000 persons. 3 - Municipal landfills serving less than a population equivalent of 1500 persons. 4 - Landfill for construction debris. brush disposal. 5 - Separate solid waste processing sites. transfer stations.
Status:
A - Actively receiving waste C - Closed; not receiving wlste o - Open; not actively receiving waste
Closure year
2012 2012
2030
2008
1994
2060 2016

Service area
Lamar Count~
County/Paris Paris
Morris Count;,:
Lone Star/ Daingerfield
Naples Omaha
Red River Count~
Cl arksvill e
T itus Count~
Mount PI easant/ County
Legend:
Permit No.
1454 144
316'
75 436
743
797
TABLE II-10
PERMIT~:D SOLID WASTE LANDFILL DATA FROM 1987 TDH ANNUAL REPORT
(continued)
Operator Type Status
B&B Equipment Co. 1 A City of Paris 1 C
City of Lone Star 1 A
Trabage Company 2 A Luther Davl1 n NA A
City of Clarksville 2 A
City of Mount Pleasant 1 A
*Questionnaire response Indicates landfill recently closed.
Landfill Type:
Landfill size Total Remain.
(acres) (acres)
129 BO Closed
41 35
30 13 100 20
20 10
97 55
1 - Municipal landfill serving a population equivalent of 5000 persons or more. 2 - Municipal landfill serving a population equivalent between 1500 and 5000 persons. 3 - Municipal landfills serving less than a population equivalent of 1500 persons. 4 - Landfill for construction debris, brush disposal. 5 - Separate solid waste processing sites, transfer stations.
Status:
A - Actively receiving waste C - Closed; not receiving waste o - Open; not actively receiving waste
'Final permit not yet issued.
Closure year
1996
2017
2001 2000
1992
2010

Q) .... ,Q
.!!l
1000-r----~----------------------------~
800
~ 907 Acres Remaining / • In 1987 @ 24 Landfills
. per T.D.H. Annual Report
Private - 445 Acres; 49% 5 Landfills Public - 462 Acres; 51 % 19 Landfills
.~ 600 -< «I
~ :3 .... ] j 400
200
O~.---.-------------r_----------~----~
1990 2000 2010
Planning Year
FIGURE II-4 AVAILABLE LANDFILL AREA VS. PLANNING YEAR
1987 T.D.H. DATA

II-36
is included in the 18 landfills operated by public entities. Figure II-5 shows the
locations of existing active landfills. Service areas based on information furnished
by TDH data and current study questionnaires are shown on Table 11-10.
There are no known cases of surface water or groundwater pollution from landfills in
the study area, but there is a potential risk of undesirable substances leaching from
them into surrounding waters. It is expected that the Environmental Protection Agency
will finalize new rules for landfills in 1990 (outlined in detail in Chapter III).
These rul es, desi gned speci fi call y to prevent water poll uti on from 1 andfi 11 s, will
impose much more stringent operation requirements on existing facilities. New sites,
and those which continue to operate under the new rules, will therefore pose even less
risk to water supplies than they do now. Landfills unable to comply with the new
regulations will have to close.
In light of this and other current influences contributing to the tentative nature of
landfill life, personnel from the TDH Regions 5 and 7 were contacted to verify and/or
update the information included in the 1987 TDH Annual Report. (Of the 24 active
1 andfill s i ncl uded in Tabl e II -10, fi ve are in Hunt County and TDH Regi on 5 and the
remaining 19 are located in TDH Region 7.) According to the updated information
received, only five of the 24 landfills would remain in operation after the pending
regulations are implemented. Therefore, Table 11-11 has been prepared to include
estimated solid waste landfill availability based on the updated information. Three
of the 1 andfi 11 s woul d be in Hunt County, and one each inTi tus County and Lamar
County.
Figure 11-6 shows estimated available landfill area versus planning year for this
updated information. A definite change from public to private ownership is reflected
in the estimated 1990 availability of 1,069 acres, of which 862 acres or 81 percent
are under private ownership at three landfills, and 207 acres or 19 percent are still

~ ~
A
@
LEGEND
Approximate area of unsuitable soils/geology for solid waste disposal per Bureau of Economic Geology
Location of existing landfill TDH permit number. Permit still pending for No. 316
Landfill expected to stay open after regulations
Co.) i 0.. A': 10 20 T
FIGURE II-5 EXISTING ACTIVE LANDFILLS

Servi ce a rea
Bowie Countl
Texarkana Dekalb Maud Government Oepot Government Depot New Boston
Cass Countl
Avinger Atl anta Linden Bloomburg County County County County Queen City Domino
Delta Countl
Cooper
Legend:
Landfill Type:
Penni t No.
1022 650 756
1315 1313 576
285 359 530 387 879 882 883
1956 604 881
1014
TABLE II-U
ESTIMATED SOLID WASTE LANDFILL AVAILABILITY 1987 ANNUAL REPORT DATA UPDATED BY
CURRENT INFORMATION FROM TDH
Operator Type
Western Waste Ind. 5 City of Dekalb 1 City of Maud 3 Red River Army Depot 5 Red River Army Depot 1 City of New Boston 1
City of Avinger 3 City of At lanta 1 City of Linden 2 City of Bloomburg 3 Cass County - Pct. #3 3 Cass County - McLeod 3 Cass County - Pct. #1 3 Cass County - Pct. #3 3 City of Queen City 2 City of Domino 3
Ci ty of Cooper 2
Updated Status
0 Will W1l1 C
Landfill size Total Remain.
(acres) (acres)
(Transfer station) close close
Closed Closed Will close
Will close Closed Closed Closed W1l1 close C Closed W1l1 close W1l1 close, may use as trans. W1l1 close W1l1 close
C Closed
1 - Municipal landfill serving a population equivalent of 5000 persons or more.
Closure year
stat.
2 - Municipal landfill serving a population equivalent between 1500 and 5000 persons. 3 - Municipal landfills serving less than a population equivalent of 1500 persons. 4 - Landfill for construction debris. brush disposal. 5 - Separate solid waste processing sites. transfer stations.
Status:
Updated status based on discussions with TDH personnel at Region 5 and 7 offices.
Alternative map reference numbers in last column are used on Figures IV-5 through IV-10.
Alter. Map Ref.
No.
33 29 30
28
18 19 21 20 23 25
22 24
8

TABLE II-11
ESTIMATED SOLID WASTE LANDFILL AVAILABILITY 1987 ANNUAL REPORT DATA UPDATED BY
CURRENT INFORMATION FROM TDH (cont i nued)
Pennit No.
Updated Landfill size Servi ce area Operator Type Status Total Remain.
(acres) (acres)
Frankli n County
Talco 862 Mount Vernon/County 563 County 1423
Hopkins County
Sulphur Springs 209
Hunt County
Commerce/Greenville 421 Greenville 473 Greenville 1503
Greenville 475
Sulphur Springs and Greenvill e Celeste
Legend:
Landfill Type:
1195 1320
City of Talco City of Mount Vernon Kings Country
Ci ty of SuI phur Springs
City of Commerce City of Greenville North Texas Services,
Inc. North Texas Service,
Inc.
Wall ace Hefner City of Celeste
3 2 3
1
1 4
1
1
1 3
Closed IIi11 close C Closed
C Closed
A 179 C Closed
A 186
11111 probably close
A 328 11111 close
159
112'
250'
1 - Municipal landfill serving a population equivalent of 5000 persons or more. 2 - Municipal landfill serving a population equivalent between 1500 and 5000 persons. 3 - Municipal landfills serving less than a population equivalent of 1500 persons. 4 - Landfill for construction debris, brush disposal. 5 - Separate solid waste processing sites, transfer stations.
Status:
Updated status based on discussions with TDH personnel at Region 5 and 7 offices.
A - Actively receiving waste
'Pennit amended in 1988 to increase depth of fill from 15 feet to 24 feet.
'Site development plan filed in 1988 indicates site would have about 20-year life. However, landfill operator is currently not in compliance with all TDH requirements.
Alternative map reference numbers in last column are used on Figures IY-5 through IV-10.
Closure year
2030
2010
2060
Alter. Map Ref.
No.
10 9
7
1
3 4

TABLE IJ-ll
ESTIMATED SOLID WASTE LANDFILL AVAIlABILITY 1987 ANNUAL REPORT DATA UPDATED BY
CURRENT INFORMATION FROM TDH (continued)
Permit No.
Updated landfill size Service area Operator Type Status Total Remain.
(acres) (acres)
Lamar Count:t
County/Paris 1454 B&B Equipment Co. 1 A 500' 500 Paris 144 City of Paris 1 C Closed
Morri s Count:t
Lone Start 316' City of Lone Star 1 Will close Daingerfield
Napl es 75 Trabage Company 2 Will close Omaha 436 Luther Dav 11 n NA Closed
Red Ri ver Count:t
Clarksvi 11 e 743 Ci ty of Cl arksvi 11 e 2 Will close
Titus Count:t
Mount Pleasant/ 797 City of Mount Pleasant 1 A 97 4B-County
Legend:
Landfill Type:
1 - Municipal landfill serving a population equivalent of 5000 persons or more. 2 - Municipal landfill serving a population equivalent between 1500 and 5000 persons. 3 - Municipal landfills serving less than a population equivalent of 1500 persons. 4 - landfill for construction debris, brush disposal. 5 - Separate solid waste processing sites, transfer stations.
Status:
Updated status based on discussions with TDH personnel at Region 5 and 7 offices.
A - Actively receiving waste
'Permit amended in 1988 to increase from original size of 129 acres to 500 acres. Indicated ultimate plans for site to include total area of 1,100 acres to occupy much of old Camp Maxey Military Reservation in Lamar County.
'Final permit not yet issued.
'Does not include 46 acres in permit application process.
Alternative map reference numbers in last column are used on Figures IY-5 through IV-10.
Closure year
2010
2010
Alter. Map Ref.
No.
39 38
14
16 15
34
13

-00 e o -< Q)
:0 ..!!l ..... ~ -< cO
1300 -,----
1200
1100
1000
900
800
700
600
1069 Acres Available in 1990 (5 Landfills) Private - 862 Acres: 81% (3 landfills) Public - 207 Acres: 19% (2 Landfills)
~ , . ·1·,
I , I , I ,
·············1·· ..... \ .. I , I , ____ Estimated Impact I , of Expansion of TDH
...•... .... \. 1454 in Lamar Co. I 'by 600 acres as I \ discussed with TDH. 1 ,
..... I.....,: .. I , : 1 \ 1 .
.. 1....... . ..... . 1 1 I
.. 1 .. 1
~ 500 ... ~ ........ .
--..... ..... -g j 400
300
200 ................... " .................. ~ ..
100
o~---~------~-----------~--~
1990 2000 Planning Year
FIGURE II-6
2010
UPDATED AVAILABLE LANDFILL AREA VS. PLANNING YEAR 1989 VERBAL T.D.H. UPDATE

11-42
operated by public entities at three landfills. This figure also assumes expansion of
the B&B 1 andfi 11 as planned by the current owners. However. cont i nued opera t i on of
the Lone Star Municipal Landfill is not definite as it is still operating under a
permit application and not an issued permit. Also shown in Figure 11-6 is a plot of
the 1 andfi 11 area requi rements for the sol i d waste projecti ons developed in
Chapter III. Existing landfill area adequacy will be discussed in more detail in
Chapter III.
Geologic Suitability of Landfill Sites
Generalized boundaries of approximate locations of suitable soils/geology for solid
waste disposal are also indicated on Figure II-5. This information was taken from
"Land Resources of Texas· published by the Bureau of Economic Geology (1977). The
suitable areas in the planning region generally include mineral land units noted as
B-3. B-7. C-l and C-5 in that document. Exceptions to areas indicated as suitable may
occur along stream valleys and other isolated locations but generalized lines do not
show this much detail. Likewise. there may be some isolated suitable areas within
broadly-outlined non-suitable areas on Figure II-5. The four suitable mineral land
units are briefly described below.
Mineral Land Unit
B-3
B-7 C-l C-5
General Material Description
Potential Cement Material
Ceramic Clay and Lignite Coal Expansive Clay Mud Sand and Mud (Undifferentiated)
Use for Solid Waste Disposal
Significant Problem Possible or Likely
Significant Problems Unlikely Significant Problems Unlikely Possible Problems
The general use ratings indicated are based on the natural capacity for infiltration
of the material. This can be improved by special planning. technology and

11-43
construction methods. The suitability of the B-3 material should be examined more
closely on a site-specific basis as infiltration capacity is generally shown to be
moderate and 1 oca 11 y fracture contro 11 ed. The i nfi ltrati on capaci ty of the other
three units is indicated as low or low to moderate.
The Bureau of Economic Geology Publication cited above also gives the aerial extent of
land or mineral resource units. The percent coverage for the four suitable mineral
1 and uni ts in the 10 counti es in the study area was found to be about 52 percent
distributed by county as indicated in Table 11-12.
Solid Waste Haulers
According to studies made by the Ark-Tex Council of Governments in 1979. the usual
solid waste collection procedure in the study area is vehicle pick-up at the residence
or business and transportation direct to a landfill. However. there is much variation
among cities regarding provision of service. Some cities run their own collection
servi ce and mai ntai n publ i cly-owned 1 andfi 11 s. Other ci ti es are served by pri vate
enterprise for either collection or disposal services or both. There may be more than
one collection service provider per city. and the landfill operator does not always
provide collection. City size has little bearing on whether service provision is
public or private.
In 1986. a survey was conducted by the East Texas State University at Texarkana to
determi ne then-current methods of coll ecti on. haul i ng. and di sposa 1 of sol i d waste.
Table 11-13 sUlllTlarizes results of that study by county and city responding to their
survey. Data from Lamar County is based on the 1979 Ark-Tex Council of Government
information since it was not obtained in the ETSU-T survey. Of the 43 cities for
which information is available. 32 percent offer public collection service. 58 percent

TABLE 11-12
PERCENT COVERAGE OF SUITABLE/UNSUITABLE MINERAL LAND UNITS IN STUDY AREA PER LAND RESOURCES OF TEXAS,
BUREAU OF ECONOMIC GEOLOGY, 1977
Percent Coverage! County Suitable Unsuitable
Bowie 57 43 Cass 13 87 Delta 67 33 Franklin 66 34 Hopkins 76 24 Hunt 43 57 Lamar 66 34 Morris 33 67 Red River 53 47 Titus 61 39
Weighted Average 52 48
Ipercent coverage based on area of coverage shown for mineral land unit B-3, B-7, C-1, and C-5 in each county divided by total land area of each county.

TABLE 11-13
SUMMARY OF SOLID WASTE HAULER SURVEY INFORMATION
CollectorLHauler Disposal at Local Location Public Private City Landfill
Bowie County DeKalb Yes No Yes Hooks Yes No No Leary No Yes No Maud Yes No Yes Nash No Yes No New Boston Yes No Yes Texarkana No Yes No Wake Village No Yes No
Cass Countl Atlanta Yes No Yes Avinger No 1 Yes Bloomburg No Yes 2 Yes Domino No 1 Yes Douglassville 4 4 4
Hughes Springs No Yes No Linden Yes No Yes Marietta5 No No No Queen City No Yes Yes
De lta County Cooper No Yes No Pecan Gap 4 4 4
Franklin County Mount Vernon Yes No Yes Winnsboro Yes No No
Hopkins County 4 4 4 Como
Cumby No Yes No Sulphur Springs No Yes No Tira 4 4 4
Hunt County 4 4 4 Caddo Mills
Campbell 4 4 4
Celeste Yes No Yes Commerce No Yes Yes Greenvi 11 e No Yes No Lone Oak 4 4 4
Neylandville 4 4 4
Quinlan No Yes No West Tawakoni 4 4 4
Wolfe City No Yes No

TABLE 11-13
SUMMARY OF SOLID WASTE HAULER SURVEY INFORMATION
(continued)
Collector/Hauler Disposal at Local Location Public Private City Landfill
Lamar County6 Blossom Deport Paris Reno Roxton Sun Vall ey Toco
Morris County Daingerfield Lone Star Naples Omaha
Red River County Annona Avery Bogata Cl arksvi 11 e Detroit
Titus Countl Mi 11 er' s Cove Monticello Mount Pleasant Talco Winfield
No Yes
No No No
4
4
Yes Yes
No No
No No No No No
4
4
Yes Yes
No
Yes No No No
Yes No Yes No Yes No
4 4
4 4
No No No Yes
Yes No Yes No
Yes No No l Yes
Yes No Yes No Yes? No
4 4
4 4
No Yes No Yes
Yes No
1 Residents must take their own trash to landfill. 2 Residents may take their own trash to landfill or have
it picked up by private contractors not under city control.
3 Cass County operates four county landfills for rural area and smaller communities.
4 Information not available. 5 Small rural community; has no solid waste program. 6 B & B Landfill which serves Paris also serves other
smaller communities and rural areas of Lamar County. ? Residents take trash to central collection point where
it is picked up by contractor. 8 Mount Pleasant landfill available to residents of
Titus County.

II-47
are served by pri vate haul ers, and the remai nder have no organi zed coll ecti on - i. e.
resi dents take thei r own trash to the 1 andfill • Responses to questi onnai res recei ved
during the current study generally confirmed the ETSU-T survey results.
ON-SITE DISPOSAL
Solid Waste
Due to the rural nature of the study area, some of the domestic solid waste in
unincorporated areas is disposed on-site, either by burning or by land disposal.
Pri or studi es have shown that thi s may be as much as 40 percent of the amount
generated. This is true particularly for large landowners, who have available area to
dispose of solid waste or may reuse it as part of agriculture or livestock operations.
As discussed in Chapter II, there are 38 communities in the study area with a
population of 2,000 or less, and some on-site disposal in these areas is also likely.
On-site disposal is a concern. Open burning of trash may cause air quality problems.
Improper land disposal may lead to trash being washed into surface waters or onto
other property. Controls would be desirable but may be difficult to enforce in rural
areas on private property. Public education efforts could help reduce this problem.
Septic Tank Waste
On-site disposal of sewage is used in the more rural portions of the planning area
where organized wastewater collection systems are not available. In the septic
tank/drain field system, the tank itself serves as a settling basin and removes about
50 percent of the particulate solids. The overflow from the tank into the absorption
field is a potential source of nonpoint pollution but if the field is properly sized
and installed in adequately draining soils the problem should be minimal. House Bill

II-48
No. 1875 gives the TDH supervision and authority over the location, design,
construction, installation and proper functioning of on-site sewage disposal systems.
The House Bill also permits the TDH to delegate the responsibility to local
responsible government entities. However, only three counties in the area have been
delegated the authority: Cass, Hunt and Lamar (Table 11-14).
Proper operation and maintenance of septic tanks requires that settled solids be
removed from the tank as needed. Removal should be done by a registered septic tank
cleaning service certified by the Texas Department of Health to remove and transport
the septage/s1 udge to an approved poi nt of di sposa1, normally a wastewater treatment
pl ant. It then becomes part of the wastewater treatment pl ant sl udge requi ri ng
processing or disposal.
The TDH requires that the registered waste transporter file an annual report
indicating the amount of septage handled as well as pOints of collection and disposal.
Unfortunately, the response to these requirements has not yet developed to the point
of providing meaningful data, and it is felt by some TDH personnel that substantial
amounts of septage are disposed of illegally. The TDH recently initiated a program to
inform citizens with septic tanks of their responsibility to operate them properly and
to use only TDH-registered cleaning services. TDH also publishes required septic tank
design criteri a; minimal sludge production should result from properly designed and
operated systems.
Nati onwi de, EPA estimates as much as 4 bi 11 i on gall ons per year of septage are
produced. The annual amount is about 65 to 70 gallons per person for properl y
functioning systems according to studies by Kolega and Dewey. Recomnendations for
frequency of pumping vary from 2 to 5 years.

TABLE II-14
COUNTY SEPTIC TANK/SEWAGE DISPOSAL REGULATIONS
Regulations County Sanitarian/ County In-Place Health Officer
Bowie No Cass Yes David Fant
(214) 756-7051 Delta No Franklin No Hopkins No Hunt Yes Jay Coddle
(214) 455-1761 Lamar Yes Paris/Lamar County
Hea lth Dept. (214) 785-4561
Morris No Red River No Titus No
Source: Telecon with Texas Department of Health -Regions 5&7
Does not include any city ordinances.

II-50
There are no statistics avallable regarding numbers of septic tanks in the planning
area, so estimates have been made. These estimates assume that 80 percent of the
unincorporated area population uses septic tanks, and assumes an average of 3 persons
per household each producing 70 gallons of septage per year. The total number for the
planning area is estimated to be 32,840. Estimated septic tank numbers by county are
listed in Table 11-15. The total number of TDH registered septic tank/sludge haulers
in the study area is only 21. The number of registered haulers in each county is also
shown in Table 11-15.
Data on hauling capacity of the septic tank/sludge haulers in the planning area is not
available. However, based on the assumption that the 21 registered haulers could each
handle an average of approximately 2,000 gallons per day and work about 200 days per
year; they could handle about 8.4 million gallons per year. This would be adequate to
handl e the projected vol ume of septage estimated to be approximately 6.89 mi 11 ion
gallons per year in Table 11-15.

County
Bowie Cass Delta Franklin Hopkins Hunt Lamar Morris Red River Titus
Total
TABLE 11-15
ESTIMATED NUMBER OF SEPTIC TANK-DRAIN FIELD FACILITIES FOR COUNTY RURAL POPULATION AND TDH REGISTERED HAULERS
1987 Estimated Estimated Rural Number of Septic Septage
Population Tank Faci 1 it i es1 Produced2 (mg/yr)
28,263 7,535 1.58 15,715 4,190 0.88 2,299 615 0.13 4,503 1,200 0.25
12,543 3,345 0.70 23,316 6,220 1.31 12,968 3,460 0.73 6,141 1,640 0.34 7,387 1,970 0.41 9,999 2,665 0.56
123.134 32,840 6.89
Number of Registered
Haulers3
4 0 0 0 4 6 4 2 0 1
21
lAssuming that 80% of rural population is served by septic tank facilities and 3 persons per rural household on septic tank facility.
2Septage estimated based on 70 gallons per year per capita for estimated rural population served by septic tanks.
3Texas Department of Health data as of November 30, 1989.

POPULATION
CHAPTER III
FUTURE NEEDS
Thi s secti on presents popul ati on projecti ons for the 1990-2010 pl anni ng peri od. The
projections are based on the Texas Water Development Board - High Series projections
and are shown on Figure III-1 for the 10-county planning area. Projected population
densities are also given by county and census division within each county. Population
distribution within each county was assumed to be similar to that based on the 1980
census since more recent data were not available. but this should be verified when the
1990 census data is available.
Cities
Population projections. given in Table III-I. exist for only 29 of the
56 incorporated cities in the planning area. However. these 29 accounted for
93.5 percent of the 1987 population of the 56 conmunities. The 1990 projected
population of the 29 cities is 181.761 and is estimated to increase by about
25 percent to 226.961 over the 20-year planning period. The minimum percentage
increase projected for the 20-year peri od is 10.8 percent for the City of Cooper in
Delta County while the maximum percentage increase is 43 percent for Mount Vernon in
Franklin County. Populations of the remaining 27 incorporated conmunities will
probably increase at or below the rate of increase for the county in which they are
located.

500-r----~--------------------------_.
450
,-... In
"0 C
400 <Il In ~ 0
..c Eo-<
----C 0 ..... ...., <Il -~ 350 Po. 0
0...
300
250-r,---r-----------.------------r--~
1990 2000 2010
Planning Year
FIGURE III-1 PLANNING AREA PROJECTED POPULATIONS

Entity
Bowie County DeKalb Hooks Maud Nash New Boston Texarkana Wake Vi 11 age
Cass County Atlanta Hughes Springs Linden Queen City
Delta County Cooper
Franklin County Mount Vernon Winnsboro
Hopkins County Sulphur Springs
Hunt County Caddo Mills Commerce Greenville Quinlan Wolfe City
Lamar County Blossom Paris Reno
Morris County Daingerfield Lone Star Naples
Red River County Bogata Cl arksvi 11 e
Titus County Mount Pleasant
Twenty-nine City Total/Average
1 Limited to cities
TABLE III-1
PROJECTED CITY POPULATIONS 1
1990 2000
2,185 2,345 2,636 2,934 1,236 1,338 2,555 3,037 5,371 6,347
33,960 38,038 4,602 5,771
6,753 7,904 2,705 3,012 2,409 2,608 2,111 2,493
2,206 2,375
2,477 2,998 890 1,020
15,560 17 ,307
1,498 1,652 7,369 8,129
25,688 28,327 2,187 2,665 1,710 1,884
2,115 2,279 26,738 28,712 1,244 1,339
2,874 3,169 2,268 2,737 1,883 2,187
1,550 1,612 4,682 4,869
12,299 13,485
181,761 202,573
2010
2,610 3,266 1,490 3,380 7,066
42,351 6,424
8,585 3,270 2,833 2,707
2,445
3,543 1,134
19,269
1,868 9,196
32,045 3,013 2,131
2,581 32,535
1,518
3,710 3,203 2,559
1,755 5,304
15,170
226,961
for which TWDB has prepared projections.
~ ~--~-~-~-- .--- .-----------.-------.--~.--~.~
1990-2010 Percent Change
19.5 20.1 20.6 32.3 31.6 24.7 39.6
27.1 20.9 17.6 28.2
10.8
43.0 27.4
23.8
24.7 24.8 24.7 21.9 24.6
22.0 21. 7 22.0
29.1 41.2 35.9
13.2 13 .3
23.3
24.9

III-4
Counties
Projected popul ati on data for the 10-county study area developed by the Texas Water
Development Board (TWDB) as well as the Texas Department of Commerce and the Texas
Department of Health were evaluated during this planning study. Of these, the TWDB -
High Series projections developed in September 1988 were adopted for use. They
closely agree with other available projections for the pl anning area. Table III-2
shows projections for 1990, 2000, and 2010 as well as the 1990 to 2010 percent change
for each of the 10 counties. The 1990 projected population of 335,827 for the entire
study area is expected to increase to 421,415 by the year 2010, about a 25 percent
increase. The minimum percentage increase projected is 10.6 percent for Delta County;
the maximum is 40 percent for Franklin County. Information broken down by
incorporated and unincorporated areas is also presented.
Projected population densities and housing densities for each of the 10 counties for
1990, 2000 and 2010 are given in Table 111-3, for the county as a whole and by county
divisions used in the 1980 census. The population densities for 1990 range from a low
of four persons per square mile in the Manchester Division of Red River County to a
high of 428 persons per square mile for the Texarkana Division in Bowie County. The
density range for 2010 f s from 5 to 533 persons per square mi 1 e for the same two
divisions.
Bas1n Area Only
Projected populations for the basin area only have also been estimated. Table 11l-4
gives the projected basin population by county for 1990, 2000, and 2010 as well as the
1990 to 2010 percent change for each of the 10 counties or portions of the counties
which are in the river basin area.

TABLE III-2
PROJECTED POPULATIONS -COUNTY UNINCORPORATED/INCORPORATED AREAS
1990 2000
Bowie County 82,689 92,230 City Population l 52,545 59,810 Unincorporated Areas2 30,144 32,420
Cass County 32,293 36,406 City Population l 13,978 16,017 Unincorporated Areas2 18,315 20,309
De It a County 4,765 5,119 City Population l 2,206 2,375 Unincorporated Areas 2 2,559 2,744
Franklin County 8,268 9,763 City Population l 3,367 4,018 Unincorporated Areas 2 4,901 5,745
Hopkins County 31,203 36,135 City Population l 15,560 17 , 307 Unincorporated Areas 2 15,643 18,828
Hunt County 74,301 83,459 City Popul ation l 38,452 42,657 Unincorporated Areas2 35,849 40,802
Lamar County 46,551 54,179 City Population l 30,097 32,330 Unincorporated Areas2 16,454 21,849
Morris County 15,351 18,022 City Population l 7,025 8,093 Unincorporated Areas2 8,326 9,929
Red River County 15,407 16,025 City Popul ation l 6,232 6,481 Unincorporated Areas 2 9,175 9,544
2010
102,852 66,587 36,265
39,634 17,395 22,239
5,269 2,445 2,824
11,529 4,677 6,852
40,010 19,269 20,741
92,236 48,253 43,983
60,941 36,634 24,307
21, 149 9,472
11,677
17,457 7,059
10,398

TABLE III-2
PROJECTED POPULATIONS -COUNTY UNINCORPORATED/INCORPORATED AREAS
(Continued)
1990 2000
Titus County 24,999 26,990 City Population l 12,299 13,485 Unincorporated Areas2 12,700 13,505
Study Area Total 335,827 378,328 Study Area City Population l 181,761 202,573 Study Area Unincorporated Areas2 154,066 174,755
lOnly includes cities for which TWDB projections were made.
2010
30,388 15,170 15,218
421,465 226,961 194,504
2Includes population of small communities for whi~h individual population projections were not made. In 1987, the small communities accounted for about 6.5% of the city population.

TABLE 1I1-3
COUNTY AND CENSUS DIVISION PROJECTED POPULATION DENSITIES
Persons and Est. Number of Houses Per Square Mile
County Census Divisions 1990 2000 2010 Pers. Houses Pers. Houses Pers. Houses
Bowie County 93 39 104 44 115 48 Dalby Springs-Simms 14 5 16 6 17 6 DeKalb 27 12 30 13 34 15 Hooks 43 18 48 20 54 23 Maud -Ell i ot Creek 40 16 45 18 50 20 New Boston 88 36 98 40 110 45 Texarkana 428 176 478 197 533 219
Cass County 34 15 39 17 42 19 Atlanta 72 30 81 34 88 37 Bivins-McLeod 17 7 19 8 21 9 Hughes Springs-Avinger 39 17 44 19 48 21 Linden 25 11 28 12 31 14 Marietta Douglassville 14 6 16 7 17 7
Delta County 17 8 19 9 19 9 Cooper 34 16 36 17 37 17 Pecan Gap 7 3 8 3 8 3
Franklin County 28 13 33 15 39 18 Mount Vernon 27 12 32 14 37 16 Winnsboro 34 15 40 18 47 21
Hopkins County 39 17 46 20 50 22 Cumby 20 8 24 10 26 10 North Hopkins-Sulphur Bl uff 10 4 12 5 13 5 Pickton-Pine Forest 26 11 30 13 33 14 Seymour 22 8 26 9 29 11 Sulphur Springs 121 55 140 64 155 70

TABLE I11-3
COUNTY AND CENSUS DIVISION PROJECTED POPULATION DENSITIES (Continued)
Persons and Est. Number of Houses Per Square Mile
County Census Divisions 1990 2000 2010 Pers. Houses Pers. Houses Pers. Houses
Hunt County 90 38 101 43 112 47 Caddo Mi 11 s 47 19 52 21 58 23 Celeste 25 11 28 12 31 14 Commerce 153 68 159 71 190 84 Greenvi 11 e 175 73 197 82 217 91 Lone Oak 28 12 31 13 35 15 Quinlan 72 31 81 35 90 39 Wolfe Ci ty 46 20 52 23 58 25
Lamar County 52 22 61 26 68 29 Biardstown 11 4 12 4 14 5 Blossom 31 12 36 14 41 16 Deport 25 11 30 13 33 15 Howland 14 5 16 6 18 6 Paris 291 131 338 152 381 172 Powderly 24 9 28 9 32 12 Roxton 16 8 19 10 21 11 Sumner 14 5 16 6 18 6
Morris County 59 24 69 28 81 33 Daingerfield 87 34 102 40 120 47 Naples 36 16 42 19 50 22
Red River County 15 7 15 7 17 8 Annona-Avery 10 5 11 6 12 6 Bogata 15 7 16 7 17 8 Clarksville 41 18 42 18 46 20 Detroit 12 5 12 5 13 5 Manchester 4 2 4 2 5 2
Titus County 60 26 65 28 73 32 Cookville 27 11 29 12 33 13 Mount Pleasant 159 68 172 74 194 83 Talco 18 8 19 8 22 10 Winfield 33 14 35 15 40 17

TABLE I II-4
PROJECTED SULPHUR RIVER BASIN POPULATION BY COUNTY
1990-2010 Sulghur River Basin Portion Percent
County 1990 2000 2010 Change
Bowie 59,950 66,870 74,570 24.3 Cass 8,300 9,360 10,190 22.8 Delta 4,765 5,119 5,269 10.6 Franklin 6,100 7,210 8,510 39.5 Hopkins 26,340 30,500 33,770 28.2 Hunt 23,480 26,370 29,150 24.1 Lamar 14,620 17,010 19,140 30.9 Morris 4,610 5,410 6,340 37.5 Red River 12,390 12,880 14,040 13 .3 Titus 9,770 10,550 11,880 21.6
Total/Average 170,325 191,279 212,859 25.0

III-10
PROJECTED SOLID WASTE
Source
Projected sol id waste estimates have been developed for the 10-county planning area
based on Texas Water Development Board - High Series population projections and
assumed rates of per capita generation. Much of the population in the planning area
presently lives in rural settings; about 48 percent live in unincorporated areas or
communities below 2,000 population. As discussed in Chapter II, these areas are more
1 i ke1y to practi ce onsi te di sposa 1 than more urban areas. The percentage of urban
versus rural residents in the planning area is not expected to change significantly
over the next 20 years.
Characteristics
The solid waste generated in much of the study area is primarily residential. About
80 percent of the geographical planning area is rural (unincorporated areas or
communities below 2,000 population). The remaining 20 percent includes about
52 percent of the popul ati on who 1 i ve 1 n 18 ci ti es. These urban areas produce some
commercial and industrial as well as residential wastes. The typical composition of
municipal solid waste by category according to EPA studies is as shown below:
Solid Waste Classification
Paper and paper goods, including cardboard Yard wastes Food wastes Wood, rubber, textiles, and leather Plastics Metal Glass Miscellaneous inorganic wastes
Percentage
41.0 17.9 7.9 8.1 6.5 8.7 8.2 1.6

II 1-11
The general characteristics of waste in the study area are not expected to change
significantly over the 20-year planning period.
Quantities
Total annual solid waste estimates range from 160 to 230 million tons for the U.S .•
depending on how the waste stream is defined. This equals between 3.6 and 5.2 pounds
per person per day (PPD). Vari ous per capita sol i d waste generati on rates were
eva 1 uated to se1 ect the appropri ate rate for maki ng soli d waste projecti ons for the
planning area.
According to recent estimates by the Texas Department of Health. Texans generate about
18 mill i on tons per year or about 5 ppd. Pri or studi es in northeast Texas have used
rates varying from 3.3 to 4.1 ppd. In Chapter II. the average generation rate was
estimated at 3.56 ppd for the study area (Table II-7) with higher rates in cities
greater than 20.000 and lower rates in small cities and rural areas. This is less
than the estimated Texas average. which would be expected since there are no major
urban/industrial areas in the study area. (Only six cities. Texarkana. Sulphur
Springs. Greenville. Paris. Mount Pleasant and Commerce. have populations greater than
10,000. and none is over 35.000).
Figure IU-2 depicts projected estimates of solid waste for the 10-county area using
the estimated existing generation rates. It also shows the effect of the USEPA
published National Waste Reduction Goal of 25 percent by 1992. If this goal is
reached by waste minimization and recycling efforts. the waste generation rate for the
planning area would average about 3 ppd.

900CL----~----------------------------~
Q,) 700 ...., rn .:
"d ...... ....... ~ 600 "d
Q,) ...., <) Q,) ...... o 0: 500
1990 2000 2010
Planning Year
FIGURE 1II-2 PLANNING AREA SOLID WASTE PROJECTIONS

III-13
PREDICTED FUTURE LANDFILL REQUIREMENTS
Subtitle D Criteria for Landfills
In 1984, the U. S. Congress added Hazardous and Sol i d Waste Amendments (HSWA) to the
Resource Conservation and Recovery Act of 1976 (RCRA). This legislation required the
U.S. Envi ronmenta 1 Protecti on Agency (EPA) to revi ew its regul ati ons and revi se them
as necessary to ensure that all municipal solid waste landfills be sited, deSigned,
and operated so as to protect human health and the environment. At a minimum, the
revisions should require groundwater monitoring to detect contamination and provide
for corrective action as necessary.
EPA has developed revised proposed criteria for landfills, published in the August 30,
1988 Federal Register as "Solid Waste Disposal Facility Criteria", 40 CFR Parts 257
and 258, or Subtitle D Criteria. These require new performance standards for publicly
and privately-owned municipal solid waste landfills, including location restrictions,
facil i ty desi gn and operati ng criteri a, and requi rements for groundwater moni tori ng,
corrective action, financial assurance, and closure and post-closure procedures.
The criteria have not yet been promulgated in final form. EPA's current published
schedule is to adopt final rules by the end of February 1990 with an effective date of
18 months thereafter--about September 1, 1991. It is expected that the Texas
Department of Health will implement a permit and enforcement program that will conform
to the regulations which EPA adopts.
HSWA gave EPA the authority to regulate municipal solid waste management in any state
that does not implement an adequate permitting and enforcement program. Since HSWA
also contains a provision that any citizen may institute a suit in Federal court
against any landfill operator who is in violation of a federal regulation, EPA does

III-14
not intend to establish a formal enforcement program. EPA's goal is to write
regul ati ons in such a manner so that the average ci ti zen can readily tell if an
operator is in violation. Any suit filed against a site operator will also include
the state for fail ure to enforce the regul ati ons, and thi s provi si on essenti ally
requires that the state adopt the federal regulations.
The proposed cri teri a are much more stri ngent and compl i cated than current standards
and will significantly increase the cost of waste disposal. They will necessitate
careful evaluation by local governments to decide if it is in their best interest to
remain in the solid waste disposal business or contract to another local government or
to private enterprise. Timely decisions and arrangements should be made to provide
any necessary replacement site that meets the new standards. If a replacement site is
not available by the effective date, existing landfill operations will be required to
comply with the new regulations.
Following is a summary of the criteria expected to be adopted:
I. Operating Criteria
1. Daily cover will be required on all sites.
2. Explosive gases control will be required.
3. Open burning will be prohibited.
4. 24-hour access control will be required on all sites.
5. Drainage control will be required to consist of run-on control
systems to prevent flow into active portions of the landfill during

III-IS
a 25-year stonn and run-off control system to collect and control
the volume of a 24-hour, 25-year stonn.
6. No discharge of water from a landfill will be pennitted unless it is
in accordance with the Clean Water Act.
7. Liquids, including vacuum truck wastes, will not be allowed to be
accepted at a landfill.
8. A program must be implemented to detect and prevent the disposal at
the facility of regulated hazardous waste and PCBs.
II. Closure and Post-closure Criteria
1. All sites will have to submit a closure and post-closure plan for
approval. New sites have to have these plans at the time of pennit
application.
2. The post-closure maintenance period will last a minimum of 30 years.
3. Financial assurance for proper closure and post-closure maintenance
wi 11 have to be provi ded for the 1 ife of the 1 andfi 11 and the
post-closure period. Only Federal and State-owned facilities would
be exempt. The amount of fi nanci a 1 assurance wi 11 be based on a
detailed, annually-revised cost estimate as to what it would cost
for a third party to effect proper closure or post-closure remedial
action.

II 1-16
III. Design Criteria
1. As originally proposed, new landfills and new units (trenches or
cells) within existing landfills would be designed against an
allowable groundwater carcinogenic risk level and might be required
to have liners and leachate collection systems. The allowable risk
level would apply to the site boundary and would be based on a
1 ifetime cancer ri sk 1 evel (due to conti nuous 1 i fetime exposure)
wi thi n a range from Ix 10-4 to lx10-7 (one case of cancer per
10,000 persons exposed to one case per 10,000,000 persons exposed).
However, EPA has subsequently abandoned this approach and will adopt
one of the other alternative design proposals or a combination
thereof.
2. Completed sections of an existing landfill would not have to be
retrofitted for 1 iners and leachate collections systems. but would
have to have a proper final cover and cover maintenance.
IV. Groundwater Monitoring Criteria
1. All new sites will be required to monitor the groundwater. The
sampling requirements will be intense and will continue through the
3D-year post-closure maintenance period.
2. Previ ously fill ed areas withi n exi sti ng 1 andfi 11 s wi 11 be exempt
from groundwater moni tori ng requi rements only if the penni ttee can
demonstrate that there is no potential for migration of hazardous
constituents to the uppennost aquifer during the active life of the
landfill and the post-closure care period.

1II-17
The proposed criteri a will probab1 y accomp1 ish what RCRA had envi si oned in 1976-
regi ona 1 i zati on of sol i d waste management servi ces. The RCRA concept was to require
regional and local solid waste management plans that would provide for a minimum
number of strategically-located landfills to receive waste from a large service area.
Once this was done, the waste stream could be characterized and a combination of
materials recovery and energy recovery systems could be established to maximize
revenue and bury the smallest amount of waste possible. The increased cost of
operati ng a 1 andfi 11 under the proposed rules shou1 d provi de adequatr 'ncentives to
regionalize, recycle as much as possible, establish waste-to-energy facilities, and
bury the smallest amount of waste possible in order to conserve landfill capacity.
The imninent high-tech mode of solid waste management will require
professional1y-tra1ned 1andf11l managers, adequate operator certification, and proper
management of equi pment. Many of the presentl y exi st i ng 1 andfi 11 s may have to be
closed and replaced by regional landfills which can serve areas now being served by as
many as 10 or more small landfills. As discussed in Chapter II, three-fourths of the
currently active landfills in the study area are likely to close. Most of the smaller
landfills utilize open burning which will be prohibited by the proposed criteria. It
is estimated that the more expensive high-tech landfill operations may need a minimum
service area equivalent population of 50,000 to make their operation feasible.
Projected Needs for Landfill Space
Table III-5 includes projected population data, solid waste quantities, and landfill
requirements by county based on disposal of all solid waste by 1andfilling in the
study area. The projected sol i d waste and 1 andfi 11 requi rements data are presented
for two scenarios: the first data set assumes that the EPA waste reduction goal of
25 percent by 1992 will not be met, and the second data set assumes that the EPA

TABLE III-5
SULPHUR RIVER BASIN RE6IOML SOLID WASTE Pl..ANNIIIi COUNTY PROJECTIONS/LAIIlFlU REQUIREMENTS
........................................................................................................................................................... Solfd Waste Projectfons Solfd waste Projectfons wlo EPA Reductfon Goal wlEPA Reductfon Goal
-------------------------------- -------------------------------Projected Populatfon Solfd Waste Projectfons ZO-Year Solfd waste Projectfons ZO-Year
County 1990 ZOOO 2010 1990 ZOOO Z010 Landffll Req. 1990 ZOOO 2010 landffll Req. ---(1000 persons)---- ---(1000 tons/year)---- ----Acre----- ---(1000 tons/year)---- ----Acre-----
------------------------------------------------------.-------------------.----------------.-----------------------------------.---------------.-----------Bowfe 82.7 9Z.Z 102.9 58 65 73 111 58 49 55 86
Cass 3Z.3 36.4 39.6 20 23 25 39 20 17 19 30
Delta 4.8 5.1 5.3 3 3 3 5 3 2 2 4
Franklfn 8.3 9.8 11.5 5 6 7 10 5 5 5 8
Hopkfns 31.2 36.1 40.0 20 25 28 4Z 20 19 21 32
Hunt 74.3 83.5 92.2 51 58 64 99 51 44 48 76
LiIIII4r 46.6 54.2 60.9 33 38 43 65 33 Z9 32 50
Morrfs 15.4 18.0 21.1 10 11 13 19 10 8 10 15
Red Rfver 15.4 16.0 17.5 9 10 11 17 9 8 8 13
Tftus 25.0 27.0 30.4 16 17 19 29 16 13 14 23
TOTALS 336.0 378.3 421.4 225 256 286 437 225 192 215 338

II 1-19
waste reduction goal w1l1 be met. The adequacy of existing landfills to meet these
requirements is discussed in Chapter IV. Regional Plan Alternatives.
The projected landfill requirements are based on a disposal rate of 800 pounds of
solid waste per cubic yard of landfill and an average landfill depth of 20 feet for a
resultant landfill loading of about 12.900 tons per acre and a five percent
contingency.
Primary factors to consider in siting new landf1l1s include access/transportation
requirements. soils. geology. topography. and land use/availability. Other factors to
consider include proximity to airports and other developed areas. wetlands or
flood-prone areas. streams. and reservoirs; availability of adequate soils for
required lining and cover operations; groundwater conditions; surface drainage
patterns; and climatic conditions. Public participation during the siting process
should be encouraged to minimize the "NIMBY" (not in my back yard) syndrome and to
keep the public properly infonned. Public acceptance of a given site can likely be
the most important siting factor. and it can even reduce subsequent pennitting
requirements.
PREDICTED' WATER QUALITY AND QUANTITY
Surface Water
As indicated above. the surface water resource potential of the Sulphur River Basin of
Texas is substantial. The latest version of the Texas Water Plan (1984) includes an
analysis of water supply and demand in the Sulphur River Basin through 2030. It
concludes that. in 2030. the predicted basin demand can be supplied by
193.200 acre-feet per year of in-basin surface water. 40.400 acre-feet per year of
imported surface water and 5.300 acre-feet per year of in-basin ground water •
.. - .. _-- ---

II 1-20
Development of Cooper Reservoi r, George Parkhouse Reservoi r, and the fi rst stage of
the Marvin Nichols Reservoir would allow 485,000 acre-feet per year to be exported
from the Sulphur Basin for use in areas of heavy need further west. Table III-6 is
taken from the 1984 Texas Water Pl an. It illustrates the surface water development
potential, indicates the in-basin water supply requirements and shows projected
exports to other basins as well as developed surface water yield in reserve for future
need for the period 2000 through 2030. It can be seen that the potential water supply
yield by 2030 is approximately six times that required to meet projected net in-basin
needs. Fi gure II I -3 shows these future reservoi rs as well as exi st i ng surface water
development.
This valuable resource must be protected. State water quality standards must be met
in accordance wi th the General Pol i cy Statement of the Texas Water Comni ssion, i.e.,
"to maintain the quality of water in the State consistent with public health and
enj oyment, propagati on and protecti on of terrestri al and aquati c 1 ife, operati on of
existing industries, and economic development of the State." As discussed in
Chapter II, the existing quality of waters in the Sulphur River Basin is generally
good. This quality must be preserved.
A major statewide concern regarding solid waste disposal is the illegal dumping of all
kinds of waste. This can have a negative effect on surface water quality, since trash
is frequently dumped in gullies or near streams. When rainwaters cause local
flooding, refuse, or materials from it that dissolve into the water, can wash into
surface water suppl i es. Since many 1 andfi1l s are expected to close and the cost of
trash disposal is expected to rise, an increase in illegal dumping may well occur.
Local governments need to be aware of this possibility in order to address it in their
solid waste management plans. Enforcement of state law and local ordinances
prohi biti ng such dumpi ng can be increased. Publ i c educati on efforts to convi nce
citizens to dispose of their waste responsibly and the convenient availability of

a.
b.
c.
d.
e.
f.
g.
h.
1.
TABLE III-6
COMPARISON OF POTENTIAL SURFACE WATER SUPPLY AND PROJECTED FUTURE REQUIREMENTS
- AMOUNTS IN 1,000 AC-FT/YR -
1990 2000 2010
Projected in-basin water requirements 129.7 166.3 206.6
Requirements met from ground-water 5.2 5.4 5.5
Available usable return flow 26.4 32.0 39.1
Estimated imports from other basins 23.3 28.0 33.7
Net in-basin requirements for surface reservoir yield (a-b-c-d) 74.8 100.9 128.3
Projected surface yield developed 320.6 446.6 584.5
Excess surface yield over in-basin requirements (f-e) 245.8 345.7 456.2
Projected exports to other basins 72.6 115.2 232.4
Developed surface water yield in reserve for future need (g-h) 173.2 230.5 223.8
2030
238.9
5.3
47.4
40.4
145.8
875.3
729.5
485.0
244.5
Note: Source of thi s tabl e is the 1984 Texas Water Pl an, and the data should be updated when the 1990 Texas Water Plan is available.