summarised consolidated financial statements - pioneer … · pioneer food group limited...
TRANSCRIPT

SUMMARISED CONSOLIDATED FINANCIAL STATEMENTS
FOR THE YEAR ENDED 30 SEPTEMBER 2017
Pioneer Food Group Limited Incorporated in the Republic of South AfricaRegistration number: 1996/017676/06 Tax Registration number: 9834/695/71/1
Share code: PFG ISIN code: ZAE000118279 (“Pioneer Foods” or “the Group” or “the Company”)

1ANNUAL RESULTS PRESENTATION 2017
FINANCIAL HIGHLIGHTS
REVENUE
ADJUSTED OPERATING
PROFIT*
NET CASHGENERATED
FROM OPERATIONS
ADJUSTEDHEADLINE
EARNINGS PERSHARE*
TOTALDIVIDEND
PER SHARE
SUMMARISED CONSOLIDATED FINANCIAL STATEMENTS FOR THE YEAR ENDED 30 SEPTEMBER 2017
SALIENT FEATURES
Revenue R19 575 million -5%Adjusted operating profit (before items of a capital nature)* R1 277 million -44%Earnings R726 million -57%Earnings per share 390 cents -57%Diluted earnings per share 366 cents -57%Headline earnings (“HE”) R763 million -54%Headline earnings per share 410 cents -55%Diluted headline earnings per share 385 cents -54%Adjusted headline earnings* R823 million -50%Adjusted headline earnings per share* 442 cents -50%Net cash generated from operations R2 579 million +50%Net asset value per share 4 303 cents +2%Final gross dividend per listed ordinary share (2016: 260 cents) 260 cents –Total gross dividend per listed ordinary share (2016: 365 cents) 365 cents –
* HE and operating profit (before items of a capital nature) are adjusted for the share-based income/(charge), amounting to a gain of R114 million (2016: gain of R23 million), and the hedge loss amounting to R217 million (2016: gain of R22 million), of the B-BBEE Phase I equity transaction due to the volatility of these transactions and once-off merger and acquisition costs of R18 million.
MAINTAINED-50%+50%-44%-5%
1ANNUAL RESULTS PRESENTATION 2017
Realising Potential2
COMMENTARYINTRODUCTIONAs mentioned in the trading statement issued on 23 October 2017, the 2017 financial year presented a number of challenges. Consequently, adjusted headline earnings per share decreased by 50% to 442 cents, largely due to constrained trading conditions and an unfavourable procurement position until May 2017 on maize following the severe drought in the northern part of South Africa during the 2015/16 season. Continuing initiatives to enhance operating margins through cost mitigation and efficiency interventions delivered sound cash flow generation during the year. This allowed the Company to declare a dividend equal to that of the prior year. Pioneer Foods is well positioned for recovery during the 2018 financial year.
FINANCIAL PERFORMANCERevenue decreased by 5% from R20.6 billion in the comparative period due to a combination of raw material deflation, volume declines and resistance to price increases.
The Group's gross profit margin decreased from 29.5% to 26.3% whilst the adjusted operating profit (before items of a capital nature) decreased by 44% to R1 277 million. The operating profit margin contracted from 11.0% to 6.5% due to unfavourable procurement positions as well as volume declines in material categories.
Profit before tax amounted to R985 million after finance costs of R197 million (2016: R167 million). The share of profit from joint ventures and associates decreased from R100 million to R60 million. Bokomo Botswana and Heinz Foods SA delivered disappointing performances. The former was significantly impacted by the Group’s unfavourable maize hedge position. Heinz’s volumes lagged expectations and due to the inability to adjust its cost base to this volume reality, posted a poor profit performance.
Total Group earnings per share decreased by 57% to 390 cents per share (2016: 912 cents per share).
Total Group earnings was negatively impacted by items of a capital nature amounting to a net after tax cost of R36.7 million (2016: income of R14.5 million). The impairment of goodwill and trademarks associated with the fish paste business was the major contributor.
Headline earnings per share (“HEPS”), decreased by 55% to 410 cents per share (2016: 904 cents per share).
HEPS was negatively impacted by the net effect of the IFRS 2 share-based payment charge relating to the Phase I (2006) B-BBEE transaction and the effect of the related forward purchase contracts (amounting on a net basis to a loss of R42 million after tax). The major reason for this loss is the fact that the hedge is valued at 100% of the mark-to-market value, whilst the liability is valued differently in accordance with IFRS 2. An adjustment was also made for specific once-off merger and acquisition costs.
Adjusted HEPS, before the Phase I B-BBEE share-based payment charge and hedge and once-off merger and acquisition cost, decreased by 50% to 442 cents per share (2016: 883 cents per share).
DIVISIONAL PERFORMANCEEssential FoodsThe performance of the division was severely impacted, as previously reported, by the uncompetitive maize procurement position in 2016 that was entered into to secure supply in light of the unprecedented drought and shortage in white maize availability. The milling of the high priced, local and imported maize was completed by the end of May and profitability normalised from July 2017. The White Star brand proved its resilience and maintained its leadership position despite the challenging business environment. White Star Instant Porridge achieved encouraging volume growth following the commissioning of additional manufacturing capacity.
Wheat milling performance was negatively impacted by the unpredictable application of the wheat import duty mechanism and increased competition in the flour and bread markets. Bakeries, despite muted volume growth, sustained its performance of the last few years. Efficiency gains in the rice supply chain enabled the business to expand its profitability. Pasta Grande’s contribution to total sales volumes improved consistently during the year due to increased penetration and promotional support. This, along with step-changed manufacturing efficiencies, bolstered the performance of the pasta business.
The improved profit performance of Essential Foods since the fourth quarter of the financial year is set to continue into 2018.
GroceriesThe Groceries Division’s performance was negatively influenced by a general decrease in volumes as a consequence of double-digit price inflation driven by raw materials, and the resulting overall pressure on demand. The once-off reduction in minimum stock levels by South African retailers also contributed to the volume declines.

3ANNUAL RESULTS PRESENTATION 2017
Competition in the long-life fruit juice category intensified, contributing to a poor operating performance in the beverage category, further exacerbated by the costs associated with exiting the unprofitable private label carbonated soft drink business. While breakfast cereal volumes were under pressure, Weet-Bix however maintained its market share. Snacks and Treats, driven by the nuts category, delivered a stellar performance.
Early indications are that the performance of this division will recover in 2018 through competitive pricing and promotional activity and consequent volume growth.
InternationalThe consumer export business faced a challenging year. The economic instability in key markets such as Mozambique and Zimbabwe negatively impacted trading conditions. Operating margins were further impacted by significant input cost inflation on global fruit concentrates and the inability to increase selling prices within the context of constrained consumption.
A profitable contribution from the vine fruit business was largely eroded by the lower crop in the previous year (partly sold in 2017), the strengthening rand as well as lower US dollar selling prices realised.
The UK business was impacted by uncertainty around Brexit and the consequent weaker currency resulting in import inflation and an inability to increase sales prices sufficiently. The Nigerian bakery business showed good profit growth on the back of strong growth in volumes. Beverage exports, predominantly into Africa, will continue to remain under pressure in the coming year. The rest of the businesses should deliver an improved performance.
FINANCIAL POSITIONNet cash profit from operating activities decreased by 38% to R1 661 million (2016: R2 668 million). Major decreases in commodity prices, especially maize, resulted in a significant release of working capital of R752 million (2016: investment of R775 million). Net cash flow from operating activities thus increased by 45% to R1 770 million (2016: R1 224 million).
Capital expenditure for the year amounted to R960 million (2016: R809 million). Major projects included the completion of the Aeroton bakery expansion and the additional Weet-Bix line as well as the installation of a third line at Shakaskraal bakery.
On 3 March 2017 the Group acquired 49.89% of the shares in Weetabix East Africa Ltd for an amount of R191.5 million.
The Group also increased its equity share in Food Concepts Pioneer Ltd in Nigeria to 64.4% by investing a further R16.6 million, effective 1 July 2017.
The Group's net interest-bearing debt, excluding the third-party debt relating to the Phase II B-BBEE transaction partners, was R612 million (2016: R501 million) at year-end, with a net debt to equity ratio of 8% (2016: 6%).
After year-end the Group entered into an agreement to acquire the remaining 50.1% in its joint venture with KraftHeinz in South Africa. This purchase creates an excellent opportunity to leverage Pioneer Foods’ existing scale and platform in Southern Africa to grow the business further. The transaction is expected to close in the first quarter of 2018 pending regulatory approval.
PROSPECTSWhile we anticipate demand to remain constrained in 2018, we foresee a positive outlook for Pioneer Foods in the current financial year and beyond, with continuing actions to restore the margin while maintaining steady cash flow generation.
We expect that maize will deliver a normalised performance in 2018. Bakeries performance will benefit from the investment in additional capacity at the Aeroton and Shakaskraal facilities, with the latter expected to come on stream in January 2018. With a more competitive supply chain and brand portfolio strategy in place, performance of the beverage category should accelerate in 2018. A slower recovery is however expected in export performance due to structural challenges in key markets. Fruit profitability should improve in 2018 with early indications of increased global pricing and subject to the 2018 harvest yielding the positive result currently expected. We are concerned about the persistent drought in the Western Cape and the potential effect it may have on operations and selected raw material pricing, and are actively pursuing all available options to mitigate these operating risks.
Realising Potential4
DIVIDENDA gross final dividend of 260 cents (2016: 260 cents) per share has been approved and declared by the Board for the year ended 30 September 2017 from income reserves. The applicable dates for the final dividend are as follows:
Last date to trade cum dividend Tuesday, 30 January 2018Trading ex-dividend commences Wednesday, 31 January 2018 Record date Friday, 2 February 2018Dividend payable Monday, 5 February 2018
The total dividend for the year under review is 365 cents per share, the same as in 2016.
The total dividend amount for the year approximates R820 million (2016: R817 million) and is based on a dividend cover of 1.1 times (2016: 2.2 times). This is calculated as adjusted headline earnings for the year divided by the total dividend for the year, excluding the dividend on treasury shares held by a Group subsidiary.
A gross final dividend of 78 cents (2016: 78 cents) per class A ordinary share, being 30% of the gross final dividend payable to ordinary shareholders in terms of the rules of the relevant employee scheme, will be paid during February 2018.
Share certificates may not be dematerialised or materialised between Wednesday, 31 January 2018 and Friday, 2 February 2018, both days inclusive.
By order of the Board
ZL Combi TA CarstensChairman Chief Executive Officer
Tyger Valley16 November 2017

5ANNUAL RESULTS PRESENTATION 2017
PIONEER FOOD GROUP LTDSUMMARISED CONSOLIDATED FINANCIAL STATEMENTSFOR THE YEAR ENDED 30 SEPTEMBER 2017
Group statement of comprehensive income
AuditedYear ended
30 September 2017 R’m
AuditedYear ended
30 September 2016 R’m
Revenue 19 575.0 20 599.7 Cost of goods sold (14 419.0) (14 516.7)Gross profit 5 156.0 6 083.0 Other income and gains/(losses) – net 142.3 169.8 Other expenses (4 142.1) (3 934.8)
Excluding the following: (4 021.6) (3 979.6)Once-off merger and acquisition costs (17.6) – Phase I B-BBEE transaction share-based payment (charge)/income and related hedge (102.9) 44.8
Items of a capital nature (57.0) 21.3 Operating profit 1 099.2 2 339.3 Investment income 22.3 46.8 Finance costs (196.8) (167.3)Share of profit of investments accounted for using the equity method 60.3 100.4 Profit before income tax 985.0 2 319.2 Income tax expense (258.8) (629.0)Profit for the year 726.2 1 690.2 Other comprehensive income/(loss) for the yearItems that will not subsequently be reclassified to profit or loss:Remeasurement of post-employment benefit obligations 1.6 0.9 Items that may subsequently be reclassified to profit or loss: 143.3 (203.4)Fair value adjustments to cash flow hedging reserve 115.7 (118.3)
For the year (60.2) 134.7 Current income tax effect 17.5 (36.7)Deferred income tax effect (0.7) (1.0)
Reclassified to profit or loss 220.9 (299.0)Current income tax effect (63.9) 85.6 Deferred income tax effect 2.1 (1.9)
Fair value adjustments on available-for-sale financial assets 4.0 (1.2)For the year 8.2 7.0
Deferred income tax effect 0.6 0.1 Reclassified to profit or loss (4.8) (8.3)
Share of other comprehensive income of investments accounted for using the equity method 15.9 (28.7)Movement on foreign currency translation reserve 7.7 (55.2)
Total comprehensive income for the year 871.1 1 487.7 Profit for the year attributable to:Owners of the parent 726.1 1 690.2 Non-controlling interest 0.1 –
726.2 1 690.2 Total comprehensive income for the year attributable to:Owners of the parent 869.7 1 487.7 Non-controlling interest 1.4 –
871.1 1 487.7

Realising Potential6
Headline earnings reconciliation
Audited Year ended
30 September 2017 R’m
AuditedYear ended
30 September 2016 R’m
Reconciliation between profit attributable to owners of the parent and headline earningsProfit attributable to owners of the parent 726.1 1 690.2 Remeasurements 52.7 (13.4)
Net profit on disposal of property, plant and equipment and intangible assets (5.8) (12.1)Net profit on disposal of available-for-sale financial assets (4.8) (8.3)Net profit on disposal of subsidiary – (24.2)Fair value adjustment of step-up from joint venture to subsidiary 18.7 – Net loss on disposal of equity-accounted investments 17.7 – Impairment of intangible assets 21.0 – Impairment of goodwill 10.2 – Impairment of available-for-sale financial assets – 23.3 Before tax 57.0 (21.3)Tax effect on remeasurements (4.3) 7.9
Remeasurements included in equity-accounted results (16.0) (1.1)Remeasurements (15.8) (1.3)Tax effect on remeasurements (0.2) 0.2
Headline earnings 762.8 1 675.7 Phase I B-BBEE transaction share-based payment charge/(income) and related hedge 42.2 (38.7)Once-off merger and acquisition costs 17.6 – Adjusted headline earnings (Note 1) 822.6 1 637.0 Number of issued ordinary shares (million) 233.4 232.5 Number of issued treasury shares: – held by subsidiary (million) 18.0 18.0 – held by B–BBEE equity transaction participants (million) 18.1 18.1 – held by BEE trust (million) 10.7 10.7 Number of issued class A ordinary shares (million) 3.2 3.7 Weighted average number of ordinary shares (million) 186.0 185.3 Weighted average number of ordinary shares – diluted (million) 198.4 199.6 Earnings per ordinary share (cents): – basic 390.3 912.1 – diluted 366.0 846.9 – headline 410.1 904.3 – diluted headline 384.5 839.6 – adjusted headline (Note 1) 442.2 883.4 – diluted adjusted headline (Note 1) 414.6 820.2 Gross dividend per ordinary share (cents) 365.0 365.0 Gross dividend per class A ordinary share (cents) 109.5 109.5 Net asset value per ordinary share (cents) 4 302.8 4 238.7 Debt to equity ratio (%) 13.4 12.5 Note 1:Headline earnings (“HE”) is calculated based on Circular 2/2015 issued by the South African Institute of Chartered Accountants. Adjusted HE is defined as HE adjusted for the impact of:• share-based payment charge/(income) on the Phase I B-BBEE transaction on profit or loss (and the impact of the
related hedge) due to the volatility of these items; and• once-off merger and acquisition costs.

7ANNUAL RESULTS PRESENTATION 2017
Group statement of financial position
Audited 30 September
2017 R’m
Audited 30 September
2016 R’m
AssetsProperty, plant and equipment 5 357.0 4 763.4 Goodwill 331.3 302.8 Other intangible assets 483.6 479.6 Biological assets – 16.0 Investments in and loans to associates and joint ventures 906.7 861.2 Derivative financial instruments 203.1 439.7 Available-for-sale financial assets 138.1 128.3 Trade and other receivables 15.4 16.8 Deferred income tax 12.5 3.9 Non-current assets 7 447.7 7 011.7 Current assets 5 504.6 6 518.8 Inventories 3 033.1 3 212.5 Derivative financial instruments 51.0 57.6 Trade and other receivables 1 981.8 2 245.9 Current income tax 7.9 2.0 Cash and cash equivalents 430.8 1 000.8 Assets of disposal group classified as held for sale 20.0 – Total assets 12 972.3 13 530.5 Equity and liabilitiesCapital and reserves attributable to owners of the parent 8 027.2 7 867.3 Share capital 23.3 23.2 Share premium 2 554.3 2 406.3 Treasury shares (1 186.4) (1 187.8)Other reserves 213.1 253.3 Retained earnings 6 422.9 6 372.3 Non-controlling interest 25.0 – Total equity 8 052.2 7 867.3 Non-current liabilities 1 645.3 2 344.8 Borrowings
B-BBEE equity transaction third-party finance 433.1 449.6 Other 265.6 883.7
Provisions for other liabilities and charges 112.4 111.2 Share-based payment liability 159.8 317.9 Deferred income tax 674.4 582.4 Current liabilities 3 274.8 3 318.4 Trade and other payables 2 388.9 2 037.6 Current income tax 24.7 30.3 Derivative financial instruments 2.6 16.1 Borrowings 811.2 653.5 Loan from joint venture 14.5 26.0 Accrual for forward purchase contracts on own equity – 493.3 Dividends payable 0.6 0.6 Share-based payment liability 32.3 61.0
Total equity and liabilities 12 972.3 13 530.5

Realising Potential8
Group statement of changes in equity
Audited Year ended
30 September 2017 R’m
AuditedYear ended
30 September 2016 R’m
Share capital, share premium and treasury shares 1 391.2 1 241.7
Opening balance 1 241.7 1 249.7
Movement in treasury shares 1.4 16.4
Ordinary shares issued – share appreciation rights 148.2 57.8
Ordinary shares bought back from management share incentive trust and cancelled – (82.1)
Employee share scheme – repurchase of shares (0.1) (0.1)
Other reserves 213.1 253.3
Opening balance 253.3 460.5
Equity compensation reserve transactions 23.4 49.5
Ordinary shares issued – share appreciation rights (148.1) (57.8)
Deferred income tax on share-based payments (57.6) 4.5
Share of other comprehensive income of investments accounted for using the equity method 16.0 (28.7)
Other comprehensive income for the year 126.1 (174.7)
Retained earnings 6 422.9 6 372.3
Opening balance 6 372.3 5 248.5
Profit for the year 726.1 1 690.2
Other comprehensive income for the year 1.6 0.9
Dividends paid (678.5) (634.0)
Management share incentive scheme – disposal of shares 1.7 67.2
Employee share scheme – transfer tax on share transactions (0.3) (0.5)
Non-controlling interest 25.0 –
Opening balance – 12.3
Disposal of subsidiary – (12.3)
Profit for the year 0.1 –
Share of other comprehensive income 1.2 –
Non-controlling interest acquired – business combination 23.7 –
Total equity 8 052.2 7 867.3
9ANNUAL RESULTS PRESENTATION 2017
Group statement of cash flows
Audited Year ended
30 September 2017 R’m
AuditedYear ended
30 September 2016 R’m
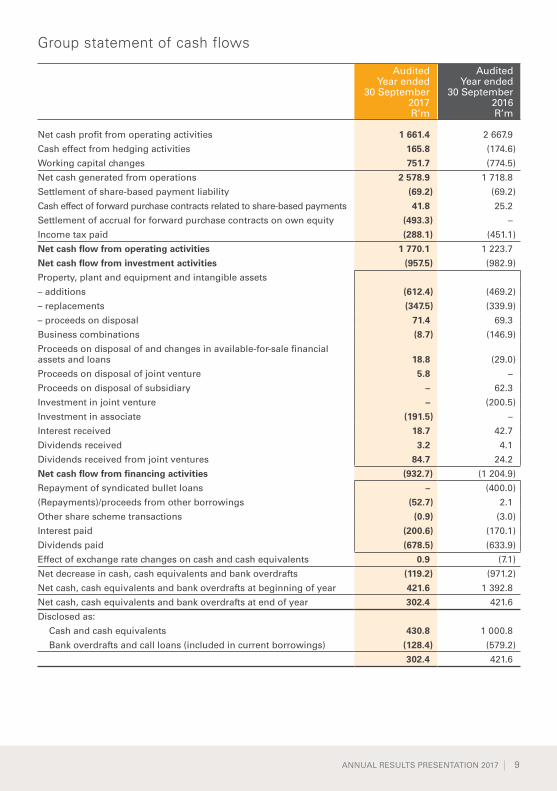
Net cash profit from operating activities 1 661.4 2 667.9
Cash effect from hedging activities 165.8 (174.6)
Working capital changes 751.7 (774.5)
Net cash generated from operations 2 578.9 1 718.8
Settlement of share-based payment liability (69.2) (69.2)
Cash effect of forward purchase contracts related to share-based payments 41.8 25.2
Settlement of accrual for forward purchase contracts on own equity (493.3) –
Income tax paid (288.1) (451.1)
Net cash flow from operating activities 1 770.1 1 223.7
Net cash flow from investment activities (957.5) (982.9)
Property, plant and equipment and intangible assets
– additions (612.4) (469.2)
– replacements (347.5) (339.9)
– proceeds on disposal 71.4 69.3
Business combinations (8.7) (146.9)
Proceeds on disposal of and changes in available-for-sale financial assets and loans 18.8 (29.0)
Proceeds on disposal of joint venture 5.8 –
Proceeds on disposal of subsidiary – 62.3
Investment in joint venture – (200.5)
Investment in associate (191.5) –
Interest received 18.7 42.7
Dividends received 3.2 4.1
Dividends received from joint ventures 84.7 24.2
Net cash flow from financing activities (932.7) (1 204.9)
Repayment of syndicated bullet loans – (400.0)
(Repayments)/proceeds from other borrowings (52.7) 2.1
Other share scheme transactions (0.9) (3.0)
Interest paid (200.6) (170.1)
Dividends paid (678.5) (633.9)
Effect of exchange rate changes on cash and cash equivalents 0.9 (7.1)
Net decrease in cash, cash equivalents and bank overdrafts (119.2) (971.2)
Net cash, cash equivalents and bank overdrafts at beginning of year 421.6 1 392.8
Net cash, cash equivalents and bank overdrafts at end of year 302.4 421.6
Disclosed as:
Cash and cash equivalents 430.8 1 000.8
Bank overdrafts and call loans (included in current borrowings) (128.4) (579.2)
302.4 421.6

Realising Potential10
Group segment report
Audited Year ended
30 September 2017 R’m
AuditedYear ended
30 September 2016 R’m
Segment revenue
Essential Foods 12 469.8 12 854.8
Groceries 4 402.7 4 695.1
International 2 702.5 3 049.8
Total 19 575.0 20 599.7
Segment results
Essential Foods 800.2 1 249.5
Groceries 357.0 541.6
International 121.5 484.2
Other (2.0) (2.1)
1 276.7 2 273.2
Once-off merger and acquisition costs (17.6) –
Phase I B-BBEE transaction share-based payment (charge)/income and related hedge (102.9) 44.8
Operating profit before items of a capital nature 1 156.2 2 318.0
Reconciliation of operating profit (before items of a capital nature) to profit before income tax
Operating profit before items of a capital nature 1 156.2 2 318.0
Adjusted for:
Remeasurement of items of a capital nature (57.0) 21.3
Interest income 19.1 42.7
Dividends received 3.2 4.1
Finance costs (196.8) (167.3)
Share of profit of investments accounted for using the equity method 60.3 100.4
Profit before income tax 985.0 2 319.2

11ANNUAL RESULTS PRESENTATION 2017
Notes to the summarised consolidated financial statements
1. Basis of preparation
The summarised consolidated financial statements of the Group for the year ended 30 September 2017 have been prepared in accordance with the requirements of the JSE Ltd (“JSE”) for summarised financial statements, and the requirements of the Companies Act of South Africa, Act 71 of 2008, as amended, applicable to summarised financial statements. The JSE Listings Requirements require summarised financial statements to be prepared in accordance with the framework concepts and the measurement and recognition requirements of International Financial Reporting Standards (“IFRS”) and the SAICA Financial Reporting Guides as issued by the Accounting Practices Committee, and the Financial Pronouncements as issued by the Financial Reporting Standards Council and also, as a minimum, to contain the information required by IAS 34 – Interim Financial Reporting. This summarised report is an extract from audited information, but this summarised report has not been audited.
The directors take full responsibility for the preparation of the summarised consolidated financial statements and that the financial information has been correctly extracted from the underlying financial records.
2. Accounting policies
The accounting policies applied in the preparation of the consolidated financial statements from which the summarised consolidated financial statements were derived, are in terms of IFRS and are consistent with those accounting policies applied in the preparation of the previous consolidated annual financial statements.
In preparing these summarised consolidated financial statements, the significant judgements made by management in applying the Group’s accounting policies and the key sources of estimation uncertainty were the same as those that applied to the consolidated financial statements for the year ended 30 September 2016.

Realising Potential12
Audited Year ended
30 September 2017
AuditedYear ended
30 September 2016
3. Share capital
During the period under review the following share transactions occurred:
Number of listed issued and fully paid ordinary shares
At beginning of year 232 472 909 232 739 331
Shares issued in terms of employee share appreciation rights scheme 906 536 345 578
Shares repurchased from management share incentive trust and cancelled – (612 000)
At end of year 233 379 445 232 472 909
906,536 (30 September 2016: 345,578) listed ordinary shares of 10 cents each were issued at an average of R163.49 (30 September 2016: R167.24) per share in terms of the share appreciation rights scheme.
612,000 shares were repurchased in 2016 at an average price of R134.11 per share and subsequently cancelled.
Number of treasury shares held by the share incentive trust
At beginning of year 47 620 729 612
Movement in shares (47 620) (69 992)
Repurchased by the Company and cancelled – (612 000)
At end of year – 47 620
Proceeds on the sale of treasury shares by the share incentive trust (R’000) 3 193 1 630
Proceeds on the repurchase of treasury shares from the share incentive trust by the Company (R’000) – 82 075
Number of treasury shares held by B-BBEE transaction participants
At beginning and end of year 18 091 661 18 091 661
Number of treasury shares held by Pioneer Foods Broad-Based BEE Trust
At beginning and end of year 10 745 350 10 745 350
Number of treasury shares held by a subsidiary
At beginning and end of year 17 982 056 17 982 056
Number of unlisted class A ordinary shares
At beginning of year 3 707 830 4 234 300
Shares bought back and cancelled (532 910) (526 470)
At end of year 3 174 920 3 707 830
Purchase consideration paid for unlisted class A ordinary shares bought back (R’000) 69 235 69 244
4. BorrowingsNo material new borrowings were concluded during the period under review. Changes in borrowings mainly reflect repayments made in terms of agreements. Short-term borrowings fluctuate in accordance with changing working capital needs.

13ANNUAL RESULTS PRESENTATION 2017
5. Events after the reporting date5.1 Dividend
The Board approved and declared a gross final dividend of 260.0 cents (2017: gross interim dividend of 105.0 cents and 2016: gross final dividend of 260.0 cents) per ordinary share. This will amount to approximately R578,848,647 (2017: interim of R233,641,008 and 2016: final of R576,558,788) depending on the exact number of ordinary shares issued at the record date. In addition, the 10,745,350 Pioneer Foods shares issued to the Pioneer Foods Broad-Based BEE Trust, will receive 20% of the dividend payable, i.e. 52.0 cents (2017: gross interim of 21.0 cents and 2016: gross final dividend of 52.0 cents) per share, amounting to R5,587,582 (2017: interim of R2,256,524 and 2016: final of R5,587,582).
The Board approved a gross final dividend of 78.0 cents (2017: gross interim dividend of 31.5 cents and 2016: gross final dividend of 78.0 cents) per class A ordinary share, being 30% of the dividend payable to the other class ordinary shareholders in terms of the rules of the relevant employee scheme. This will amount to approximately R2,476,438 (2017: interim of R1,020,893 and 2016: final of R2,737,644) depending on the exact number of class A ordinary shares issued at the record date.
Additional information disclosed:These dividends are declared from income reserves and qualify as a dividend as defined in the Income Tax Act, Act 58 of 1962.
Dividends will be paid net of dividends tax of 20% (2016: 15%), to be withheld and paid to the South African Revenue Service by the Company. Such tax must be withheld unless beneficial owners of the dividend have provided the necessary documentary proof to the relevant regulated intermediary that they are either exempt therefrom, or entitled to a reduced rate as result of the double taxation agreement between South Africa and the country of domicile of such owner.
The net dividend amounts to 208.0 cents per ordinary share and 62.4 cents per class A ordinary share for shareholders liable to pay dividends tax. The dividend amounts to 260.0 cents per ordinary share and 78.0 cents per class A ordinary share for shareholders exempt from paying dividends tax.
The number of issued ordinary shares and issued class A ordinary shares is 233,379,445 and 3,145,940 respectively as at the date of this declaration.
5.2 Other material eventsPioneer Foods entered into an agreement to acquire the remaining 50.1% shareholding in Heinz Foods SA (Pty) Ltd. This agreement is subject to regulatory approvals.
There have been no other material events requiring disclosure after the reporting date and up to the date of approval of the summarised consolidated financial statements by the Board.
6. Contingent liabilities – GuaranteesThe Group had guarantees in issue of R28.8 million (30 September 2016: R32.7 million) as at 30 September 2017, primarily for loans by third parties to contracted suppliers.
As part of the funding provided by Rand Merchant Bank, a division of FirstRand Bank Ltd (“RMB”), to BEE investors in terms of the B-BBEE equity transaction concluded during 2012, Pioneer Foods (Pty) Ltd provided RMB with a guarantee amounting to R100 million.
Audited 30 September
2017 R’m
Audited 30 September
2016 R’m
7. Future capital commitmentsContractually committed
– For next financial year 218.9 307.6Approved by the Board, but not yet contractually committed 943.7 1 085.5
– For next financial year 626.6 989.7– For year following next financial year 317.1 95.8
Share of items of joint ventures 43.4 74.11 206.0 1 467.2

Realising Potential14
8. Acquisition of a 49.89% equity interest in Weetabix East Africa LtdAs announced on SENS on 16 November 2016, Pioneer Foods acquired a 49.89% shareholding in Weetabix East Africa Ltd. All regulatory approvals were obtained and the transaction became effective on 3 March 2017.
The total purchase consideration amounted to R191.5 million. This acquisition is equity-accounted as an investment in associate.
9. Business combinationDuring the year under review the Group acquired a further 14.3% interest in Food Concepts Pioneer Ltd (Nigeria). The investment was equity-accounted as an investment in a joint venture up to 30 June 2017 and thereafter this subsidiary was consolidated.
Audited Year ended
30 September 2017R’m
Food Concepts Pioneer Ltd – 64.4% (acquisition of a further 14.3% interest, effective 1 July 2017)Purchase consideration – settled in cash 16.6
Reason for acquisition of additional interestThe Group acquired a further interest in an existing joint venture resulting in control of this fast growing baking entity in Nigeria in line with its international expansion strategy. This is another step in enlarging the Group’s footprint in the substantial Nigerian market.
Reason for goodwill recognised on acquisitionThe premium paid to acquire control resulted in goodwill. The increased shareholding reflects the Group’s belief in the future growth prospects of this business.
The assets and liabilities acquired of this business can be summarised as follows:
Audited Year ended
30 September 2017
Fair value R’m
Property, plant and equipment 40.5Intangible assets – trademarks 29.3Goodwill 38.0Inventories 4.0Trade and other receivables 1.8Cash and cash equivalents 8.0Trade and other payables (11.7)Deferred income tax 0.7Borrowings (6.2)Total identifiable net assets 104.4Non-controlling interest (23.6)De-recognition of investment in joint venture (70.8)Fair value adjustment of step-up from joint venture to subsidiary 18.7Share of other comprehensive income recycled to profit or loss (12.1)Purchase consideration – settled in cash 16.6The contribution of this business since acquisitionRevenue 45.8Operating profit before finance cost and income tax 2.2The pro forma contribution of this business assuming the acquisition was at the beginning of the yearRevenue 185.6Operating profit before finance cost and income tax 7.7

15ANNUAL RESULTS PRESENTATION 2017
10. Non-current assets held for sale
The assets related to the fish paste spreads business have been presented as “assets of a disposal group classified as held for sale” in terms of IFRS 5 – Non-current Assets Held for Sale and Discontinued Operations at 30 September 2017 following the Board’s decision to dispose of this business.
The carrying values of the assets of this business were remeasured at fair value less costs to sell and the following impairment losses were consequently recognised in the line item “Items of a capital nature” in the statement of comprehensive income for the year ended 30 September 2017.
Nature
Audited Year ended
30 September 2017 R’m
Intangible assets – trademarks 21.0
Goodwill 10.1
Subtotal 31.1
Income tax effect (5.9)
After income tax effect 25.2
The assets of the fish paste spreads business are presented within the Groceries segment and are as follows:
Audited30 September
2017 R’m
Assets of the disposal group classified as held for sale:
Property, plant and equipment 2.3
Intangible assets 12.5
Inventories 5.2
20.0

Realising Potential16
11. Fair value measurementThe information below analyses assets and liabilities that are carried at fair value at each reporting period, by level of hierarchy as required by IFRS 7 and IFRS 13.
Audited fair value measurements at30 September 2017 using:
Quoted prices in active
markets for identical assets
and liabilities(Level 1)
R’m
Significant other
observable input
(Level 2)R’m
Significant unobservable
input(Level 3)
R’m
Assets measured at fair valueAvailable-for-sale financial assets– Listed securities 136.7 – –– Unlisted securities – 1.4 –Derivative financial instruments– Foreign exchange contracts – 22.1 –– Forward purchase contracts on own equity – 231.3 –– Embedded derivatives – 0.6 –Assets of disposal group classified as held for sale – – 12.5
Liabilities measured at fair valueDerivative financial instruments– Foreign exchange contracts – 2.6 –
Audited fair value measurements at30 September 2016 using:
Quoted prices in active
markets for identical assets
and liabilities(Level 1)
R’m
Significant other
observable input
(Level 2)R’m
Significant unobservable
input(Level 3)
R’m
Assets measured at fair valueAvailable-for-sale financial assets– Listed securities 126.8 – –– Unlisted securities – 1.5 –Derivative financial instruments– Foreign exchange contracts – 6.6 –– Forward purchase contracts on own equity – 489.9 –– Embedded derivatives – 0.8 –Biological assets– Vineyards – – 16.0
Liabilities measured at fair valueDerivative financial instruments– Foreign exchange contracts – 16.1 –
There have been no transfers between level one, two or three during the period, nor were there any significant changes to the valuation techniques and input used to determine fair values.

17ANNUAL RESULTS PRESENTATION 2017
11. Fair value measurement (continued)
Financial assets and liabilitiesThe fair values of financial instruments traded in active markets (such as publicly traded derivatives and available-for-sale securities) are based on quoted market prices at the reporting date. A market is regarded as active if quoted prices are readily and regularly available from an exchange, dealer, broker, industry group, pricing service, or regulatory agency, and those prices represent actual and regularly occurring market transactions on an arm’s length basis. The quoted market price used for financial assets held by the Group is the current bid price. The appropriate quoted market price for financial liabilities is the current ask price. These instruments are included in level 1. Instruments included in level 1 comprise primarily JSE-listed equity investments classified as available for sale.
The fair values of financial instruments that are not traded in an active market are determined by using valuation techniques. These valuation techniques maximise the use of observable market data where it is available and rely as little as possible on entity-specific estimates. If all significant inputs required to fair value an instrument were observable, the instrument is included in level 2.
The fair values of the forward purchase contracts on own equity are determined at each reporting date and any changes in the values are recognised in profit or loss. The fair values of the forward purchase contracts have been determined by an independent external professional financial instruments specialist by using a discounted cash flow model. The inputs to this valuation method include the risk free rate, dividend yield, contractual forward price and the spot price at the reporting date.
The Group uses a variety of methods that makes assumptions that are based on market conditions existing at the reporting date. Quoted market prices or dealer quotes for similar instruments are used for long-term debt instruments. Other techniques, such as estimated discounted cash flows, are used to determine the fair value for the remaining financial instruments. The fair value of foreign exchange contracts is determined using quoted forward exchange rates at the reporting date.
The carrying amounts of cash, trade and other receivables less provision for impairment, trade and other payables and short-term borrowings are assumed to approximate their fair values due to the short term until maturity of these assets and liabilities.
The fair value of financial liabilities for disclosure purposes is estimated by discounting the future contractual cash flows at the current market interest rate that is available to the Group for similar financial instruments. The fair values of long-term investments and long-term borrowings are not materially different from the carrying amounts.
Assets of a disposal group classified as held for saleThe assets related to the fish paste spreads business have been presented as “assets of a disposal group classified as held for sale” in terms of IFRS 5 – Non-current Assets Held for Sale and Discontinued Operations for the year ended 30 September 2017. Refer to note 10 for further detail.
In terms of IFRS 5, an entity shall measure a non-current disposal group classified as held for sale at the lower of its carrying amount and fair value less costs to sell. The fair value less costs to sell was determined based on an income valuation approach. In terms of the income valuation approach, the discounted cash flow method is used to determine the present value of projected future cash flows for a cash-generating unit (“CGU”) using a rate of return that is commensurate with the risk associated with the business and the time value of money. This approach requires assumptions about revenue growth rates, operating margins, tax rates and discount rates. The assumptions regarding growth are based on the CGU’s internal forecasts for revenue, operating margins and cash flows for a period of five years and by application of a perpetual long-term growth rate thereafter. Past experience, economic trends as well as market and industry trends were taken into consideration.
The key assumptions used in performing the impairment tests were as follows:
Discount rate (pre tax) 18.0%Perpetual growth rate 5.0%Income tax rate 28.0%

Realising Potential18
12. Preparation of financial statements
These summarised consolidated financial statements have been prepared under the supervision of F Lombard, CA(SA), CFO.
13. Audit
The external auditors, PricewaterhouseCoopers Inc., have audited the Group’s financial statements for the year ended 30 September 2017 and their unqualified auditor’s report is available for inspection at the registered office of the Company.
The Group’s auditors have not reviewed nor reported on any of the comments relating to prospects.
Directors ZL Combi (Chairman), TA Carstens (CEO)*, N Celliers, Prof ASM Karaan, F Lombard*, NS Mjoli-Mncube, PJ Mouton, LE Mthimunye-Bakoro, SS Ntsaluba, G Pretorius, AH Sangqu, NW Thomson (* Executive)
The following changes to the Pioneer Foods Board occurred during the period under review:• Mr F Lombard was appointed as Chief Financial Officer with effect from 1 July 2017.• Mr PM Roux retired as Chief Executive Officer with effect from 1 October 2017.• Mr TA Carstens was appointed as Chief Executive Officer with effect from 1 October 2017.
Company secretary J Jacobs E-mail: [email protected]
Registered addressGlacier Place, 1 Sportica Crescent, Tyger Valley, 7530, South AfricaTel: 021 974 4000 Fax: 086 407 0044E-mail: [email protected]
Transfer secretariesComputershare Investor Services (Pty) Ltd, Rosebank Towers, 15 Biermann Avenue, Rosebank, 2196, South Africa, PO Box 61051, Marshalltown, 2107, South Africa Tel: 011 370 5000 Fax: 011 688 5209
SponsorPSG Capital (Pty) Ltd, PO Box 7403, Stellenbosch, 7599, South Africa Tel: 021 887 9602 Fax: 021 887 9624