summary of studies: philippines transportation...
TRANSCRIPT

Summary of Studies:
Philippines Transportation Sector Emissions
Author: Alvin Mejia
www.transportandclimatechange.org

Introduction
This document contains information on the existing studies and references that have estimated historical and projected emissions from the Philippine transportation sector. The tables included in this document contain concise explanations about the aspects that have been reviewed, such as the methodological approach for emissions quantification, the tools used and the description of the major assumptions that were used in the study, as well as the links to the references.
It intends to give a snapshot of the relevant studies that have been implemented in relation to transport emissions (with a particular focus on CO2). This document is based on studies that have been made available to the team during the time of the review and mainly looks into studies that have provided estimates of the emissions from the transportation sector in the country.

The table below shows the available estimates from the reports that were reviewed as part of the development of this document. 1
1 Regidor and Javier (2014) have estimates for each 5-year interval between 2005-2050, yearly values were interpolated.
1980 1990 2000 2010 2020 2030 2040 2050 2060
0
50000
100000
150000
200000
250000
0
50000
100000
150000
200000
250000
1990
1992
1994
1996
1998
2000
2002
2004
2006
2008
2010
2012
2014
2016
2018
2020
2022
2024
2026
2028
2030
2032
2034
2036
2038
2040
2042
2044
2046
2048
2050
Summary of Available Estimates for PHL Transport Emissions
National communications-mitigation analysis section (ktons CO2e)
CTF -World Bank, TTPI (k tons CO2) - BAU (land only)
CTF -World Bank, TTPI (ktons CO2) -medium carbon (land only)
CTF -World Bank, TTPI (ktons CO2) -low carbon (land only)
Regidor, Javier (ktons CO2) - BAU
Regidor, Javier (ktons CO2) - low carbon
DOE Key Energy Stats (ktCO2e)
Clean Air Asia-Accessing Asia (ktons CO2) (road only)
National communications (ktons CO2e) - official
ALGAS (ktons CO2e)

Study Asia Least Cost Greenhouse Gas Abatement Strategy : Philippines Year published 1998 Main Author/s Multiple authors consisting of national technical experts and international experts Funders Asian Development Bank, Global Environment Facility, United Nations
Development Program Link Not available on-line Objectives of the study The study’s main objective is to come up with a strategy containing least-cost
mitigation measures for reducing climate agents from the energy, forestry and land use and agriculture sectors.
Scope of emission covered CO2, CH4, N2O, CO, NOx, NMVOCs Time horizon 1990-2020 Emission estimation approach The base year emissions (1990) were calculated using the IPCC guidelines (reference
and sectoral approaches were used). The projections took into account transport activity (pkm, tkm) and was not confined to a fuel consumption-based approach.
Tools used MARKAL was used in the analysis of the interventions. MARKAL is a multiperiod, linear programming model of an integrated energy system which uses a bottom up approach to determine the optimal, least-cost configuration of the energy system.
Baseline Scenario Baseline scenario: uses the 1996-2025 projected energy profiles from the PEP Update as inputs to the MARKAL Model + actual data from 1990 to 1995. 1990 Emissions Estimates (Gigagrams) for Transport :
CO2 CH4 N2O NOx CO NMVOC CO2e Road 9,292 1.46 0.38 62.09 493.2 93.06 9,440 Marine 895 0.08 0.02 21.25 2.1 0.61 924 Aviation 453 0.02 0.02 1.81 4.8 0.20 461 Total 10,640 1.56 0.42 85.15 500.1 93.87 10,804
The published projected values up to 2020 were lumped for the energy sector and no sectoral values were given in the report. Energy Sector Emissions Estimates (Gigagrams CO2):
1990 2000 2005 2010 2020 PEP 1996
43,472 121,156 157,487 218,894 429,963
ALGAS 40,296 67,136 126,940 238,260
Mitigation Scenario For transport, “high efficiency transport” (introducing high efficiency cars, trucks and UVs are introduced starting year 2000) was included in the demand side abatement scenarios . This scenario involves the introduction of more efficient transport system to include
• high efficiency private gasoline cars, (from 0.305 to 0.603 vehicle km traveled (vkmt/MJ)2;
• high efficiency diesel trucks, from 0.111 to 0.136 vkmt/MJ; and • high efficiency gasoline utility vehicle, from 0.588 to 0.72 vkmt/MJ
Energy consumption reduced by 555.4 PJ in the 30-year period. CO2 emissions were reduced by 40.3 million tons in the said period, which translates to 1.34 million tons reduced per year( average). The cost of each ton of CO2 avoided is -2.9 USD.
2 Vehicle-km per petajoule. The statement basically states that the assumption is that the efficiency of the transport vehicles in the “high
efficiency” scenario is double that of the baseline.

Study A Strategic Approach to Climate Change in the Philippines Year published 2010 Main Author/s Transport and Traffic Planners (TTPI) Inc. in association with CPI Energy Phils. Inc. Funders World Bank Link http://siteresources.worldbank.org/INTEAPREGTOPENVIRONMENT/
Resources/PHCCSNJan27final.pdf Objectives of the study The main objective of the study is to evaluate the potential for GHG reduction in the
Philippines over the immediate, medium and long terms, up to 2030, in the transport and power sectors. It evaluates low-carbon interventions using a common methodology based on cost-effectiveness.
Scope of emission covered CO2e Time horizon 2008 to 2030 Emission estimation approach The estimation utilized the emission coefficients and the steps as per the IPCC
reference and sectoral approaches. Initial estimates were prepared using the IPCC Reference Approach (top-down), which is based only on the quantities of fuel produced locally, imported, and exported and change in stock. The sectoral approach (bottom-up), which is based on domestic consumption of fuels by the transport and power sectors, was later applied to assess the impacts of GHG emissions mitigation options.
Tools used Excel-based spreadsheet calculations tools were developed by the team. Baseline Scenario The Baseline Scenario for CO2 emissions from the transport sector was based on the
actual transport energy data from 2000 to 2007, and the projected energy profile from 2008 to 2030 based on the 2008-2030 Philippine Energy Plan (PEP 2008). The targets from the PEP 2008 were also considered (e.g. biofuels %). The annual increase in vehicle population was set at 6% for all vehicles. The study combined the IPCC sectoral approach and the ALGAS values for vehicle fuel efficiencies and average distance traveled by the different vehicle types, which were adjusted using recent transport studies during the time of the study.3 The baseline (million tons CO2e) are given below: Million tonsCO2 (Baseline Scenario)
2008 2010 2015 2020 2025 2030 Baseline 24.39 27.4 36.66 49.05 65.63 87.1
Mitigation Scenario Multiple strategies were modeled by the team, taking interventions also from the ALGAS study as well as taking into consideration the relative contribution of vehicle types and services in the transport GHG emissions. The impacts of the proposed strategies are given below. The study evaluated two alternative scenarios – medium and low carbon scenario. The medium scenario assumes that the Philippine Energy Plan 2008 targets on alternative fuels are met (except for the Natural Gas Vehicle Program for Public Transport and the auto-gas targets) and specific measures under the National Energy Efficiency and Conservation Program. Specific vehicle efficiency measures such as the roll-out of improved motor vehicle inspection stations (MVIS) and new transit systems (both BRT and LRT) were considered to be implemented in Metro Manila. Million tonsCO2 Reduction (Medium Scenario)
2010 2015 2020 2025 2030
3 JICA Survey of Inter-regional Passenger and Freight Flows (2005), JICA CALA Road Study (2006), AusAID Managing Truck Overloading
Study (2008), among others.

Biofuels 0.83 3.11 6.61 12.13 20.59 Vehicle Efficiency
2.77 1.83 2.45 3.28 4.37
Demand management
6.17 2.63 2.79 2.99 3.26
The Low-Carbon Scenario assumes a more intensive application of the identified key strategies of biofuels, vehicle efficiency improvements, and transport demand reduction. In particular, this scenario calls for accelerated nationwide implementation of 20% mix for biodiesel (by 2020) and attaining 85% bioethanol blend in 2025. Likewise, the fuel efficiency improvements and BRT lines should be pursued beyond Metro Manila and its neighboring regions. This intensive scenario is expected to bring down GHG emissions by as much as 62% from baseline estimate or a maximum potential reduction of 54 MtCO2e. Million tonsCO2 Reduction (Low Carbon Scenario)
2010 2015 2020 2025 2030 Biofuels 0.83 6.86 16.66 28.02 37.48 Vehicle Efficiency
2.77 3.70 4.95 6.62 8.82
Demand management
6.17 6.54 6.86 7.27 7.82
The breakdown of the interventions are given below: Mitigation Potential and Cost-Effectiveness of Low Carbon Interventions
Annual (Average) CO2 mitigation potential (MtCO2e)
USD/tCO2e (co-benefits not included)
USD/tCO2e4 (co-benefits included)
Biofuels 15.8 30.8 -9.8 Road maintenance
2.3 172.6 -2.1
MVIS (Motor vehicle inspection system)
2.3 7.7 -5
Light vehicle technologies
0.3 103.4
0
4-stroke tricycles 0.2 154.8 0 Congestion pricing
1.2 3.7 -0.2
Public transport improvement
1.3 3.3 -19.8
BRT systems (100 km)
4.2 5.1 -29.7
LRT/MRT (46 km)
0.2 766.7 -33.8
4 Health benefits were valuated by assigning a static USD value per ton of (100 USD) per ton of gasoline fuel reduced. Source: World
Bank, Environmental Cost of Fossil Fuels: A Rapid Assessment Method with Application to Six Cities,
2000

Study Long-term Action Plan for ASEAN : Philippine Study Year published 2014 Link http://cleanairinitiative.org/portal/lpadownload Main Author/s Prof. Jose Regin Regidor, Ms. Sheila Javier of the University of the Philippine National
Center for Transportation Studies Funders/ Supporting organizations
Nippon Foundation, Institution for Transport Policy Studies, Clean Air Asia
Objectives of the study The study aims at formulating a long-term action plan for transport to achieve a 0.33 tons per capita level (road, rail, water, air) by 2050. This 0.33 tons per capita target was based on calculations done by the International Energy Agency (IEA) to reflect equal levels of per capita transport CO2 emissions that would be needed in order to stay within the “2 degree” scenario.5
Scope of emission covered CO2 Time horizon 2005 to 2050 Emission estimation approach
The calculations used a bottom-up approach using passenger-km and ton-km as the main activity parameters. The activity estimates are exogenous factors in the emissions modelling process. The results include emissions estimates (and reduction potential) by mode and vehicle type (e.g. road cars, rail freight, air- passenger).
Tools used Visioning (qualitative analysis for recommending appropriate mitigation actions) and backcasting tools (quantitative excel-based models that are used for emissions impact analysis of the interventions applied) were developed for 10 ASEAN countries including the Philippines.
Baseline Scenario The baseline scenario utilizes vehicle-km projections based on long-term projection of the population, GDP-based projections for vehicle ownership, and static VKM/vehicle assumptions. The population projections were based on the medium scenario of the UN World Population Prospects (annual average growth rate of 1.35% between 2005 and 2050).6 The GDP growth rates are based on a study by the Asian Development Bank Institute (2012).7 The GDP per capita were computed based on these numbers and were used as a basis for estimating the motorization indexes (vehicle/1000 people) for different types of vehicles (taking into consideration the historical trends in the relationship between the motorization indexes and GDP per capita growth). The vehicle projections are then translated into passenger-kilometer and ton-kilometer travel activity by taking into account local data on vehicle-kilometers and average occupancies and loading of vehicles. Passenger travel activity (passenger-km) is estimated to grow at an annual average rate of 5.1% and freight transport (ton-km) is estimated to grow at 4.7% per annum (between 2005 and 2050). Million tons CO2 (Business-as-usual scenario)
2005 2010 2020 2030 2040 2050 Total 27.25 36.11 55.47 87.31 135.32 206.27 Road 23.80 31.97 50.78 81.77 128.46 197.24
The detailed of the baseline scenario modeling can be downloaded in the link specified above. The emissions are computed for 15 different vehicle types-transport type (e.g.
5 The degree scenario describes an energy system consistent with an emissions trajectory that recent climate science research indicates would
give an 80% chance of limiting average global temperature increase to 2°C. (see http://www.iea.org/publications/scenariosandprojections/)
6 http://esa.un.org/wpp/
7 Asian Development Bank Institute. (2012). ASEAN 2030, Towards a Borderless Economic Community.
passenger air, freight air, etc…)
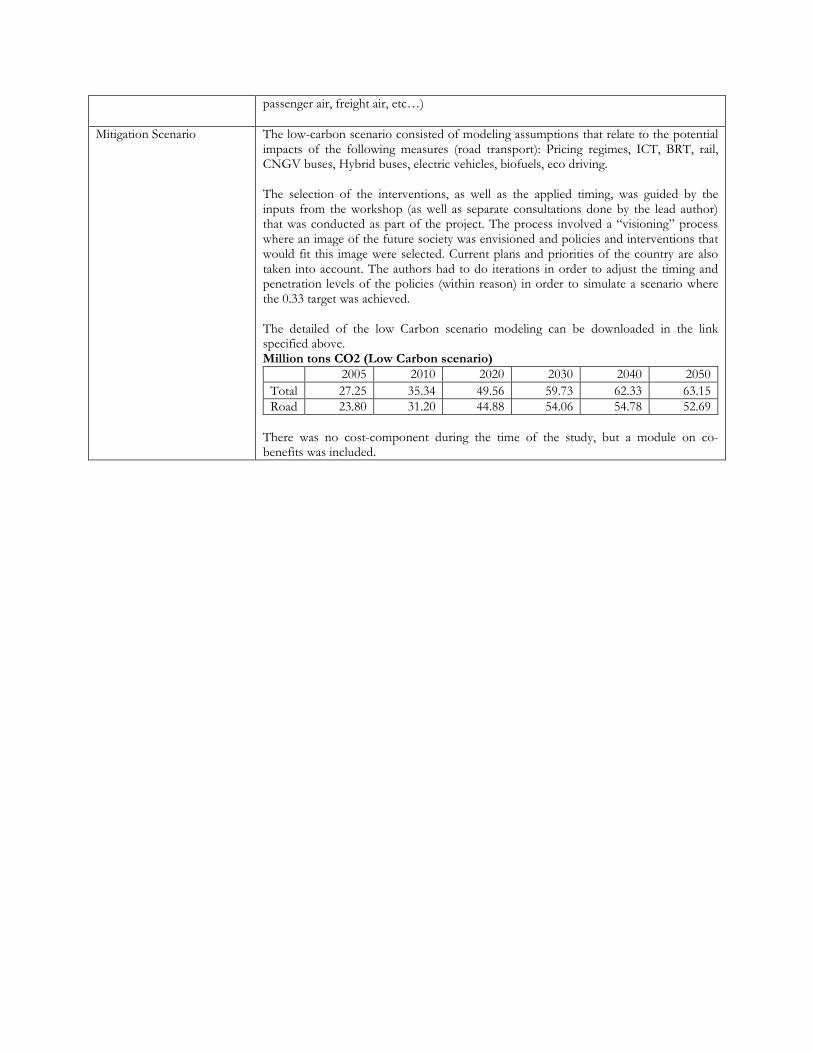
Mitigation Scenario The low-carbon scenario consisted of modeling assumptions that relate to the potential impacts of the following measures (road transport): Pricing regimes, ICT, BRT, rail, CNGV buses, Hybrid buses, electric vehicles, biofuels, eco driving. The selection of the interventions, as well as the applied timing, was guided by the inputs from the workshop (as well as separate consultations done by the lead author) that was conducted as part of the project. The process involved a “visioning” process where an image of the future society was envisioned and policies and interventions that would fit this image were selected. Current plans and priorities of the country are also taken into account. The authors had to do iterations in order to adjust the timing and penetration levels of the policies (within reason) in order to simulate a scenario where the 0.33 target was achieved. The detailed of the low Carbon scenario modeling can be downloaded in the link specified above. Million tons CO2 (Low Carbon scenario)
2005 2010 2020 2030 2040 2050 Total 27.25 35.34 49.56 59.73 62.33 63.15 Road 23.80 31.20 44.88 54.06 54.78 52.69
There was no cost-component during the time of the study, but a module on co-benefits was included.

Study Philippines’ Second National Communications to the UNFCCC Year published 2015 Link http://unfccc.int/resource/docs/natc/phlnc2.pdf Main Author/s Philippine Government Funders/ Supporting organizations
Support from GEF
Objectives of the study The National communications to the UNFCCC contains the inventory of the country’s GHG emissions (in this case, the base year is 2000).
Scope of emission covered The calculation of the tCO2 equivalents considered CO2, CH4 and N2O. Time horizon 2000 (official submission); a mitigation analysis was done up to the year 2020. Emission estimation approach The IPCC sectoral approach was used (based on the sectoral and sub-sectoral fuel
consumption estimates from the Department of Energy’s energy balance sheets). The transportation emissions are estimated for the sub-sectors (e.g. navigation, aviation, road, rail), but disaggregation of the road transport emissions by vehicle is not part of the process.
Tools used The official IPCC tools and spreadsheets were used in the inventory. The mitigation analysis used the Long-range Energy Alternatives Planning (LEAP) Tool.
Baseline Scenario The overall transport emissions in 2000 are: Kilotons (CO2e) in the Year 2000
CO2 CH4 N2O Total Transport 25,792.03 3.45 0.23 25,935.78
In comparison, the 1994 inventory ktCO2e emissions for transport were at 15,888,8 growing at an annual average of 8.5%. In 2000, the road transport sub-sector contributed 79% of the total CO2e emissions of the whole transport sector, followed by national navigation (17%) and domestic aviation (4%). For the mitigation analysis, DOE values were used up to the year 2008. A 3% annual average increase in energy consumption (sector wide) was used in projecting future consumption up to 2020. Gigagrams CO2e Estimates and Projections9
2000 2005 2010 2015 2020 Domestic aviation 1,000 700 600 600 800 Road 20,400 26,000 25,400 29,800 35,100 Rail
1,200
National Naviation 2,800 2,400 2,100 2,500 2,900 Total 24,200 30,300 28,100 32,900 38,800
8 15,800 ktons CO2, 2.15 ktons CH4, 0.14 ktons N2O.
9 Yearly values are available in the final SNC document. This table was taken from the mitigation analysis section. As you may notice, the
total emissions for the year 2000 do not match the figures in the previous table.
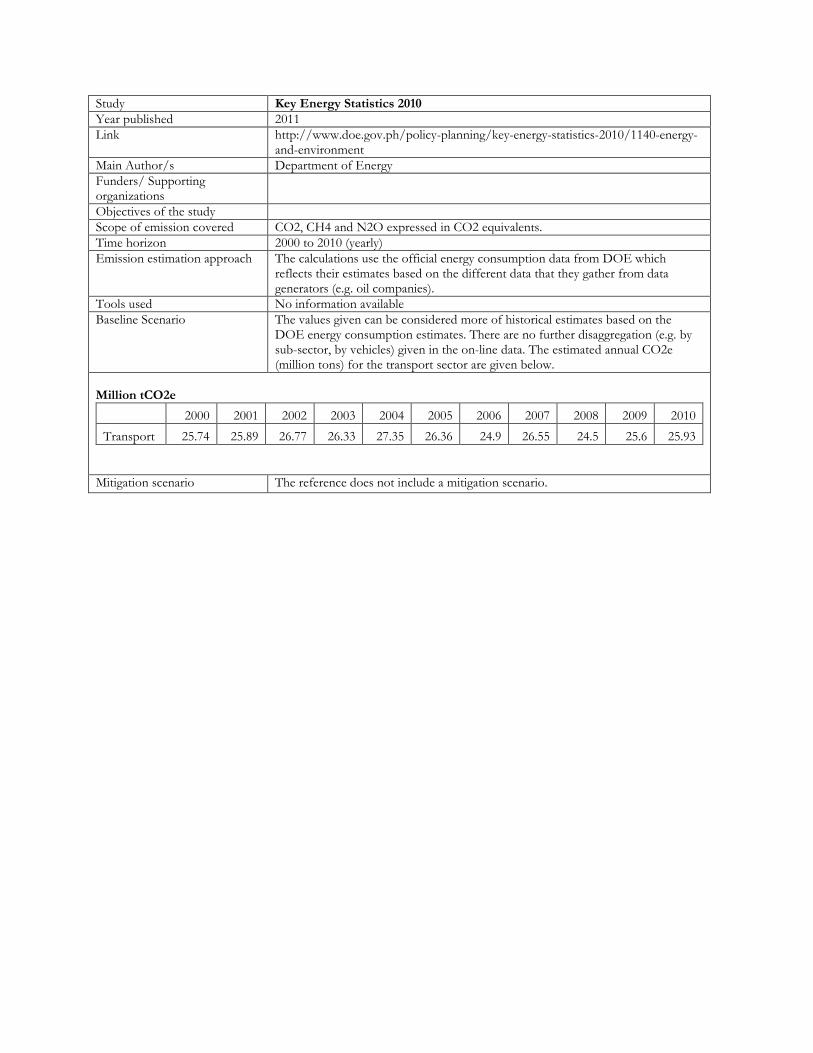
Study Key Energy Statistics 2010 Year published 2011 Link http://www.doe.gov.ph/policy-planning/key-energy-statistics-2010/1140-energy-
and-environment Main Author/s Department of Energy Funders/ Supporting organizations
Objectives of the study Scope of emission covered CO2, CH4 and N2O expressed in CO2 equivalents. Time horizon 2000 to 2010 (yearly) Emission estimation approach The calculations use the official energy consumption data from DOE which
reflects their estimates based on the different data that they gather from data generators (e.g. oil companies).
Tools used No information available Baseline Scenario The values given can be considered more of historical estimates based on the
DOE energy consumption estimates. There are no further disaggregation (e.g. by sub-sector, by vehicles) given in the on-line data. The estimated annual CO2e (million tons) for the transport sector are given below.
Million tCO2e
2000 2001 2002 2003 2004 2005 2006 2007 2008 2009 2010 Transport 25.74 25.89 26.77 26.33 27.35 26.36 24.9 26.55 24.5 25.6 25.93
Mitigation scenario The reference does not include a mitigation scenario.

Study APEC Energy Demand and Supply Outlook -5th Edition Year published 2013 Link http://aperc.ieej.or.jp/publications/reports/outlook/5th/volume2/
EDSO5_V2_Philippines.pdf Main Author/s Asia Pacific Energy Research Center Funders/ Supporting organizations
Objectives of the study The key objectives of the APEC Energy Demand and Supply Outlook are to help facilitate APEC cooperation by providing policymakers with; ・a useful reference work on energy in the APEC region, ・a statistically-supported review of the challenges and opportunities facing the APEC economies individually and as a region, ・a source of ideas and approaches for dealing with these energy challenges and capitalizing on energy opportunities.
Scope of emission covered CO2 Time horizon 2010-2035 Emission estimation approach See explanation in the tools section Tools used The study uses the APERC Energy Demand and Supply Model. The model has
separate sectoral modules for 1) Industrial and non-energy demand; 2) Residential/commercial/agricultural demand; 3) transportation demand model. These sectoral modules estimate the future energy demand in the said sectors (not activity). The energy demand projections are mainly influenced by the input factors such as socio-economic indicators, fuel production, biofuel contents and market efficiencies. The report on the model framework is not so clear how the vehicle projections that are quoted in the country reports are used in the projection of the energy demand for the sectors.
Baseline Scenario Based on the historical data and key assumptions on the relevant socio-economic parameters, the study estimates that the final energy demand is expected to expand at an average annual rate of 2.9% from 2010 to 2035. This translates to a total final energy demand of 49 Mtoe by 2035, from 23.8 Mtoe in 2010. The transport sector (including international transport) is expected to account for 42% share of the final energy demand and 67% of the oil requirement by 2035. The sector’s total demand will expand to 19 Mtoe by 2035 from the 2010 level of 8.4 Mtoe. The study estimates that the light vehicle fleet is expected to increase at an annual rate of 3.4% during the analysis period. It estimates that the fleet will be 40% gasoline-fed, 19% diesel fed and 6% other-fuel-fed (LPG, hybrids) by 2035. The remaining 35% of the light vehicle fleet are motorcycles. The study estimates that CO2 emissions will be growing at 4.5% per annum, from 75.9 million tons in 2010 to 230.2 million in 2035.10 The specific numbers for transportation are not given in the publicly-available report, only the charts are available.
Mitigation Scenario The study estimates the impacts of going for 3 sets of alternative scenarios as discussed :
a) High gas scenario – assumes that natural gas will reach 62.7 Mtoe in 2035 (10 times higher than the BAU). The implication on the transport sector
10 Economy-wide (sectors include the following: electricity generation, other transformation, industry, domestic transport, international
transport, other)

is that a higher share of gas-fed vehicles and usage of gas in the transport sector will be realized. However, the impacts analyzed were mainly on the electricity sector.
b) Alternative urban development scenario – Urban development scenarios were simulated (high sprawl,11 fixed urban land12) which impacted the assumptions on vehicle ownership. The CO2 emissions from light duty vehicles would be 16% higher in the High Sprawl scenario compared to BAU in 2035. The light vehicle CO2 emissions in the fixed urban land scenario is 24% lower than the BAU.
c) Virtual clean car race – This scenario embodies a high penetration of electric, hybrid, natural gas and hydrogen vehicles (e.g. conventional vehicles in the fleet will be reduced from 98.4% in the BAU to 48% in the alternative scenarios – i.e. hyper car transition, electric vehicle transition, hydrogen vehicle transition, natural gas vehicle transition. The simulations point to the “hyper car transition” scenario as the one with the biggest reduction potential in terms of CO2 – 26% compared to BAU in 2035. The Natural Gas scenario reduced the emissions by 6% compared to BAU. The electric vehicle transition showed no difference compared to BAU in 2035 (perhaps due to the prevalence of coal). The hydrogen vehicle scenario resulted in higher CO2 emissions in 2035 compared to BAU (13%).
11 Vehicle ownership in this high sprawl scenario is 8% higher than the BAU in 2035.
12 Vehicle ownership in the fixed urban land scenario is 13% lower than BAU in 2035.

Study Accessing Asia : Air Pollution and GHG Emissions Indicators for Road Transport and Electricity Sectors
Year published 2012 Link http://cleanairinitiative.org/portal/projects/MeasuringAPandGHGEmissions Main Author/s Clean Air Asia Funders/ Supporting organizations Funded by World Bank Objectives of the study The study intended to provide guidance on estimating (bottom-up) emissions
from the transport and electricity sectors within the context of the Asian region. The study also estimated country-specific historical emissions for 13 Asian countries (transport and electricity) using the specified methodology.
Scope of emission covered For transport, CO2, PM, NOx were estimated. Time horizon 2000-2010 Emission estimation approach A bottom up approach was used for estimating the emissions from the road
transport sector (basing mainly on the ASIF approach – activity-structure- intensity- factor of emissions). Vehicle populations were sourced from official data and were re-categorized to conform with the regional guidance. Vehicle activity (vehicle-km) were sourced from existing studies. Energy intensity (vehicle- km/l) and emission factors (kg emissions/vehicle-km) values were also sourced from existing local evidences.
Tools used Excel-based calculation sheets were developed for the calculations. Baseline Scenario The study covers estimates based on historical data (vehicle numbers) and
available estimates (vehicle-km per year per vehicle type, fuel efficiencies (km/liter of fuel) per vehicle type and emission factors (kgCO2/liter) per fuel type). The road transport emissions are given below.
2000 2001 2002 2003 2004 2005 2006 2007 2008 2009 2010 CO2 (million tons) 36.17 36.93 39.36 39.55 41.87 42.07 43.09 43.00 44.24 46.22 47.93 PM (thousand tons) 27.46 27.57 29.72 29.85 31.30 31.90 32.62 32.61 33.60 35.36 36.82 NOx emissions (thousand tons)
173.04
173.50
183.28
183.41
193.44
195.58
201.40
201.45
210.18
221.31
229.89
The % distribution of the CO2 emissions estimates are given below for each of the vehicle categories that were used :
2000 2001 2002 2003 2004 2005 2006 2007 2008 2009 2010 2W – motorcycles 0% 1% 1% 1% 1% 1% 1% 1% 1% 1% 1% 3W – tricycles 5% 5% 5% 5% 6% 7% 8% 8% 9% 9% 10% PC – passenger cars 5% 5% 5% 5% 5% 5% 5% 5% 5% 5% 5% MUV – multi-utility vehicles (including jeepneys) 25% 25% 26% 26% 26% 26% 25% 25% 24% 23% 23% BUS 3% 3% 3% 2% 2% 2% 2% 2% 2% 2% 2% LCV – light trucks 28% 28% 28% 29% 28% 28% 27% 27% 26% 25% 25% HCV – heavy trucks 35% 34% 33% 32% 32% 31% 33% 32% 33% 34% 33%
Mitigation scenario The study does not include a mitigation scenario.