summary of the m’clintock - environment yukon • we conducted an early-winter intensive moose...
TRANSCRIPT

MOOSE SURVEY TESLIN BURN AREA
EARLY-WINTER 2013
Prepared by: Matt Clarke, Lars Jessup, Susan Westover, and Sophie Czetwertynski
November 2014

MOOSE SURVEY TESLIN BURN AREA EARLY-WINTER 2013
Yukon Department of Environment
Fish and Wildlife Branch TR-14-15
Acknowledgements We would like to thank the Teslin Tlingit Council, the Carcross/Tagish First Nation, the Teslin Renewable Resource Council (RRC), the Carcross RRC, and the Taku River Tlingit for their assistance and support. Art Johns, Ted Hall, Frank Johnstone, Ken Reeder, Randy Taylor, Roland Gergel, Caroline Allen, Dave Hett, Robert Bosely, Gillian Rourke, Dawna Hope and Carol Foster provided their keen eyes as observers during the survey. Gerd Mannsperger (Alpine Aviation) provided fixed-wing aircraft support. Graham Rusk and Sid Goldschmidt (TRK Helicopters) provided rotary aircraft support. And thank you to the Stoneman family for welcoming a survey crew into their cabin after the helicopter iced up. Environment Yukon (Fish and Wildlife Branch) provided staff and funding. © 2014 Yukon Department of Environment Copies available from:
Yukon Department of Environment Fish and Wildlife Branch, V-5R Box 2703, Whitehorse, Yukon Y1A 2C6 Phone (867) 667-5721, Fax (867) 393-6263 Email: [email protected]
Also available online at www.env.gov.yk.ca Suggested citation: CLARKE, M., L. JESSUP, S. WESTOVER, AND S. CZETWERTYNSKI. 2014. Teslin Burn Early-winter
Moose Survey 2013. Yukon Fish and Wildlife Branch Report TR-14-15. Whitehorse, Yukon, Canada
Summary • We conducted an early-winter intensive moose survey in the Teslin Burn
area west of Teslin from November 19 to 28, 2013. The main purposes of this survey were to estimate numbers, distribution, and age and sex composition of moose, and to determine potential population trends.
• We surveyed about 37% of the total area, counting a total of 352 moose: 161 adult and yearling cows, 56 calves, 29 yearling bulls, and 106 adult bulls.
• We estimated that there were 791 ± 19% (641–941) moose in the Teslin Burn survey area, equaling a density of 290 moose per 1,000 km2 of total area. Although the population is about 31% lower than it was in 1984, the current habitat conditions are no longer as productive as they were in the late 1970s and early 1980s, and the current population estimate reflects this change in post-burn habitat. The estimated recruitment rates showed very good calf survival in 2012 and 2013. We estimated there were 48 calves and 47 yearlings per 100 adult cows, well above recommended levels for stable populations. The twinning rate was high, with 11% of cows observed with calves having twins.
• The estimated 71 adult bull/100 adult cows was similar to the 65 adult bull /100 adult cows that was estimated in 1984, and well above recommended minimum levels to breed cows.
• Current estimated total harvest rate in the survey area ranges from 2.3% to 3.8% of the estimated moose population. Complete First Nation harvest data is needed to confirm the actual harvest rate.
Teslin Burn Early-winter 2013 Moose Survey i

Table of Contents Acknowledgements ......................................................................... Inside Cover Summary ......................................................................................................... i Table of Contents ............................................................................................ ii List of Tables................................................................................................... ii List of Figures ................................................................................................ iii Introduction .................................................................................................... 1
Community Involvement ............................................................................... 1 Study Area ...................................................................................................... 1
Previous Surveys .......................................................................................... 5 Methods .......................................................................................................... 7 Results and Discussion ................................................................................... 8
Weather and Snow Conditions ...................................................................... 8 Stratification (Identification of high and low moose density blocks) ............... 9 Coverage ...................................................................................................... 9 Observations and Distribution of Moose ....................................................... 9 Moose Abundance and Density ................................................................... 10 Sex and Age Ratios ..................................................................................... 12 Population Status and Trends .................................................................... 12 Harvest ...................................................................................................... 16 Other Wildlife Sightings .............................................................................. 17
Conclusions and Recommendations .............................................................. 20 Literature Cited ............................................................................................. 21
List of Tables Table 1. Observations of moose during the 2013 Teslin Burn survey. ............ 10 Table 2. Estimated abundance of moose in the Teslin Burn survey area in
November, 2013. ...................................................................................... 10 Table 3. Estimated age and sex ratios in the Teslin Burn survey area in
November, 2013. ...................................................................................... 12 Table 4. Comparison of early-winter moose population survey results from the
Teslin Burn survey area. .......................................................................... 13 Table 5. Average annual (2009-2013) licensed moose harvest and allowable
harvest summary for the 2013 Teslin Burn survey area. ........................... 19
Teslin Burn Early-winter 2013 Moose Survey ii

List of Figures Figure 1. Teslin Burn moose survey area, November 2013. ............................. 3 Figure 2. Fire history in Teslin Burn moose survey area, from 1946 to 2013. .. 4 Figure 3. Previous moose population surveys within the Teslin Burn survey
area.. ......................................................................................................... 6 Figure 4. Results of Teslin Burn moose stratification survey, 2013. ............... 11 Figure 5. Results of the 2013 Teslin Burn moose census survey. ................... 14 Figure 6. Estimated abundance with 90% Confidence Interval (vertical error
bars) from early-winter moose population surveys in the Teslin Burn area from 1982 to 2013. ................................................................................... 15
Figure 7. Annual reported moose harvest (not including First Nation harvest) from 1979–2013 in the 2013 Teslin Burn survey area. .............................. 18
Teslin Burn Early-winter 2013 Moose Survey iii


Introduction This report summarizes the results of the early-winter survey of moose in the Teslin Burn area, conducted 19 – 28 November, 2013. The purposes of this survey were to:
• estimate numbers (abundance);
• determine distribution (where the moose are found at that time of year);
• examine age and sex composition; and
• determine population trends.
Community Involvement Moose have been a key part of First Nation peoples’ subsistence lifestyle for generations and today are the most widely hunted game species by both First Nation and non-First Nation hunters.
Reflecting their interest in moose management, Teslin community members have participated as observers in moose surveys in the area. Involvement in these surveys, particularly late winter composition surveys where few moose were observed, fostered the perception that the Teslin Burn moose population was doing poorly. For this reason, Teslin community members have expressed an ongoing interest in updating the moose population information.
In 2005 and 2006, the Teslin Tlingit Council, the Teslin Renewable Resources Council (TRRC) and Environment Yukon spent a considerable amount of energy drafting the Teslin Integrated
Fish & Wildlife Plan for 2006-2011. The draft plan was developed following a final review of the previous integrated fish and wildlife plan, an open house hosted by TRRC in 2005, and a public planning workshop in 2006. Lower numbers of moose in the Teslin Burn area was identified as a concern in this planning exercise. To address this concern, the plan suggested a solution that entailed an assessment of habitat quality, harvest reporting for all user groups, and if needed, the development of a moose management plan to address population concerns.
Although this plan was never finalized, and therefore the planning participants did not undertake all of the suggested actions, the planning efforts dedicated to the Teslin Burn are indicative of the high level of community interest in maintaining a healthy moose population in this area.
Study Area The 2013 Teslin Burn survey area covered the entire Teslin Burn moose management unit (MMU), and included Game Management Subzones (GMS) 9-08 to 9-11 (Figure 1). The area, between the Atlin Road and Teslin Lake and south from the Alaska Highway to the Yukon – B.C. border, was about 2,730 km².
Most of the study area is considered suitable moose habitat except for the roughly 7% that is large water bodies (0.5 km2 or more
Teslin Burn Early-winter 2013 Moose Survey 1

in size) or land at or above 1,524 m (5,000 feet) in elevation.
The survey area is almost entirely within the Yukon Southern Lakes ecoregion; a small section in the southwest is within the Boreal Mountains and Plateaus ecoregion (Yukon Ecoregions Working Group 2004).
The climate in the area is generally dry or arid, falling within the rain shadow of the Coast Mountains (Yukon Ecoregions Working Group 2004).
The climate of the eastern side of the survey area is likely influenced by Teslin Lake, both in terms of slightly increased precipitation and higher average temperatures.
Sub-alpine habitat is relatively limited within the survey area. Isolated mountain blocks around Mount Bryde, Hayes Peak, and Mount White comprise the alpine terrain (Figure 1). A large portion of the survey area consists of upland valleys and hills, with valley bottoms generally above 750 m (2,500 feet) and ridge tops below treeline. The area is dissected by numerous creek drainages and peppered with small lakes and wetlands. The largest drainages are Teenah / Seaforth Creek draining to the north, and Snafu and Tarfu creeks draining to the west.
Much of the study area burned by a stand-replacing fire in 1958 in what was known as the “Teslin Burn” (Figure 2). The forest is still transitioning from post-burn deciduous to mature coniferous stands. Lodgepole pine is prevalent
on south slopes, plateaus, and dry valley bottoms while mixed spruce is found in the steeper creek drainages and north slopes. Older willow and aspen are still noticeable, often interspersed with maturing coniferous stands. Shrubs including willow and dwarf birch are typical of sub-alpine area on the higher slopes and plateaus.
Moose are commonly associated with post-fire habitat in the boreal forest. Wildfire turns mature coniferous forests into shrub habitat, providing excellent browse for moose. Naturally, the moose population responds with an increased density 11 to 30 years post-fire (depending on variables such as fire intensity and duration, soil characteristics, predation, and harvest), when regenerating willow, aspen and birch is most available (Kelsall et al. 1977, Schwartz and Franzmann 1989). In the study area, it is therefore expected that the moose density would have been elevated for some time between 1969 and 1988, which was documented through a number of surveys in the area. Thereafter, stems of maturing willow, aspen, and birch grow beyond the reach of browsing moose, ultimately returning the moose population to densities comparable to pre-burn levels as the forest transitions to coniferous-dominated.
Teslin Burn Early-winter 2013 Moose Survey 2

Figure 1. Teslin Burn moose survey area, November 2013.
Teslin Burn Early-winter 2013 Moose Survey 3

Figure 2. Fire history in Teslin Burn moose survey area, from 1946 to 2013.
Teslin Burn Early-winter 2013 Moose Survey 4
Previous Surveys The Teslin Burn survey area has a long history of moose surveys dating back to 1974. The surveys have estimated population size, age and sex composition, and habitat use or distribution of moose in the area. Multiple survey methodologies were used over the years as new survey techniques were adopted, and survey boundaries often varied.
The earliest survey that provides baseline information comes from a 1974 late-winter transect survey estimating moose abundance by habitat type and extrapolating by total area. This survey estimated that there were 445 moose in the Teslin Burn area, with 68 total bulls / 100 total cows and 24 calves / 100 total cows (Hoefs 1974a). The same survey also estimated the harvest rate in 1973 to be 15%, which raised concerns as the recruitment rate (percent calves in the population) was only 12.5%.
A further survey was flown in December 1974, estimating the population at 574 moose, with 91 bulls / 100 total cows and 17 calves / 100 total cows (Lortie 1974). This survey predicted a natural drop in moose numbers as the burn aged, and refuted earlier concerns about overharvest. A survey to estimate calf recruitment was flown in June 1974 but failed to obtain valid results (Hoefs 1974b).
The Teslin Burn survey area was flown again in December 1976, obtaining comparable data to the 1974 survey (Hoefs 1976). This survey reported the same ratio of calves to total cows, but a decline in
moose abundance of 12% to 15%, and a reduced bull/ total cow ratio of 47 bulls/ 100 total cows when compared to the 1974 survey (Hoefs 1976). Another, less intensive, survey was also flown in late-winter 1976, obtaining wildlife observations in the area (Lortie 1976).
A single survey block within the Teslin Burn was flown in 1979, selected for comparison to a survey flown in 1978 (Larsen 1979). No report is available for any 1978 survey and no estimate of population size or sex ratios was made in 1979.
Intensive early-winter population surveys were flown in the Teslin Burn survey area in 1982 (Markel and Larsen 1983), in the west half of the survey area in 1983 (Markel and Larsen 1987a), and in the entire area in 1984 (Markel and Larsen 1987b).
These surveys followed a stratified random block sampling methodology similar to what was used in the 2013 survey. Results for these surveys are presented and discussed in the Population Status and Trends section, and the comparable survey areas are shown in Figure 3.
A less intensive stratification survey was flown in 2004 to estimate population size by modeling stratification results. This method estimated that there were 395 moose in the survey area (Environment Yukon 2004). This result is not comparable to, nor as reliable as, the 2013 survey.
Teslin Burn Early-winter 2013 Moose Survey 5
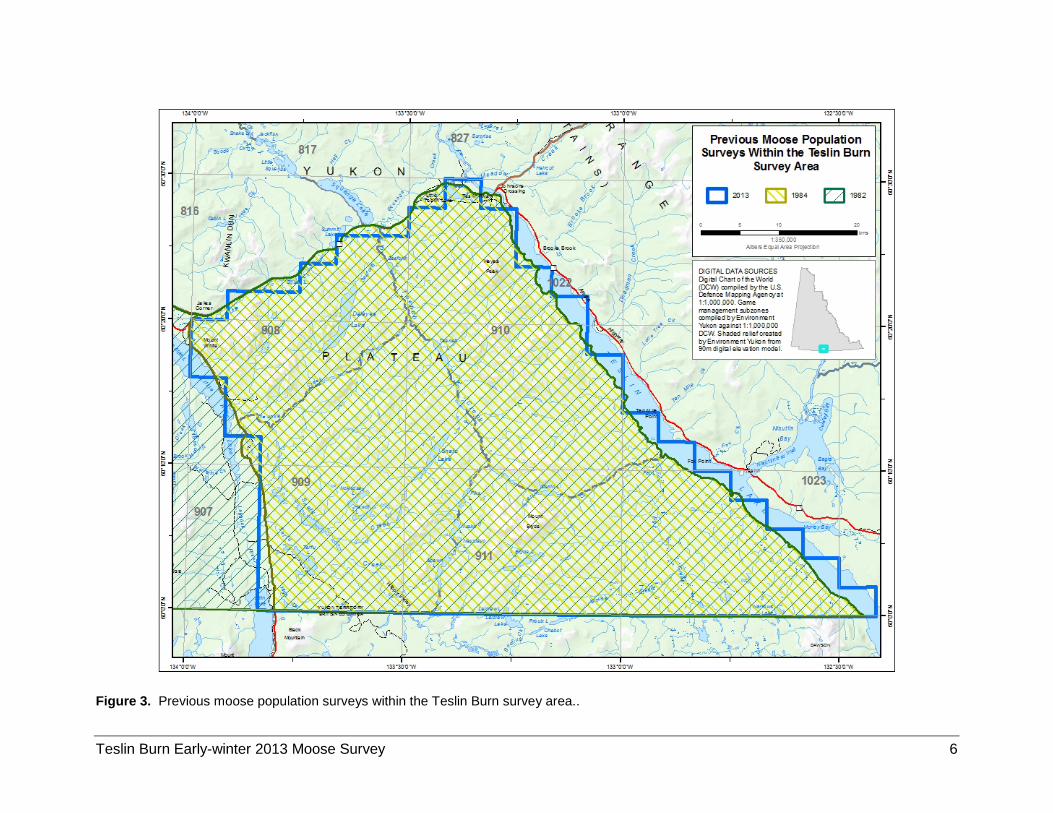
Figure 3. Previous moose population surveys within the Teslin Burn survey area..
Teslin Burn Early-winter 2013 Moose Survey 6
As part of a moose monitoring program in the Teslin Tlingit Traditional Territory, less intensive early-winter moose composition surveys were also flown in 2005, 2006 and 2007 to estimate age and sex ratios (Florkiewicz 2006a, b; McLelland 2007). A late-winter recruitment survey was flown in 2008 (McLelland 2008) to determine calf survival. These surveys were often hampered by low sample sizes and had mixed results.
Methods We have adopted and modified a geospatial survey technique to survey moose, developed by the Alaska Department of Fish and Game (Kellie and DeLong 2006). The field sampling is similar to the way we conducted our moose surveys in the past, except that we count moose in rectangular rather than irregularly shaped survey units.
The survey area was divided into 159 rectangular blocks, each block being approximately 17 km². We then flew a path over each block in a fixed-wing aircraft (Maule M-7) at a height of 90 – 150 m (300 – 500 ft) above ground level with a target search intensity of 0.12 – 0.17 min/ km² (160 – 190 km/hr). We observed habitat and recorded any sightings of moose or moose tracks, and we used this information in combination with local knowledge to stratify the blocks into high or low expected moose abundance. This is called the “stratification” part of the survey. Habitat quality was generally the most important factor
when assigning blocks into the 2 strata. For example, a block with a significant amount of high quality early-winter moose habitat (upland or subalpine areas with abundant willow forage) would be called a high abundance block even if no moose were seen. Additionally, if 4 or more moose were seen, the block was usually called a high. Where fewer than 4 moose were seen and habitat quality was marginal, the block was called a low.
We randomly selected blocks for survey, attempting to fly a suitable sample of high and low stratum blocks to allow extrapolation of the observed results to the entire survey area. Given that the variability in the data is usually found in the high blocks, we usually select a higher proportion of high blocks than low blocks to survey.
We flew each selected block by helicopter (Bell 206 or AS350 B2) with a targeted search intensity of 2 min/km2, or about 34 minutes per block. Each helicopter had 3 observers in addition to the pilot. Observers attempted to sight every moose in each block. This is referred to as the “census” part of the survey.
Moose were classified by age (adult, yearling, or calf) and sex. Because adult cows are difficult to distinguish from yearling cows, they were counted together. The number of yearling cows was assumed to equal the number of yearling bulls, so the total yearling count was the number of yearling bulls times 2. The total number of adult cows was calculated as the total cows minus
Teslin Burn Early-winter 2013 Moose Survey 7

the yearling bulls (again assuming equal numbers of yearling bulls and yearling cows). The number of cows with 2 calves divided by the total number of cows with calves represents the twinning rate, or the percentage of cows with calves that had twins.
We used a computer program called Moosepop (Gasaway et al. 1986) to estimate the total number of moose by age and sex in the entire survey area.
We based the estimate on the numbers of moose counted in the selected blocks during the census, the distribution of these blocks and how we classified the blocks we did not count. Generally, the more blocks that are searched during the census portion of the survey, the more precise and reliable the resulting population estimate. A sightability correction factor (SCF) was applied to the total estimated number within each stratum to account for moose that we missed (Becker and Reed 1990). In Yukon, we use an average SCF developed using data from previous early-winter moose population surveys across Yukon (equal to 1.09, or assuming we missed about 9% of moose, with a variance of 0.4%).
To allow comparison between survey years, we compared survey results analyzed using the Stratified Random Block method, but did not apply the SCF because it was not calculated during the earlier surveys.
Results and Discussion Weather and Snow Conditions In general, early-winter moose surveys start in the beginning of November as soon as there is enough snow to fully cover the ground, making it easy to see moose and tracks. The 2013 survey did not start until 19 November due to low snowfall. Snow depth was low (<15 cm) to moderate (17–26 cm) throughout the study area for the duration of the survey.
However, snow coverage was generally complete, but with bare patches occurring in some blocks with exposed, windswept terrain.
Temperatures were cold during stratification (-20 °C to -25 °C) but relatively mild during the rest of the survey (0 °C to -20 °C). Weather was initially sunny and clear, but highly variable over the remainder of the survey period. There were 2 very clear days near the beginning and end of the survey with great visibility, but low fog surrounding Teslin Lake made surveying near the lake impossible. Survey days were also cut short twice due to snow, low cloud, and poor visibility. Poor weather conditions overnight seemed to have pushed moose down into the trees in at least one surveyed area on the last day. Ice fog in the vicinity of a fuel cache on the Squanga Lake airstrip resulted in ice build-up on the main helicopter rotors while re-fueling, which grounded the helicopter and crew for an afternoon.
Teslin Burn Early-winter 2013 Moose Survey 8

Stratification (Identification of high and low moose density blocks) Stratification flights occurred 19 – 20 November, 2013. We covered the entire survey area in 306 minutes (5.1 hours) not including 141 minutes (2.4 hours) of flight time needed to ferry between our home base and the survey area. The time spent surveying resulted in a search intensity of 0.11 min/km2, which was just below our target intensity of 0.12 – 0.17 min/km2.
We classified 42 (26%) of the 159 survey blocks as having high expected moose abundance and 117 (74%) as having low expected abundance (Figure 4). Total stratification flight time was 447 minutes or 7.4 hours.
Coverage The census part of the survey started 24 November and ran to 28 November 2013. We surveyed a total of 59 blocks, or 37% of the survey area (Figure 5). This included 27 of 42 blocks (64%) in the high stratum, and 32 of 117 blocks (27%) in the low stratum. Total survey time was 2,001 minutes (33.4 hours), not including 626 minutes (10.4 hours) of ferry time to fuel caches and home base, for an average search intensity of 1.98 min/km2. Search intensity was slightly higher in the high stratum (2.13 min/km2) compared to the low stratum (1.84 min/km2). Total census flight time (survey and ferry time combined) was 2,627 minutes or 43.8 hours.
Observations and Distribution of Moose We counted 352 moose in the 59 surveyed blocks: 161 adult and yearling cows, 56 calves, 29 yearling bulls, and 106 adult bulls (Table 1). We observed an average of 576 moose per 1,000 km2 in the high-abundance blocks and 155 moose per 1,000 km2 in the low blocks.
Of the 32 low abundance blocks (where we expected to see few moose), 28% had more moose than we expected (i.e. more than 4 moose), and 13% of the low blocks had 10 or more moose (Figure 5). Errors in stratification are not unusual, but observing such high numbers of moose in lower quality habitat is unusual. One explanation for the variability in the low blocks is the relative lack of subalpine habitat in the southeast portion of the study area, where many moose congregate post-rut. Instead, much of the southeast portion was covered in uniformly-aged pine stands which were intersected with creeks and meadows containing good willow browse. The moose observed in the southeast portion were almost exclusively found in these localized areas of high quality browse, demonstrating the value of these willow-rich areas in early winter. Utilization of these localized, low elevation areas may be a strategy to reduce the need to travel to adjacent high elevation areas where abundant browse is available.
On 28 November, 10 moose were observed in a low block southwest of Summit Lake (near the Alaska Highway), including 4 cow/calf pairs
Teslin Burn Early-winter 2013 Moose Survey 9

(Figure 5). This block contains a north-facing spruce slope, with minimal habitat typically used by moose in early winter. Based on the distribution of animals in this block, and the tracks observed descending from the subalpine, it is likely that these animals were pushed to lower elevations due to weather conditions, namely deepening snow.
Cow/calf groups are often pushed down into lower elevations earlier than solitary moose, due to the difficulty for the calf to travel through moderately deep snow.
Late November coincided with multiple snow events, which resulted in increasing regional snow depths, culminating in near-record
snow accumulations in December (Yukon Snow Survey Bulletin and Water Supply Forecast 2014).
Moose Abundance and Density We estimated there were 791 (90% Confidence Interval (CI) range: 640–943) moose in the entire 2013 Teslin Burn survey area (Table 2). This estimate includes a SCF of 1.09 (9%) for moose missed during the census survey.
The estimated density of moose in the survey area was 290 per 1,000 km² in the entire area, and 311 moose per 1,000 km² in suitable moose habitat (excludes land at or above 1,524 m and water bodies 0.5 km2 or greater).
Table 1. Observations of moose during the 2013 Teslin Burn survey.
High Blocks Low Blocks Total Number of blocks counted 27 32 59 Number of adult bulls observed 92 14 106 Number of adult and yearling cows observed 120 41 161 Number of yearling bulls observed 20 9 29 Number of calves observed 35 21 56 Total moose observed 267 85 352 Table 2. Estimated abundance of moose in the Teslin Burn survey area in November, 2013.
Best Estimate1 ± 90% Confidence Interval2
90% Confidence Interval2 (Range)
Total Moose 791 ± 19% 640 – 943 Adult bulls 212 ± 22% 164 – 259 Adult cows 297 ± 25% 223 – 371 Yearlings 139 ± 29% 100 – 180 Calves 143 ± 28% 103 –183 Density of moose (per 1,000 km2) Entire area 290 Moose habitat only 311 1 Estimated numbers provided are based on a Pooled sightability correction factor (SCF) applied to data analyzed using Stratified Random Block analysis. In 2013, a SCF of 1.09 was applied to the High and Low stratum (described in Methods section in this report)
2 A “90% confidence interval” means that, based on our survey results, we are 90% sure that the true number lies within this range of numbers. Our best estimate is near the middle of this range.
Teslin Burn Early-winter 2013 Moose Survey 10

Figure 4. Results of Teslin Burn moose stratification survey, 2013.
Teslin Burn Early-winter 2013 Moose Survey 11
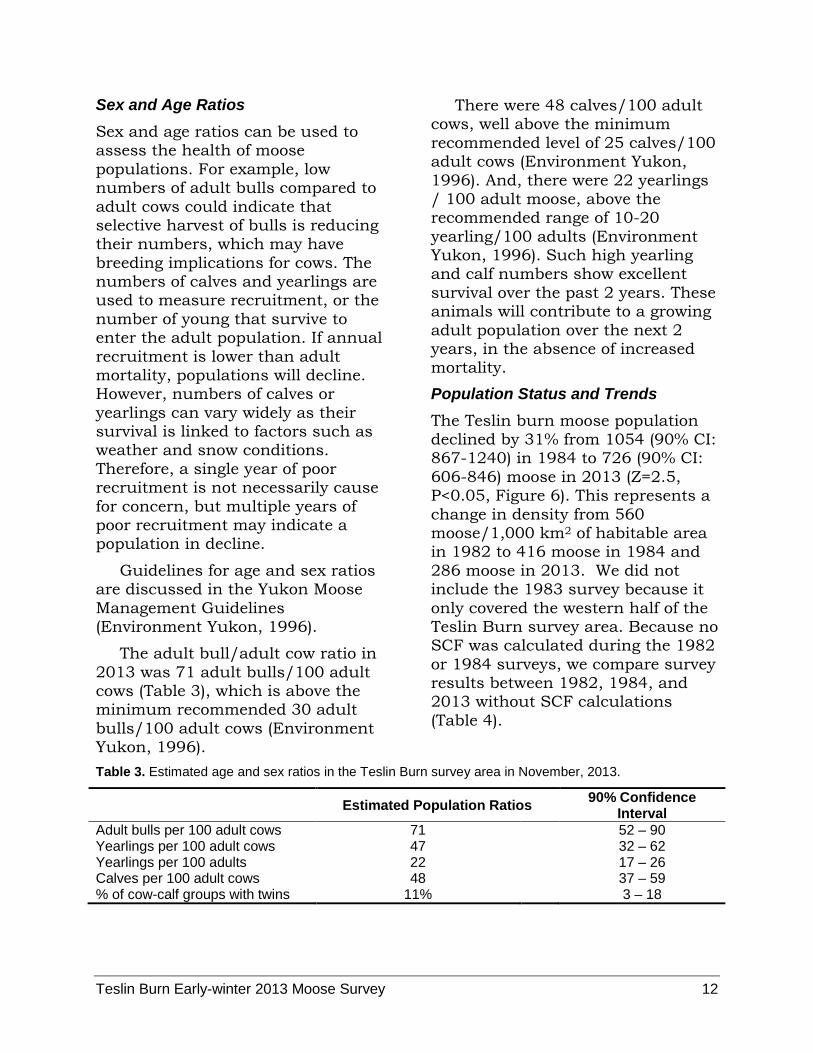
Sex and Age Ratios Sex and age ratios can be used to assess the health of moose populations. For example, low numbers of adult bulls compared to adult cows could indicate that selective harvest of bulls is reducing their numbers, which may have breeding implications for cows. The numbers of calves and yearlings are used to measure recruitment, or the number of young that survive to enter the adult population. If annual recruitment is lower than adult mortality, populations will decline. However, numbers of calves or yearlings can vary widely as their survival is linked to factors such as weather and snow conditions. Therefore, a single year of poor recruitment is not necessarily cause for concern, but multiple years of poor recruitment may indicate a population in decline.
Guidelines for age and sex ratios are discussed in the Yukon Moose Management Guidelines (Environment Yukon, 1996).
The adult bull/adult cow ratio in 2013 was 71 adult bulls/100 adult cows (Table 3), which is above the minimum recommended 30 adult bulls/100 adult cows (Environment Yukon, 1996).
There were 48 calves/100 adult cows, well above the minimum recommended level of 25 calves/100 adult cows (Environment Yukon, 1996). And, there were 22 yearlings / 100 adult moose, above the recommended range of 10-20 yearling/100 adults (Environment Yukon, 1996). Such high yearling and calf numbers show excellent survival over the past 2 years. These animals will contribute to a growing adult population over the next 2 years, in the absence of increased mortality.
Population Status and Trends The Teslin burn moose population declined by 31% from 1054 (90% CI: 867-1240) in 1984 to 726 (90% CI: 606-846) moose in 2013 (Z=2.5, P<0.05, Figure 6). This represents a change in density from 560 moose/1,000 km2 of habitable area in 1982 to 416 moose in 1984 and 286 moose in 2013. We did not include the 1983 survey because it only covered the western half of the Teslin Burn survey area. Because no SCF was calculated during the 1982 or 1984 surveys, we compare survey results between 1982, 1984, and 2013 without SCF calculations (Table 4).
Table 3. Estimated age and sex ratios in the Teslin Burn survey area in November, 2013.
Estimated Population Ratios 90% Confidence Interval
Adult bulls per 100 adult cows 71 52 – 90 Yearlings per 100 adult cows 47 32 – 62 Yearlings per 100 adults 22 17 – 26 Calves per 100 adult cows 48 37 – 59 % of cow-calf groups with twins 11% 3 – 18
Teslin Burn Early-winter 2013 Moose Survey 12
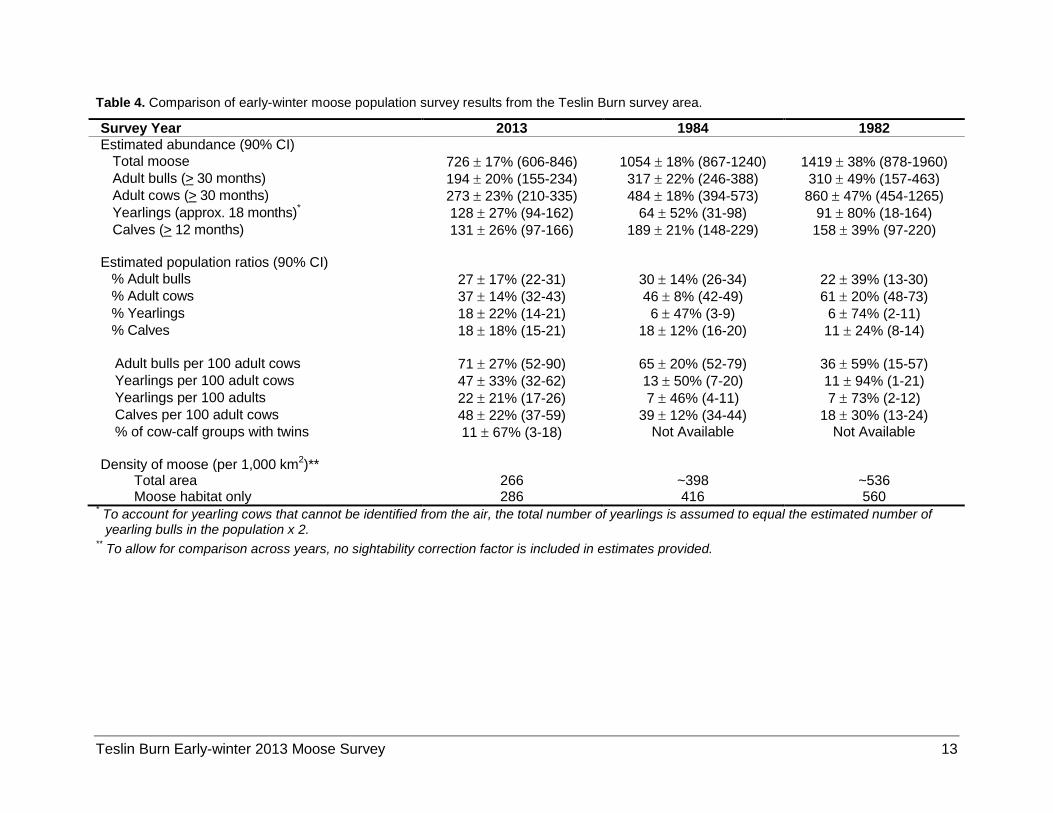
Table 4. Comparison of early-winter moose population survey results from the Teslin Burn survey area.
Survey Year 2013 1984 1982 Estimated abundance (90% CI)
Total moose 726 ± 17% (606-846) 1054 ± 18% (867-1240) 1419 ± 38% (878-1960) Adult bulls (> 30 months) 194 ± 20% (155-234) 317 ± 22% (246-388) 310 ± 49% (157-463) Adult cows (> 30 months) 273 ± 23% (210-335) 484 ± 18% (394-573) 860 ± 47% (454-1265) Yearlings (approx. 18 months)* 128 ± 27% (94-162) 64 ± 52% (31-98) 91 ± 80% (18-164) Calves (> 12 months) 131 ± 26% (97-166) 189 ± 21% (148-229) 158 ± 39% (97-220)
Estimated population ratios (90% CI)
% Adult bulls 27 ± 17% (22-31) 30 ± 14% (26-34) 22 ± 39% (13-30) % Adult cows 37 ± 14% (32-43) 46 ± 8% (42-49) 61 ± 20% (48-73) % Yearlings 18 ± 22% (14-21) 6 ± 47% (3-9) 6 ± 74% (2-11) % Calves 18 ± 18% (15-21) 18 ± 12% (16-20) 11 ± 24% (8-14) Adult bulls per 100 adult cows 71 ± 27% (52-90) 65 ± 20% (52-79) 36 ± 59% (15-57) Yearlings per 100 adult cows 47 ± 33% (32-62) 13 ± 50% (7-20) 11 ± 94% (1-21) Yearlings per 100 adults 22 ± 21% (17-26) 7 ± 46% (4-11) 7 ± 73% (2-12) Calves per 100 adult cows 48 ± 22% (37-59) 39 ± 12% (34-44) 18 ± 30% (13-24) % of cow-calf groups with twins 11 ± 67% (3-18) Not Available Not Available
Density of moose (per 1,000 km2)**
Total area 266 ~398 ~536 Moose habitat only 286 416 560
* To account for yearling cows that cannot be identified from the air, the total number of yearlings is assumed to equal the estimated number of yearling bulls in the population x 2.
** To allow for comparison across years, no sightability correction factor is included in estimates provided.
Teslin Burn Early-winter 2013 Moose Survey 13

Figure 5. Results of the 2013 Teslin Burn moose census survey.
Teslin Burn Early-winter 2013 Moose Survey 14
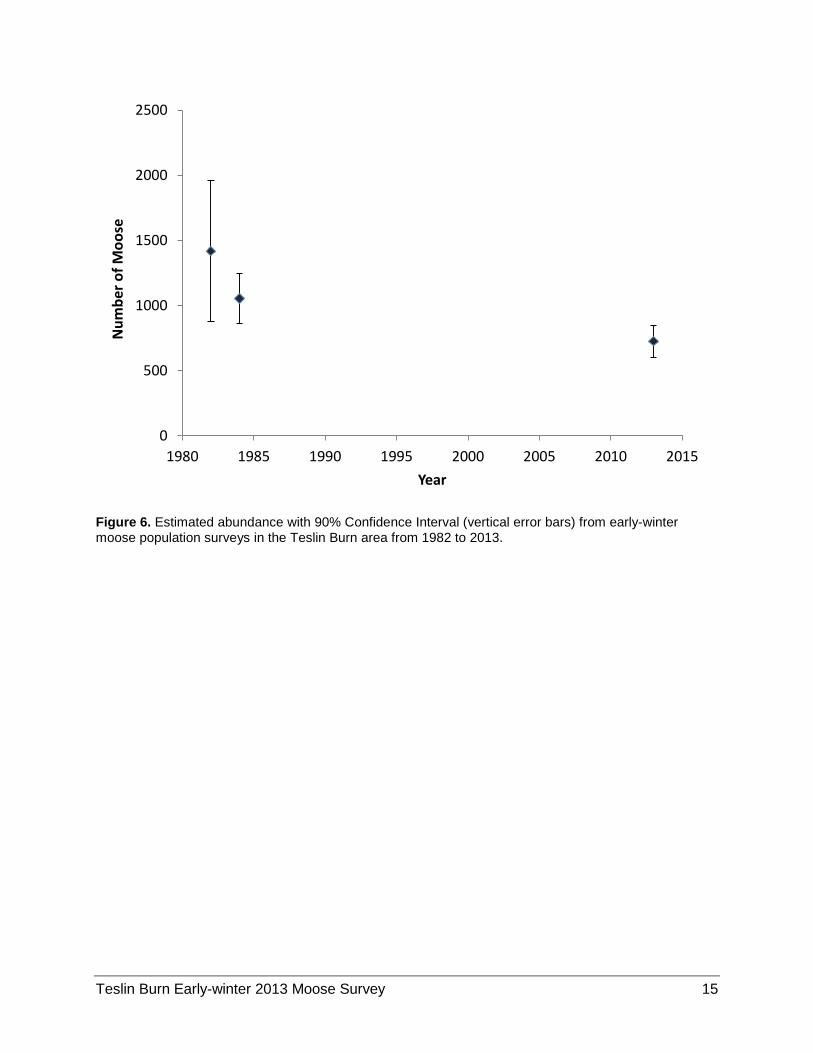
Figure 6. Estimated abundance with 90% Confidence Interval (vertical error bars) from early-winter moose population surveys in the Teslin Burn area from 1982 to 2013.
0
500
1000
1500
2000
2500
1980 1985 1990 1995 2000 2005 2010 2015
Num
ber o
f Moo
se
Year
Teslin Burn Early-winter 2013 Moose Survey 15
It should be noted that the surveys in the early to mid-1980s likely documented the start of a decline of this population, probably caused by high harvest and predation rates in conjunction with a habitat transitioning from post-fire shrubs to coniferous-dominated. Local knowledge describes poor calf recruitment in the mid-1980s, resulting in an unproductive, aging population. Although no census survey was done between 1984 and 2013, anecdotal information from community members describe a much lower moose population than was observed in 1982 or 1984. This was supported by observations during composition and recruitment surveys in the 2000s.
Since the 1984 survey, the 1958 burn that covered most of the study area has continued to mature, resulting in a forest mosaic that no longer supports the very high densities observed in the early 1980s. Abundant post-fire deciduous shrubs have been largely replaced by coniferous or mixed forest. Although the population estimate in 2013 is still lower than that observed in the early 1980s, the 2013 estimate reflects the change in habitat that has occurred since the 1958 fire, as well as a lower harvest rate in the past 20 years. In general, the current density estimate and the sex/age ratios are indicative of a stable to growing population.
Harvest The 5-year (2009 to 2013) average licensed annual harvest in the Teslin Burn survey area was 9.2
moose per year, or about 1.2% of the total 765 moose estimated for GMSs 9-08 to 9-11 (Table 5). This reported harvest (resident, non-resident, and special guided harvest), does not include moose harvested by all First Nation hunters as this information is not currently available. First Nation harvest may include cow moose, which has a greater impact on populations relative to the harvest of bulls and could result in a reduction in the sustainable harvest over time.
Without complete First Nation harvest information it is difficult to assess the sustainability of the harvest rate. For this reason, an estimate of the First Nation harvest was attempted. In this case, some harvest data was available, but not for the entire area. Historic data from the Yukon First Nation Harvest Study is available (Quock, unpublished data). These two sources of harvest information allow for the calculation of a total harvest rate range of 2.2% to 3.7% for the Teslin Burn. Annual allowable harvest of moose populations may be sustainable at 4% (Environment Yukon, 1996), but with the uncertainty of First Nations harvest in the Teslin Burn, a conservative annual allowable harvest of 3% may be an appropriate harvest rate in this scenario.
Highway collisions are another source of moose mortality. Between 2009 and 2013, 2 moose (0.4 moose per year) were killed by vehicles on the Alaska Highway or Atlin Road bordering the survey area.
Teslin Burn Early-winter 2013 Moose Survey 16

Recognizing that this number could be higher because of non-reporting, road collisions currently kill less than 0.1% of the moose population per year.
The combination of licensed harvest, estimated First Nation harvest and other known human induced mortality results in an annual human-caused mortality rate of 2.3% to 3.8%. The relatively high age/sex ratios estimated during the 2013 survey indicate this is likely a growing moose population, and that total harvest is likely within sustainable limits. Complete First Nation harvest data, however, would allow for a more comprehensive assessment of current harvest rates.
Harvest data for licensed hunters has been recorded since 1979 in the Teslin Burn survey area (Figure 7). Harvest in the late 1970s and early 1980s was unsustainable and likely contributed to a population decline after the 1984 survey. Licenced harvest has been below the 3% annual allowable harvest level since 1984, and harvest levels have been fewer than 20 moose/year since 1994. Several factors likely contributed to the reduction in harvest, including a population decline, less access to the backcountry lakes when the local air charter company ceased operation from Teslin, and a local perception that the population was doing poorly. Harvest monitoring in future years will be important as harvest pressure may shift to this area due to the results of the 2013 census.
Other Wildlife Sightings In addition to the 352 moose we counted during the survey, we observed 44 moose outside of surveyed units. We also saw 6 mountain goats, 2 mule deer, 24 caribou, 18 wolves, and 1 wolverine.
One of the goats belonged to the group commonly seen on Mount White while the other 5 were seen on the south side of Mount Bryde, where goats are less common.
Two small groups of caribou were seen on northern tree-clad slopes south of Summit Lake in Carcross herd range. A larger group was seen on Upper Snafu Lake and may have belonged to either the Carcross or Atlin herd. The wolves were divided into 2 packs and one lone wolf, all in the southern portion of the study area. No wolves or tracks were seen in the northern portion of the study area. Wolf observations in previous surveys were not consistently recorded; however, 37 wolves were seen in GMS 9-09 in 1974, when the moose population was likely growing rapidly due to prime post-burn habitat.
Teslin Burn Early-winter 2013 Moose Survey 17
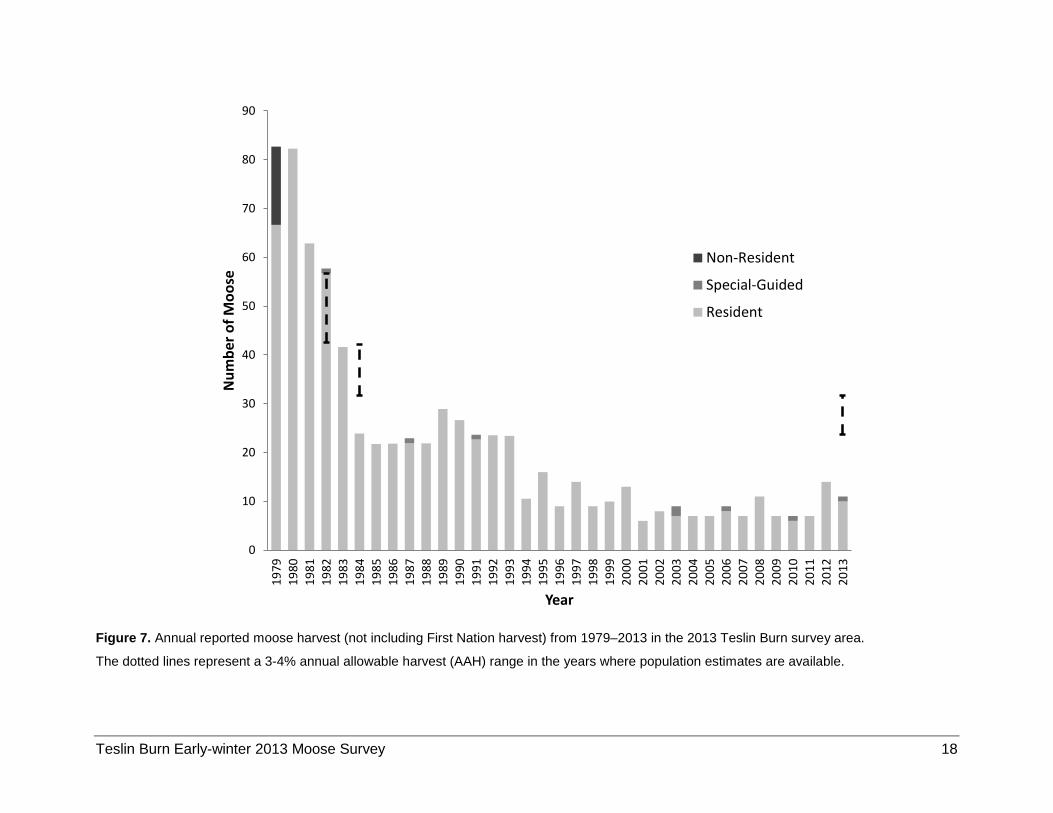
Figure 7. Annual reported moose harvest (not including First Nation harvest) from 1979–2013 in the 2013 Teslin Burn survey area.
The dotted lines represent a 3-4% annual allowable harvest (AAH) range in the years where population estimates are available.
0
10
20
30
40
50
60
70
80
90
1979
1980
1981
1982
1983
1984
1985
1986
1987
1988
1989
1990
1991
1992
1993
1994
1995
1996
1997
1998
1999
2000
2001
2002
2003
2004
2005
2006
2007
2008
2009
2010
2011
2012
2013
Num
ber o
f Moo
se
Year
Non-Resident
Special-Guided
Resident
Teslin Burn Early-winter 2013 Moose Survey 18

Table 5. Average annual (2009-2013) licensed moose harvest and allowable harvest summary for the 2013 Teslin Burn survey area.
GMS GMS Area (km2)
Estimated Density1 (moose/
1000 km2)
Total Estimated number
of Moose2
Average Resident Harvest
Average Non-
Resident Harvest
Average (Special Guided) Harvest
Average Reported Harvest (2009-2013)
Current Harvest
Rate (% of total
population)
2% Allowable
Annual Harvest
3% Allowable
Annual Harvest
4% Allowable
Annual Harvest
908 385.8 295 114 2.0 0.0 0.4 2.4 2.1 2.3 3.4 4.6 909 792.6 305 242 2.4 0.0 0.0 2.4 1.0 4.8 7.3 9.7 910 705.8 305 215 1.8 0.0 0.0 1.8 0.8 4.3 6.5 8.6 911 761.1 255 194 2.6 0.0 0.0 2.6 1.3 3.9 5.8 7.8
Total 2645.3 289 765 8.8 0.0 0.4 9.2 1.2 15.3 22.9 30.6 1 Based on 2013 Teslin Burn SCF Pooled moose survey results. 2 This number is based on the GMS area multiplied by the density of moose. It differs slightly from the population estimate for the entire survey area (791 moose) because the total survey area is slightly different from the area of the GMS used to calculate the density estimate.
Teslin Burn Early-winter 2013 Moose Survey 19
Conclusions and Recommendations
• We estimated that there were about 791 moose in the Teslin Burn survey area in 2013. The estimated density was 290 moose/1000 km2 of total area, significantly lower than the last time this area was surveyed in 1984.
• Survival of calves in this area from summer 2012 to early winter 2013 was excellent, and indicative of a productive population.
• The ratio of adult bulls to adult cows in the survey area was relatively high and similar to the ratio observed in 1984. The bull: cow ratio is currently well above the recommended minimum needed to ensure successful reproduction.
• The forest fire that burned a large portion of the Teslin Burn survey area 56 years ago has regenerated to varying degrees. Abundant browse is still available in the survey area, but it has grown in height over time and is likely considerably less available now than 20–30 years post fire.
• Total harvest in the survey area over the past 5 years has been estimated at 2.2%-3.7%, which includes licensed harvest and estimated First Nations harvest. A harvest rate above 3% of the Teslin Burn moose population has an increased risk of causing a population decline.
• Responsible management of this moose population requires harvest data from all First Nations that are harvesting in this area.
Teslin Burn Early-winter 2013 Moose Survey 20

Literature Cited ENVIRONMENT YUKON. 2004. Teslin
Burn moose survey results summary 2004. Yukon Fish and Wildlife Branch Report SR-04-01. Whitehorse, Yukon, Canada.
ENVIRONMENT YUKON. 1996. Moose management guidelines for Yukon. Yukon Fish and Wildlife Branch, Department of Environment, Whitehorse, Yukon.
FLORKIEWICZ, R. 2006a. Teslin Burn moose composition survey: fall 2005. Yukon Fish and Wildlife Branch file report. Whitehorse, Yukon, Canada.
FLORKIEWICZ, R. 2006b. Teslin Burn moose composition survey: fall 2006. Yukon Fish and Wildlife Branch file report. Whitehorse, Yukon, Canada.
GASAWAY, W. C., S. D. DUBOIS, D. J. REED, AND S. J. HARBO. 1986. Estimating moose population parameters from aerial surveys. University of Alaska, Institute of Arctic Biology, Biological Paper No. 22.
HOEFS, M. 1976. Moose survey on the eastern portion of GMZ #9. Fish and Wildlife Branch file report. Department of Renewable Resources, Government of Yukon. Whitehorse, Yukon, Canada.
HOEFS, M. 1974a. Moose survey report: Little Atlin – Nisutlin River area. Fish and Wildlife Branch file report. Department of Renewable Resources, Government of Yukon. Whitehorse, Yukon, Canada.
HOEFS, M. 1974b. Moose survey to determine this year’s calf crop. Fish and Wildlife Branch file report. Department of Renewable Resources, Government of Yukon. Whitehorse, Yukon, Canada.
KELSALL, J.P., E.S. TELFER AND T.D. WRIGHT. 1977. The effects of fire on the ecology of the boreal forest, with particular reference to the Canadian north: A review and selected bibliography. Occas. pap. 323. Can. Wildl. Serv., Ottawa. 58 pp.
LARSEN, D. 1979. Moose survey – Teslin Burn. Fish and Wildlife Branch file report 3997-5-14. Department of Renewable Resources, Government of Yukon. Whitehorse, Yukon, Canada.
LORTIE, G. 1974. Moose survey report: Little Atlin – Nisutlin districts, December 1974. Fish and Wildlife Branch file report. Department of Renewable Resources, Government of Yukon. Whitehorse, Yukon, Canada.
Teslin Burn Early-winter 2013 Moose Survey 21
LORTIE, G. 1976. Wildlife survey: G.M.Z. #8 & #9, 22-24 March, 1976. Fish and Wildlife Branch file report. Department of Renewable Resources, Government of Yukon. Whitehorse, Yukon, Canada.
KELLIE, K. A. AND R. A. DELONG. 2006. Geospatial survey operations manual. Division of Wildlife Conservation, Alaska Department of Fish and Game. Fairbanks, Alaska, USA.
MARKEL, R. L. AND D. G. LARSEN. 1987a. Summary of the 1983 moose surveys in the Kluane, Haines Junction, Whitehorse south, Teslin burn and Mt. Lorne areas. Fish and Wildlife Branch progress report PR-87-5. Department of Renewable Resources, Government of Yukon. Whitehorse, Yukon, Canada.
MARKEL, R. L. AND D. G. LARSEN. 1987b. Summary of the 1984 moose surveys in the Haines Junction and Teslin areas. Fish and Wildlife Branch progress report PR-87-4. Department of Renewable Resources, Government of Yukon. Whitehorse, Yukon, Canada.
MARKEL, R. L. AND D. G. LARSEN. 1983. Southwest Yukon moose survey results, November 1982 (Whitehorse north, Mt. Lorne, Teslin burn). Moose Population Research and Management Studies in Yukon. Progress Report 1983. Department of Renewable Resources, Government of Yukon. Whitehorse, Yukon, Canada.
MCLELLAND, J. 2008. Teslin Burn moose composition re-survey: March 20, 2008. Yukon Fish and Wildlife Branch file report. Whitehorse, Yukon, Canada.
MCLELLAND, J. 2007. Teslin Burn moose composition survey: fall 2007. Yukon Fish and Wildlife Branch file report. Whitehorse, Yukon, Canada.
QUOCK, R. 1994. Yukon First Nations Harvest Study, 1987-1994. Unpublished data. Yukon Fish and Wildlife Branch. Whitehorse, Yukon, Canada.
SCHWARTZ, C.C. AND A.W. FRANZMANN. 1989. Bears, wolves, moose, and forest succession, some management considerations on the Kenai Peninsula, Alaska. Alces 25: 1-10.
YUKON ECOREGIONS WORKING GROUP. 2004. Yukon Southern Lakes and Yukon Stikine Highlands ecoregions. In: Ecoregions of the Yukon Territory: Biophysical properties of Yukon Landscapes, C.A.S. Smith, J.C. Meikle and C.F. Roots (eds.), Agriculture and Agri-Food Canada, PARC Technical Bulletin No. 04-01, Summerland, British Columbia, pp. 207-218 and 235-240.
YUKON SNOW SURVEY BULLETIN AND WATER SUPPLY FORECAST, MARCH 1, 2014.
Teslin Burn Early-winter 2013 Moose Survey 22