suominen corporation annual report 2015
TRANSCRIPT

GrowthinvestmentsWe are executing a EUR 60 million growth investment program, which further imp-roves our ability to supply products with higher added value to our customers.
Market Driven Product LeaderOur journey towards our vision to be a Market Driven Product Leader is coming along steadily.
The start of a new eraThanks to determined work carried out across the organization in recent years, we now have a solid foundation to build our future success on. We are targeting growth through product leadership and aim to take Suominen to a whole new level.
Report2015
Annual

Suominen in brief / How we create value / Year 2015 / Business / Sustainability / Governance / Financial Statements
ContentsSuominen in brief .................................................................... 3 How we create value .............................................................. 5Value chain ................................................................................. 6Value Creation Model .............................................................. 8Strategy ........................................................................................ 10 Year 2015 .................................................................................... 11From the President & CEO ..................................................... 12Strategy execution – key events ............................................ 15Key figures ................................................................................... 16 Business ....................................................................................... 17Operating environment ........................................................... 18Convenience business area .................................................... 23Care business area .................................................................... 25Growth investment program .................................................. 27 Sustainability .............................................................................. 29Sustainability strategy ............................................................... 30Social responsibility ................................................................... 32Environmental responsibility .................................................. 35Economic responsibility .......................................................... 37 Governance ................................................................................ 38Corporate Governance Statement ....................................... 39Letter from the Chair of Personnel and Remuneration Committee .................................................... 45Remuneration Statement ........................................................ 46Board of Directors ..................................................................... 50Corporate Executive Team ..................................................... 51 Financial Statements ............................................................... 52Report by the Board of Directors ......................................... 52Financial statements ................................................................. 61
Consolidated financial statements .................................. 62Parent company financial statements ............................ 114Proposal by the Board of Directors for distribution of funds ...................................................... 124
Auditor’s report .......................................................................... 125Information for shareholders .................................................. 126
Suominen in brief / How we create value / Year 2015 / Business / Sustainability / Governance / Financial Statements
Sustainability
Year 2015
How we create value
Business
2 / 127
Suominen Corporation Annual Report 2015

Suominen in brief / How we create value / Year 2015 / Business / Sustainability / Governance / Financial Statements
Suominen in brief
Suominen manufactures nonwovens as
roll goods for wipes and for hygiene prod-
ucts and medical applications. Suominen
is the global market leader in nonwovens
for wipes. The company employs over 600
people in Europe and in the Americas. The
Suominen share (SUY1V) is listed on the Nas-
daq Helsinki Stock Exchange.
Every year, Suominen produces enough nonwovens to cover more than 11 million
tennis courts.
Wiping products made of Suominen’s non-
wovens include, for instance, wet wipes for
personal hygiene and baby care, as well as
for household and workplace wiping. The
company’s hygiene product applications
include, for example, sanitary pads, diapers
and adult incontinence products. Surgical
drapes and swabs are examples of the medi-
cal applications.
Suominen’s locations
47 Paulínia
BRAZIL
111 Nakkila15 Helsinki, Head office
FINLAND
40 Cressa98 Mozzate
ITALY
66 Alicante
SPAIN
35 Windsor Locks 105 Green Bay117 Bethune
USA
Suominen in brief / How we create value / Year 2015 / Business / Sustainability / Governance / Financial Statements
2 Lyon
France
3 / 127
Suominen Corporation Annual Report 2015
Suominen in brief / How we create value / Year 2015 / Business / Sustainability / Governance / Financial StatementsSuominen in brief / How we create value / Year 2015 / Business / Sustainability / Governance / Financial Statements
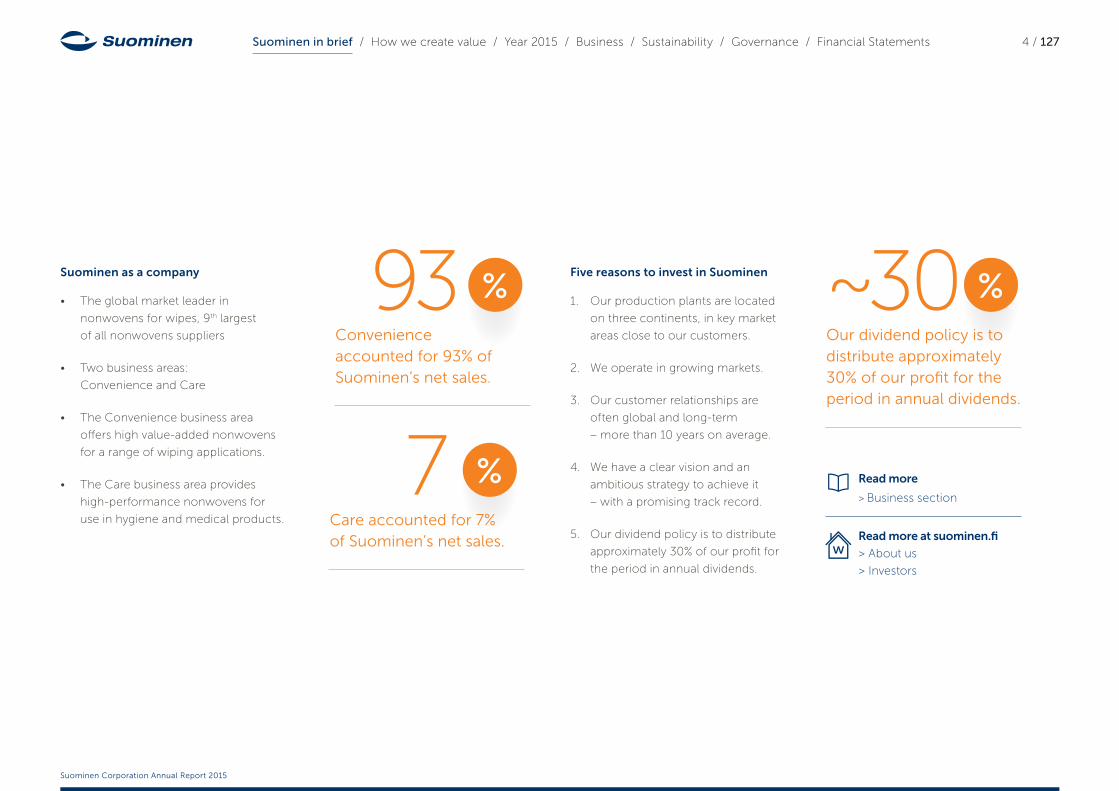
Convenience accounted for 93% of Suominen’s net sales.
93 %Suominen as a company
• The global market leader in
nonwovens for wipes, 9th largest
of all nonwovens suppliers
• Two business areas:
Convenience and Care
• The Convenience business area
offers high value-added nonwovens
for a range of wiping applications.
• The Care business area provides
high-performance nonwovens for
use in hygiene and medical products.
Five reasons to invest in Suominen
1. Our production plants are located
on three continents, in key market
areas close to our customers.
2. We operate in growing markets.
3. Our customer relationships are
often global and long-term
– more than 10 years on average.
4. We have a clear vision and an
ambitious strategy to achieve it
– with a promising track record.
5. Our dividend policy is to distribute
approximately 30% of our profit for
the period in annual dividends.
Care accounted for 7% of Suominen’s net sales.
7 %
Our dividend policy is to distribute approximately 30% of our profit for the period in annual dividends.
~30 %
Read more
> Business section
Read more at suominen.fi
> About us
> Investors
w
4 / 127
Suominen Corporation Annual Report 2015

Suominen in brief / How we create value / Year 2015 / Business / Sustainability / Governance / Financial Statements
How we create value Our purpose is to make nonwovens continuously better for people. At the same time, Suominen creates value through its operations for all its stakeholders – e.g., customers, employees and shareholders. 15.9 % Return on
invested capital (ROI) in 2015
End user
The end user of Suominen’s nonwovens
can be either a consumer or a professional.
Understanding the end user
– whether a consumer or a
professional – is at the heart
of Suominen’s strategy.
Suominen in brief / How we create value / Year 2015 / Business / Sustainability / Governance / Financial Statements 5 / 127
Suominen Corporation Annual Report 2015

Suominen in brief / How we create value / Year 2015 / Business / Sustainability / Governance / Financial Statements
Suominen’s value chain
Nonwovens manufacturer,
Suominen
Brand owner
Retailer
Consumer
Converter, e.g., wet wipe manufacturer
Fiber producerPrimary
production
The divestments executed in the last few
years have clarified Suominen’s position in
the value chain. Today, Suominen is a 100%
nonwovens manufacturer and is located
midway in the value chain, between fiber
producers and end-product manufacturers
(converters) and brand owners.
Although Suominen operates business-
to-business, understanding the end user –
whether a consumer or a professional using
a product made of nonwovens – is at the
heart of our strategy. We cannot achieve our
vision to be a Market Driven Product Leader
without being able to proactively forecast
what our customers and end users will need
in the future.
Value chain
Suominen is a 100% nonwovens manufacturer
100 %
Suominen in brief / How we create value / Year 2015 / Business / Sustainability / Governance / Financial Statements 6 / 127
Suominen Corporation Annual Report 2015

Suominen in brief / How we create value / Year 2015 / Business / Sustainability / Governance / Financial Statements
We Love Wipes aims to increase consumer awareness of
disposable nonwoven products by providing brand-free
information on the wide range of products, their different
end-use applications and various features – all in a fun and
entertaining way. And since the dialogue is two-way, We
Love Wipes provides Suominen with valuable information
about consumer needs and, in turn, enables us to de-
velop new nonwoven products with higher added value.
In 2015, Suominen boosted its utilization of consumer
data in product development and customer cooperation.
Focused, in-depth information collected through We Love
Wipes is a valuable asset for us and, therefore, we will con-
We Love Wipes, Suominen’s digital consumer dialogue
program launched back in 2013, continued in 2015.
Nowadays, the We Love Wipes community consists of
nearly 25,000 followers who are not afraid to share their
thoughts on and experiences with nonwovens products.
tinue deepening our consumer understanding in order
to find opportunities, support product development
projects and, ultimately, bring more value to our cus-
tomers.
Follow We Love Wipes
on Twitter @welovewipes and on Facebook
or see www.welovewipes.com
Case Valuable information through We Love Wipes
Suominen in brief / How we create value / Year 2015 / Business / Sustainability / Governance / Financial Statements 7 / 127
Suominen Corporation Annual Report 2015

Suominen in brief / How we create value / Year 2015 / Business / Sustainability / Governance / Financial Statements
Funding
• Cash flow from operations
(EUR 27.3 million)
• Total liabilities (EUR 166.0 million)
• Hybrid bond and equity
(EUR 125.7 million)
Natural resources
• Water (5,542,291 m3)
• Raw materials (138,215 tons)
Wood-based
Oil-based
• Energy (1,683,166 GJ)
Natural gas
Grid electricity
Steam
People
• Over 600 employees
• Employee training (EUR 122,902)
Intellectual capabilities
• Suominen brand
• The Suominen Way
• R&D
• Patents
• Professional & leadership capabilities
• ICT systems
Social relationships
• Customer relations
• R&D cooperation with stakeholders
• Consumer dialogue
• Suppliers
• Manufacturing partners
• Local communities
• Professional networks
Manufacturing platform
• Eight production plants
• Geographically and technically
broad manufacturing base
Customers
• Accelerated business
• Improved product performance
• Suominen brand value
• Customer satisfaction
Employees
• Wages and salaries (EUR 34.8 million)
• Professional development
• Striving for non-discrimination
and equal opportunities
• Safe workplace (AFR 8.29)
Partners
• Payments (EUR 322.3 million)
• Business growth
• Ethical business
Shareholders
• Funds paid (EUR 0.01 per share)
• Market value increase (53% in 2015)
Environment
• Waste and emissions load from
operations and end-products
• Compostable and dispersible
end-products
• No untreated water
Society
• More convenient lifestyle
• Improved hygiene
• Contribution to reducing the
number of infections
• Corporate income taxes paid
(EUR 8.3 million)
• Employment
Products & solutions
• Nonwovens for wipes,
hygiene products and
medical applications
• Product development
(Six new branded products in 2015)
Brands
• We Love Wipes
• Product brands
Waste & emissions
• Direct and indirect greenhouse
gas emissions (140,774 tons)
• Waste to landfill (916 tons)
• Treated water from operations
Vision:
Market Driven Product Leader
Strategy:
1. Deliver superior value in thoughtfully
selected market applications
2. Drive proactive key account manage-
ment for mutual value creation
3. Execute demand-driven supply chain
4. Evolve culture and capabilities to
build a strong product company
Our purpose is to make nonwovens
continuously better for people.
Emerging global middle class
Aging population
Population growth
Rising healthcare expenditure
Growing consciousness of health
Legislation
Resources Strategy and operating environment Outputs Impacts
Value Creation ModelInformation concerning year 2015 in brackets.
Suominen in brief / How we create value / Year 2015 / Business / Sustainability / Governance / Financial Statements 8 / 127
Suominen Corporation Annual Report 2015

Suominen in brief / How we create value / Year 2015 / Business / Sustainability / Governance / Financial Statements
How does the Model work?
Suominen’s Value Creation Model depicts
our whole value creation process: what kind
of resources we utilize in executing our strat-
egy, what are the outputs and, ultimately,
the impacts of our business activities. The
Model reflects Suominen’s intent to gradu-
ally progress towards so-called integrated
reporting scheme.
The Value Creation Model is basically our
business model in a nutshell, which means
that only the most essential matters are
listed. Still, not all listed matters bear equal
importance, nor is their respective relevance
presented in the model. That’s why the mod-
el should be considered primarily as a whole.
In the Value Creation Model, Resources
are what we utilize in our business activities.
The Strategy section describes the heart
of Suominen’s business together with some
of the external drivers, such as megatrends,
that may have an impact on our operating
environment.
Outputs are what comes out of our business
activities. Impacts describe how our business
activities and our outputs affect the world
around us.
Suominen in brief / How we create value / Year 2015 / Business / Sustainability / Governance / Financial Statements 9 / 127
Suominen Corporation Annual Report 2015

Suominen in brief / How we create value / Year 2015 / Business / Sustainability / Governance / Financial Statements
Vision – where?
Strategy – how?
Financial targets
• Deliver superior value in thoughtfully selected market applications
• Drive proactive key account management for mutual value creation
• Execute demand-driven supply chain
• Evolve culture and capabilities to build a strong product company
Market Driven Product Leader
• Organic net sales growth at a rate that
exceeds the industry average (approx. 3%)
• A return on investment of more than 12%
• A gearing ratio between 40% and 80%
Purpose – why? Our purpose is to make nonwovens continuously better for people
Vision – where?
Our vision, to be a Market
Driven Product Leader, re-
flects where Suominen is
headed and what we want
to be at the end of this strat-
egy period.
Strategy – how?
Our strategy defines how
Suominen will achieve its vi-
sion and the targets set for
this strategy period. In the
execution of the strategy,
we will focus on develop-
ing four key areas.
If we succeed in the ex-
ecution of our strategy,
Strategy 2015–2017
Read more at
suominen.fi
> About Us / Strategy
w Read more
> Business section
> From the President & CEO
Suominen’s net sales will
amount to approximately
EUR 500 million by the end
of 2017.
Purpose – why?
Suominen’s purpose is to
make nonwovens continu-
ously better for people. It is
the reason for our existence
and the foundation of eve-
rything we do at Suominen.
It tells us what we actually
work for. Therefore, it is also
a fundamental part of our
strategies – the previous,
current and next one as well.
Suominen in brief / How we create value / Year 2015 / Business / Sustainability / Governance / Financial Statements 10 / 127
Suominen Corporation Annual Report 2015

Suominen in brief / How we create value / Year 2015 / Business / Sustainability / Governance / Financial StatementsSuominen in brief / How we create value / Year 2015 / Business / Sustainability / Governance / Financial Statements
60 Estimated value of Suominen’s growth investment program
Year 2015 After a successful turnaround, Suominen is moving forward and aiming for growth. The positive trend in Suominen’s financial development continued in 2015 and, as our investments in production technology and improvements in product development capability and capacity demonstrate, the implementation of our strategy is progressing as scheduled.
EUR
million
Darryl Fournier Plant Manager, Bethune, SC,
USA
The Bethune investment
is the most significant project
in Suominen’s growth
investment program.
11 / 127
Suominen Corporation Annual Report 2015

Suominen in brief / How we create value / Year 2015 / Business / Sustainability / Governance / Financial Statements
Nina Kopola
President & CEO
Year 2015 marked the start of a new era at
Suominen. Thanks to determined work car-
ried out across the organization in recent
years, we have turned the business around
and now have a solid foundation to build
our future success on. As stated in our strat-
egy for 2015–2017, we are targeting growth
through product leadership and, indeed, aim
to take Suominen to a whole new level.
Favorable development
on three continents
In light of the consumer confidence indices,
the operating environment remained quite
From the President & CEO
Becoming a Market Driven Product Leader
Suominen in brief / How we create value / Year 2015 / Business / Sustainability / Governance / Financial Statements 12 / 127
Suominen Corporation Annual Report 2015

Suominen in brief / How we create value / Year 2015 / Business / Sustainability / Governance / Financial Statements
healthy in our main market areas of Europe
and North America. In South America, in Bra-
zil in particular, the brisk economic growth
seen in recent years took a downward turn.
This has not damaged our business in the
area, however, since demand for nonwo-
ven products is not very cyclical. As of the
acquisition of the Paulínia plant in Brazil in
early 2014, we have progressed in the South
American markets as planned.
Profitability improved, dividend
proposal EUR 0.02 per share
Suominen’s financial development in 2015
corresponded with our positive outlook
statement issued on October 2015, even
though the last quarter of the year fell short
of expectations. In 2015, our net sales grew
by 10.5% to EUR 444.0 million, supported
by the strengthening of the US dollar. Our
operating profit margin increased to 7.0%.
Our cash flow from operations remained
strong, as we expected, at EUR 27.3 million.
Suominen’s net profit for 2015 amounted to
EUR 17.0 million, corresponding to earnings
per share of EUR 0.06.
The Board of Directors of Suominen proposes to the Annual
General Meeting a dividend of EUR 0.02 per share to be paid for
the financial year 2015.
The proposal is in line with the dividend
policy issued by the Board of Directors in
the fall of 2014.
As the financial figures demonstrate,
Suominen’s turnaround has been successful.
It has also been recognized by the investor
community: At the end of 2015, Suominen’s
market capitalization amounted to EUR 312
million and Nasdaq Helsinki transferred
Suominen from the Small Cap segment to
Mid Cap as of 4 January 2016.
Strategy execution:
solid progress on all fronts
I am very delighted with Suominen team’s
ability to take significant steps to imple-
ment the growth strategy during 2015. Our
strategy includes four focus areas – supe-
rior product offering, proactive key account
management, demand-driven supply chain,
and strong corporate culture and capabilities
– and we have executed important activities
within each of them.
If I were to select a few highlights from
the past year, I would naturally bring forth the
determined progress in our EUR 60 million
growth investment program and the persis-
tent work done to enhance the product de-
velopment process.
Largest organic investment in Suominen’s
history to be implemented in Bethune
Our growth investment program was, in fact,
launched already in late 2014 with the an-
nouncement of three initiatives at our plants
in Paulínia, Brazil; Alicante, Spain, and Nak-
kila, Finland, with a total value of some EUR
4 million. At Paulínia and Alicante, we made
improvements to existing lines, allowing us
to broaden our product offering to non-
wovens with higher added value, such as
nonwovens for medical applications. At the
Nakkila plant, we restarted a production line
that was closed down in 2012, thus enabling
us to meet the improved demand in the Eu-
ropean market.
And the good news continued into Janu-
ary 2015, when we disclosed the single larg-
est initiative in the entire growth investment
program: a plan to build a new production
line in North America.
The decision was made to install the new production line,
with a total value of close to EUR 50 million, at our Bethune plant in South Carolina, USA.
With this investment, Suominen will take
wetlaid technology to a whole new level in
the nonwovens industry. The new manu-
facturing line will be tailor-made, based on
our unique technological expertise, enabling
us to supply our customers with exclusive,
best-in-class nonwoven products. This is
perfectly in line with our strategic intent to
achieve product leadership.
In September 2015, we decided to raise
the total value of the growth investment pro-
gram to EUR 60 million from the original
range of EUR 30–50 million, thanks to the
Suominen in brief / How we create value / Year 2015 / Business / Sustainability / Governance / Financial Statements 13 / 127
Suominen Corporation Annual Report 2015

Suominen in brief / How we create value / Year 2015 / Business / Sustainability / Governance / Financial Statements
promising growth prospects identified in
nonwovens with higher added value.
Suominen Innovation
Machine up and running
During 2015, we made numerous efforts to
improve our product development process.
We enhanced our product development ca-
pabilities by building the Suominen Innova-
tion Machine – a full product development
process with a strong focus on front-end in-
novations and a formal Stage-and-Gate pro-
cedure to ensure that ideas are transformed
into commercial products as efficiently as
possible. On the other hand, the fairly strict
Stage-and-Gate procedure allows us also
to “fail fast” in product development – that
is, to terminate development projects early
enough if set criteria are not met. Having a
firm process for terminating projects with
an uncertain outlook enables us to allocate
resources to those initiatives that have more
promising opportunities for success.
In addition to enhancing our capabilities,
we improved our product development ca-
pacity by making several important recruit-
ments to the Product Development team.
We estimate that our strong focus on R&D will be
reflected also in R&D spending, which is forecasted to increase
above 1% of our net sales (0.8% in 2015).
The efforts made in Suominen’s product
development started to bear fruit already in
2015. Suominen launched a total of six new
branded products in the market: five in our
emerging Care business area and one in
Convenience. The launches reflect our de-
termination to grow the business and make
our product leadership vision a reality.
Suominen implements blind hiring
process as a forerunner in the industry
As stated in our sustainability strategy, we are
focusing our sustainability activities on three
areas: product leadership, sustainable opera-
tions and responsible value chain. We have
initiated activities under all three themes, and
this work continues in 2016.
In 2015, Suominen launched an impor-
tant initiative to promote diversity and equal
opportunities in the company.
We have clearly expressed in our Code
of Conduct that at Suominen, we will not
discriminate against anyone for any reason
and have committed to act as a fair employer
in all circumstances.
As a concrete measure, we wanted to find
ways to ensure that – often unconscious –
biases do not affect the hiring process at
Suominen.
We decided to pilot so-called blind hiring in fall of 2015.
In blind hiring, the applicant’s name and
other personal data are hidden, and the re-
cruiter can focus on the relevant factors,
such as the candidate’s experience and ex-
pertise; not, for example, on their gender
or ethnic origin. The pilot recruitment was
successful and we aim to have blind hiring
as the default approach in recruiting across
Suominen in 2016. I see this as a prime ex-
ample of our pragmatic, results-oriented ap-
proach to sustainability.
To those behind our success
The end of 2015 also wraps up the first leg
of our three-year strategy period. Suominen
made great progress and we continue to
climb towards our vision of being a Market
Driven Product Leader. Making this ambi-
tious vision come true will definitely chal-
lenge us at Suominen in many ways in the
years to come, but I am confident that with
our determined and talented team of ex-
perts, it is well within our reach.
I send my sincere thanks to the entire
Suominen team for your great commit-
ment and can-do attitude. I would also like
to warmly thank our customers, business
partners and shareholders for their sustained
confidence in us and our endeavors.
We at Suominen are continuing towards
our vision and we warmly welcome you to
join us on this journey.
Nina Kopola
President & CEO
Suominen in brief / How we create value / Year 2015 / Business / Sustainability / Governance / Financial Statements 14 / 127
Suominen Corporation Annual Report 2015
Suominen in brief / How we create value / Year 2015 / Business / Sustainability / Governance / Financial Statements
Year of steadfast strategy execution
16 January Suominen
launc hed FIBRELLA® Lite
on the global hygiene mar-
ket. It combines traditional-
ly incompatible nonwoven
features – such as softness,
strength and light weight –
in one material.
28 January As the
forerunner in the nonwo-
vens industry, Suominen
introduced HYDRASPUN®
Dispersible Plus, the next-
generation nonwoven for
the growing market of
flushable applications.
30 January As a key step
in its growth investment
program, Suominen started
a planning process for an
investment in a new wetlaid
production line. The invest-
Year of steadfast strategy execution
All Suominen’s releases published in 2015
can be found at www.suominen.fi.w
ment will be the single larg-
est initiative in Suominen’s
growth investment program.
3 March Suominen intro-
duced FIBRELLA® Perf to
the emerging South Ameri-
can market of medical
nonwovens. The product is
suitable for both traditional
and advanced wound care
as well as for surgical ap-
plications.
19 March The Annual
General Meeting of
Suominen decided, among
other things, to distribute
a total of EUR 2.5 million
in funds to Suominen’s
shareholders. This was
the first time Suominen’s
shareholders were paid
funds since 2010.
27 May Suominen con-
firmed the plan to invest in
a new production line at
its Bethune plant in South
Carolina, USA. In the first
phase, the new line will
focus on nonwovens for
household, workplace and
flushable wipes.
1 September Suominen
decided to extend its
growth investment pro-
gram to EUR 60 million.
Originally, the total value of
the program was estimated
to be in the range of EUR
30–50 million. The value of
the investment in the USA
was specified to be close
to EUR 50 million.
6 October Ernesto Levy
was appointed Senior
Vice President, Conveni-
ence business area and a
member of Suominen’s
Corporate Executive Team.
Thanks to his background
in leading consumer brand
companies, Mr. Levy brings
complementary com-
petencies to Suominen’s
leadership team.
26 October Suominen
specified its guidance
regarding the growth of
operating profit. Suominen
stated that its operating
profit from continuing
operations excluding non-
recurring items for 2015
would improve markedly
from the level of 2014.
27 October Suominen
launched the FIBRELLA®
Move nonwoven, a state-
ment product raising the
bar of expectations for
materials used in feminine
care and other absorbent
hygiene applications.
16 November Suominen
launched FIBRELLA® Zorb
and FIBRELLA® Zorb+
nonwoven products for
use in critical surgical care
applications in operating
rooms and hospitals, bring-
ing high value-added ben-
efits to both Suominen’s
customers and patients.
In 2015, Suominen focused on execut-ing its EUR 60 mil-lion growth invest-ment program and introducing new nonwoven products with higher added value in its portfolio.
Suominen in brief / How we create value / Year 2015 / Business / Sustainability / Governance / Financial Statements 15 / 127
Suominen Corporation Annual Report 2015

Suominen in brief / How we create value / Year 2015 / Business / Sustainability / Governance / Financial Statements
Key figures2015 2014 2013
Net sales, EUR million 444.0 401.8 373.7
Operating profit excl. non-recurring items, EUR million 31.2 26.9 19.4
Profit for the period, EUR million 17.0 10.2 5.7
Earnings per share, EUR 0.06 0.04 0.02
Cash flow from operations, EUR million 27.3 37.1 21.3
Cash flow per share, EUR 0.11 0.15 0.09
2015 2014 2013
Gross capital expenditure, EUR million 23.7 7.1 4.4
Equity ratio, % 43.2 41.2 32.9
Equity per share, EUR 0.50 0.44 0.32
Gearing, % 25.9 34.7 96.2
Return on invested capital (ROI), % 15.9 15.7 12.4
Average personnel 614 591 550
Financial targets
Growth
Suominen aims to increase its
net sales organically at a rate that
exceeds the average growth rate of
the industry (approximately 3%).
Profitability
Suominen aims to improve its
relative profitability. The target level of
the company’s return on investment
(ROI) is to be above 12%.
Capital structure
Suominen aims to have a solid capital
structure with a gearing ratio principally
between 40% and 80%.
Orange lines indicate the target level.
Figures refer to continuing operations unless otherwise stated.
Suominen in brief / How we create value / Year 2015 / Business / Sustainability / Governance / Financial Statements
10%
8%
6%
4%
2%
0%
Net sales, EUR million
500 –
400 –
300 –
200 –
100 –
0 –13 14 15
Organic growth %
373.7401.8
444.0
Operating profit excl.non-recurring items,EUR million
35 –
30 –
25 –
20 –
15 –
10 –
5 –
0 –13 14 15
19.4
26.9
31.2
Equity ratio, %
50 –
40 –
30 –
20 –
10 –
0 –13 14 15
32.9
41.2 43.2
Equity per share, EUR
0.60 –
0.50 –
0.40 –
0.30 –
0.20 –
0.10 –
0.00 –13 14 15
0.32
0.440.50
Return on investedcapital (ROI), %
20 –
15 –
10 –
5 –
0 –13 14 15
12.4
15.7 15.9
Average personnel
700 –
600 –
500 –
400 –
300 –
200 –
100 –
0 –13 14 15
550591 614
Gearing, %
120 –
100 –
80 –
60 –
40 –
20 –
0 –13 14 15
96.2
34.725.9
Profit for the periodand earnings per share,EUR million EUR
20 –
15 –
10 –
5 –
0 –
0,06
0,04
0,02
013 14 15
Earnings per share, EUR
5.7
10.2
17.0
Gross capital expenditure, EUR million
25 –
20 –
15 –
10 –
5 –
0 –13 14 15
4.47.1
23.7
Cash flow from operationsand cash flow per share,EUR million
40 –35 –30 –25 –20 –15 –10 –5 –0 –
13 14 15
0.16 0.140.120.100.080.060.040.020
Cash flow per share, EUR
21.3
37.1
27.3
16 / 127
Suominen Corporation Annual Report 2015

Suominen in brief / How we create value / Year 2015 / Business / Sustainability / Governance / Financial Statements
444.0 EURmillion
Net sales in 2015
Marjo Kuisma Product Manager,
HygieneIn nonwovens for wipes,
we are the global market
leader, while in the medi-
cal and hygiene markets,
Suominen is a challenger.
Business Suominen has two business areas: Convenience and Care. Although the scope of their operations might be different today, they nevertheless share many megatrends, raw materials, technologies and employee capabilities. Moreover, the product features may often be similar – after all, nearly all our products eventually touch human skin.
Suominen in brief / How we create value / Year 2015 / Business / Sustainability / Governance / Financial Statements 17 / 127
Suominen Corporation Annual Report 2015

Suominen in brief / How we create value / Year 2015 / Business / Sustainability / Governance / Financial Statements
The global nonwovens market totals
approximately 26 billion euros. It is a huge
market but, on the other hand, a very frag-
mented one, since nonwovens are used in
a vast number of applications.
Suominen has chosen three market
segments where it operates:
1. Wiping 2. Medical 3. Hygiene
Suominen is the ninth-largest of all non-
wovens suppliers. In nonwovens for wipes,
we are the global market leader, while in the
medical and hygiene markets, Suominen is
a challenger.
These three market segments are not
very cyclical in nature, which separates them
from, for example, the automotive and build-
ing segments of the nonwovens market.
Of the large hygiene market, it is worth
noting that approximately one fifth of it is
within our reach. Suominen concentrates
only on producing carefully selected non-
woven components with higher added value
for hygiene products.
Demand for nonwovens for wiping, medi-
cal and hygiene applications is driven by the
same megatrends, which are discussed in
more detail below. The same raw materials,
Operating environment
technologies and employee capabilities are
utilized in all three market segments, and the
features required of the products in these
segments are often quite similar. Nearly all
Suominen’s products eventually touch hu-
man skin.
Suominen’s main market areas are Europe
and North America. We also have a foothold
in the growing South American markets. In
these areas, demand for nonwovens used in
wipes and in hygiene and medical products
is increasing at an annual rate of some 3% in
Suominen’s selected segments. Exceeding
this average growth rate organically is one
of the financial targets of our strategy for
2015–2017.
Other27%
Upholstery 10%
Building/roofing
7%
Filtration 9%
Floorcoverings
6%Automotive
5%
Key competitors• Kimberly-Clark• Berry Plastics (ex-PGI)• Fiberweb• First Quality Nonwovens• Pegas Nonwovens
Hygiene 25%
Key competitors• Kimberly-Clark• Ahlstrom• Freudenberg• DuPont• First Quality Nonwovens
Medical 3%
Wiping 8%
Suominen in brief / How we create value / Year 2015 / Business / Sustainability / Governance / Financial Statements
Global nonwovens
market totals approx.
EUR 26 billion
Others ~50%Half of the market fragmented to smaller players
• Kimberly-Clark• Jacom Holm / Sontara• Sandler• Berry Plastics (ex-PGI)
Key competitors ~30%
Wiping
market totals approx.
EUR 2.1 billion
Suominen~20%
18 / 127
Suominen Corporation Annual Report 2015

Suominen in brief / How we create value / Year 2015 / Business / Sustainability / Governance / Financial Statements
In Asia and Africa, annual growth in the
nonwovens markets averages 7 to 8%. One
might ask, why is Suominen not operating
on those market areas as well? The answer
is: Because extending our geographical
reach to new areas is not in our focus during
this strategy period. We know that successful
business in those areas requires both a local
footprint and focus. Our focus is currently on
our existing geographical markets and on
organic growth, i.e. growth achieved without
acquisitions.
Growth in demand for nonwovens depends mostly
on consumer demand.
Consumer demand is a combination of
the general economic situation and consum-
ers’ confidence in the development of their
personal finances. However, demand for fast-
moving consumer goods – that is, end-prod-
ucts for which most of Suominen’s products
are used – is not very cyclical in nature.
Annual forecasted growth rates of demand for nonwovens used in wipes and in hygiene and medical products
Suominen’s market areas
+2 % +2–6 %
+8 %
+7 %
+7 %
Suominen in brief / How we create value / Year 2015 / Business / Sustainability / Governance / Financial Statements 19 / 127
Suominen Corporation Annual Report 2015

Suominen in brief / How we create value / Year 2015 / Business / Sustainability / Governance / Financial Statements
Suominen has operated on the Brazilian market since
the acquisition of the Paulínia plant in Brazil in early
2014. The development of our business there has been
favorable all along.
Brazil – and South America in general – is still an emerging
market for nonwovens. While baby care is the principal
end-use category for wiping nonwovens today, other
wiping applications as well as medical nonwovens are
expected to gain market share in the near future.
In general, even though the Brazilian economy was
on a downward trajectory through 2015, we did not
see this in our local business. This makes Brazil a good
example illustrating that the general economic situation
doesn’t always tell the whole story about the demand
for nonwovens. Once consumers adopt a nonwoven
convenience product, a baby wipe for example, they will
not easily abandon it. All in all, having a modern produc-
tion plant in Brazil serving the entire South American
continent is an essential asset for Suominen.
Case Favorable development in Brazil
Suominen in brief / How we create value / Year 2015 / Business / Sustainability / Governance / Financial Statements 20 / 127
Suominen Corporation Annual Report 2015

Suominen in brief / How we create value / Year 2015 / Business / Sustainability / Governance / Financial Statements
Megatrends change the world
– and the business
Megatrends are global changes that pro-
foundly transform societies over a long
period of time. Many of them are bol-
stering our business and consequently
boosting our growth forecasts, thanks to
their impact on consumer behavior.
They include:
• Population growth
• Growing global middle class
• Aging population
• Rising healthcare expenditure
• Increasing consciousness of health and well-being
There is a direct correlation between the
rise in the standard of living and, for example,
demand for hygiene products. According to
various industry sources, an increase in gross
domestic product (GDP) to only approxi-
mately USD 1,000 per capita could spark
demand for disposable sanitary napkins.
When the GDP rises to roughly USD 4,000
per capita, demand extends to disposable
diapers and, with further increases, to other
daily hygiene and convenience products.
Demand for nonwovens increases as the standard of living climbs higher
GDP per capita
USD
Feminine care products
1,000 +
Disposable diapers
4,000 +
Babywipes
7,000 +
Household wipes
14,000 +
Incontinence products
10,000 +
Suominen in brief / How we create value / Year 2015 / Business / Sustainability / Governance / Financial Statements 21 / 127
Suominen Corporation Annual Report 2015
Suominen in brief / How we create value / Year 2015 / Business / Sustainability / Governance / Financial Statements
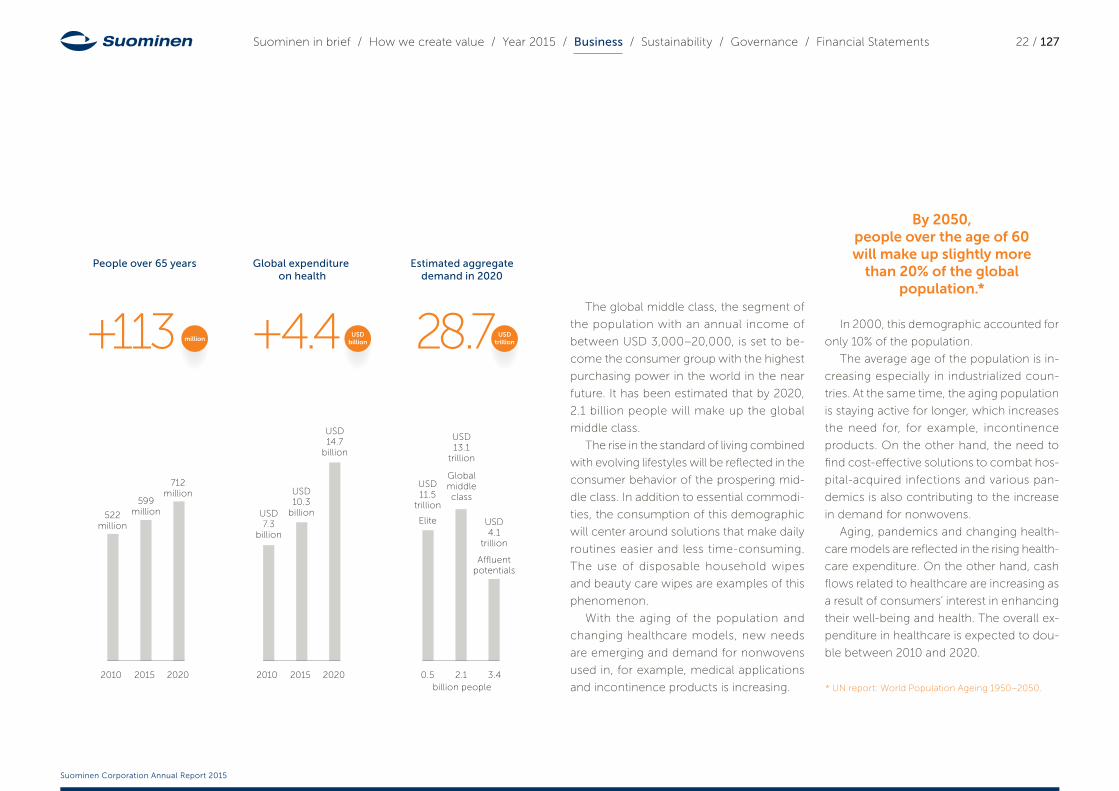
The global middle class, the segment of
the population with an annual income of
between USD 3,000–20,000, is set to be-
come the consumer group with the highest
purchasing power in the world in the near
future. It has been estimated that by 2020,
2.1 billion people will make up the global
middle class.
The rise in the standard of living combined
with evolving lifestyles will be reflected in the
consumer behavior of the prospering mid-
dle class. In addition to essential commodi-
ties, the consumption of this demographic
will center around solutions that make daily
routines easier and less time-consuming.
The use of disposable household wipes
and beauty care wipes are examples of this
phenomenon.
With the aging of the population and
changing healthcare models, new needs
are emerging and demand for nonwovens
used in, for example, medical applications
and incontinence products is increasing.
By 2050, people over the age of 60 will make up slightly more
than 20% of the global population.*
In 2000, this demographic accounted for
only 10% of the population.
The average age of the population is in-
creasing especially in industrialized coun-
tries. At the same time, the aging population
is staying active for longer, which increases
the need for, for example, incontinence
products. On the other hand, the need to
find cost-effective solutions to combat hos-
pital-acquired infections and various pan-
demics is also contributing to the increase
in demand for nonwovens.
Aging, pandemics and changing health-
care models are reflected in the rising health-
care expenditure. On the other hand, cash
flows related to healthcare are increasing as
a result of consumers’ interest in enhancing
their well-being and health. The overall ex-
penditure in healthcare is expected to dou-
ble between 2010 and 2020.
* UN report: World Population Ageing 1950–2050.
2015 20202010
USD7.3
billion
USD 10.3
billion
USD 14.7
billion
Globalmiddleclass
Affluentpotentials
Elite
2.1 3.40.5
USD11.5
trillion
USD4.1
trillion
USD13.1
trillion
billion people
Global expenditure on health
Estimated aggregate demand in 2020
People over 65 years
2015 20202010
522million
599million
712 million
+4.4 USDbillion+113 million 28.7 USD
trillion
Suominen in brief / How we create value / Year 2015 / Business / Sustainability / Governance / Financial Statements 22 / 127
Suominen Corporation Annual Report 2015

Suominen in brief / How we create value / Year 2015 / Business / Sustainability / Governance / Financial Statements
Suominen is the global market leader in non-
wovens for wipes. The applications for our
nonwovens for wipes are:
• Baby care (40% of Suominen’s total
net sales in 2015)
• Personal care, including flushable
products (22%)
• Household care (17%)
• Workplace applications, e.g., in
healthcare and food service (11%).
The customers of Convenience include
global consumer brands, manufacturers of
private labels and regional nonwoven convert-
ers. Our customer relationships are typically
very long, on average more than ten years.
Convenience in 2015
The net sales of the Convenience busi-
ness area totaled EUR 411.5 million in 2015
(EUR 369.4 million in 2014). The 11% net sales
growth was mostly due to the strengthening
of the US dollar compared to the euro.
2015 was a year of growth investments for
Suominen as we had initiatives underway at
several production plants. The investment
will benefit both business areas.
• We added capacity in Nakkila by
restarting a production line that
was shut down in 2012.
• We invested in new capabilities
in our production lines in Alicante
and Paulínia in order to expand our
product offering.
• The major investment in a new
wetlaid production line in Bethune
was kicked off in fall of 2015.
These investments demonstrate our
commitment to continued consumer-driv-
en innovation in order to become a Market
Driven Product Leader. For more information
on the investments, please take a look at the
Growth investment program section.
We also stepped up our pace in driving
proactive key account management, just like
Suominen’s strategy suggests. For example,
we organized the first ever Suominen Sym-
posium for our European customers. This
product-oriented event focused on innova-
tion and leadership in nonwovens and was
only the first in our series of similar initiatives
worldwide.
In 2015, we launched HYDRASPUN® Dis-
persible Plus in the global wipes market, taking
flushable nonwovens to a whole new level.
This is a good example of Suominen’s market-
driven innovation, which, for its part, is crucial
as we leverage the growing markets. As the
best flushable nonwoven product available to-
day, HYDRASPUN® Dispersible Plus responds
to worldwide regulatory changes calling for
products that will not clog waste-water sys-
tems. It is yet another product in our portfolio
of flushable substrates that we have been de-
veloping as pioneers in the industry.
In fact, it was our people who invented flushable
nonwovens and introduced them to the wiping world
already in the 1990s.
Convenience outlook
The main market areas for Convenience
are North America and Europe, and we
also have a foothold in the promising South
American market, thanks to the acquisition
of the Paulínia plant in Brazil in early 2014.
The outlook for the Convenience busi-
ness area is auspicious, as demand for non-
wovens used in wiping products is projected
to increase in all market areas.
Convenience business areaThe Convenience business area offers high value-added nonwovens for a range
of wiping applications and for travel and catering products. In 2015, the business
area accounted for 93% of Suominen’s total net sales.
Net sales in 2015,Convenience411.5 EUR
million
Suominen in brief / How we create value / Year 2015 / Business / Sustainability / Governance / Financial Statements 23 / 127
Suominen Corporation Annual Report 2015

Suominen in brief / How we create value / Year 2015 / Business / Sustainability / Governance / Financial Statements
The forecasted growth varies, however,
across applications. For instance, the growth
rate in nonwovens for baby wipes is around
2% in our main market areas, reflecting the
relative maturity of these markets. On the
other hand, the forecasted growth rates in
nonwovens for flushable wipes, for example,
are as high as 9% in the same geographical
areas.
Growth rates may vary widely also across
market areas. This is visibly illustrated in non-
wovens for household wipes, as the growth
rate for the application is projected to be 2% in
Europe, but 7% in North America. The variation
in estimated growth rates indicates, among
other things, that the market for disposable
household wipes is still emerging in Europe.
The conditions for growth are favorable,
as the appreciation of a healthy lifestyle,
well-being and a high level of personal hy-
giene, as well as efforts to achieve everyday
comfort and convenience are global meg-
atrends that are gaining momentum.
For the Convenience business area, the name of the
game is higher added value for customers.
In line with Suominen’s strategy, Conveni-
ence will continue to seek growth especially
in applications where our product leadership
is established and where we have the oppor-
tunity to create higher added value. We trust
in our capabilities of profound consumer un-
derstanding, value-adding key account man-
agement and innovation, which, combined
with our global manufacturing footprint and
supply chain, will help us bring even better
products and knowledge to the market. In
the near future, our focus will be on boost-
ing our product development as well as en-
hancing and harmonizing our services and
internal processes.
North America Europe South America
Baby wiping 2% 2% 5%
Personal care wiping 6% 6% *
Household wiping 7% 2% *
Workplace wiping 5% 3% *
Flushable wiping 7% 9% *
Travel & catering products 5% 5% *
* Commercially small amounts supplied
Suominen in brief / How we create value / Year 2015 / Business / Sustainability / Governance / Financial Statements
The growth rates for the applications of Suominen’s products in the main market areas
24 / 127
Suominen Corporation Annual Report 2015

Suominen in brief / How we create value / Year 2015 / Business / Sustainability / Governance / Financial Statements
The main end-use applications for
Suominen’s nonwovens for hygiene prod-
ucts are:
• Baby diapers
• Feminine hygiene products
• Adult incontinence products
The main end-use applications for medical
products include:
• Wound care applications
• Orthopedic care applications
• Surgical drape components
• Drug delivery components
In hygiene and medical pro-ducts, nonwovens most often act as components of end products.
For example, feminine care products can
consist of several layers of different materi-
als, with nonwovens being just one of them.
Customers of the Care business area in-
clude global consumer brands, manufactur-
ers of medical and hygiene products and
regional nonwoven converters.
Care in 2015
The net sales of the Care business area to-
taled EUR 32.4 million in 2015 (EUR 32.3 mil-
lion in 2014). In 2015, Care’s sales suffered due
to a large customer having non-Suominen-
related operational issues. This is the main
reason behind the flat sales growth in 2015.
However, there was more good news
than bad news in 2015: Care significantly
expanded its global customer base during
2015, launched five new branded products
and leveraged our global platform through
investments at our plants in Alicante, Spain
and Paulínia, Brazil. What is more, market
growth in hygiene and medical markets re-
mained positive. We are confident that these
aspects will give us positive momentum in
years to come.
Care outlook
The main market areas for Care are North
America and Europe. The investment made
at Suominen’s plant in Brazil in 2015 also
enables the business area to supply medi-
cal and hygiene products in South America.
Solid growth in demand is forecasted to continue at Care’s
target markets.
In North America, demand for nonwovens
for medical products is projected to grow
roughly 5%, while in Europe the estimated
annual growth rate is around 3%. These
growth forecasts are supported by the current
global health and well-being megatrends: an
increase in the number of pandemics and
hospital-acquired infections, as well as the
challenges and changing operating models
faced by the healthcare sector.
The growth prospects for hygiene appli-
cations are driven by demographic factors
such as population growth, the increase in
income in developing countries and the ag-
ing of the population in developed coun-
tries. In nonwovens for hygiene products,
annual market growth in North America and
Europe is close to 4%.
The goal for the Care business area is
to achieve substantial growth. This will be
sought by concentrating on two areas: firstly,
on expanding our product portfolio and,
secondly, on nurturing our customers, be-
cause developing business relationships can
take time in medical and hygiene markets.
Care business areaThe Care business area provides high-performance nonwovens for use
in hygiene and medical products. In 2015, the business area accounted
for 7% of Suominen’s net sales.
Net sales in 2015, Care32.4 EUR
million
Suominen in brief / How we create value / Year 2015 / Business / Sustainability / Governance / Financial Statements 25 / 127
Suominen Corporation Annual Report 2015
Suominen in brief / How we create value / Year 2015 / Business / Sustainability / Governance / Financial Statements
During 2015, the Care business area launched five new
branded products within the FIBRELLA® product family.
Three of them are for medical and two for hygiene ap-
plications. All these new products support Suominen’s
strategic goal of developing and introducing high value-
added nonwovens with unique features, which make
them particularly interesting for very specific applications.
For example, FIBRELLA® Move is a major step forward in
fluid acquisition and fluid management and it raises the
bar for materials in the construction of feminine care
products as well as for other absorbent hygiene applica-
tions. It enhances wearer comfort and body fit, and at
the same time gives convertors a new nonwoven that
easily runs on high-speed converting lines and is highly
compatible with other components.
FIBRELLA® Perf is another good example, as it repre-
sents everything required of a best-in-class wound-
care product: it is breathable, skin-friendly, low-linting
and very absorbent. These features make it equally
applicable to surgical laminates and apparel. There
is also another interesting aspect of FIBRELLA® Perf:
since it is the first nonwoven product Suominen
manufactures for Care business area in Paulínia, Brazil,
it opens up the South American medical markets to us.
Case Five new branded products launched in 2015
Suominen in brief / How we create value / Year 2015 / Business / Sustainability / Governance / Financial Statements 26 / 127
Suominen Corporation Annual Report 2015

Suominen in brief / How we create value / Year 2015 / Business / Sustainability / Governance / Financial Statements
In December 2014, Suominen launched a
growth investment program to execute its
strategy for 2015–2017. At the time of the
launch, the value of the program was esti-
mated at EUR 30–50 million in total, but was
later raised to approximately EUR 60 million
due to the promising growth prospects in
high value-adding nonwovens applications.
Intensifying the growth investment program supports
our strategic target of achieving above-industry-average
growth in net sales.
Growth investment program
PlantEstimatedvalue
Installedduring
Bethuneapprox. EUR 50 million
estimated H2/2016
Alicanteapprox. EUR 4 million 2015Nakkila
Paulínia
To be confirmed
approx. EUR 6 million
Suominen’s investments in a nutshell
~50 EURmillion
Nakkila, Finland
Alicante, Spain
Paulínia, Brazil
Bethune, USA
Suominen in brief / How we create value / Year 2015 / Business / Sustainability / Governance / Financial Statements
EURmillion ~4
27 / 127
Suominen Corporation Annual Report 2015

Suominen in brief / How we create value / Year 2015 / Business / Sustainability / Governance / Financial Statements
The investment program is helping
Suominen to transform its product port-
folio; in other words, to increase the share
of products with higher added value. This
will enhance our ability to supply superior
products to our customers and, ultimately,
to end users.
The program benefits both the Conveni-
ence and Care business areas: it will further
strengthen Suominen’s leading position in
wiping markets and provide us with a clearly
improved opportunity to grow the Care busi-
ness area.
At the end of 2015, the investment pro-
gram covered four of Suominen’s produc-
tion plants.
Clear rationale for
choosing the Bethune plant
In early 2015, we announced our plans to
invest in a new wetlaid production line in
order to implement our growth strategy. As
the planning advanced, Suominen’s existing
plant in Bethune, SC, USA, was chosen as the
location of the new production line.
We selected the Bethune plant for several
strategic and financial reasons:
1. Bethune is located in North America,
where demand for high value-adding
nonwovens has both developed
favorably historically and has
attractive growth forecasts.
2. The Bethune plant is ideally located in
the Carolinas, the nonwovens hub
of North America, and is favorably
located from the logistical standpoint
of serving our customers and
managing our raw materials.
3. The plant already has ongoing
operations, highly skilled staff and
considerable infrastructure already
in place for expansion.
The Bethune investment is the most significant project
in Suominen’s growth investment program.
The new production line is essential for the
execution of Suominen’s growth strategy, for
it will serve several high value-adding end-use
applications. It will be tailor-made, based on
our unique nonwovens technology expertise,
and will take wetlaid technology to a whole
new level in the nonwovens industry.
The total value of the Bethune investment,
including both equipment and facilities, will
be close to EUR 50 million. The investment is
significant for Suominen both financially and
strategically, but, since it is expected to create
at least 25 jobs in Bethune, it is also vital to
the local community.
The new production line is expected to
be installed during the second half of 2016.
Three investment projects in
Europe and South America
In Alicante, Spain, we executed a production
line modification. The modification further
improves production reliability at the Alicante
plant and expands its product offering to non-
wovens for household and workplace wipes
and also for medical products.
The Alicante investment is expected to
open up new opportunities for Suominen
in the European market.
In Nakkila, Finland, a production line that
was shut down in 2012 was restarted in
March 2015. The improved demand in the
European market and Suominen’s strategic
objective to grow encouraged us to re-eval-
uate the situation.
The line restart at Nakkila also had an ef-
fect on Suominen’s personnel, with 13 new
employees being recruited.
In Paulínia, Brazil, we invested in produc-
tion technology that makes it easier for us to
supply nonwovens for, e.g., medical applica-
tions in South America. The upgraded tech-
nology additionally enables us to manufac-
ture more differentiated nonwovens, which
is vital in the growing South American wipes
market.
Installations of all three investments were
completed on schedule in 2015.
Read more
> How we create value
Read more at suominen.fi
> Investors w
Suominen in brief / How we create value / Year 2015 / Business / Sustainability / Governance / Financial Statements 28 / 127
Suominen Corporation Annual Report 2015

Suominen in brief / How we create value / Year 2015 / Business / Sustainability / Governance / Financial Statements
Sustainability Sustainability stems from the business and ultimately supports the business. It cannot be reduced to reporting or charity activities. Instead, it involves, e.g., developing more responsible products, which our customers and end users crave. That is the way we see it. 5 %
Reduction in GHG emissions in 2015
Pinja Taittonen
Assistant Business Controller
Our purpose is to make
nonwovens continuously
better for people. That is
the basis of sustainability
at Suominen.
Suominen in brief / How we create value / Year 2015 / Business / Sustainability / Governance / Financial Statements 29 / 127
Suominen Corporation Annual Report 2015

Suominen in brief / How we create value / Year 2015 / Business / Sustainability / Governance / Financial Statements
At Suominen, sustainability means that we
take also environmental and social matters
into account in our decision-making. Our
sustainability strategy – the first of its kind
at Suominen – was composed at the end
of 2014 to support our business targets. It
defines precisely where we should target
our efforts and resources. Sustainability was
not, however, a new concept for us. Still,
this was the first time we clearly laid down
its strategic importance and specified which
themes are the most crucial to us and our
stakeholders.
In practice, the sustainability strategy
crystallizes our focus areas in promoting
sustainable development, as well as our key
projects for the strategy period 2015–2017.
The focus areas of sustainability
for Suominen, determined through
a materiality analysis, are:
1. Reaching product leadership
2. Operating sustainably across
the company
3. Fostering responsibility through
the value chain
During 2015, we kicked off
three key projects to implement
the sustainability strategy:
1. Product Sustainability Review
2. Non-Discrimination and Equal
Opportunities Program
3. Supplier Code of Conduct
However, as Suominen’s purpose is to
make nonwovens continuously better for
people, it is worth keeping in mind that
sustainability is not present only in specific
projects or programs. In fact, almost the op-
posite is true: sustainability is a day-to-day
matter that is concretized, for example, in the
development of more responsible products
and in all interaction with our stakeholders.
Focus areas of sustainability
at Suominen
Operating sustainably across the company
Reaching the product leadership
Fostering responsibility through the value chain
Sustainability strategy
Suominen in brief / How we create value / Year 2015 / Business / Sustainability / Governance / Financial Statements 30 / 127
Suominen Corporation Annual Report 2015

Suominen in brief / How we create value / Year 2015 / Business / Sustainability / Governance / Financial Statements
Stepping up the sustainability
of nonwovens
Having a sustainable product offering is one
of the core elements of Suominen’s sustain-
ability strategy, since all three focus areas of
the strategy are directly or indirectly related
to products. This means that Suominen’s
products are always safe and fit for the
purpose, renewable raw materials are used
more often, and we strive to meet all sustain-
ability requirements set by our customers
and end users.
In 2015, we launched a distinct
product sustainability project, which was based on a holistic,
three-part concept of sustainability.
This involved reviewing selected case
products in our offering, based on all the
dimensions of sustainability. The first phase
of the project, examining the sustainability
of the case products, was completed at the
end of 2015. As a result, we now have a
better-than-ever understanding of what our
customers, end users and legislators may re-
quire from Suominen’s products in terms of
sustainability and how our product portfolio
currently meets expectations. The next step
is to plan and prioritize the identified cross-
functional development measures and put
the plan into action.
Sustainability reporting at Suominen
Suominen’s Annual Report 2015 examines
sustainability from the social, environmental
and financial perspectives of responsibility.
We report on our sustainability work every
year in the Annual Report.
Health, safety and environmental data is
collected from Suominen’s production units.
In accordance with the materiality principle,
locations that do not have production opera-
tions are not included in the data.
The graphics in the Sustainability sec-
tion present historical data as of 2013. All
of the graphs reflect Suominen’s continuing
business.
The Windsor Locks plant in CT, USA, is
utilized by both Suominen and Ahlstrom
Corporation. Where the Windsor Locks plant
is concerned, only the resources used by
Suominen are taken into account in the en-
vironmental figures. In the safety indicators,
personnel who have worked on Suominen’s
production lines but are not on Suominen’s
payroll are excluded.
We continuously develop our sustainabil-
ity reporting with the goal of open, meaning-
ful and equal stakeholder communication.
Suominen in brief / How we create value / Year 2015 / Business / Sustainability / Governance / Financial Statements 31 / 127
Suominen Corporation Annual Report 2015

Suominen in brief / How we create value / Year 2015 / Business / Sustainability / Governance / Financial Statements
In 2015, the significance of the social di-
mension of sustainability rose higher on
Suominen’s agenda as a result of the chosen
strategic emphasis and, thanks to the mate-
riality analysis, the increased understanding
of which themes of social responsibility are
essential to us.
Suominen is committed to offering its
employees a fair, safe and healthy work
environment. This is the bread and butter
of our social responsibility, but, of course,
there’s more to it than that. To boost our
social responsibility efforts, we launched a
Non-Discrimination and Equal Opportuni-
ties Program as part of our strategic target
to further promote sustainable operations
across the company.
Developing our employees’ capabilities
and promoting motivation and a commit-
ment to our common goals is a prerequisite
for successful strategy execution. In 2015,
Suominen spent EUR 122,902 (EUR 250,607
in 2014) in personnel training.
Personnel training costs are investments in the company’s
future success
Only healthy employees are capable
employees. That is why Suominen strives
to improve employees’ working ability and
well-being. Last year, absences due to illness
amounted to 2.2% of total working hours
(2.4% in 2014).
Social responsibility
Suominen in brief / How we create value / Year 2015 / Business / Sustainability / Governance / Financial Statements
Eyes on equal pay
As part of the strategic Non-Discrimination
and Equal Opportunities Program, Suominen
conducted internal research on pay equity
between men and women in 2015. The
research involved all salaried employees
globally, i.e. 277 people in total. Employees
with hourly wages were excluded from the
research because of the comparability issues
between employees.
*100 = salaried employee average, indexed
Salaries at Suominen, indexed* All Female Male
0
100
200
300
400
500
Steer Manage Execute All
347389
326
156 149 160
60 64 59
97105100
Personnel training costs, EUR
1 3 14 1 50
50,000
100,000
150,000
200,000
250,000
300,000
106,125122,902
250,607
Sick absences, % of total working hours
1 3 14 1 50.0
0.5
1.0
1.5
2.0
3.02.2
2.82.4
32 / 127
Suominen Corporation Annual Report 2015

Suominen in brief / How we create value / Year 2015 / Business / Sustainability / Governance / Financial Statements
We are committed to the “equal pay for equal contribution”
principle.
We gained valuable information on the
current situation through the research and,
much to our delight, we discovered that the
overall situation is fairly good. We found out
that the gender pay gap varied somewhat
from country to country due to structural
reasons. For example, at certain plants wom-
en and men are not equally represented in
all functions and on all organizational lev-
els, which makes valid comparison difficult.
Our conclusion was that the root cause of
gender pay gaps at Suominen is structural
imbalance, rather than men and women be-
ing paid unequally for the same work. We
will monitor the gender pay gaps and are
committed to taking corrective measures
whenever necessary.
Disappointments in safety rates
In 2015, we continued to target zero lost-
time accidents but, unfortunately, our safety
rates weakened from the record-low level of
the previous year.
As part of the Non-Discrimination and Equal
Opportunities Program, we kicked-off a so-
called Blind Hiring Pilot Project in 2015 to see
if this could serve as a method of promoting
diversity and ensuring equal opportunities
when applying for a job at Suominen. Al-
though we knew that most of the personal
data of the applicants, e.g., full name, gender
and ethnicity, is irrelevant to Suominen, we
were aware that such data could uncon-
sciously bias the recruitment process. This
led Suominen to test out blind hiring – that
is, leaving the personal data of the applicants
hidden in the process as fully as possible.
Blind hiring was piloted in late 2015 in the
recruitment of an Assistant Business Con-
troller in our Helsinki office. First, we de-
fined a few pivotal selection criteria that
were objective, quantifiable and based on
the job description. An external recruitment
consultant assessed all applications using
Case Sustainability strategy put into practice in blind hiring
these criteria and selected the first group of
candidates. The hiring manager at Suominen
then narrowed the group down to six can-
didates based on their applications and ré-
sumés, with any personal data hidden. This
ensured that the applicants were assessed
only on their merits, and their identities were
revealed to the hiring manager only in the
interview phase.
The pilot was successful, and the blind hiring
process also brought efficiency, clarity and
structure to the hiring process. Suominen
aims to have blind hiring as the default ap-
proach in recruiting across the company. The
principle is meant to be utilized in all new
recruitment, including top management.
Read more at suominen.fi
> What’s new / Hiring manager’s blind datew
Suominen in brief / How we create value / Year 2015 / Business / Sustainability / Governance / Financial Statements 33 / 127
Suominen Corporation Annual Report 2015

Suominen in brief / How we create value / Year 2015 / Business / Sustainability / Governance / Financial Statements
Suominen’s eight plants recorded a total
of nine lost-time accidents. That is nine too many.
We develop occupational safety accord-
ing to the principle of continuous improve-
ment. In improving safety, Suominen places
particular emphasis on influencing attitudes,
behavior, and operating models and on
building a culture of work safety. Safety
monitoring is part of the daily activities of
our production plants.
Our Accident Frequency Rate (AFR) in-
creased to 8.29 in 2015 (1.83 in 2014). We
did not identify one single reason why the
rate went up and, therefore, Suominen main-
tains its focus on people’s safety behavior,
as in most of the cases the root cause of an
accident is unsafe behavior. In addition, we
are paying more and more attention to be-
ing proactive when it comes to preventing
accidents. This has led us to, among other
things, introduce and monitor some new in-
dicators, such as days without professional
medical intervention (PMI).
Behavior-Based Safety program
The Behavior-Based Safety (BBS) program
kept rolling for the second year in 2015 and,
during the year, the program was imple-
mented at all remaining Suominen plants.
BBS emphasizes the individual’s responsibil-
ity in occupational safety, takes the human
factor into account, and focuses on influenc-
ing the attitude and motivation of individuals.
The Behavior-Based Safety program is our way to achieve a new level in safety.
BBS is implemented through Safety Walks.
In a Safety Walk, a trained employee walks
through the plant premises, identifying both
safe and unsafe behaviors and conditions,
and then engages in an open conversation
with the employees. Safety Walks are based
on the notion that safety is everyone’s re-
sponsibility. They create a safety partnership
between the observer and the observed indi-
vidual, focus people’s attention and actions
on their own daily safety behavior as well
as on the safety behavior of those around
them.
By the end of 2015, a total of 196 Suomin-
en employees had participated in Safety
Walk training. A total of 8,611 Safety Walks
were performed and altogether 3,508 safe
acts and conditions, and 3,524 unsafe be-
haviors and conditions were identified dur-
ing the walks.
Lost time accidents (LTA)
Accident severity rate (ASR)
1 3 14 1 50.0
0.1
0.2
0.3
0.4
0.5
Accident frequency rate (AFR)
1 3 14 1 50
2
4
6
8
10
0.48
9.008.29
1.83
0.37
0.04
1 3 14 1 50
2
4
6
8
10 99
2
Suominen in brief / How we create value / Year 2015 / Business / Sustainability / Governance / Financial Statements 34 / 127
Suominen Corporation Annual Report 2015

Suominen in brief / How we create value / Year 2015 / Business / Sustainability / Governance / Financial Statements
Suominen strives to reduce the environ-
mental load of its operations and minimize
the environmental impacts of its products
throughout their life cycle. In 2015, we es-
pecially sought to improve our energy and
water efficiency.
Suominen’s environmental responsibility stems from our purpose “to make nonwovens
continuously better for people”.
Suominen is committed to considering
the environmental impacts of its opera-
tions in accordance with the International
Chamber of Commerce’s (ICC) principles of
sustainable development. We have identified
that our environmental impacts are primar-
ily related to the raw materials, energy and
water used in production, and to the waste
generated during the production process.
We prioritize the continuous improvement
and streamlining of our operations, and
foster the principle of reusing and recycling
materials.
Raw materials as important as ever
Since roughly 60–70% of Suominen’s expens-
es consist of raw materials, they play a promi-
nent role in our business. In 2015, Suominen
purchased 138,215 tons of fiber raw mate-
rial (138,519 tons in 2014), most of it being
viscose, pulp, polypropylene and polyester.
48.2% of Suominen’s raw materials originated
from renewable resources.
Energy and water efficiency in focus
Improving our energy and water efficiency
is something we especially focused on dur-
ing 2015. In energy efficiency, the target was
to achieve a 2% reduction in consumption,
while in water efficiency the goal was set at
a 12% consumption decrease in 2015.
Suominen’s energy consumption, 12.78
GJ/t, decreased from the level of 2014
Environmental responsibility
(13.02 GJ/t). The targeted reduction of 2%
was nearly met, as we managed to achieve a
reduction of 1.9%. Our work towards energy
efficiency does not, however, end here, for
we will continue our efforts to reduce our
energy consumption also in the future.
21.9% of the energy Suominen consumed in 2015
came from renewable sources.
Our water efficiency improved in 2015, as
consumption fell to 42.08 m³/t from 43.01
m³/t in 2014. However, the decrease fell
short of our target. One of the identified rea-
sons for this is that the water consumption
measurement system at our plant in Windsor
Locks, CT, USA, is based on estimates, as
the facility is also utilized by Ahlstrom Cor-
poration. We are working on improving the
measurement accuracy of our specific water
consumption at that plant and, hence, will
have flow meters installed during 2016 in
Energy consumption by sourcein 2015 (in total 1,683,166 GJ)
Natural gas 43%
Grid - electrical power 40%
Steam 17%
Suominen in brief / How we create value / Year 2015 / Business / Sustainability / Governance / Financial Statements
Energy consumption and energy efficiency
12,65
12,95
12,85
12,75
13,05
1 3 14 1 50
400,000
800,000
1,200,000
1,600,000
2,000,000
GJ GJ/ton of product
1,572,013
1,644,3981,683,166
Raw material usage in 2015(in total 138,215 tons)
Viscose 26%
Pulp 20%
Polypropylene* 23%
Polyester 26%
Other 6%
*Including sourced PP Spunbond
35 / 127
Suominen Corporation Annual Report 2015

Suominen in brief / How we create value / Year 2015 / Business / Sustainability / Governance / Financial Statements
00
30
20
10
40
50
0.012
0.008
0.004
0.016
0.020
0
0.72
0.48
0.24
0.96
1.20
order to show factual consumption and
improvements. The Windsor Locks plant
alone represents around 70% of Suominen’s
water consumption, due to the wetlaid pro-
duction technology utilized at the plant.
Suominen’s production plants do not discharge a single drop of
untreated water.
Thanks to our continuous efforts to im-
prove our water-treatment systems, all the
water used in Suominen’s operations is as
clean or cleaner than it was when taken into
our process. That’s why we can say that we
don’t have any untreated water among our
outputs – only treated water.
A proud moment in 2015 was when
Suominen’s plant in Green Bay, WI, USA,
achieved the Gold Award in recognition of
full compliance with Federal, State and local
waste-water operations and discharge stand-
ards and requirements for four years in a row.
Choices for lower emissions
Last year, Suominen focused efforts on en-
hancing the measurement of its greenhouse
gas emissions. This was our planned first
step in reducing emissions as effectively as
possible in the future, because it is only by
knowing where emissions stem from that
we can take corrective actions.
In 2015, Suominen’s total greenhouse
gas emissions (direct, scope 1, and indirect,
scope 2) fell to 1.07 t/t of CO2 equivalent,
down from 1.12 t/t in 2014.
Suominen has purposely chosen to pur-
chase energy from lower-carbon-emission
sources and, as a result, the total indirect
CO2 emissions (scope 2) were 10.4% lower
in 2015 than the average in the countries
where we operate.
Waste volumes kept going down
After the massive 60% reduction in 2014, we
managed to further decrease the amount of
landfill waste to 6.96 kg/t (7.03 kg/t in 2014).
Suominen in brief / How we create value / Year 2015 / Business / Sustainability / Governance / Financial Statements
Water intake by source in 2015(in total 5,542,291 m3)
Surface water 72%
Municipal watersupplies 19%
Ground water 9%
Water consumptionand water efficiency
1 3 14 1 5
1,000,000
0
2,000,000
3,000,000
4,000,000
5,000,000
6,000,000
Waste to landfill
1 3 14 1 50
500
1,000
1,500
2,000
2,500
Greenhouse gas emissions*
1 3 14 1 50
30,000
60,000
90,000
120,000
150,000
*including direct and indirect emissions
tons tons/ton of product
tons tons/ton of productm3 m3/ton of product
2278
114,679
888
141,493
916
140,774
4,860,9485,431,730
5,542,291
36 / 127
Suominen Corporation Annual Report 2015

Suominen in brief / How we create value / Year 2015 / Business / Sustainability / Governance / Financial Statements
Suominen wants to be a good corporate
citizen. We comply with local laws and regu-
lations and follow good corporate govern-
ance and other generally accepted business
practices. We strive to carry out our business
activities according to the expectations of
society and our stakeholders wherever we
operate.
Suominen’s turnaround into a company aiming for growth
has been successful.
We are economically vital and we intend
to keep it that way. As the development of
our operating profit – from EUR 25.9 million
in 2014 to EUR 31.8 million in 2015 – sug-
gests, progress has been made in profitabil-
ity. Last year, our profitability was impacted
by both internal work, such as maintaining
cost-consciousness, and by external effects,
such as exchange rates. Our internal work
on profitability will continue also in the fu-
ture. Good profitability and a strong financial
position are prerequisites for meeting our fi-
nancial obligations to our various stakehold-
ers and contributing to increasing general
economic well-being.
From a financial perspective, the EUR
60 million growth investment program was
probably the biggest piece of news from
Suominen in 2015. The most significant ini-
tiative in the program – the investment in a
new state-of-the art production line at the
Bethune plant in SC, USA – is also the largest
investment in organic growth in Suominen’s
history, with an approximate value of EUR 50
million. The growth investment program is
significant not only for Suominen, but also
for the local communities, since the invest-
ments create jobs. In Bethune, we will create
at least 25 new jobs by the end of 2016 and
in Nakkila, Finland, 13 new employees were
recruited in 2015, thanks to the re-opening
of a production line.
Stakeholder Direct financial impact in 2015
Customers Net sales EUR 444.0 millionSuominen’s major customers include, e.g., global consumer brands and private label manufacturers.
Employees Wages and salaries EUR 34.8 millionSuominen employed over 600 people in Europe and in North and South America in 2015.
Partners Materials and services EUR 322.3 millionSuominen purchases raw materials and other products and services from local and international business partners.
Society Corporate income taxes paid EUR 8.3 millionSuominen is a significant employer in the communities where we operate, which makes us a promoter of general well-being.
Financiers Net financial expenses EUR 5.3 million
ShareholdersEUR 0.01 per share fund distribution, approx. EUR 2.5 million in total, from the financial year 2014.
On 31 December 2015, Suominen had 4,818 shareholders.
Read more
> Business section
Read more at suominen.fi
> Sustainability
> Sustainability / Code of Conduct
w
Economic responsibility
Suominen in brief / How we create value / Year 2015 / Business / Sustainability / Governance / Financial Statements 37 / 127
Suominen Corporation Annual Report 2015

Suominen in brief / How we create value / Year 2015 / Business / Sustainability / Governance / Financial Statements
Corporate Governance The Corporate Governance section of the Annual Report provides a comprehensive review on Suominen’s governance and remuneration. As a new feature in our reporting, a letter from the Chair of the Personnel and Remuneration Committee has been included. 4,818 Number of Suominen
shareholders at the end of 2015.
The supreme
decision-making body of
Suominen is the General
Meeting of Shareholders.
Suominen in brief / How we create value / Year 2015 / Business / Sustainability / Governance / Financial Statements
Shareholders and market value in 2015
5000
4750
4250
3750
4500
4000 225
275
250
200
325
300
350
/20151 2 3 4 5 6 7 8 9 10 11 12
Market value, EUR million
Number of shareholders
In 2015,
the Board of Directors convened
18 times.
EUR millionShareholders
38 / 127
Suominen Corporation Annual Report 2015
Suominen in brief / How we create value / Year 2015 / Business / Sustainability / Governance / Financial StatementsSuominen in brief / How we create value / Year 2015 / Business / Sustainability / Governance / Financial Statements
Corporate Governance Statement of Suominen Corporation for 2015
In financial year 2015, Suominen Corpora-
tion (hereinafter “Suominen”) complied with
the Finnish Corporate Governance Code
2010 (hereinafter “Code”) issued by the Se-
curities Market Association. Suominen com-
plies with the Finnish Corporate Governance
Code 2015, effective as of 1 January 2016,
for the first time in the financial year starting
1 January 2016.
The Corporate Governance Statement
(hereinafter Statement), required by the
Code, Chapter 7, Section 7 of the Securities
Markets Act, and Section 7 of the Ministry of
Finance’s Decree on the Regular Duty of Dis-
closure of an Issuer of a Security, is published
as a separate statement in connection with
the Report by the Board of Directors. The
Statement is in accordance with the Code’s
Recommendation 54. In addition, selected
requirements set in the Corporate Govern-
ance Code 2015 have been taken into ac-
count in this Statement, even though they
will be effective only in financial year 2016.
The Statement can also be viewed on
Suominen’s website, www.suominen.fi.
The Audit Committee and the Board of
Directors of Suominen Corporation have
reviewed the Statement. The Statement will
not be updated during the financial year, but
up-to-date information on its various topics
is available on Suominen’s website.
The Finnish Corporate Governance Code
2010 for listed companies as well as the new
Finnish Corporate Governance Code 2015
are available on the website of the Securities
Market Association, www.cgfinland.fi.
Suominen Group
Responsibility for Suominen Group’s business
operations is held by the constitutional bod-
ies required by the Finnish Companies Act:
the General Meeting of Shareholders, which
elects the members of the Board of Directors;
and the President and CEO, who is appointed
by the Board of Directors.
The Group’s supreme decision-making
body is the General Meeting of Sharehold-
ers, where shareholders exercise their deci-
sion-making power. The Board of Directors
is responsible for the company’s manage-
ment and its appropriate organization. As
the Group’s parent company, Suominen
Corporation is responsible for the Group’s
management, accounting and financing,
product development and management
of intellectual property, human resources,
ICT, as well as communications and inves-
tor relations.
While Suominen has two business areas,
Convenience and Care, the company has
only one operating segment.
Shareholder’s Nomination Board of
Suominen Corporation
Suominen’s Annual General Meeting of 26
March 2013 resolved to establish a perma-
nent Shareholders’ Nomination Board ac-
cording to a proposal by the Board of Direc-
tors. The task of the Nomination Board is to
prepare and present to the Annual General
Meeting and, if necessary, to an Extraordi-
nary General Meeting, a proposal on the
remuneration of the members of the Board
of Directors, a proposal on the number of
members of the Board of Directors and a
proposal on the members of the Board of Di-
rectors. In addition, the task of the Nomina-
tion Board is to seek candidates as potential
board members.
The Nomination Board shall consist of
four (4) members, three of which shall be
appointed by the company’s three largest
shareholders, who shall appoint one member
each. The Chair of the company’s Board of
Directors shall serve as the fourth member.
The Nomination Board is established to
exist and serve until the General Meeting of
the company decides otherwise. The mem-
bers shall be nominated annually and their
term of office shall end when new mem-
bers are nominated to replace them. The
members of the Nomination Board shall be
independent of the company, and a per-
son belonging to the company’s operative
management cannot be a member of the
Nomination Board.
The representatives appointed by the
company’s three largest shareholders form
Suominen’s permanent Nomination Board.
The shareholders entitled to appoint mem-
bers to the Nomination Board during finan-
cial year 2015 were determined on the basis
of the registered holdings in the company’s
shareholder register on 1 September 2014,
on 7 October 2014 and on 1 September
2015.
39 / 127
Suominen Corporation Annual Report 2015

Suominen in brief / How we create value / Year 2015 / Business / Sustainability / Governance / Financial Statements
From 1 January to 1 September 2015, the
members of the Nomination Board were:
- Thomas Ahlström, Managing Director of Antti Ahlström Perilliset Oy and member of the Board of Directors of Ahlström Capital
- Timo Ritakallio, President and CEO of Ilmarinen Mutual Pension Insurance Company
- Reima Rytsölä, Executive Vice- President, Investments of Varma Mutual Pension Insurance Company
- Jorma Eloranta, Chair of Suominen’s Board of Directors.
As of 2 September 2015, the members of
the Nomination Board were:
- Thomas Ahlström, Managing Director of Antti Ahlström Perilliset Oy and member of the Board of Directors of Ahlström Capital
- Mikko Mursula, Chief Investment Officer of Ilmarinen Mutual Pension Insurance Company
- Reima Rytsölä, Executive Vice- President, Investments of Varma Mutual Pension Insurance Company
- Jorma Eloranta, Chair of Suominen’s Board of Directors.
In 2015, the Nomination Board convened
two times. The attendance rate at the meet-
ings was 100%.
Board of Directors
Composition in 2015
Until the Annual General Meeting of 2015,
Mr. Jorma Eloranta (Chair), Mr. Risto Ant-
tonen (Deputy Chair), Ms. Suvi Hintsanen, Mr.
Hannu Kasurinen and Ms. Jaana Tuominen
formed the Board of Directors of Suominen.
The Annual General Meeting held on 19
March 2015 re-elected Mr. Risto Anttonen, Mr.
Jorma Eloranta, Mr. Hannu Kasurinen and Ms.
Jaana Tuominen as members of the Board of
Directors. Additionally, Mr. Andreas Ahlström
and Ms. Laura Raitio were elected as new
members. The term of office of the members
of the Board of Directors ends at the close of
the Annual General Meeting 2016.
Biographical details of the members are
as follows:
Jorma Eloranta, b. 1951, M. Sc. (Tech.), Dr.
Sc. (Tech.) h.c., Chair of the Board
Risto Anttonen, b. 1949, B. Sc. (Econ.),
Deputy Chair of the Board
Andreas Ahlström, b. 1976, M. Sc.
(Econ. and Business Adm.), Investment
Manager, Ahlström Capital Oy
Suvi Hintsanen, b. 1967, M. Sc. (Econ.),
Head of Cash Management and Trade
Finance, Pohjola Bank plc (member of the
Board of Directors until 19 March 2015)
Hannu Kasurinen, b. 1963,
M. Sc. (Econ.), Senior Vice President,
Head of Carton Board Business Unit, Stora
Enso Corporation
Laura Raitio, b. 1962, Licentiate of Tech-
nology (Forest Products), CEO, Diacor
terveyspalvelut Oy
Jaana Tuominen, b. 1960, M. Sc. (Chem.
Eng.), CEO, Paulig Group
Tasks and responsibilities
The Board of Directors is responsible for the
administration and appropriate organization
of Suominen’s operations. The Board is re-
sponsible for making decisions on matters
that are likely to have a major impact on the
company’s operations. The Board convenes
according to an annual meeting plan. The
main duties of the Board include:
• deciding on the company’s corporate structure and organization
• nominating and dismissing the President & CEO
• deciding on the salaries, bonuses, and other benefits paid to the President & CEO and his/her immediate subordinates
• deciding on the company’s salary and incentive scheme
• considering and approving annual accounts, reports by the Board of Directors, financial statement releases, and interim reports
• monitoring and supervising the Group’s performance and ensuring the effectiveness of its management
• approving the company’s operating policies (financing policy, insurance and risk management policy, and principles for corporate governance)
• deciding on the acquisition and assignment of fixed assets
• deciding on strategically and financially significant investments, acquisitions, divestments, or other arrangements
• deciding on financial borrowings and pledging securities
• considering and approving strategies and action plans
• establishing a dividend policy and
confirming the company’s targets.
Suominen in brief / How we create value / Year 2015 / Business / Sustainability / Governance / Financial Statements 40 / 127
Suominen Corporation Annual Report 2015

Suominen in brief / How we create value / Year 2015 / Business / Sustainability / Governance / Financial Statements
The Board of Directors is elected by the Gen-
eral Meeting of Shareholders. It consists of
at least three and at most seven members.
Meeting practice
The Board of Directors convenes under the
direction of the Chair or, if the Chair is un-
able to attend, the Deputy Chair. Principally,
the matters are presented by the President
& CEO.
In 2015, the Board of Directors convened
18 times, of which 9 times per capsulam.
The average attendance rate at meetings
was 99%. The participation of each individual
member is presented in the table below.
of the company, and at least one member
must be independent of the company’s sig-
nificant shareholders.
From 1 January 2015 until 19 March 2015,
until the constitutive meeting of the Board,
the Audit Committee consisted of Hannu
Kasurinen as Chair and Suvi Hintsanen and
Jaana Tuominen as members. In its constitu-
tive meeting on 19 March 2015, the Board of
Directors elected Hannu Kasurinen as Chair
and Andreas Ahlström and Laura Raitio as
members of the Audit Committee.
In 2015, the Audit Committee convened
four times. The attendance rate at the meet-
ings was 100%. The participation of each in-
dividual member is presented in the table
below.Name Participation
Jorma Eloranta Chair 18/18
Risto Anttonen Deputy Chair 18/18
Andreas AhlströmMember as of 19 March 2015 14/14
Suvi HintsanenMember until 19 March 2015 4/4
Hannu Kasurinen Member 18/18
Laura RaitioMember as of 19 March 2015 13/14
Jaana Tuominen Member 18/18
Name Participation
Hannu Kasurinen Chair 4/4
Andreas Ahlström Member as of 19 March 2015 3/3
Suvi Hintsanen Member until 19 March 2015 1/1
Laura RaitioMember as of 19 March 2015 3/3
Jaana Tuominen Member until 19 March 2015 1/1
Evaluation of independence
The Board of Directors has evaluated the in-
dependence of its members. All members
are independent of the company and its
significant shareholders, with the exception
of Andreas Ahlström, who is dependent on
a significant shareholder. In financial year
2015, Andreas Ahlström acted as Investment
Manager at Ahlström Capital Oy. The larg-
est shareholder of Suominen, AC Invest Two
B.V., is a group company of Ahlström Capital.
Self-evaluation
The Board of Directors reviews its opera-
tions and procedures through an annual
self-assessment.
Board committees
Audit Committee
The main tasks of the Audit Committee re-
late to ensuring the company’s good gov-
ernance, accounting and financial reporting,
internal control systems and monitoring of
third-party auditing. The Audit Committee
prepares for the Board matters that fall under
its areas of responsibilities, but it does not
have independent decision-making pow-
ers unless the Board resolves otherwise on
certain matters.
The Chair and members of the commit-
tee are elected annually at the Board’s con-
stitutive meeting. At least three members are
elected to the committee. The members of
the Audit Committee must be independent
Personnel and Remuneration Committee
The Personnel and Remuneration Com-
mittee will prepare the remuneration and
appointment matters concerning the com-
pany’s President & CEO and other members
of senior management, as well as principles
and procedures related to the remuneration
of the company’s employees. The Commit-
tee will prepare for the Board matters that
fall under its areas of responsibilities, but it
does not have independent decision-making
powers unless the Board resolves otherwise
on individual matters.
The Chair and members of the commit-
tee will be elected annually at the Board’s
constitutive meeting. Until 19 March 2015,
the minimum number of committee mem-
bers was two, which deviated from recom-
mendation 22 of the Code 2010, which
states that Board committees must have at
least three members. Suominen’s Board of
Directors states that, taking into considera-
tion the number of members of the Board
and the scope and nature of the company’s
business operations, the Personnel and
Remuneration Committee was able to ef-
fectively handle the matters assigned to it
even with only two members. As of 19 March
2015, the Committee has consisted of three
members. The majority of the members of
the Personnel and Remuneration Commit-
Suominen in brief / How we create value / Year 2015 / Business / Sustainability / Governance / Financial Statements 41 / 127
Suominen Corporation Annual Report 2015

Suominen in brief / How we create value / Year 2015 / Business / Sustainability / Governance / Financial Statements
tee must be independent of the company.
The President & CEO or a member of the
company’s or Group’s management may not
be a member of the Personnel and Remu-
neration Committee.
From 1 January 2015 until 19 March 2015,
until the constitutive meeting of the Board
of Directors, the members of the Personnel
and Remuneration Committee were Jorma
Eloranta (Chair) and Risto Anttonen. In its
constitutive meeting held on 19 March 2015,
the Board of Directors elected Jorma Elor-
anta as the Chair of the Personnel and Re-
muneration Committee and Risto Anttonen
and Jaana Tuominen as members.
In 2015, the Personnel and Remunera-
tion Committee convened three times. The
attendance rate at the meetings was 100%.
The participation of each individual member
is presented in the table below.
Technology, the CIO, the Vice President of
Marketing & Product Management, the Vice
President of Sourcing, and the Vice President
of Corporate Communications & Investor
Relations.
Insider management
From 1 January to 30 November 2015
Suominen Group observed the guidelines
for insiders issued by the NASDAQ OMX
Helsinki Ltd on 1 July 2013, and as of 1
December 2015, the new Nasdaq Helsinki
Guidelines for Insiders.
The members of the Board of Directors,
the President & CEO and the Principal Audi-
tor are included in the company’s public in-
sider register. The public register is available
at Suominen’s website via the online service
provided by Euroclear Finland Ltd.
The company also maintains a com-
pany-specific register of non-public insid-
ers. Permanent insiders listed here include
the members of the Corporate Executive
Team and certain other employees of the
company, who by virtue of their position
or responsibilities regularly receive insider
information. A project-specific insider reg-
ister is maintained to cover persons that are
involved with the planning and preparation
of significant projects dealing with insider
information.
President & CEO and the Group
management
The President & CEO of Suominen Corpora-
tion is appointed by the Board of Directors.
The President & CEO is responsible for day-
to-day operations in accordance with the
Companies Act and guidelines and instruc-
tions provided by the Board of Directors. The
President & CEO is responsible for ensuring
that the company’s accounting practices
comply with the law and that its assets are
reliably managed. The President & CEO
acts as the Chair of the Corporate Execu-
tive Team and as the immediate supervisor
of the Team’s members.
Ms. Nina Kopola, b. 1960, M.Sc. (Chemi-
cal Eng.), Technology Licentiate acts as the
President & CEO of Suominen Corporation.
The President & CEO is supported by the
Corporate Executive Team and Corporate
Leadership Team. In 2015, the Corporate Ex-
ecutive Team comprised, in addition to the
President & CEO who acts as its Chair, the
Senior Vice Presidents of the business areas,
the Senior Vice Presidents of Operations, the
Senior Vice President, CFO, and the Senior
Vice President of Human Resources.
The Corporate Leadership Team compris-
es, in addition to the members of the Cor-
porate Executive Team, the Vice President
of R&D, the Vice President of Investments &
The Senior Vice President, CFO, is respon-
sible for Suominen’s insider management.
Insiders are not allowed to trade in se-
curities issued by the company for a period
beginning at the end of a financial period
or a financial year and ending with the pub-
lication of the interim report or financial
statement release for the period or financial
year in question (closed window). In case
an insider aims to trade with the company’s
shares, a trading scheme concerning the ac-
quisition or transfer of the company’s shares
must be employed. Trading scheme must
be submitted to the person responsible for
insider issues for his/her approval and for
storage prior to initiating trading with the
company’s shares.
Auditing
Until 19 March 2015, PricewaterhouseCoop-
ers Oy, Authorised Public Accountants, act-
ed as auditor of the company, with Heikki
Lassila, Authorised Public Accountant, as the
principal auditor.
The Annual General Meeting held on
19 March 2015 elected Ernst & Young Oy,
Authorised Public Accountants, as auditor
of the company, with Kristina Sandin, Au-
thorised Public Accountant, as the principal
auditor.
Name Participation
Jorma Eloranta Chair 3/3
Risto Anttonen Member 3/3
Jaana Tuominen Member as of 19 March 2015 2/2
Suominen in brief / How we create value / Year 2015 / Business / Sustainability / Governance / Financial Statements 42 / 127
Suominen Corporation Annual Report 2015

Suominen in brief / How we create value / Year 2015 / Business / Sustainability / Governance / Financial Statements
The auditors and the Audit Committee of
Suominen agree annually on an audit plan
that takes into account that Suominen does
not have an internal auditing organization of
its own. Internal audit findings are reported
to the President & CEO and the relevant
management concerned.
In 2015, the fees paid to Pricewaterhouse-
Coopers for the statutory auditing of the
Group companies totaled EUR 96 thousand.
In 2015, the fees paid to Ernst & Young for
the statutory auditing of the Group compa-
nies totaled EUR 329 thousand. The fees paid
to the auditing company Ernst & Young, and
companies belonging to the same group for
non-audit services such as tax, IFRS and due
diligence services, totaled EUR 29 thousand.
Description of the main features of the
internal control and risk management
systems in relation to the financial re-
porting process
Control environment
Control operations are embedded in the
organization of Suominen. Controlling is
executed in connection with the steering
of business processes and in wide-ranging
reporting processes.
Suominen has no separate organization
for its internal audit. Suominen’s control en-
vironment is based on given instructions, the
business culture and on the way of working
adopted by the company’s managers and
employees. Suominen has established its
values or principles, which encourage eve-
ryone at Suominen to adopt an active and
ethical way of working both with various
stakeholders and within the Group. In cas-
cading the working principles in the organi-
zation, honesty, transparency and working
in teams are integral elements of establish-
ing high ethical standards throughout the
company.
The foundation of the internal control
process relating to financial reporting is built
up around the Group’s policies approved by
the Board of Directors and other directives
and instructions. The responsibility structure
of the Group is based on authority inher-
ent in the positions and work descriptions,
segregation of duties and the “four-eyes”
and “one-over” principles. Effective internal
control requires that duties are properly al-
located to employees and potential conflicts
of interests are identified and eliminated. A
satisfactory control environment is ensured
through internal analyses and evaluations of
key processes as well as through revisions
made by external auditors.
Group Finance supports the business
units in analyzing their performance and
in the decision-making concerning various
business choices. Controllers at the unit
level are responsible for ensuring that con-
trol procedures are in place at various units.
The ICT function’s role is to maintain the
security checks of ICT systems throughout
the Group companies.
Risk assessment
Risk management is considered an integral
part of running the business, and the identifi-
cation and assessment of risks is an essential
element of internal control. The aim is to
focus on the material risks that are signifi-
cant from a business perspective. Risks are
categorized into business risks caused by
changes in the business environment and
operational risks, which may be the result of
deficiencies in the way that the organization
manages its processes.
Operational risks are considered to have a
potential material value in transactions with
external parties. However, Group instruc-
tions, process check-ups, allocation of tasks
and standards set up by total quality operat-
ing systems help to establish a prudent envi-
ronment in which exposure to material risks
can be mitigated.
Risks relating to financial reporting are
evaluated and monitored by the Board,
aiming to ensure that the financial report-
ing of the corporation is reliable, supports
decision-making and serves the needs of ex-
ternal stakeholders. The valuation of assets
and liabilities according to various evaluation
assumptions and criteria may constitute a
risk.
Estimates and assumptions involving a
significant risk of causing material changes
in the carrying amounts of assets and li-
abilities are continuously evaluated and
benchmarked against other similar entities.
Complex and/or changing business circum-
stances may present a challenge when as-
sessing the carrying amounts of assets. To
avoid errors in stating the fair values of assets
or liabilities, regular check-ups are made, e.g.
by comparing material flows, values, and
quantity and quality data with the informa-
tion given in the accounts. The risk of errors
caused by irregularities and discontinuities in
information is reduced by using established
and automated system-based audit trails.
Control activities
The control activities include general as well
as detailed controls that aim to prevent, re-
veal and correct errors and deviations. In
addition to Group-level instructions, con-
trol activities are also conducted at unit and
plant levels.
Suominen in brief / How we create value / Year 2015 / Business / Sustainability / Governance / Financial Statements 43 / 127
Suominen Corporation Annual Report 2015

Suominen in brief / How we create value / Year 2015 / Business / Sustainability / Governance / Financial Statements
Several control activities are applied in
the ongoing business processes to ensure
that potential errors or deviations in financial
reporting are prevented, discovered and cor-
rected. Suominen divides control activities
into three categories. Documented instruc-
tions help the organization to standardize
the monitoring of tasks. Continuous and
regular reporting conveying feedback on
the performance of Group functions and
entities ensures that instructions and defined
processes are followed. In critical processes,
specific authorizations are needed in the
work flow, either for security or verification
needs.
In practice, control activities are con-
ducted in management group meetings,
where the results of the activities are re-
viewed. More focused control is exercised
when specific reconciliation of accounts or
analyses of the processes for financial re-
porting are conducted. The need for sepa-
rate evaluations, as well as their scope and
frequency, will be defined by assessing risks
and the effectiveness of ongoing monitor-
ing procedures. It is the responsibility of the
Controllers to ensure that control activities in
the financial processes are appropriate and
in accordance with the Group’s policies and
instructions. Information security and related
control activities play a key role when the
features of ICT systems are being defined
and applied.
Information and communication
The Group accounting manual, policies ap-
proved by the Board and other directives and
instructions relating to financial reporting are
updated and communicated on a regular
basis from management to all affected em-
ployees and are also available in the intranet
systems of Group companies. In addition, a
standard reporting package is used by the
units. Group management and business unit
management conduct monthly reviews that
include an analysis of performance metrics
and indicators assisting management to
better understand the underlying business
performance.
Follow-up
Ongoing responsibility for follow-up rests
with the business units’ management groups
and controller functions.
Regular inspections by quality auditors
or customer audit personnel cover also the
internal controls of delivery chain processes.
The Group’s Finance function monitors
the operations and processes of the Group
units and the accuracy of external and inter-
nal financial reporting.
Suominen in brief / How we create value / Year 2015 / Business / Sustainability / Governance / Financial Statements 44 / 127
Suominen Corporation Annual Report 2015

Suominen in brief / How we create value / Year 2015 / Business / Sustainability / Governance / Financial StatementsSuominen in brief / How we create value / Year 2015 / Business / Sustainability / Governance / Financial Statements
Letter from the Chair of the Personnel and Remuneration Committee
Dear Shareholder,
2015 was characterized by consistent actions
to execute Suominen’s chosen strategy. A
new organizational structure, consisting of
the Convenience and Care business areas,
was introduced at the beginning of 2014. The
division into two dedicated businesses creates
focus and clarity in managing the businesses
and allocating resources. The Senior Vice
President of the Convenience business area,
Mr. Timo Hiekkaranta, left Suominen at the
end of August 2015. His contribution during
the years of integration following the acquisi-
tion of Ahlstrom’s Home & Personal business
represented continuity thanks to his extensive
experience in nonwovens and related indus-
tries. I want to thank Timo Hiekkaranta for the
work in leading our Convenience business
area. His contribution has been essential as
we have transformed Suominen into what it
is today – a dynamic, global company fully
focused on nonwovens.
After Hiekkaranta’s departure, the profile
of the Senior Vice President of Convenience
was carefully re-considered. In keeping with
the vision of becoming a Market Driven Prod-
uct Leader, we decided to shift to a more
market- and outside-oriented profile. Mr. Er-
nesto Levy was appointed Senior Vice Presi-
dent of Convenience on 6 October 2015. His
background in successfully leading global,
fast-moving consumer goods businesses
brings Suominen a tremendous amount of
consumer and market knowledge that will
help Suominen serve its customers better.
The decision to locate the position of SVP,
Convenience, in the United States balances
Suominen’s management structure. Four
members of the Corporate Executive Team
(CET), including the President & CEO, are lo-
cated in Europe and three in North America.
The geographical structure of the top man-
agement is a good reflection of Suominen’s
business and main markets.
Aligned with the focus on strengthening
Suominen’s capabilities to execute the growth
strategy, the Personnel and Remuneration
Committee paid extra attention on securing
the required management resources. A con-
tinuous review of roles and profiles to ensure
they match with business requirements, suc-
cession planning and proactive management
of talent ensure that Suominen is prepared to
face the future.
In terms of remuneration issues, the
Personnel and Remuneration Commit-
tee’s main focus has been on ensuring that
short-term and long-term incentive plans,
including their targets, are fully aligned with
shareholders’ interests. Suominen initiated
two new share-based incentive plans for
top management in 2015. The performance
share plan is based on long-term business
targets measuring growth, profitability and
return on investment. The matching share
plan requires management’s own invest-
ment in Suominen shares. Thanks to the
long-term incentive plans, a significant part
of management’s future remuneration is
fully variable. Future potential and current
share ownership with ownership obligations
make management’s and shareholders’ in-
terests congruent.
In financial year 2015, Suominen com-
plied with the Finnish Corporate Governance
Code 2010, and for the financial year starting
1 January 2016, Suominen complies with the
Finnish Corporate Governance Code 2015,
which entered into effect on 1 January 2016.
In addition, selected requirements set in Cor-
porate Governance Code 2015 have been
taken into account in the Corporate Govern-
ance Statement and Remuneration Report,
even though they will be effective only in
financial year 2016.
Suominen’s objective is to be transparent
and clear in communicating its remuneration
issues. We want to provide our shareholders
and other interest groups with a comprehen-
sive view of our remuneration philosophy
and principles guiding how remuneration
programs are engineered. Remuneration
reporting will offer an opportunity to assess
how the principles materialize and how per-
formance and remuneration are linked. This
Chair’s letter represents one step on our way
towards new reporting standards.
Our objective is to make Suominen’s
remuneration reporting timely, open and
transparent. If you wish to influence the
development of Suominen’s remuneration
reporting, Mr. Hannu Sivula, Senior Vice
President of Human Resources, will be hap-
py to hear your suggestions: hannu.sivula@
suominencorp.com.
Jorma Eloranta
Chair of the Personnel and
Remuneration Committee
45 / 127
Suominen Corporation Annual Report 2015

Suominen in brief / How we create value / Year 2015 / Business / Sustainability / Governance / Financial StatementsSuominen in brief / How we create value / Year 2015 / Business / Sustainability / Governance / Financial Statements
Remuneration Statement 2015 of Suominen Corporation
Suominen Corporation (Suominen) com-
plies with the Finnish Corporate Govern-
ance Code issued by the Securities Market
Association on 15 June 2010. The code is
available on the Association’s website at
www.cgfinland.fi. This Remuneration State-
ment has been prepared in accordance with
Section 7 (Remuneration), Recommendation
47 of the Code.
Suominen complies with the Finnish Cor-
porate Governance Code 2015, effective as
of 1 January 2016, for the first time in the
financial year starting 1 January 2016.
1) Reward principles
The goals set for Suominen’s rewards are
consistency, goal-orientedness, and incen-
tive. The consistency and competitiveness of
the rewards are ensured through systematic
internal and external comparisons that also
take into consideration local market condi-
tions. Suominen’s reward system aims to
ensure that a fixed proportion of the total
reward is individually targeted and actively
examined. The goal of a active reward sys-
tem is to ensure that the company has a
good employer brand, in the eyes of both
current and new key employees. Clear indi-
cators that reflect performance, as well as a
focus on the results that have been achieved
ensure that the reward is well-founded, goal-
oriented and offers incentive. By selecting
goals for the variable rewards, the aim is to
steer management towards implementing
Suominen’s strategy and achieving the fi-
nancial targets. Short- and long-term per-
formance-based remuneration is used to
reward good performance and to contribute
to the company’s financial success and the
favorable development of its shareholder
value.
2) Remuneration of the Board of
Directors in 2015
The Annual General Meeting determines the
remuneration paid to the members of the
Board of Directors in advance, for one year
at a time. The Nomination Board prepares a
proposal on the remuneration of the Board
of Directors for the Annual General Meeting.
Suominen’s Annual General Meeting held
19 March 2015 resolved to keep the remu-
neration of the members of the Board of
Directors unchanged. The annual remunera-
tion of the Chair of the Board of Directors is
EUR 50,000, of the Deputy Chair EUR 37,500
and of the members, EUR 28,000. Further,
the members of the Board of Directors are
paid a fee for attending meetings, such that
each member of the Board will receive EUR
500 for each meeting attended in the home
country of the respective member and EUR
1,000 for each meeting attended elsewhere
than in the home country of the respective
member. 60% of the annual remuneration is
paid in cash and 40% in Suominen Corpo-
ration shares. Compensation for expenses
is paid in accordance with the company’s
travel rules that are in force at the time. The
decisions were in accordance with the pro-
posal of the Nomination Board.
Of the remuneration payable in shares
as described above, the number of shares
transferred was determined based on the
share value in the stock exchange trading
maintained by Nasdaq Helsinki, and calcu-
lated as the trade volume weighted average
quotation of the share during the one month
period immediately following the date on
which the interim report of January-March
2015 of the company was published. Shares
were given out of the own shares held by
the company by the decision of the Board
of Directors on 5 June 2015.
Members of Suominen’s Board of Direc-
tors do not have an employment relationship
with the company. They are not included
in the company’s stock option programs or
share-based incentive plans and they do not
have any pension contracts with the com-
pany.
Suominen Corporation shares that have
been received as remuneration are not sub-
ject to restrictions or ownership obligations
set by Suominen.
46 / 127
Suominen Corporation Annual Report 2015

Suominen in brief / How we create value / Year 2015 / Business / Sustainability / Governance / Financial Statements
Remuneration of the Board of Directors in 2015
Remuneration of the members of the
Board of Directors totaled EUR 227,000
in 2015.
The shareholdings of the members of
the Board of Directors are presented at
www.suominen.fi > Investors > Corporate
Governance and through Euroclear Fin-
land’s NetSire Service.
Annual remuneration
paid in cash, EUR
Annual remuneration
paid in shares, EUR
Annual remuneration paid in shares,
number of shares Meeting fees, EUR Total, EUR
Jorma Eloranta Chair 30,000 20,000 21,802 5,500 55,500
Risto Anttonen Deputy Chair 22,500 15,000 16,351 5,500 43,000
Andreas AhlströmMember as of 19 March 2015 16,800 11,200 12,209 28,000
Suvi HintsanenMember until 19 March 2015 5,500 5,500
Hannu Kasurinen Member 16,800 11,200 12,209 5,500 33,500
Laura RaitioMember as of 19 March 2015 16,800 11,200 12,209 28,000
Jaana Tuominen Member 16,800 11,200 12,209 5,500 33,500
3) Remuneration of the President & CEO
and other management in 2015
The Board of Directors of Suominen deter-
mines the salary, bonuses and other benefits
paid to the President & CEO and to the mem-
bers of the Corporate Executive Team and
the Corporate Leadership Team serving un-
der the President & CEO. The remuneration
of the President & CEO and the Corporate
Executive Team consists of a fixed monthly
salary and benefits, of a performance-based
bonus (short-term remuneration), and of a
share-based incentive plans (long-term re-
muneration).
Long-term remuneration:
share-based incentive plan
The Board of Directors of Suominen Cor-
poration decided on 4 December 2014 on
two new share-based incentive plans for
the Group management and Group key
employees. The plan is divided in two; to
Performance Share Plan and Matching Share
Plan. The aim of the new plans is to combine
the objectives of the shareholders and the
persons participating in the plans in order
to increase the value of the company in the
long-terms, to bind the participants to the
company, and to offer them competitive
reward plans based on earning and accu-
mulating the company’s shares.
Performance Share Plan
The Performance Share Plan includes cur-
rently two vesting periods, calendar years
2015–2017 and 2016–2018. The Board of
Directors will decide separately on new
earnings periods. In addition, the Board of
Directors will decide on the Plan’s perfor-
mance criteria and required performance
levels for each criterion as well as the par-
ticipating persons at the beginning of an
earnings period. The Performance Share
Plan is directed to approximately 15 peo-
ple.
The potential reward of the Plan from the
performance period 2015–2017 will be based
on the Suominen Group s net sales growth,
earnings before interest and taxes (EBIT%)
and return on invested capital (ROI%). The
rewards to be paid on the basis of the per-
formance period 2015 - 2017 correspond
to the value of an approximate maximum
total of 2,300,000 Suominen Corporation
shares (including also the proportion to be
paid in cash).
Suominen in brief / How we create value / Year 2015 / Business / Sustainability / Governance / Financial Statements 47 / 127
Suominen Corporation Annual Report 2015

Suominen in brief / How we create value / Year 2015 / Business / Sustainability / Governance / Financial Statements
The potential reward of the Plan from the
performance period 2016–2018, announced
by the Board of Directors of Suominen on
9 December 2015, will be based on the
Suominen Group s net sales growth, earn-
ings before interest and taxes (EBIT%) and re-
turn on invested capital (ROI %). The rewards
to be paid on the basis of the performance
period 2015–2017 correspond to the value of
an approximate maximum total of 1,225,000
Suominen Corporation shares (including
also the proportion to be paid in cash).
The Board of Directors is entitled to
reduce the rewards agreed in the Perfor-
mance Share Plan if the limits set by the
Board of Directors for the share price are
reached.
Reward payment and ownership
obligation for the management
The potential rewards from the earnings pe-
riods 2015–2017 and 2016–2018 will be paid
partly in the company’s shares and partly in
cash in 2018 and 2019, respectively. The
cash proportion is intended to cover taxes
and tax-related costs arising from the reward
to the participant. As a rule, no reward will be
paid, if a participant s employment or service
ends before the reward payment.
A member of the Corporate Executive
Team must hold 50% of the net number
of shares given on the basis of the Plan, as
long as his or her shareholding in total cor-
responds to the value of half of his or her an-
nual gross salary. The President & CEO of the
Company must hold 50% of the net number
of shares given on the basis of the Plan, as
long as his or her shareholding in total cor-
responds to the value of his or her annual
gross salary. Such number of shares must be
held as long as the participant’s employment
or service in a group company continues.
Matching Share Plan 2015
The Matching Share Plan includes one three-
year vesting period, calendar years 2015–
2017. The prerequisite for receiving reward
on the basis of this plan is that a person
participating in the plan owns or acquires
the company’s shares up to the number
determined by the Board of Directors. Fur-
thermore, receiving of reward is tied to the
continuance of participant s employment or
service upon reward payment.
The members of the Corporate Executive
Team and the Corporate Leadership Team
belong to the target group of the Matching
Share Plan. The rewards to be paid on the
basis of the Matching Share Plan correspond
to the value of an approximate maximum to-
tal of 550,000 Suominen Corporation shares
(including also the proportion to be paid in
cash). In order to implement the Matching
Share Plan, a share issue against payment
was directed to the target group.
A maximum total of 550,000 new shares
in the company were offered in the share
issue for subscription. The share subscription
price for the new shares was EUR 0.67 per
share, which equals with the trade volume
weighted average quotation of the share
on NASDAQ OMX Helsinki Ltd during 1 No-
vember—30 November 2014 and with the
fair value approved by the tax authorities. In
total 507,388 new Suominen shares were
subscribed. The share subscription price
was credited to the company’s reserve for
invested unrestricted equity.
The decision on the share issue was
based on the authorization by the Annual
General Meeting of Shareholders held on
26 March 2014.
Share-based incentive plan 2012–2014
Based on the share-based incentive plan
for 2012–2014, in total 802,644 Suominen
shares were transferred as remuneration to
the seven participants of the plan, all mem-
bers of the company management. The
shares were transferred as directed share
issue without consideration from the shares
held by the company on 20 March 2015.
The reward was based on Suominen
Group’s cumulative Earnings Before Inter-
est, Taxes, Depreciation and Amortization
(EBITDA) and cumulative cash flow, and it
was paid partly in company shares and partly
in cash. The aim was that the proportion
to be paid in cash would cover taxes and
tax-related costs arising from the reward to
a participant. The Suominen shares trans-
ferred are not subject to restrictions or own-
ership obligations set by Suominen.
Short-term remuneration
In 2015, the salaries and benefits paid to
the President & CEO totaled EUR 455,716,
including a bonus of EUR 109,693. In total
325,861 Suominen shares were transferred
to the President & CEO based on the Share-
based incentive plan 2012–2014.
The salaries and benefits paid to the
other members of the Corporate Execu-
tive Team totaled EUR 1,445,932 including
bonuses of EUR 310,205. In total 425,332
Suominen shares were transferred to the
Suominen in brief / How we create value / Year 2015 / Business / Sustainability / Governance / Financial Statements 48 / 127
Suominen Corporation Annual Report 2015
Suominen in brief / How we create value / Year 2015 / Business / Sustainability / Governance / Financial Statements
other members of the Corporate Executive
Team based on the Share-based incentive
plan 2012–2014.
The figures include salaries for the period
during which the persons in question held
a position in the Corporate Executive Team.
Suominen applies a bonus scheme based
on the principles approved by the Board of
Directors in advance for one year at a time.
In 2015, the reward from the period was
based on Suominen Group’s cumulative
Earnings Before Interest, Taxes, Deprecia-
tion and Amortization (EBITDA) and personal
performance. The reward may not exceed
50% of the annual salary. For President &
CEO, the reward from the period is based
on Suominen Group’s profit before taxes and
may not exceed 60% of the annual salary.
Separate compensation is not paid to the
members of the Boards of Directors of the
company’s subsidiaries.
The members of the Corporate Executive
Team, excluding the President & CEO, are
not covered by any complementary pension
scheme. Pension arrangements in countries
without statutory pensions are arranged
through Suominen’s normal supplementary
pension programs.
5) Service contract of the
President & CEO
A written employment contract has been
made with the President & CEO, according
to which the period of notice is six months
should either the company or the President
& CEO terminate the contract. Should the
company terminate the President & CEO’s
contract of employment, severance pay cor-
responding to 12 months’ salary shall also
be paid.
Suominen’s President & CEO has a com-
plementary pension arrangement granting
benefits for old-age, disability and survivor’s
pension at the age of 63. The complemen-
tary pension is a defined-contribution pen-
sion scheme and corresponds to 11.5% of
the President & CEO’s annual salary (as de-
fined in the Finnish Employees Pensions Act)
for the year in question. The complementary
pension premium is based on the calculated
Read more at suominen.fi
> Investors / Corporate Governancew
Suominen in brief / How we create value / Year 2015 / Business / Sustainability / Governance / Financial Statements
annual earnings (fixed monthly salary plus
estimated bonus). Any possible difference
between the actual and calculated payment
is taken into account in the following year’s
payments.
Up-to-date information on the share-
holdings of the President & CEO and the
members of the Corporate Executive Team
are presented on Suominen’s website under
Investors section.
49 / 127
Suominen Corporation Annual Report 2015

Suominen in brief / How we create value / Year 2015 / Business / Sustainability / Governance / Financial StatementsSuominen in brief / How we create value / Year 2015 / Business / Sustainability / Governance / Financial Statements
Board of Directors
RistoAnttonen
b. 1949
M.Sc. (Econ)
Member of the Board since 2011, Deputy Chair of the Board of Directors since 2012
Independent member
AndreasAhlström
b. 1976
M. Sc. (Economics and Business Administration)
Investment Manager, Ahlström Capital Oy
Member of the Board of Directors since 2015
Non-independent member
JormaEloranta
b. 1951
M.Sc. (Tech.), Doctor of Science in Technology h.c.
Member of the Board since 2011, Chair of the Board of Directors since 2011
Independent member
HannuKasurinen
b. 1963
M.Sc. (Econ.)
Senior Vice President, Head of Carton Board Business Unit, Stora Enso Corporation
Member of the Board since 2012
Independent member
JaanaTuominen
b. 1960
M.Sc. (Chem. Eng.)
CEO of Paulig Group
Member of the Board since 2014
Independent member
LauraRaitio
b. 1962
Licentiate of Technology (Forest Products Technology)
CEO, Diacor terveyspalvelut OyMember of the Board of Directors since 2015
Member of the Board of Directors since 2015
Independent member
Detailed, up-to-date information on the principal working experience and positions of trust as well as on the shareholdings of the members of the Board of Directors is available at www.suominen.fi. Information on the Board’s remuneration is included in Suominen’s Remuneration Statement.
50 / 127
Suominen Corporation Annual Report 2015

Suominen in brief / How we create value / Year 2015 / Business / Sustainability / Governance / Financial Statements
Corporate Executive Team
Suominen in brief / How we create value / Year 2015 / Business / Sustainability / Governance / Financial Statements
Detailed, up-to-date information on the principal working experience and positions of trust as well as on the shareholdings of the members of Suominen’s Corporate Executive Team is available at www.suominen.fi. Information on their remuneration is included in the Suominen’s Remuneration Statement.
NinaKopola
b. 1960
M.Sc. (Chem. Eng.),Technology Licentiate
President & CEO
Joined Suominen in 2011
TapioEngström
b. 1963
M.Sc. (Accounting)
Senior Vice President, CFO
Joined Suominen in 2012
Lynda A.Kelly
b. 1964
B.Sc. (BusinessAdministration/Marketing)
Senior Vice President, Care
Joined Suominen in 2014
Larry L.Kinn
b. 1957
B.A. (Chemistry)
Senior Vice President,Operations Americas
Joined Suominen in 2011
MimounSaïm
b. 1964
ENSI Engineering
Senior Vice President, Operations EMEA
Joined Suominen in 2011
HannuSivula
b. 1966
M.Soc.Sc
Senior Vice President,Human Resources
Joined Suominen in 2012
ErnestoLevy
b. 1969
BIE (Industrial Engi-neering), MBA (Marketing)
Senior Vice President, Convenience
Joined Suominen in 2015
51 / 127
Suominen Corporation Annual Report 2015

Suominen in brief / How we create value / Year 2015 / Business / Sustainability / Governance / Financial Statements
Highlights of Suominen’s financial year 2015
- Net sales and operating profit improved markedly - Growth strategy was executed determinedly - The Board’s dividend proposal, EUR 0.02 per share, is in line with the company’s dividend policy
Net sales and operating profit improved markedly
In 2015, Suominen’s net sales grew by 10.5% to EUR 444.0 (401.8) million. Operating profit excluding non-recurring items amounted to EUR 31.2 million (26.9). Operating profit was EUR 31.8 million (25.9). Non-recurring items in the review period were EUR +0.5 million (-1.0). Profit before income taxes was EUR 26.5 (17.8) million, and profit for the period EUR 17.0 (10.2) million. Earnings per share amounted to EUR 0.06 (0.02) and cash flow from operations per share was EUR 0.11 (0.15).
North America and Europe are Suominen’s main market areas. Moreover, the company gained a foothold in the growing South American markets through an acquisition in February 2014. In South America, particularly in Brazil, the accelerated economic growth of recent years reversed. Contrary to what one might think, this was not reflected in Suominen’s business operations in the area. The Paulínia plant in Brazil was integrated into Suominen in early 2014, and since then the company has proceeded in the South American market as planned.
Suominen’s Board of Directors has set three medium-term financial targets for the company. In 2015, the return on investments was 15.9% (target level more than 12%) and our gearing was 25.9% (target level 40–80%). We did not achieve our third target, organic net sales growth at a rate faster than the industry average (approx. 3%). Suominen’s net sales grew organically, and excluding the effect of exchange rates, approximately 1% in the financial year 2015.
Growth strategy was executed determinedly
In 2015, Suominen actively implemented its strategy that aims at product leadership and at organic net sales growth at a rate faster than the industry average. The strategy includes four focus areas: superior product offering, proactive key account management, demand-driven supply
chain, and strong corporate culture and capabilities. While Suominen executed important activities within each of these areas, the progress in the implementation of the EUR 60 million growth investment program and the determined work done to enhance the product development process were the most significant measures taken.
The EUR 60 million growth investment program progressed
There were in total four initiatives going on in the growth investment program during the financial year 2015. At the plants located in Paulínia, Brazil and Alicante, Spain the company modernized the existing machinery, allowing these plants to broaden their product offering to nonwovens with higher added value, such as nonwovens for medical applications. At the Nakkila plant in Finland, we restarted a production line that was shut down in 2012, thus enabling us to meet the improved demand in the European market.
Building a new production line at the Bethune plant in South Carolina, USA is the largest single initiative in the entire growth investment program. The investment has a total value of close to EUR 50 million, and with this investment, Suominen will take wetlaid technology to a whole new level in the nonwovens industry. The new manufacturing line will be tailor-made, based on the company’s unique technological expertise, enabling Suominen to supply its customers with best-in-class nonwoven products. For its part, the investment enables Suominen to achieve one of its strategic intents, product leadership.
In September 2015 the company decided to increase the total value of the growth investment program to approximately EUR 60 million from the original range of EUR 30–50 million, thanks to the promising growth prospects identified in nonwovens with higher added value.
Product development process enhanced; six new products launched
In 2015, Suominen made numerous efforts to make its product development process more efficient. The process was renewed in a way that allows the company to ensure that ideas are transformed into commercial products as efficiently as possible. Moreover, Suominen recruited several new key persons to the Product Development team.
It is expected that the company’s strong focus on product development will be reflected also in research and development spending, which is forecasted to increase above 1% of net sales (0.8% of net sales in 2015)
The efforts made in Suominen’s product development started to bear fruit already in 2015. Suominen publicly launched a total of six new products to the market: five in the emerging Care business area and one in Convenience business area.
The Board’s dividend proposal, EUR 0.02 per share, in line with the company’s dividend policy
Suominen’s policy is to distribute approximately 30% of its profit for the period in annual dividends. In assessing its proposal for the payment of dividends, the company’s Board of Directors will also consider Suominen’s future investment needs and the solidity of its financial position.
Suominen’s Board of Directors proposes to the Annual General Meeting that a dividend of EUR 0.02 per share will be paid for the financial year 2015.
Net sales
In 2015, Suominen’s net sales grew by 10.5% from the comparison period to EUR 444.0 (401.8) million. The strengthening of the USD compared to EUR, Suominen’s reporting currency, increased the net sales of 2015 by approximately EUR 42 million.
Net sales of Convenience business area were EUR 411.5 (369.4) million and net sales of Care business area EUR 32.4 (32.3) million. The main application areas for nonwoven materials supplied by Suominen were baby wipes (accounting for 40% of the sales), personal care wipes (22%), household wipes (17%), wipes for workplace use (11%), and hygiene and medical products (7%). The share of baby wipes in the product portfolio declined by one percentage point from 2014. The development was in line with Suominen’s strategy. All wiping products belong to the Convenience business area and all medical and hygiene products belong to the Care business area.
Report by the Board of Directors 2015
Report by the Board of Directors
52 / 127
Suominen Corporation Annual Report 2015

Suominen in brief / How we create value / Year 2015 / Business / Sustainability / Governance / Financial Statements
-0.4 million as an impairment loss of shares in a real estate company, classified as available-for-sale, was recognized. The shares of the real estate company were divested in July 2015. Net financial expenses in the corresponding period in 2014 included a non-recurring loss totaling to EUR -0.9 million from discontinuing of interest rate hedging due to refinancing as well as transaction costs of EUR -2.0 million related to the previous syndicated loan.
Cash flow from operations was EUR 27.3 (37.1) million in 2015. Cash flow from operations per share in 2015 was EUR 0.11 (0.15). The financial items in the cash flow from operations, in total EUR -6.4 million (-6.5), were principally impacted by currency forward contracts hedging equity and the interests paid during the reporting period. In total EUR 7.9 million was tied up in working capital (2014: released 6.1). Cash flow from financing improved due to repayments of loan receivables (EUR 0.6 million) granted in connection with the divestment of the Flexibles business area in July 2014 and a new EUR 15 million investment loan taken in December 2015. Cash flow from financing was decreased by repayment of loan in September, EUR 3.3 million.
Business combinations and discontinued operations Business combinations
No business combinations were reported during the review period. Suominen completed the acquisition of the Paulínia plant in Brazil from Ahlstrom Corporation on 10 February 2014. The acquisition provided Suominen’s nonwovens business a foothold in the growing South American market region.
Discontinued operations
No discontinued operations were reported during the review period. In July 2014, Suominen divested its Flexibles business, and the result of the Flexibles segment is reported as discontinued operations in the figures of the corresponding period.
Capital expenditure In 2015, the gross capital expenditure totaled EUR 23.7 million (2014: 7.1 for continuing operations). Gross capital investments increased mainly due to the starting of the investment in a new wetlaid production line at the Bethune plant in SC, USA. Other major investments were related to the renewal of ICT systems, the modernization of the Alicante plant
in Spain and Paulínia plant in Brazil as well as to the re-opening of a production line in Nakkila plant in Finland. The other investments were mainly for maintenance.
In September 2015, Suominen announced that it will extend its growth investment program to approximately EUR 60 million. Earlier, the company had estimated that it will spend EUR 30–50 million in growth investments during the strategic period of 2015–2017. The total value of the investment project at the Bethune plant, including both equipment and facilities, will be close to EUR 50 million. The new line is anticipated to be installed during the second half of 2016.
Depreciation, amortization and impairment losses for the review period amounted to EUR -18.2 million (2014: -15.6 for continuing operations). The figure does not include the reversal of an impairment loss made at Nakkila plant due to the re-opening of a production line. The reversal amounted to EUR +0.5 million.
Operating profit and result
Operating profit excluding non-recurring items increased by 16% and amounted to EUR 31.2 million (26.9). Operating profit was EUR 31.8 million (25.9). Non-recurring items in the review period, EUR +0.5 million, consisted of reversal of previously made impairment losses of the re-opened production line in Nakkila plant in Finland. The non-recurring items reported in 2014 amounted to EUR -1.0 million, of which EUR -1.2 million were costs related to restructuring and acquisition of the Brazilian unit and EUR +0.2 million were items related to closing down of the fiber production in Nakkila in 2012.
In 2015, profit before income taxes for continuing operations was EUR 26.5 (17.8) million, and profit for the period for continuing operations was EUR 17.0 (10.2) million.
Financing
The Group’s net interest-bearing liabilities at the end of the review period, 31 December 2015, amounted to EUR 32.5 (37.8) million. Gearing was 25.9% (34.7%) and equity ratio 43.2% (41.2%).
In December 2015, Suominen converted its bank facilities nominated in euro to be nominated in US dollars. At the same time, Suominen drew down the investment loan that was initially part of the syndicated credit facilities agreement. The investment loan was raised in US dollars. These actions balanced the net US dollar exposure of the financial position.
In 2015, net financial expenses were EUR -5.3 million (-8.1), or 1.2% (2.0%) of net sales. Fluctuations in exchange rates increased the financial expenses by EUR -1.2 million. Financial expenses increased also by EUR
Net sales and operating profit
EUR thousand 2015 2014(* 2013(*
Net sales 444,042 401,762 373,684
Operating profit 31,778 25,897 18,916
Operating profit excluding non-recurring items 31,249 26,851 19,398
(* Continuing operations
Capital expenditure and depreciation, amortization and impairment
EUR thousand 2015 2014(* 2013(*
Gross capital expenditure 23,660 7,066 4,413
% of net sales 5.4 1.8 1.2
Depreciation and amortization -17,975 -15,576 -13,892
Impairment losses and reversals of impairment losses 291 − −
(* Continuing operations
Report by the Board of Directors
53 / 127
Suominen Corporation Annual Report 2015

Suominen in brief / How we create value / Year 2015 / Business / Sustainability / Governance / Financial Statements
Key ratios 2015 2014 2013
Return on equity (ROE), % 14.4 5.1 -18.6
Return on invested capital (ROI), % 15.9 12.0 -0.7
Return on invested capital (ROI), continuing operations, % 15.9 15.7 12.4
Equity ratio, % 43.2 41.2 32.9
Interest-bearing net debt, EUR million 32.5 37.8 75.5
Capital employed, continuing operations, EUR million 222.6 193.8 154.0
Gearing, % 25.9 34.7 96.2
Key ratios per share 2015 2014 2013
Earnings per share, EUR, continuing operations 0.06 0.04 0.02
Earnings per share, EUR, discontinued operations − -0.02 -0.09
Earnings per share, EUR, total, basic 0.06 0.02 -0.07
Earnings per share, EUR, total, diluted 0.06 0.02 -0.07
Cash flow from operations per share, EUR 0.11 0.15 0.09
Equity per share, EUR 0.50 0.44 0.32
Price per earnings per share (P/E) ratio 19.41 45.45 -7.35
Dividend or distributed funds per share, EUR (* 0.02 0.01 −
Dividend payout ratio / payout ratio for distribution of funds, % 31.3 58.6 −
Dividend yield, % 1.61 1.23 −
Number of shares, end of period, excluding treasury shares 251,511,730 246,130,603 246,009,755
Average number of shares excluding treasury shares 250,597,155 246,078,953 245,931,204
Average share-issue adjusted number of shares excluding treasury shares 250,943,177 248,013,178 247,794,055
Share price, end of period, EUR 1.24 0.81 0.48
Share price, period low, EUR 0.75 0.47 0.34
Share price, period high, EUR 1.33 0.82 0.61
Volume weighted average price during the period, EUR 1.01 0.58 0.48
Market capitalization, EUR million 311.9 199.4 118.1
Number of traded shares during the period 97,512,750 97,735,300 11,340,737
Number of traded shares during the period, % of average number of shares (share turnover) 38.9 39.7 4.6
(* 2015 the proposal of the Board of Directors to Annual General Meeting of distribution of dividends. In 2014, distribution of funds.
Key ratios per share are share issue adjusted.Definition for key ratios is presented in the consolidated financial statements.
Report by the Board of Directors
54 / 127
Suominen Corporation Annual Report 2015

Suominen in brief / How we create value / Year 2015 / Business / Sustainability / Governance / Financial Statements
Employees
In 2015, Suominen employed an average of 614 (in 2014: 591 in continued operations) people. The number of employees in the end of the financial year was 636 (587). At the Nakkila plant, Suominen restarted a production line that was shut down in 2012. In connection with the restart, in total 13 people were recruited to the plant. Moreover, the number of employees grew across the Group, particularly in those functions that play a central role in the execution of Suominen’s product leadership strategy: Sales, Marketing and Research & Development are examples of these functions.
Environment
Suominen’s goal is to reduce the environmental load caused by the company’s operations and to minimize the environmental impacts of its products throughout their life cycle. In addition to continuously improving and enhancing its operations, Suominen’s environmental efforts are guided by the principles of reusing and recycling materials. Suominen is committed to taking into consideration the environmental impacts of its operations in accordance with the principles of sustainable development of the International Chamber of Commerce (ICC).
Suominen complies with the local legislation and official guidelines wherever it operates. Separate environmental permits are required for operations in some of the Group’s units. Of Suominen’s eight production units, the Nakkila, Alicante, Bethune, Green Bay and Windsor Locks plants hold an ISO 14001 environmental management system.
The environmental impacts of Suominen’s operations primarily stem from the raw materials, energy and water used in production and from the waste generated during the production process. Environmental requirements are incorporated into product and process development projects from the very start, with the aim of using raw materials, energy, water and other resources, such as packaging materials and transport services, as efficiently as possible. The Group focuses on systematically lowering its waste volumes and making its use of energy and water more efficient. Currently, Suominen’s product range includes certified products made of renewable raw materials. In addition, the company is constantly developing its product offering, taking into account not only the environmental performance but also the social aspects.
The materials used in the manufacture of products mainly consist of viscose, pulp, polypropylene and polyester. There is the risk that production plants might release hazardous substances into the environment. Suominen strives to control environmental risks by means of the quality and environmental systems used in production operations. Reducing environmental impacts requires long-term development work, an important element of which is the harmonization of key indicators between the various business areas and units. Suominen strives to have more comprehensive, commensurable data available on the impacts of
Research and development
In 2015, Suominen improved its internal product development processes and increased the number of employees focusing on product development. The Group’s Research & Development function had 18 (13) employees at the end of the year. Research and development expenses amounted to EUR 3.5 million (2.9), corresponding to 0.8% (0.7%) of net sales.
Suominen’s vision is to become a Market Driven Product Leader. Suominen focuses on research and development in order to be able to offer its customers materials and solutions that have superior functionalities and to increase the share of products with higher added value in its portfolio.
Suominen Corporation owns all business-related patents and related technologies, know-how, processes, recipes and all other solutions developed by Suominen Corporation. The company is targeting to have extensive industrial rights to the nonwoven-based solutions and technologies thereto as well as test and pilot equipment needed. This way it can offer best possible support to the group companies to satisfy the current and future customer needs.
Quarterly development 2015
EUR thousand Q1 2015 Q2 2015 Q3 2015 Q4 2015 2015
Net sales 111,934 112,944 114,919 104,244 444,042
Operating profit excluding non-recurring items 7,292 9,932 9,763 4,262 31,249
% of net sales 6.5 8.8 8.5 4.1 7.0
Non-recurring items − 530 − − 530
Operating profit 7,292 10,462 9,763 4,262 31,778
% of net sales 6.5 9.3 8.5 4.1 7.2
Net financial expenses -1,621 -1,076 -1,247 -1,358 -5,302
Profit before income taxes 5,670 9,386 8,517 2,904 26,477
Personnel related key ratios 2015 2014 2013
Average number of personnel, continuing operations 614 591 550
Average number of personnel 614 826 1 037
Wages and salaries, continuing operations, EUR thousand 36,016 32,474 31,540
Report by the Board of Directors
55 / 127
Suominen Corporation Annual Report 2015

Suominen in brief / How we create value / Year 2015 / Business / Sustainability / Governance / Financial Statements
the company’s operations. This would allow development measures to be targeted efficiently, and as effectively as possible.
In 2015, Suominen’s production plants used a total of 138,215 tons of raw materials (138,519 in 2014), 1,683,166 (1,644,398) gigajoules of energy and 5,542,291 m3 (5,431,730 m3) of water. Landfill waste generated at the production plants amounted to 916 (888) tons.
The environmental performance of Suominen is presented more extensively in the Sustainability section of the Annual Report 2015. The sustainability data is not audited.
The environmental expenditure of the Group was EUR 1.8 (1.0) million. No material environment-related investments were made.
Share information
Share capital
The number of Suominen’s registered shares was 252,425,616 on 31 December 2015, equaling to a share capital of EUR 11,860,056.00. Suominen has one series of shares. Each share carries one vote in the Shareholders’ Meeting and right to an equally-sized dividend. Suominen’s shares are affiliated in a book-entry system.
The number of shares increased in 2015 in total by 4,491,494 shares, of which 3,984,106 were attributable to the share conversions of the hybrid bond notes and accrued interests; and 507,388 to the directed share issue subject to payment for the management, implemented in accordance with the share-based incentive plan. Both the conversion of the hybrid bond to equity and the share issue subject to payment have been recorded into the reserve for invested unrestricted equity.
Share trading and price
The number of Suominen Corporation shares (SUY1V) traded on Nasdaq Helsinki from 1 January to 31 December 2015 was 97,512,750 shares, accounting for 38.9% of the average number of shares (excluding treasury shares). The highest price was EUR 1.33, the lowest EUR 0.75 and the volume-weighted average price EUR 1.01. The closing price at the beginning of the review period, on 2 January 2015, was EUR 0.85 and the closing price at the end of the review period, on 30 December 2015, was EUR 1.24.
The market capitalization (excluding treasury shares) was EUR 311.9 million on 31 December 2015.
the stock exchange trading maintained by Nasdaq Helsinki Ltd, and calculated as the trade volume weighted average quotation of the share during the one month period immediately following the date on which the interim report of January–March 2015 of the company was published. Shares were given out of the own shares held by the company by the decision of the Board of Directors on 5 June 2015.
Share-based incentive plans for the management and key employees
Suominen Corporation has a share-based incentive plan for the Group management and Group key employees, which is divided into Performance Share Plan and Matching Share Plan. The aim of the plans is to combine the objectives of the shareholders and the persons participating in the plans in order to increase the value of the company in the long-term, to bind the participants to the company, and to offer them competitive reward plans based on earning and accumulating the company s shares.
Performance Share Plan
The Board of Directors has decided on two vesting periods in the Performance Share Plan, calendar years 2015–2017 and 2016–2018. The Board of Directors will decide separately on new earnings periods. In addition, the Board of Directors will decide on the Plan’s performance criteria and required performance levels for each criterion at the beginning of an earnings period. The Performance Share Plan is directed to approximately 15 people.
The potential reward of the Plan from the performance period 2015–2017 will be based on the Suominen Group s net sales growth, earnings before interest and taxes (EBIT %) and return on invested capital (ROI %). The rewards to be paid on the basis of the performance period 2015–2017 correspond to the value of an approximate maximum total of 2,300,000 Suominen Corporation shares (including also the proportion to be paid in cash).
The potential reward of the Plan from the performance period 2016–2018 will be based on the Suominen Group s net sales growth, earnings before interest and taxes (EBIT %) and return on invested capital (ROI %). The rewards to be paid on the basis of the performance period 2016–2018 correspond to the value of an approximate maximum total of 1,225,000 Suominen Corporation shares (including also the proportion to be paid in cash).
Authorizations of the Board of Directors
The Annual General Meeting (AGM) held on 19 March 2015 authorized the Board of Directors to repurchase a maximum of 2,000,000 of the company’s own shares. The shares shall be repurchased to be used in company’s share-based incentive programs, in order to disburse the remuneration of the members of the Board of Directors, for use as consideration in acquisitions related to the company’s business, or to be held by the company, to be conveyed by other means or to be cancelled. The company’s own shares shall be repurchased otherwise than in proportion to the holdings of the shareholders by using the non-restricted equity through trading on regulated market organized by Nasdaq Helsinki Ltd at the market price prevailing at the time of acquisition. The repurchase authorization is valid until 30 June 2016.
The AGM held on 26 March 2014 authorized the Board of Directors to decide on issuing new shares and/or conveying the company’s own shares held by the company and/or granting special rights entitling to shares referred to in Chapter 10, Section 1 of the Finnish Companies Act. New shares may be issued and/or company’s own shares held by the company or its group company may be conveyed at the maximum amount of 25,000,000 shares in aggregate. The maximum number of new shares that may be subscribed and own shares held by the company that may be conveyed by virtue of the options and other special rights granted by the company is 25,000,000 shares in total which number is included in the maximum number stated earlier. The authorizations are valid until 30 June 2017. By 31 December 2015, the number of shares used based on the authorization was 1,517,869 shares. The remaining number of shares which can be issued based on the authorization is 23,482,131 shares.
Remuneration of the Board payable in shares
Suominen’s Annual General Meeting held on 19 March 2015 resolved to keep the remuneration of the members of the Board of Directors unchanged. The annual remuneration of the Chair of the Board of Directors is EUR 50,000, of the Deputy Chair EUR 37,500 and of the members EUR 28,000. Further, the members of the Board of Directors are paid a fee for attending meetings, such that each member of the Board will receive EUR 500 for each meeting attended in the home country of the respective member and EUR 1,000 for each meeting attended elsewhere than in the home country of the respective member. 60% of the annual remuneration is paid in cash and 40% in Suominen Corporation shares.
Of the remuneration payable in shares as described above, the number of shares transferred was determined based on the share value in
Report by the Board of Directors
56 / 127
Suominen Corporation Annual Report 2015

Suominen in brief / How we create value / Year 2015 / Business / Sustainability / Governance / Financial Statements
The Board of Directors is entitled to reduce the rewards agreed in the Performance Share Plan if the limits set by the Board of Directors for the share price are reached.
Reward payment and ownership obligation for the management
The potential rewards from the earnings periods 2015–2017 and 2016–2018 will be paid partly in the company’s shares and partly in cash in 2018 and 2019, respectively. The cash proportion is intended to cover taxes and tax-related costs arising from the reward to the participant. As a rule, no reward will be paid, if a participant s employment or service ends before the reward payment.
A member of the Corporate Executive Team must hold 50% of the net number of shares given on the basis of the Plan, as long as his or her shareholding in total corresponds to the value of half of his or her annual gross salary. The President & CEO of the Company must hold 50% of the net number of shares given on the basis of the Plan, as long as his or her shareholding in total corresponds to the value of his or her annual gross salary. Such number of shares must be held as long as the participant’s employment or service in a group company continues.
Matching Share Plan 2015
The Matching Share Plan includes one three-year vesting period, calendar years 2015–2017. The prerequisite for receiving reward on the basis of this plan is that a person participating in the plan owns or acquires the company’s shares up to the number determined by the Board of Directors. Furthermore, receiving of reward is tied to the continuance of participant´s employment or service upon reward payment.
The members of the Corporate Executive Team and the Corporate Leadership Team belong to the target group of the Matching Share Plan. The rewards to be paid on the basis of the Matching Share Plan correspond to the value of an approximate maximum total of 550,000 Suominen Corporation shares (including also the proportion to be paid in cash). In order to implement the Matching Share Plan, a share issue subject to payment was directed to the target group. A maximum total of 550,000 new shares in the company were offered in the share issue for subscription. The share subscription price for the new shares was EUR 0.67 per share, which equals with the trade volume weighted average quotation of the share on Nasdaq Helsinki Ltd during 1 November–30 November 2014 and with the fair value approved by the tax authorities.
In total 507,388 new Suominen shares were subscribed for. The shares subscribed for were registered in the Trade Register on 13 February 2015, as of which date the new shares established shareholder rights. The
Group in a directed share-issue without consideration as a reward of the 2012–2014 share-based incentive plan. In addition, in accordance with the resolution by the Annual General Meeting in total 86,989 shares were transferred on 5 June 2015 to the members of the Board of Directors as their remuneration payable in shares.
Notifications under Chapter 9, Section 5 of the Securities Market Act
During the review period, Suominen received the following notifications referred to in Chapter 9, Section 5 of the Securities Market Act:
On 29 January 2015, Mandatum Life Insurance Company Limited (business identity code 0641130-2) notified that it has divested Suominen Corporation shares through a transaction made on 23 January 2015, and consequently, its ownership in Suominen decreased below the threshold of 5%. After the transaction, Mandatum holds in total 12,318,243 shares and votes (4.97% of all shares and votes). In its previous notification, the number of shares held by Mandatum was 22,322,222, which accounted for 9.1% of all shares and votes in Suominen.
On 29 January 2015, Mandatum Life Insurance Company Limited (business identity code 0641130-2) notified that it had on 5 February 2014 subscribed the convertible hybrid bond issued by Suominen, which entitles Mandatum to subscribe a maximum of 3,714,000 new Suominen shares during the conversion period of 11 February 2014–10 February 2018. If Mandatum decided to subscribe these shares, its shareholding in Suominen would exceed the threshold of 5%. After the subscription, Mandatum would hold 16,032,243 shares and votes (6.37% of all shares and votes). In its previous notification, the number of Suominen shares held by Mandatum was 12,318,243, which accounted for 4.97% of all shares and votes.
On 18 February 2015, Mandatum Life Insurance Company Limited (business identity code 0641130-2) notified that it has divested Suominen Corporation shares through a transaction made on 17 February 2015. Following the transaction, Mandatum’s ownership in Suominen would remain below the threshold of 5% even if Mandatum would convert all notes of the hybrid bond it subscribed in February 2014 into Suominen shares.
On 16 March 2015, Finnish Industry Investment Ltd (Suomen Teollisuussijoitus Oy, business identity code 1007806-3) notified that it has divested Suominen shares and thus its shareholding has fallen below the threshold of 5% of all shares and votes in Suominen. In its previous notification, Finnish Industry Investment Ltd stated it held 22,222,222 Suominen shares, corresponding to 9.04% of shares and votes in Suominen Corporation. Before the transaction made on 16
shares were traded on the Nasdaq Helsinki Ltd as of 16 February 2015. The share subscription price was credited to the company’s reserve for invested unrestricted equity.
The decision on the share issue was based on the authorization granted to the Board of Directors by the Annual General Meeting of Shareholders held on 26 March 2014.
Hybrid bond and conversion of the bond notes into Suominen shares in 2015
In February 2014, Suominen Corporation issued a EUR 17.5 million convertible hybrid bond. In accordance with the terms and conditions of the bond, the bondholders have a right to convert the bond notes and the accrued capitalized interest related to the notes into Suominen shares. The conversion period started on 11 February 2014 and will end on 10 February 2018. Conversion Rate pursuant to the terms of the bond is EUR 0.50 per share and is determined market-based. The average volume weighted share price of the company’s share during the last three (3) months before the issue of the bond was EUR 0.48.
In 2015, bond notes and the accrued capitalized interest related to the notes were converted to total of 3,984,106 new shares in Suominen Corporation. The conversion rate was recorded under the reserve for invested unrestricted equity of Suominen. The carrying amount of the hybrid bond amounted to EUR 16,840,200 on 31 December 2015. The number of shares in Suominen may increase by maximum of 38,625,600 shares on the basis of the conversion of the remaining bond notes and the potential capitalized interest, if the conversion is carried out by issuing new shares in Suominen.
Shareholders
At the end of 2015, Suominen Corporation had in total 4,818 shareholders. Suominen is not aware of any shareholder agreements related with the shareholding or use of voting rights. Detailed information on the shareholding of the members of the Board of Directors and company management is available in Note 36 of the consolidated financial statements. The largest shareholders and the breakdown of the shareholding are presented in Note 15 of the consolidated financial statements.
Treasury shares
At the end of review period, on 31 December 2015, Suominen Corporation held 913,886 treasury shares. In total 802,644 treasury shares were transferred during the review period to key employees of the
Report by the Board of Directors
57 / 127
Suominen Corporation Annual Report 2015

Suominen in brief / How we create value / Year 2015 / Business / Sustainability / Governance / Financial Statements
March 2015, Finnish Industry Investment Ltd held 14,009,604 shares, corresponding to 5.57% of all shares and votes. After the transaction made on 16 March 2015, Finnish Industry Investment Ltd holds in total 7,009,604 Suominen shares, corresponding to 2.78% of all shares and votes.
On 20 March 2015, Ilmarinen Mutual Pension Insurance Company (Keskinäinen Eläkevakuutusyhtiö Ilmarinen, business identity code 0107638-1), notified that it has on 19 March 2015 divested Suominen shares and consequently crossed the threshold of 10% of all shares and votes in Suominen Corporation. In its previous notification, Ilmarinen stated it held 27,111,992 Suominen shares, corresponding to 11.02% of shares and votes in Suominen Corporation. After the transaction, Ilmarinen holds in total 18,422,103 Suominen shares, corresponding to 7.33% of all shares and votes.
On 10 July 2015, GMT Capital Corp notified that it has on 9 July 2015 acquired Suominen shares and consequently reached the threshold of 5% of all shares and votes in Suominen Corporation. After the transaction, GMT Capital Corp holds in total 12,623,280 Suominen shares, corresponding to 5.00% of all shares and votes.
Information Pursuant of Decree 1020/2012 by Ministry of Finance, not presented in the consolidated financial statements
There are no restrictions of transfer neither redemption or approval clauses related to the shares of Suominen Corporation or securities entitling to shares.
Suominen Corporation is not participating any arrangements where the financial rights related to a share or a security entitling to hold a share would have been separated.
In accordance with the Articles of Association of Suominen Corporation and the Finnish Companies Act, the Shareholders’ Meeting elects the Board of Directors. In accordance with the Articles of Association, the Board of Directors decides on the nomination of the President & CEO. The Articles of Association includes no specific stipulation on altering the Articles of Association. Shareholders’ Meeting decides on share issues and acquisition of own shares, in accordance with the Finnish Companies Act.
The members of the Board of Directors have no specific contracts with the company regarding compensation in case a member resigns, is dismissed or his/her task ceases to exist due to a public tender offer.
as new members of the Board of Directors for the next term of office, expiring at the end of the first Annual General Meeting of Shareholders following their election. The remuneration of the members of the Board of Directors was resolved to maintain unchanged. The resolutions were in accordance with the proposals submitted by the Nomination Board of Suominen’s shareholders.
Ernst & Young Oy, Authorized Public Accountants, was elected as auditor of Suominen Corporation, with Ms. Kristina Sandin, Authorized Public Accountant, as the principal auditor.
Constitutive meeting and permanent committees of the Board of Directors In its constitutive meeting on 19 March 2015, the Board of Directors elected from among its members a Chair and Deputy Chair as well as members for the Audit Committee and Personnel and Remuneration Committee.
The Board of Directors elected Jorma Eloranta as the Chair and Risto Anttonen as the Deputy Chair of the Board of Directors, in accordance with the recommendation by the Nomination Board of Suominen’s shareholders.
Hannu Kasurinen was re-elected as Chair of the Audit Committee. Andreas Ahlström and Laura Raitio were elected as members of the Audit Committee. Jorma Eloranta was re-elected as the Chair of the Personnel and Remuneration Committee. Risto Anttonen and Jaana Tuominen were elected as members of the Personnel and Remuneration Committee.
Changes in Corporate Executive TeamMr. Timo Hiekkaranta, Senior Vice President of Suominen’s Convenience business area and a member of Suominen’s Corporate Executive Team, left Suominen on 31 August 2015 to pursue his career outside the company.
Suominen announced on 6 October 2015 that Mr. Ernesto Levy, MBA, has been appointed Senior Vice President, Convenience business area and a member of the Corporate Executive Team at Suominen Corporation, effective 20 October 2015. Ernesto Levy has an impressive track record in leading consumer brand organizations, such as Novartis and Procter & Gamble.
The President & CEO has no separate contract to be applied if his/her employment would be terminated due to a public tender offer. In accordance with the employment contract made by the company and the President & CEO, should the company terminate the President & CEO’s contract of employment, severance pay corresponding to 12 months’ salary shall be paid. Other principal terms and conditions of the service contract of the President & CEO are presented in Note 36 of the consolidated financial statements and in the Remuneration Statement 2015 of Suominen Corporation.
Composition of the Nomination BoardIn accordance with the decision taken by the Annual General Meeting of Suominen Corporation, the representatives notified by the company’s three largest shareholders have been elected to Suominen Corporation’s permanent Nomination Board. The shareholders entitled to appoint members to the Nomination Committee were determined on the basis of the registered holdings in the company’s shareholders’ register on 1 September 2015.
The representatives appointed to the Nomination Board are Thomas Ahlström, member of the Board of Directors of Ahlström Capital and Managing Director of Antti Ahlström Perilliset Oy; representing AC Invest Two B.V., Mikko Mursula, Chief Investment Officer of Ilmarinen Mutual Pension Insurance Company; and Reima Rytsölä, Executive Vice-President, Investments of Varma Mutual Pension Insurance Company. Jorma Eloranta, Chair of Suominen’s Board of Directors, serves as the fourth member of the Nomination Board.
The Nomination Board shall submit its proposals to the Board of Directors no later than 1 February prior to the Annual General Meeting.
Annual General MeetingThe Annual General Meeting (AGM) of Suominen Corporation was held on 19 March 2015. The AGM decided that no dividend will be paid for the financial year 2014, but a distribution of funds EUR 0.01 per share, will be paid from the reserve for invested unrestricted equity.
The AGM adopted the financial statements and the consolidated financial statements for the financial year 2014 and discharged the members of the Board of Directors and the President & CEO from liability.
The AGM confirmed the number of members of the Board of Directors to be six (6). The AGM re-elected Mr. Risto Anttonen, Mr. Jorma Eloranta, Mr. Hannu Kasurinen and Ms. Jaana Tuominen as members of the Board of Directors, and elected Ms. Laura Raitio and Mr. Andreas Ahlström
Report by the Board of Directors
58 / 127
Suominen Corporation Annual Report 2015

Suominen in brief / How we create value / Year 2015 / Business / Sustainability / Governance / Financial Statements
At the end of the reporting period, 31 December 2015, the members of Suominen’s Corporate Executive Team were: Nina Kopola, President & CEO, Chair of the Corporate Executive TeamTapio Engström, Senior Vice President, CFO Lynda A. Kelly, Senior Vice President, Care business areaLarry Kinn, Senior Vice President, Operations AmericasErnesto Levy, Senior Vice President, Convenience business areaMimoun Saïm, Senior Vice President, Operations EMEAHannu Sivula, Senior Vice President, Human Resources
Business risks and uncertaintiesThe estimate on the development of Suominen’s net sales is partially based on forecasts and delivery plans received from the company’s customers. Changes in these forecasts and plans, resulting from changes in the market conditions or in customers’ inventory levels, may affect Suominen’s net sales. Due to the continued uncertainty in the general economic situation and the cautious consumer purchasing habits, the forecasts include uncertainty.
The relevance of the United States in Suominen’s business operations increases the significance of the exchange rate risk related to USD in the Group’s total exchange risk position. Suominen hedges this foreign exchange position in accordance with its hedging policy.
The risks that are characteristic to South American region, including significant changes in business environment or exchange rates, could have an impact on Suominen’s operations in Brazil.
Suominen has numerous regional, national or international competitors in its different product groups. There is currently oversupply in several product groups especially in Europe. Products based on new technologies and imported from countries of lower production costs may reduce Suominen’s competitive edge. If Suominen is not able to compete with an attractive product offering, it may lose some of its market share. Competition may lead to increased pricing pressure on the company’s products.
Suominen’s customer base is fairly concentrated, which adds to the customer-specific risk. This may affect Suominen’s result if customers’ purchasing habits become more cautious as a result of a changes in consumption, or as a result of losing sales. The Group’s ten largest customers currently account for 65% (61%) of the Group net sales. Long-term contracts are preferred with the largest customers. In practice, the customer relationships are long-term and last for several years. Customer-related credit risks are managed in accordance with a risk policy approved by the Board of Directors. Credit limits are confirmed for customers on the basis of credit ratings and customer history.
legislation or misinterpretations, and materialization of the risks could result in increased payments or sanctions by the tax authorities, which in turn could lead to financial loss. Deferred tax assets included in the statement of financial position require that the deferred tax assets can be recovered against the future taxable income.
The Group is exposed to several financial risks, such as foreign exchange, interest rate, counterparty, liquidity, credit and commodity risks. The Group’s financial risks are managed in line with a policy confirmed by the Board of Directors. The financial risks are described in Note 3 of the consolidated financial statements.
Suominen performs goodwill impairment testing annually. In impairment testing the recoverable amounts are determined as the value in use, which comprises of the discounted projected future cash flows. Actual cash flows can differ from the discounted projected future cash flows. Uncertainties related to the projected future cash flows include, among others, the long economic useful life of the assets, changes in the forecast sales prices of Suominen’s products, production costs as well as discount rates used in testing. Due to the uncertainty inherent in the future, it is possible that Suominen’s recoverable amounts will be insufficient to cover the carrying amounts of assets, particularly goodwill. If this happens, it will be necessary to recognize an impairment loss, which, when implemented, will weaken the result and equity. Goodwill impairment testing has been described in Note 5 of the consolidated financial statements.
Business environmentSuominen’s nonwovens are, for the most part, used in daily consumer goods, such as wet wipes as well as hygiene and medical products. In these target markets of Suominen, the general economic situation determines the development of consumer demand, even though the demand for consumer goods is not very cyclical in nature. North America and Europe are the largest market areas for Suominen. Moreover, Suominen gained a foothold in the growing South American markets through an acquisition in February 2014.
Suominen assesses the trend in the demand for its products on the basis of both the general market situation and, above all, on the basis of the framework agreements drawn up with its customers. Suominen estimates that in 2016, the growth in the demand in its target markets will, on average, continue at the pace of 2015.
Suominen also uses export credit guarantees and to a limited extent, credit insurances against customer credit risks.
Suominen purchases significant amounts of pulp- and oil-based raw materials annually. Raw materials are the largest cost item for operations. Rapid changes in the global market prices of raw materials have an impact on the company’s profitability, as Suominen’s stocks equal to two to four weeks consumption and passing on price changes of these raw materials to the prices Suominen charges from its contract customers takes between two to five months.
Extended interruptions in the supply of Suominen’s main raw materials could disrupt production and have a negative impact on the Group’s overall business operations. As Suominen sources its raw materials from a number of major international suppliers, significant interruptions are unlikely.
There could be a risk of Suominen’s business operations being interrupted due to abrupt and unforeseen events, such as power outages or fire and water damage. Suominen may not be able to control these events through predictive actions, which could lead to interruptions in business. Risks of this type are insured in order to guarantee the continuity of operations. As Suominen has valid damage and business interruption insurances, it is expected that the damage would be compensated and the financial losses caused by the interruption of business would be covered.
Suominen uses certain technologies in its production. In the management’s view, the chosen technologies are competitive and there is no need to make major investments in new technologies. However, it cannot be excluded that the company’s technology choices could prove wrong, and the development of new or substitute technologies would then require investments.
Suominen aims to protect its business against product liability risks through the use of systematic quality assurance processes and product liability insurance. R&D function of the company is responsible for ensuring the underlying safety of the Group s products during their development. Continuous quality control is designed to guarantee product quality during production. Management considers it unlikely that the Group will face significant product liability related claims, and is unaware of any such claims.
Suominen is subject to corporate income taxes in numerous jurisdictions. Significant judgment is required to determine the total amount of corporate income tax at Group level. There are many transactions and calculations that leave room for uncertainty as to the final amount of the income tax. Tax risks relate also to changes in tax rates or tax
Report by the Board of Directors
59 / 127
Suominen Corporation Annual Report 2015

Suominen in brief / How we create value / Year 2015 / Business / Sustainability / Governance / Financial Statements
The separate financial statements of Suominen Corporation have been prepared according to the Finnish Accounting Act, the Accounting Decree and other laws and regulations relating to financial statements (FAS). The consolidated financial statements of Suominen group have been prepared in compliance with the International Financial Reporting Standards (IFRS).
Net sales of Suominen Corporation were EUR 15.3 (15.5) million and operating profit/loss EUR 1.4 (-23.5) million. Net financial expenses were EUR +9.3 (+13.9) million. Profit/loss for the period was EUR 10.0 (-9.6) million. There are no related party loans except loans to other Suominen group companies.
In financial year 2015, the parent company had on average 27 (24) employees and at the end of the year 27 (22) employees.
The parent company has a French branch office, address Suominen Corporation, 101, rue Concordet, 38090 Vaulx-Milieu, reg. number 790118079. Flexmer Oy, a subsidiary where Suominen Corporation had a 100% shareholding, was merged with the parent company on 31 December 2015.
Outlook for 2016
Suominen expects that for the full year 2016, its net sales and operating profit excluding non-recurring items will improve from year 2015. In 2015, Suominen’s net sales amounted to EUR 444.0 million and operating profit excluding non-recurring items to EUR 31.2 million. The non-recurring items are explained in the note 29 of the Financial Statements.
Key ratios of the parent company
EUR thousand 2015 2014 2013
Net sales 15,299 15,494 15,208
Operating profit/loss 1,356 -23,500 -16,075
% of net sales 8.9 -151.7 -105.7
Net financial expenses 9,268 13,883 10,699
Profit/loss before income taxes 10,129 -9,589 -5,342
Return on invested capital, % 3.8 -8.5 -4.5
Salaries 3,921 3,389 3,766
Average number of personnel 27 24 22
Proposal on distribution of dividend
The profit for the financial year 2015 of Suominen Corporation, the parent company of Suominen Group, was EUR 9,989,524. The funds distributable as dividends, including the profit for the period of the parent company were EUR 9,948,267 and total distributable funds were EUR 79,600,339. There have been no significant changes in the company’s financial position after the end of the review period.
The Board of Directors proposes that a dividend of EUR 0.02 per share shall be distributed for the financial year that ended on 31 December 2015 and that the rest of the profit shall be transferred to retained earnings. On 29 January 2016 the company had 251,511,730 issued shares, excluding treasury shares. With this number of shares, the total amount of dividends to be distributed would be EUR 5,030,234.60. The record date is 18 March 2016 and the dividend will be paid on 31 March 2016.
The Corporate Governance Statement 2015 of Suominen Corporation has been disclosed as a separate statement at www.suominen.fi > Investors > Corporate Governance. Also the Remuneration Statement of Suominen has been disclosed and can be retrieved from the same address. Both statements are included also in the company’s Annual Report 2015.
SUOMINEN CORPORATIONBoard of Directors
Information on the separate financial statements of the parent company
Report by the Board of Directors
60 / 127
Suominen Corporation Annual Report 2015

Suominen in brief / How we create value / Year 2015 / Business / Sustainability / Governance / Financial Statements
Financial Statements1 January–31 December 2015
Consolidated financial statements (IFRS)
ContentsConsolidated financial statements (IFRS)
Consolidated statement of financial position .................................................. 62Consolidated statement of profit or loss .......................................................... 63Consolidated statement of other comprehensive income ......................... 64Consolidated statement of changes in equity ................................................ 65Consolidated statement of cash flows .............................................................. 66
Notes to the consolidated financial statements .............................. 67Summary of significant accounting policies - consolidated financial statements .................................................................. 67Critical accounting estimates and judgements ............................................... 69Financial risk management ................................................................................... 70Management of capital .......................................................................................... 75Goodwill .................................................................................................................... 76Intangible assets ...................................................................................................... 76Property, plant and equipment ............................................................................ 78Group companies ................................................................................................... 80Inventories ................................................................................................................. 80Available-for-sale assets ......................................................................................... 81Receivables ............................................................................................................... 81Financial assets ....................................................................................................... 82Fair value hierachy .................................................................................................. 84Other comprehensive income ............................................................................ 85Information on Suominen share ......................................................................... 86Hybrid bond .............................................................................................................. 89Interest-bearing liabilities ....................................................................................... 90Classification of financial liabilities ...................................................................... 92Derivative instruments ........................................................................................... 93
Defined benefit plans ............................................................................................. 95Provisions .................................................................................................................. 96Trade payables and other liabilities ..................................................................... 96Entity-wide disclosures .......................................................................................... 96Other operating income and expenses ............................................................ 97Fees paid to auditors .............................................................................................. 97Employee benefits .................................................................................................. 98Depreciation, amortization and impairment of assets .................................. 99Financial income and expenses .......................................................................... 100Non-recurring items ............................................................................................... 100Income taxes ............................................................................................................ 101Discontinued operations ...................................................................................... 104Business combinations .......................................................................................... 104Share-based payments ......................................................................................... 105Earnings per share ................................................................................................... 107Adjustments to statement of cash flows .......................................................... 108Related parties .......................................................................................................... 108Contingent liabilities ............................................................................................... 110Key ratios ................................................................................................................... 111Definition of key ratios ........................................................................................... 113
Parent company financial statements (FAS) ...................................... 114Income statement ................................................................................................... 114Balance sheet ........................................................................................................... 115Cash flow statement .............................................................................................. 116Notes .......................................................................................................................... 117
61 / 127
Suominen Corporation Annual Report 2015

Suominen in brief / How we create value / Year 2015 / Business / Sustainability / Governance / Financial Statements
Consolidated statement of financial positionEUR thousand
Note31 December
201531 December
2014
ASSETS
Non-current assets
Goodwill 5 15,496 15,496
Intangible assets 6 13,275 12,510
Property, plant and equipment 7 97,931 88,721
Loan receivables 11 7,793 8,202
Available-for-sale assets 10 777 1,124
Held-to-maturity assets 12 − 450
Other non-current receivables 11 2,402 2,614
Deferred tax assets 30 4,491 5,516
Total non-current assets 142,165 134,633
Current assets
Inventories 9 32,557 32,380
Trade receivables 11 51,547 52,269
Loan receivables 11 1,000 600
Other current receivables 11 7,038 4,618
Assets for current tax 30 1,874 1,682
Cash and cash equivalents 55,570 38,430
Total current assets 149,585 129,979
TOTAL ASSETS 291,750 264,611
EUR thousand Note31 December
201531 December
2014
EQUITY AND LIABILITIES
Equity
Share capital 15 11,860 11,860
Share premium account 24,681 24,681
Reserve for invested unrestricted equity 69,652 97,192
Treasury shares -44 -44
Fair value and other reserves -118 96
Exchange differences 14 5,097 3,419
Retained earnings -3,076 -46,890
Total equity attributable to owners of the parent 108,052 90,313
Hybrid bond 16 17,664 18,424
Total equity 125,716 108,737
Liabilities
Non-current liabilities
Deferred tax liabilities 30 10,890 8,789
Liabilities from defined benefit plans 20 1,105 1,151
Other non-current liabilities 22 651 578
Debentures 17 75,000 75,000
Other non-current interest-bearing liabilities 17 18,498 6,667
Total non-current liabilities 106,144 92,185
Current liabilities
Current interest-bearing liabilities 17 3,363 3,347
Liabilities for current tax 30 47 246
Trade payables and other current liabilities 22 56,479 60,096
Total current liabilities 59,889 63,689
Total liabilities 166,034 155,874
TOTAL EQUITY AND LIABILITIES 291,750 264,611
Consolidated financial statements (IFRS)
62 / 127
Suominen Corporation Annual Report 2015

Suominen in brief / How we create value / Year 2015 / Business / Sustainability / Governance / Financial Statements
Consolidated statement of profit or lossEUR thousand
Note
1 January - 31 December 2015
1 January - 31 December 2014
Net sales 23 444,042 401,762
Cost of goods sold -386,042 -352,091
Gross profit 58,000 49,671
Other operating income 24 2,637 2,655
Sales and marketing expenses -7,760 -6,278
Research and development -3,527 -2,877
Administration expenses -16,709 -15,418
Other operating expenses 24 -862 -1,857
Operating profit 31,778 25,897
Net financial expenses 28 -5,302 -8,075
Profit before income taxes 26,476 17,822
Income taxes 30 -9,456 -7,645
Profit for the period from continuing operations 17,020 10,177
Discontinued operations
Profit for the period − 717
Impairment losses and costs to sell − -5,921
Loss for the period from discontinued operations, total 31 − -5,204
Profit for the period 17,020 4,973
Earnings per share, EUR
Continuing operations 0.06 0.04
Discontinued operations − -0.02
Total basic 0.06 0.02
Total diluted 0.06 0.02
Consolidated financial statements (IFRS)
63 / 127
Suominen Corporation Annual Report 2015

Suominen in brief / How we create value / Year 2015 / Business / Sustainability / Governance / Financial Statements
Consolidated statement of comprehensive incomeEUR thousand
1 January - 31 December 2015
1 January - 31 December 2014
Profit for the period 17,020 4,973
Other comprehensive income:
Other comprehensive income that will be subsequently reclassified to profit or loss:
Exchange differences 2,356 6,863
Fair value changes of cash flow hedges and available-for-sale assets -970 81
Reclassified to profit or loss 669 1,287
Reclassified to property, plant and equipment 91 −
Other reclassifications − 3
Income taxes related to other comprehensive income -632 -700
Total 1,514 7,534
Other comprehensive income that will not be subsequently reclassified to profit or loss:
Remeasurements of defined benefit plans -26 -150
Income taxes related to other comprehensive income 8 50
Total -18 -100
Total other comprehensive income 1,496 7,434
Total comprehensive income for the period 18,516 12,407
Attributable to:
Continuing operations 18,516 17,612
Discontinued operations − -5,205
Total comprehensive income for the period 18,516 12,407
Consolidated financial statements (IFRS)
64 / 127
Suominen Corporation Annual Report 2015

Suominen in brief / How we create value / Year 2015 / Business / Sustainability / Governance / Financial Statements
Consolidated statement of changes in equityEUR thousand
NoteShare
capital
Share premium account
Reserve for invested unrestricted
equityTreasury
sharesExchange
differences
Fair value and other
reservesRetained earnings Total
Hybrid bond
Total equity
Equity 1 January 2015 11,860 24,681 97,192 -44 3,419 96 -46,890 90,313 18,424 108,737
Profit for the period − − − − − − 17,020 17,020 − 17,020
Other comprehensive income 14 − − − − 1,730 -216 -18 1,496 − 1,496
Total comprehensive income − − − − 1,730 -216 17,002 18,516 − 18,516
Share-based payments − − − − − − 316 316 − 316
Share issue − − 340 − − − − 340 − 340
Distribution of funds − − -2,504 − − − − -2,504 − -2,504
Reversal of undistributed dividends − − − − − − 2 2 − 2
Conveyance of treasury shares − − 80 − − − − 80 − 80
Reclassifications − − -27,448 − -51 − 27,499 − − −
Conversion of hybrid bond − − 1,992 − − − − 1,992 -1,992 −
Hybrid bond − − − − − − -1,004 -1,004 1,232 228
Equity 31 December 2015 11,860 24,681 69,652 -44 5,097 -118 -3,076 108,052 17,664 125,716
NoteShare
capital
Share premium account
Reserve for invested unrestricted
equityTreasury
sharesExchange
differences
Fair value and other
reservesRetained earnings Total
Hybrid bond
Total equity
Equity 1 January 2014 11,860 24,681 97,123 -44 -3,021 -999 -51,094 78,506 − 78,506
Profit for the period − − − − − − 4,973 4,973 − 4,973
Other comprehensive income 14 − − − − 6,440 1,094 - 100 7,434 − 7,434
Total comprehensive income − − − − 6,440 1,094 4,873 12,407 − 12,407
Share-based payments − − − − − − 70 70 − 70
Conveyance of treasury shares − − 69 − − − − 69 − 69
Hybrid bond − − − − − − -739 -739 18,424 17,685
Equity 31 December 2014 11,860 24,681 97,192 -44 3,419 96 -46,890 90,313 18,424 108,737
Consolidated financial statements (IFRS)
65 / 127
Suominen Corporation Annual Report 2015

Suominen in brief / How we create value / Year 2015 / Business / Sustainability / Governance / Financial Statements
Consolidated statement of cash flowsEUR thousand
1 January - 31 December 2015
1 January - 31 December 2014
Cash flow from operations
Profit for the period 17,020 4,973
Total adjustments to profit for the period 32,870 39,953
Cash flow before changes in net working capital 49,890 44,927
Change in net working capital -7,921 6,140
Financial items -6,425 -6,514
Income taxes -8,269 -7,434
Cash flow from operations 27,274 37,119
Cash flow from investments
Investments in property, plant and equipment and intangible assets -22,369 -7,740
Investments in acquired businesses − -19,261
Cash flow from disposed businesses 167 4,736
Sales proceeds from property, plant and equipment and intangible assets 10 59
Cash flow from investments -22,192 -22,206
Cash flow from financing
Drawdown of hybrid bond − 17,500
Drawdown of debenture bond − 75,000
Drawdown of other non-current interest-bearing liabilities 15,000 10,000
Repayment of other non-current interest-bearing liabilities -3,333 -78,220
Changes in current interest-bearing liabilities -14 -18,324
Changes in loan receivables 600 −
Share issue 340 −
Distribution of funds -2,504 −
Cash flow from financing 10,089 5,956
Change in cash and cash equivalents 15,171 20,869
Cash and cash equivalents at the beginning of the period 38,430 18,585
Effect of changes in exchange rates 1,968 -1,025
Change in cash and cash equivalents 15,171 20,869
Cash and cash equivalents at the end of the period 55,570 38,430
Cash flow in 2014 includes also discontinued operations.
Consolidated financial statements (IFRS)
66 / 127
Suominen Corporation Annual Report 2015

Suominen in brief / How we create value / Year 2015 / Business / Sustainability / Governance / Financial Statements
Notes to the consolidated financial statements (IFRS)
1. SUMMARY OF SIGNIFICANT ACCOUNTING POLICIES - CONSOLIDATED FINANCIAL STATEMENTS
Basic informationSuominen Corporation is a public limited liability company organized under the laws of the Republic of Finland and domiciled in Helsinki, Finland (Itämerentori 2, 00180 Helsinki, Finland). Suominen’s shares are publicly traded in the Nasdaq Helsinki Ltd. Mid Cap (Small Cap until 31 December 2015) in Helsinki, Finland. Suominen Corporation is the parent of the Group. The Group manufactures nonwovens mainly for consumer goods companies.
The Board of Directors of Suominen Corporation has in its meeting on 29 January 2016, approved these financial statements to be published. According to the Finnish Companies Act, the shareholders have a possibility to approve or reject or make a decision on altering the financial statements in a General Meeting to be held after the publication of the financial statements.
Basis for presentationThe consolidated financial statements of Suominen Group are prepared in accordance with International Financial Reporting Standards (IFRS), including International Accounting Standards (IAS) and Interpretations issued by the International Financial Reporting Interpretations Committee (SIC and IFRIC). International Financial Reporting Standards are standards and their interpretations adopted in accordance with the procedure laid down in regulation (EC) No 1606/2002 of the European Parliament and of the Council. The Notes to the Financial Statements are also in accordance with the Finnish Accounting Act and Ordinance and the Finnish Companies Act.
The consolidated financial statements include the financial statements of Suominen Corporation and its subsidiaries. The functional and reporting currency of the parent is euro, which is also the reporting currency of the consolidated financial statements. Functional currencies of subsidiaries are determined by the primary economic environment in which they operate.
The financial year of Suominen Group as well as of the parent and subsidiaries is the calendar year ending 31 December.
The financial statements have been prepared under the historical cost convention except as disclosed in the accounting policies.
The figures in Suominen’s consolidated financial statements are mainly presented in EUR thousands. Due to rounding differences the figures presented in tables do not necessarily add up to the totals of the tables.
New accounting standardsSuominen has applied the following new or revised or amended standards and interpretations from 1 January 2015:
Amendment to IAS 19 Employee Benefits. The amendment clarified the recognition of the contributions employees or third parties are requested to make to a defined benefit plan. The revised standard did not have any impact on the consolidated financial statements
Annual Improvements 2010–2012 and 2011–2013. The impacts of the standards vary but are not material for Suominen’s consolidated financial statements.
New and amended IFRS standards and IFRIC interpretations published but mandatory in 2016 or later:
Annual Improvements 2012-2014, effective for reporting periods beginning on 1 January 2016 or later. The impacts of the standards vary but are not material for Suominen’s consolidated financial statements.
Amendments to IAS 1 Presentation of Financial Statements clarify, among other things, the materiality requirements of IAS 1. The amendments are effective for the reporting periods beginning on 1 January 2016 or later, and they can decrease immaterial disclosure information in the consolidated financial statements.
IFRS 15 Revenue from Contracts with Customers, to be applied for the reporting periods beginning on 1 January 2018 or later. The new standard defines a five-step model to recognize revenue based on
contracts with customers and replaces the current standards IAS 18 and IAS 11 as well as their interpretations. The timing of the revenue recognition can vary depending on the transfer of control. Suominen estimates that the new standard has no material effect on revenue recognition, but it increases the disclosure information.
IFRS 9 Financial Instruments and its amendments, to be applied for the reporting period beginning on 1 January 2018 or later. The new standard replaces IAS 39 Financial Instruments: Recognition and Measurement. IFRS 9 changes the classification and measurement of financial assets and includes a new model for assessing the impairment of the financial assets based on expected credit losses. The classification and measurement of financial liabilities do not materially change from IAS 39. Hedge accounting can be applied to a larger number of risk exposures than before and hedge accounting principles have been harmonized with those used in risk management. Management is currently assessing the impact of these changes on the consolidated financial statements.
IFRS 16 Leases was issued in January 2016 and will be effective for the reporting periods beginning on 1 January 2019 or later. In accordance with the new standard, the lessee will recognize assets and liabilities for the rights and obligations created by leases. The evaluation of the effects of the new standard will be initiated in 2016, but the new standard will increase liabilities and property, plant and equipment as well as intangible assets in the consolidated financial statements.
Other new or amended standards or interpretations applicable from 1 January 2016 or later are not material for Suominen Group.
Consolidation principlesThe consolidated financial statements include the parent and its subsidiaries. Subsidiaries are companies in which the parent has, based on its holding, more than half of the voting rights directly or via its subsidiaries or over which it otherwise has control. The Group has control on an entity when it has a participation in the entity and is exposed to or has right to its variable revenues and can influence the revenues by using its control over the entity.
Consolidated financial statements (IFRS)
67 / 127
Suominen Corporation Annual Report 2015

Suominen in brief / How we create value / Year 2015 / Business / Sustainability / Governance / Financial Statements
recorded as adjustments of costs of goods sold. Foreign exchange gains and losses arising from financial items are recorded as financial income and expenses.
Reportable segmentsAs from July 2014 Suominen has no reportable segments. Until July 2014 the Group had two reportable segments, Nonwovens and Flexibles. Flexibles business was sold in July 2014 and is reported as discontinued operations. Before the disposal it was a reportable segment. The segmentation was based on the organizational structure and management reporting. The risk and profitability of the products and customers of the different reporting segments were not similar thus they were reported separately.
Since July 2014 the business of Suominen has consisted of one operating segment, Nonwovens. The net sales of Suominen consists entirely of net sales of the Nonwovens operating segment. All the products Suominen produces and sells are nonwoven products, and the production process and technology of all the products are similar, as they are produced using the same production lines. Also other resources, such as raw materials and production management, are common to all products. The customers are mainly converters of nonwovens, and the risks or profitability related to products or customers do not differ from each other. Also distribution of the products is similar.
The sales organization of Suominen is organized not only geographically but also as Convenience and Care business areas based on customers or end products of the customers. Account management of major customers (“Global Accounts”) is, however, centralized and independent of the business areas. Suominen reports net sales not only by business areas but also by geographical areas.
As the resources are not dedicated to Convenience or Care business areas, the allocation of production capacity or other resources either to Convenience or Care products depends at each moment of the orders received and unutilized production capacity.
The chief operating decision maker of Suominen is the President & CEO, who is assisted by the Corporate Executive Team. The President & CEO makes decisions on allocating the resources of the Group. However, material items, such as major investments, as well as items which are required by governing law to be decided by the Board of Directors, are presented to the Board for approval.
Entity-wide disclosures are presented in Note 23.
Revenue recognitionNet sales include the total invoicing value of products less sales tax, discounts and rebates. Foreign exchange differences arising from trade receivables are recognized as sales adjustments.
Revenue is recognized after the risks and rewards of ownership of the goods have been transferred to the buyer. Normally, revenue recognition takes place at the date of the delivery in accordance with the delivery terms.
Research and developmentExpenditure on research and development is recognized in profit or loss. Expenditure on product and process development is not capitalized as no separate assets are developed in the research and development activities or future economic benefits arising from the assets cannot be reliably assessed.
Accounting for leasesSuominen Group has entered into various operating leases, the payments under which are treated as rentals and charged to profit or loss over the lease term.
Leases of property, plant and equipment where Suominen has substantially all the rewards and risks of ownership, are classified as finance leases. Finance leases are capitalized at the inception of the lease at the lower of the fair value of the leased asset or the present value of the minimum lease payments. Lease payments are allocated between liability and finance charges. The lease liabilities net of finance charges are included in interest-bearing liabilities with the interest element charged to profit or loss over the lease period.
Property, plant and equipment acquired under finance lease contracts are depreciated over the shorter of the useful life of the asset or the lease period.
IFRIC 4 Determining Whether an Arrangement Contains a Lease is applied to such agreements, which are not leases in legal form, but which in substance convey the right to use an asset for an agreed period of time in return for a payment. If an arrangement or part of it is determined to be a lease, it or part of it is classified as finance or operating lease and accounted for under the guidance in IAS 17 Leases.
The long-term contract covering process heat sourced from a power plant adjacent to Suominen’s production unit in Finland has been classified as an operating lease, as a major part of the thermal energy generated by the power plant is supplied to third parties. Long-term
Divested subsidiaries are included in the consolidated financial statements until the control is lost, and companies acquired during the reporting period are included from the date when the control has been transferred to Suominen. Acquisitions of subsidiaries are accounted for under the purchase method under which the purchase consideration is allocated to the acquired identifiable assets and liabilities assumed and the residual is recognized as goodwill. Identifiable assets and assumed liabilities acquired at business combinations are recognized at fair value at the date of acquisition. The transaction costs related to a business combination are recognized in profit or loss.
All intra-group transactions are eliminated as part of the consolidation process. Unrealized losses are eliminated only to the extent that there is no evidence of impairment.
Foreign subsidiariesIn the consolidated financial statements, the statements of profit or loss, statements of comprehensive income and statements of cash flows of foreign subsidiaries have been translated into euros using the average exchange rates of the reporting period and the statements of financial positions have been translated using the closing exchange rates at the end of the reporting period.
The exchange difference arising from translating the statements of profit or loss, statements of comprehensive income and statements of financial position using the different exchange rates is recognized as other comprehensive income and included in equity as cumulative exchange difference. Exchange differences arising from the translation of the net investments in foreign subsidiaries in non-euro area are also recognized in other comprehensive income and included in equity as cumulative exchange difference (Note 14).
On the disposal of all or part of a foreign subsidiary, the cumulative amount or proportionate share of the exchange difference is reclassified from equity to profit or loss as a reclassification item in the same period in which the gain or loss on disposal is recognized.
Transactions in foreign currenciesIn their own day-to-day accounting the Group companies translate transactions in foreign currencies into their own reporting or functional currency at the exchange rates prevailing on the dates of the transactions. At the end of the reporting period, the unsettled balances of foreign currency transactions are measured at the exchange rates prevailing at the end of the reporting period. Foreign exchange gains and losses arising from trade receivables are entered as adjustments of net sales and foreign exchange gains and losses related to trade payables are
Consolidated financial statements (IFRS)
68 / 127
Suominen Corporation Annual Report 2015

Suominen in brief / How we create value / Year 2015 / Business / Sustainability / Governance / Financial Statements
2. CRITICAL ACCOUNTING ESTIMATES AND JUDGEMENTS
The preparation of financial statements in conformity with IFRS requires management to make estimates and assumptions that affect the reported amounts of assets and liabilities, the disclosure of contingent assets and liabilities at the end of the reporting period and the recognized amounts of revenues and expenses during the reporting period. Actual results may differ from these estimates.
The following items include critical accounting estimates: impairment testing of assets, especially of goodwill; estimated fair values of property, plant and equipment and intangible assets acquired in an acquisition and their estimated useful lives; useful lives of other intangible assets and property, plant and equipment; measurement of inventories and trade and loan receivables; recognition and measurement of deferred taxes and estimates of the amount and probability of provisions.
Estimates and judgements are continually evaluated and are based on historical experience and other factors, including expectations of future events, that are believed to be reasonable under the circumstances.
GoodwillGoodwill is tested annually for possible impairment. The recoverable amounts have been determined based on the assets’ value in use which require the use of estimates. The actual cash flows can differ from estimated discounted future cash flows. Uncertainties related to the projected future cash flows include, among others, the long economic useful lives of the assets, the estimated sales prices, production costs and changes in discount rate used in testing. At the end of the reporting period, the carrying amount of goodwill was EUR 15.5 (15.5) million.
Property, plant and equipment and intangible assetsIf there is indication of impairment, the carrying amounts of property, plant and equipment and intangible assets are compared with their recoverable amounts. The recoverable amount is the higher of fair value and value in use. Value in use is calculated by discounting the future cash flows arising from the the asset. If the recoverable amount of an asset is lower than the carrying amount, an impairment loss is recognized. Both the amounts and timing of the cash flows are based on management estimates.
Useful lives of intangible assets and property, plant and equipment are based on management’s best estimate of the period the asset is expected to be available for use by Suominen. The actual useful life can, however, differ from the expected useful life resulting in adjustment of annual depreciation or amortization of the asset or in recognizing of an impairment loss.
leasing contracts on premises are classified as operating leases as the risks and benefits related to ownership have not been transferred to the lessee and Suominen has no major obligations at the end of the lease period.
Rental income is recognized in accordance with the lease agreement during the lease period.
Government grantsGovernment or other grants are recognized in profit or loss in the same periods in which the corresponding expenses are incurred. The grants received are recognized as offsetting items of the expenses incurred. Government grants received to acquire property, plant and equipment or other assets are deducted from the acquisition cost of the assets in question.
Non-recurring items, effect on key ratiosNon-recurring items are presented in Note 29 of the consolidated financial statements.
Certain financial performance indicators used by Suominen are reported excluding non-recurring items. These indicators are applied in the consolidated financial statements to eliminate the profit or loss impact of certain significant transactions which are unusual or infrequent in nature, like impairment losses of assets, significant gains or losses from the sales of property, plant and equipment or intangible assets and restructuring costs. Any key ratio excluding non-recurring items is a non-IFRS key ratio.
Dividends and other distribution of fundsDividends or other distribution of funds proposed by the Board of Directors are not recognized in the financial statements until they have been approved by the shareholders at the Annual General Meeting.
AuditQuarterly information as well as interim reports are not audited.
Other accounting principlesAccounting principles related to assets, liabilities and line items in the statement of profit or loss are presented in the disclosure information related to each item.
Income taxesRecognition and measurement of deferred tax liabilities and assets include management estimates, especially deferred tax assets arising from confirmed tax losses of group companies or from other temporary differences. Deferred tax assets are recognized for deductible temporary differences and tax losses to the extent that it is probable that taxable profit will be available against which tax credits and deductible temporary differences can be utilized. All tax liabilities and assets are reviewed at the end of the reporting period and changes are recognized in comprehensive income. At the end of the reporting period, the carrying amount of deferred tax assets was EUR 4.5 (5.5) million and the carrying amount of deferred tax liabilities EUR 10.9 (8.8) million.
The Group recognizes income tax liabilities for anticipated tax audit issues based on estimates of the outcome of the tax audit.
Provisions and contingent liabilitiesIf the management has assessed that as a result of a past event Suominen has a legal or constructive obligation, and that it is probable, that an outflow of resources will be required to settle the obligation, the management has estimated the amount of provision recognized from the obligation. The amount of the provision is the management’s best estimate of the amount required to settle the obligation at the end of the reporting period.
A contingent liability is a possible obligation which is not recognized as a liability in the statement of financial position as, for example, its existence is not yet confirmed and is not in control of the company. The management uses estimates to assess the amount of contingent liabilities disclosed as contingent liabilities.
Inventories and trade and loan receivablesMeasurement of inventories and trade and loan receivables includes some management estimates. Inventories are measured at lower of cost and net realizable value. Net realizable value is the estimated selling price in the ordinary course of business less the estimated costs of completion and the estimated costs necessary to make the sale. Net realizable value is used in testing the recoverable amount of inventories in order to avoid the inventories being carried in excess of the amount expected to be realized from their sale or use. If management estimates that carrying amount of a trade or loan receivable exceeds its fair value, an impairment loss is recognized. For example payment defaults or late payments are considered as indications of impairment of the receivable. The carrying amount of inventory was at the end of the reporting period EUR 32.6 (32.4) million, the carrying amount of trade receivables was EUR 51.5 (52.3) million and the carrying amount of loan receivables was EUR 8.8 (8.8) million.
Consolidated financial statements (IFRS)
69 / 127
Suominen Corporation Annual Report 2015

Suominen in brief / How we create value / Year 2015 / Business / Sustainability / Governance / Financial Statements
3. FINANCIAL RISK MANAGEMENT Suominen Corporation is exposed to customary financial risks relating to its global businesses such as foreign exchange and interest rate risks, counterparty risk, funding and liquidity risks, credit risk and commodity risk. The treasury policy approved by Suominen Corporation’s Board of Directors defines the authorities, responsibilities and principles to be followed in the Group. Financial risk management is centralized within Suominen Group Treasury which acts as an in-house bank providing financial services for subsidiaries within the Group. Financial risk management is governed by the Treasury Policy. The policy includes principles and risk limits relating to debt structure, counterparties, bank relations and interest rate and foreign exchange risk management.
In accordance with the treasury policy the President & CEO approves all major funding operations and the main principles to be followed when hedging financial risks. The CFO is responsible for ensuring that the policy is observed throughout the Group, and for individual financial operations concerning funding, managing liquidity and financial risks.
Foreign exchange riskSuominen Group operates internationally and is therefore exposed to transaction and translation risks arising from fluctuations in foreign exchange rates which may have an effect on profit or loss and financial position. Transaction risks arise from cash flows generated by purchase and sales activities while translation risks arise from converting items in the statements of profit or loss and the statements of financial position of non-euro subsidiaries as well as other currency-denominated assets and liabilities into the Group’s functional currency euro. The aim of the Group’s foreign exchange risk management is to hedge earnings from operations and to avoid exchange rate volatility in cash flows, profit or loss or in financial position.
The transaction exposure above includes receivables in foreign currencies totaling to EUR 21,320 thousand (EUR 5,152 thousand) and liabilities totaling to EUR 21,100 thousand (EUR 4,447 thousand).
Transaction exposure 2015 Transaction exposure 2014
EUR thousand12 months cash flow
Hedged with currency forwards
12 months cash flow
Hedged with currency forwards
USD/EUR 1,562 -1,378 18,948 -4,118
EUR/BRL -2,176 − -3,075 0
USD/BRL -911 − 84 −
In addition to US dollar, which generates the most significant currency impacts to Suominen, also Brazilian real affects the Group’s foreign exchange risk.
The foreign exchange transaction exposure comprises of already known and estimated currency cash flows for the next 12 months. The transaction risks arise mainly from the USD transactions in the euro-area and in Brazil and from EUR transactions in Brazil. The USD risk arises from both USD business and treasury transactions. The exchange rate risk related to the Brazilian unit is hedged case by case. The exposure in BRL arose when the unit in Brazil was acquired in February 2014. In accordance with the hedging policy, the foreign currency hedging should hedge the cash flows arising from sales, purchases and interest payments in foreign currencies of the following 3 and 9 months.
Common derivative contracts are used in hedging, as their pricing can be verified on the markets. Suominen does not apply hedge accounting in currency hedging for the transaction risks. Changes in fair values of currency hedging instruments are recognized in profit or loss. Suominen has applied hedge accounting for net investment in a foreign operation, when the fair value changes of the hedging instrument, which is determined to be effective, have been recognized in other comprehensive income.
Suominen has applied hedge accounting for currency derivatives hedging foreign exchange risk arising from acquisition of property, plant and equipment. The amount arising from the foreign exchange hedge recognized in property, plant and equipment was EUR 91 thousand during the reporting period.
The consolidated transaction exposure at the end of the reporting period is presented in the table below:
Consolidated financial statements (IFRS)
70 / 127
Suominen Corporation Annual Report 2015

Suominen in brief / How we create value / Year 2015 / Business / Sustainability / Governance / Financial Statements
Granted loans consist of intra-group loans granted to the foreign subsidiaries (+). The loans granted to subsidiaries in USD are in substance equity as the repayment is not anticipated in foreseeable future. These loans amounted to USD 61.7 million, equaling to EUR 56.7 million at the end of the reporting period. The exchange differences from these loans are recognized in exchange differences in other comprehensive income as they are in substance exchange differences arising from equity. Exchange rate differences arising from both internal and external loans taken are recognized in profit or loss.
The translation exposure arising from the US dollar is hedged with external USD loans amounting to USD 23.8 million, equaling to EUR 21.8 million at the end of the reporting period. The equity of the subsidiaries in the USA was hedged with a currency derivative of USD 39.4 million in 2015 (USD 39.4 million external loan in 2014). This hedge was closed during the reporting period 2015.
Translation exposure 2015 against EUR
EUR thousand Granted loans
Cash and cash equivalents
and internal loans taken
External loans taken
Equity of foreign
subsidiaries
Hedged with currency
derivativesOpen
exposure
BRL − 3,380 − 14,791 − 18,171
USD 56,698 11,523 -21,861 66,836 − 113,196
2015
EUR thousandCurrency
strengthens %Effect on
profit after taxEffect on
equityCurrency
weakens %Effect on
profit after taxEffect on
equity
USD/EUR 12 -2,231 4,870 -12 2,231 -4,870
2014
EUR thousandCurrency
strengthens %Effect on
profit after taxEffect on
equityCurrency
weakens %Effect on
profit after taxEffect on
equity
USD/EUR 8 73 1,179 -8 -73 -1,179
Translation exposure 2014 against EUR
EUR thousand Granted loans
Cash and cash equivalents
and internal loans taken
External loans taken
Equity of foreign
subsidiaries
Hedged with currency
derivativesOpen
exposure
BRL − 3,583 − 19,887 − 23,470
USD 50,842 -2,971 − 47,134 -32,419 62,586
Correspondingly, the translation exposure at the end of the reporting period was as follows:
Sensitivity analysis of financial instruments
The international reporting standards require disclosing sensitivity analysis of financial instruments. The table below summarizes the sensitivity of financial instruments on foreign exchange risk at the end of the reporting period. In the sensitivity analysis, the financial instruments include currency forward contracts, intra-group short-term and long-term currency denominated receivables and liabilities and external currency denominated borrowings. Sensitivities of the currency rates at the end of the reporting period are estimated based on the actual volatility of the currencies over the past 12 months. The exchange rate sensitivity is calculated for the following 12 months by using the rates at the end of the reporting period. The change in the exchange rate is the change of euro rate against US dollar rate.
Consolidated financial statements (IFRS)
71 / 127
Suominen Corporation Annual Report 2015

Suominen in brief / How we create value / Year 2015 / Business / Sustainability / Governance / Financial Statements
Interest rate riskSuominen is exposed to interest rate risk when it funds its operations with euro or currency denominated debt. The risk arises from the reprising of floating rate debt and with the raising of new floating rate debt. A fixed rate debt is subject to fair value risk. The aim of interest rate risk management is to bring predictability to interest expenses by keeping the duration within the agreed limits with an optimal mix of fixed and floating rate debt. The interest rate risk associated with Suominen’s loan portfolio is diversified to ensure that the portfolio comprises both floating and fixed interest rate loans spread over a range of interest periods. Suominen’s Board of Directors has determined the interest rate structure of the loan portfolio and the range in which it can vary. The average interest duration can vary between 12 and 36 months. At the end of 2015 it was 34 months (50 months in 2014 after refinancing in autumn 2014).
At the end of the reporting period the amount of the Group’s loans with fixed interest rates was EUR 75 million (EUR 75 million) and with floating interest rates EUR 21.9 million (EUR 10 million). Fixed interest rate loans were denominated in EUR and the floating rate loans were denominated in USD. At the end or during the reporting period, the Group did not have any interest rate swaps. The interest rate structure of the loan portfolio was changed in the refinancing in autumn 2014.
The price sensitivity of electricity derivatives has been estimated based on volatility of the prices so that the probability of price changes compared to the year-end price is +/- 15 percent. The volatility has been estimated based on the past price changes and the market view embedded in the option prices.
At the end of the reporting period the cash and cash equivalents of the Group were EUR 55.6 (EUR 38.4 million). Cash and cash equivalents have not been included in the sensitivity analysis.
Electricity price riskSuominen’s operational policy on electricity procurement covers purchases of electricity of the Group’s Finnish unit and the principles to be followed in managing electricity price risks. An independent consultant is employed to assist the company in electricity purchases and related risk management. Increases in the market price of electricity are managed through the use of fixed-price contracts and electricity derivatives.
The Group’s electricity price risk exposure in Finland is reviewed on a rolling basis in three-year periods. Exposure at the end of 2015 was hedged by establishing that fixed-price electricity will account for 84 percent (93 percent) of projected usage in 2016, 56 percent (93 percent) in 2017, and 56 percent (93 percent) in 2018. Prices are hedged with OTC contracts. In accordance with these contracts Suominen pays on average EUR 38.9/MWh (41.8) for electricity in Finland in 2016.
Hedge accounting is applied in accounting for electricity derivatives. Electricity derivatives are used in order to neutralize fluctuations in the price of electricity over specific periods. Hedging must be effective both prospectively and retrospectively. The effectiveness of the hedges is documented at the beginning of hedging and tested for effectiveness during the hedging period. The effectiveness of hedging is tested based on an established regression. The changes in fair values of the effective hedging instruments are recognized in profit or loss when the hedged item is affecting profit or loss.
The sensitivity of interest rate risk is calculated based on a 0.5 percentage point shift in the interest rate curve. The table below illustrates the sensitivity of floating interest rate loans and Suominen’s result to a change of 0.5 percentage point in interest rates during a one year period:
Effectiveness and sensitivity analysis of currency hedging
The management has assessed the effectiveness of hedging by combining the estimated net cash flow for 12 months in foreign currencies with the compensating effect of the hedging instruments. The net effect from the change in exchange rates as described above on profit after taxes in 2015 is estimated to be EUR +/- 44 thousand (EUR +/- 429 thousand). Sensitivities of exchange rates at the end of the reporting period are estimated based on of the actual volatility of the currencies over the past 12 months. The exchange rate sensitivity is calculated for the following 12 months by using the currency rates at the end of the reporting period.
2015 2014
EUR thousand
Change in interest rate, percentage
points
Effect on profit after tax
Change in interest rate, percentage
points
Effect on profit after tax
Floating rate loans + /- 0.5 - /+87 + /- 0.5 - /+402015
EUR thousand
Currency strengthens / weakens %
Effect on 12 months'
currency cash flow
Effect on hedging
instrumentsNet effect
after tax
USD/EUR 12 - /+ 1,679 + /-1,748 + /-44
2015
Price change EUR / MWh
Effect on profit after tax
Effect on equity
+5 0 140
-5 0 -140
2014
Price change EUR / MWh
Effect on profit after tax
Effect on equity
+6 13 239
-6 0 -252
Credit riskThe most significant individual credit risks relate to trade receivables from international companies with high credit ratings. The largest ten trade receivables account for 53 percent of all trade receivables. The credit policy approved by the Board of Directors governs the principles to be followed when granting credit to customers and the responsibilities of the organization in this area. Credit is granted to customers after a credit approval process has been completed. The credit exposure of customers is reported at least once a month to the persons responsible for sales. Credit losses recognized in profit or loss totaled EUR 2 thousand (EUR 7 thousand) in 2015. The ageing structure of the trade receivables is disclosed in Note 12 to the consolidated financial statements. The maximum credit risk arising from trade receivables equals the carrying amount of the trade receivables. The Group has agreed on a supply chain financing program which covers one fourth of the sales at the end of the reporting period. In accordance with the supply chain financing agreement, the Group has transferred the rights and responsibilities of these receivables to the counterparty of the agreement.
In addition to trade receivables Suominen has credit risk arising from loan receivables granted in 2014 in connection with the sale of the Flexibles business unit. The collaterals securing the loan receivables are disclosed in Note 11 of the consolidated financial statements.
The Board of Directors of Suominen has approved a counterpart list of companies and financial institutions with good credit ratings. These
Consolidated financial statements (IFRS)
72 / 127
Suominen Corporation Annual Report 2015

Suominen in brief / How we create value / Year 2015 / Business / Sustainability / Governance / Financial Statements
companies are allowed counterparts in investment activities and derivative contracts. The amount which can be invested in a single counterpart is capped. Liquid funds are invested with reputable banks with sufficient credit ratings or in commercial papers offering high liquidity and credit ratings. The Group’s maximum exposure to credit risk equals to carrying amount of financial assets at the end of the reporting period.
Liquidity and refinancing risk Suominen aims to use different sources of funding. With its house banks Suominen has long and trustworthy relations and acquires advisory and other services from them. Refinancing risk is managed by diversifying loan maturities. In September 2014, Suominen signed five year EUR 55 million credit facility with Nordea Bank plc and Pohjola Bank plc and issued a EUR 75 million fixed rate bond with a loan period of five years. The bond is listed on the Nasdaq Helsinki Ltd. The average maturity of drawn loans within the committed facility agreements was 3.4 years (4.4) at the end of the reporting period. At the end of the reporting period the unused revolving credit facility was EUR 23.0 million. The credit facility is valid until September 2018.
Suominen Group Treasury has established several cash pooling structures with Group’s house banks in order to manage the liquidity of the Group.
The maturity of financial liabilities and derivatives is presented as undiscounted cash flows in the following table. The table includes both interest payments and repayments of capital.
Maturity analysis of financial liabilities 2015
EUR thousand Falling due
Financial liabilitiesCarrying amount
Contractual cash flows
Less than 6 months 6–12 months 1–2 years 2–5 years
Debentures 75,000 88,125 1,641 1,641 6,563 78,281
Loans from financial institutions 21,862 22,472 210 3,558 18,705 −
Other financial liabilities 630 630 262 − 368 −
Trade payables 44,682 44,682 44,682 − − −
Total 142,174 155,909 46,794 5,199 25,635 78,281
Falling due
Derivative instrumentsCarrying amount
Contractual cash flows
Less than 6 months 6–12 months 1–2 years 2–5 years
Currency forward contracts 297
Cash inflows 18,911 7,011 9,280 2,620 −
Cash outflows -19,334 -7,120 -9,512 -2,702 −
Electricity contracts 242
Cash outflows -243 − -197 -46 −
Total 539 -666 -109 -429 -128 −
Falling due
Contingent liabilities TotalLess than 6
months 6–12 months 1–2 years 2–5 years
Guarantees 22,621 6,310 525 2,500 13,286
Contractual commitments to acquire property, plant and equipment 16,083 4,183 9,280 2,620 −
Total 38,704 10,493 9,805 5,120 13,286
Consolidated financial statements (IFRS)
73 / 127
Suominen Corporation Annual Report 2015

Suominen in brief / How we create value / Year 2015 / Business / Sustainability / Governance / Financial Statements
Maturity analysis of financial liabilities 2014
EUR thousand Falling due
Financial liabilitiesCarrying amount
Contractual cash flows
Less than 6 months 6–12 months 1–2 years 2–5 years
Debentures 75,000 91,415 1,627 1,654 6,563 81,571
Loans from financial institutions 10,000 10,263 − 3,371 6,892 −
Finance lease liabilities 14 14 14 − − −
Other financial liabilities 1,079 1,079 354 375 350 −
Trade payables 47,403 47,403 47,403 − − −
Total 133,496 150,174 49,398 5,400 13,805 81,571
Falling due
Derivative instrumentsCarrying amount
Contractual cash flows
Less than 6 months 6–12 months 1–2 years 2–5 years
Currency forward contracts 236
Cash inflows 36,276 36,276 − − −
Cash outflows -36,537 -36,537 − − −
Electricity contracts 71
Cash outflows -72 − -52 -20 −
Total 307 -333 -261 -52 -20 −
Falling due
Contingent liabilities TotalLess than 6 months 6–12 months 1–2 years 2–5 years
Guarantees 15,042 717 1,800 3,300 9,225
Total 15,042 717 1,800 3,300 9,225
Consolidated financial statements (IFRS)
74 / 127
Suominen Corporation Annual Report 2015

Suominen in brief / How we create value / Year 2015 / Business / Sustainability / Governance / Financial Statements
The funding is managed by maintaining good relations with the financial institutions. The cooperation with the banks is built on long-lasting relationships.
Suominen plans to cover the loan amortization needs with its cash flow from operations and if needed, by disposal of non-core business operations and assets.
The Group’s loan agreements include covenant terms which are linked to consolidated key figures. If the covenant terms are not fulfilled, negotiations with the lenders will be initiated.
Interest-bearing liabilities of Suominen are presented in Note 17 and hybrid bond in Note 16 of the consolidated financial statements.
4. MANAGEMENT OF CAPITAL Suominen’s management of capital aims to support business activities by ensuring the conditions to operate by means of the Group’s financial position and capital structure. In addition, the aim is to increase the shareholder value by targeting at a competitive return on invested capital. The capital structure must ensure debt financing of the Group. In the capital management planning process both current and future needs of the business are taken into consideration together with securing the competitive pricing of financing.
The Board of Directors of Suominen monitors the equity ratio and gearing. Gearing is calculated as the ratio between interest-bearing net debt to equity. Equity ratio calculated as the ratio between equity to the total assets adjusted with advance payments received.
The capital structure can be influenced by distributing dividends or other funds and share issues. If there is a need, the Group can buy back own shares or issue new shares as authorized by the general meetings, or decide to sell assets or businesses to reduce liabilities.
The Group’s equity ratio was 43.2 (41.2) percent on 31 December 2015, and gearing was 25.9 (34.7) percent. The Group had a program to sell trade receivables. The program ended in 2014. Instead, Suominen has as a selected supplier -status a Supply Chain Financing program with certain customers. Under the program the trade receivables are sold on a non-recourse basis. The programs released capital employed.
Equity ratio and gearing at the end of the reporting period
EUR million 2015 2014
Interest-bearing liabilities 96.9 85.0
Interest-bearing receivables -8.8 -8.8
Cash and cash equivalents -55.6 -38.4
Interest-bearing net debt 32.5 37.8
Equity 125.7 108.7
Assets total - advances received 291.2 264.0
Gearing, % 25.9 34.7
Equity ratio, % 43.2 41.2
Consolidated financial statements (IFRS)
75 / 127
Suominen Corporation Annual Report 2015

Suominen in brief / How we create value / Year 2015 / Business / Sustainability / Governance / Financial Statements
5. GOODWILLEUR thousand
Goodwill represents the excess of the purchase consideration over the fair value of acquired net assets. Goodwill is allocated to those cash generating units which benefit from the acquired net assets as well as from synergies arising from the acquisition. The carrying amount of goodwill is tested at least annually for impairment during the third quarter of the year. If the impairment testing indicates that the recoverable amount of the cash generating unit which includes goodwill is lower than its carrying amount, an impairment loss of goodwill and of other assets, if applicable, is recognized in the statement of profit or loss. The impairment loss of goodwill will not be reversed during subsequent reporting periods.
Suominen has recognized goodwill from the acquisition of the business operations of Home and Personal business from Ahlstrom in 2011. At the end of the reporting period, the carrying amount of goodwill was EUR 15,495 thousand (EUR 15,495 thousand in 2014). The Group has one operating segment (Nonwovens), which is also a cash generating unit to which goodwill has been allocated in its entirety.
In impairment testing the recoverable amount for the cash generating unit is determined as the value in use. Value in use comprises of the discounted projected future cash flows. Projected cash flows are based on actual performance, annual plans as well as five-year forecasts based on the Group’s strategy. The main assumptions of forecasts are always reviewed during the impairment testing. Cash flows in the period beyond the five-year forecasted period are extrapolated using the growth rates for Suominen’s business. The key assumptions used in the value in use are sales trend of the cash-generating unit, expense levels and the discount rate used.
The replacement investments needed for maintaining the existing production capacity have been estimated based on the planned depreciation during the useful lives of each asset in the cash-generating unit.
The annual growth rate for Suominen’s net sales during the period covered by the forecast (2016-2020) has been estimated at 6.6 percent. In 2016, Suominen continues to follow its “In the Lead” strategy. The Group aims to increase the share of products with higher added value in its product portfolio and focuses, among other things, on streamlining its processes and especially on accelerating the product development process.
The critical assumptions in impairment testing
2015 2014
Discount rate 12.0% 11.8%
Growth in net sales 2016–2020 (2015–2019) 6.6% 4.1%
Annual terminal growth rate 1.0% 1.0%
Annual terminal operating profit percentage 10.8% 7.4%
6. INTANGIBLE ASSETSEUR thousand
Intangible rights include patents, trademarks, software licences as well as customer relations which were identifiable assets at business combination and are measured at fair value at the acquisition date. Other intangible assets are development and other costs which are directly attributable to the design and testing of identifiable and unique software or similar intangible assets. If an intangible asset is a qualifying asset as defined in IAS 23, i.e. an asset that necessarily takes a substantial period of time to get ready, the borrowing costs are capitalized into the initial acquisition cost of the asset.
Subsequent expenditure on intangible assets is capitalized only if the future economic benefits from the asset exceed the initially planned level. Otherwise the expenditure is recognized as an expense in the statement of profit or loss.
Intangible rights and other intangible assets are recognized in the statement of financial position at their initial acquisition cost less cumulative amortization and impairment losses, if any. They are amortized using planned straight-line amortization during of their estimated useful lives. Intangible assets from acquisition of a subsidiary are stated at their fair values at the date of the acquisition.
Suominen has no other intangible assets than goodwill which have indefinite useful lifes. Goodwill and intangible assets not yet available for use are tested annually for impairment. Disclosure information of goodwill is presented in Note 5 of the consolidated financial statements.
Other intangible assets are tested for impairment if there are indications that the asset may be impaired. Impairment testing is described in Note 27 of the consolidated financial statements.
Amortization periods for intangible assets
Goodwill .............................................................................. no amortizationIntangible rights ............................................................................3–13 yearsCustomer relations ........................................................................... 13 yearsOther intangible assets ............................................................... 5–10 yearsAdvance payments and assets under construction ............................................... no amortization
The discount rate has been derived by using targeted capital structure at the time of impairment test. Gearing, or ratio of net debt to equity, is 70 percent. Cost of capital has been calculated as a weighted average pre-tax rate for equity and debt and taking into the consideration the risk-free rate and risk margins of equity and debt respectively. Discount rate used in the calculation is the weighted average of the risk-free 10-year government bond rates in the operating countries where Suominen operates.
Impairment testing is based on present estimates of future development at the time of impairment testing. The uncertainty in measuring the values in use is captured by analyzing variations in the amount or timing of cash flows. The element of uncertainty and risk has been accounted for in the discount rates and by taking into consideration experience from previous impairment tests.
The management does not foresee that any eventual changes in the critical assumptions would lead into impairment of goodwill.
Consolidated financial statements (IFRS)
76 / 127
Suominen Corporation Annual Report 2015

Suominen in brief / How we create value / Year 2015 / Business / Sustainability / Governance / Financial Statements
Intangible rights Goodwill
Other intangible
assets
Advance payments and
assets under construction Total 2015
Acquisition cost 1 January 10,296 15,496 7,482 609 33,882
Exchange difference -24 − 45 -1 20
Additions 174 − 15 2,735 2,925
Capitalized borrowing costs − − − 2 2
Decreases and disposals -153 − -9 − -162
Reclassifications 1,349 − − -1,349 −
Acquisition cost 31 December 11,643 15,496 7,533 1,996 36,667
Accumulated amortization and impairment losses 1 January -4,195 − -1,681 − -5,876
Exchange difference 23 − 61 − 85
Decreases and disposals 143 − 9 − 152
Amortization for the reporting period -1,559 − -643 − -2,201
Impairment losses for the reporting period − − − -56 -56
Accumulated amortization and impairment losses 31 December -5,587 − -2,253 -56 -7,896
Carrying amount 31 December 6,055 15,496 5,279 1,941 28,771
Intangible rights Goodwill
Other intangible
assets
Advance payments and
assets under construction Total 2014
Acquisition cost 1 January 9,650 15,496 6,386 1,001 32,532
Exchange difference -10 − 88 1 79
Additions 150 − 1,118 1,148 2,416
Business combinations 20 − − − 20
Discontinued operations -1,054 − -111 − -1,165
Reclassifications 1,540 − − -1,540 −
Acquisition cost 31 December 10,296 15,496 7,482 609 33,882
Accumulated amortization and impairment losses 1 January -3,949 − -1,065 − -5,013
Exchange difference -2 − -5 − -7
Discontinued operations 996 − 9 − 1,005
Amortization for the reporting period -1,241 − -621 − -1,862
Accumulated amortization and impairment losses 31 December -4,195 − -1,681 − -5,876
Carrying amount 31 December 6,100 15,496 5,801 609 28,006
In 2011, EUR 5,979 thousand of the purchase consideration related to acquisition of Ahlstrom’s Home and Personal business was allocated to customer relations. At the end of the reporting period, the carrying amount of these customer relations was EUR 4,062 thousand.
Assets under finance leases
2015Intangible
rights
Acquisition cost 1 January 158
Cumulative amortization 1 January -60
Amortization for the period -31
Cumulative amortization 31 December -91
Carrying amount 31 December 67
2014Intangible
rights
Acquisition cost 1 January 158
Cumulative amortization 1 January -29
Amortization for the period -31
Cumulative amortization 31 December -60
Carrying amount 31 December 98
Consolidated financial statements (IFRS)
77 / 127
Suominen Corporation Annual Report 2015

Suominen in brief / How we create value / Year 2015 / Business / Sustainability / Governance / Financial Statements
7. PROPERTY, PLANT AND EQUIPMENTEUR thousand
Property, plant and equipment consist mainly of land, buildings and structures and machinery and equipment. They are recognized in the statement of financial position at their acquisition cost less cumulative depreciation and impairment losses, if any. When an asset consists of major components with different useful lives, they are accounted for as separate items. Assets from acquisition of a subsidiary are stated at their fair values at the date of the acquisition.
When part of an asset in property, plant and equipment is replaced, the cost of the replacement is capitalized and the eventual carrying amount of the replaced asset is derecognized. Other subsequent expenditure is capitalized only if the future economic benefits to the company from the asset are enhanced. Ordinary maintenance and repair charges are expensed as incurred.
Borrowing costs are capitalized as part of the acquisition cost of property, plant and equipment if the assets are qualifying assets as defined in IAS 23 Borrowing Costs.
Depreciation is recognized on a straightline basis over expected useful lives. Depreciation begins when the asset is available for its intended use. Land is not depreciated since it is deemed to have indefinite useful life.
Gains and losses from the sales and disposals of property, plant and equipment are determined as a difference between the sales price and the carrying amount of the asset and they are recognized as other operating income or expenses.
Depreciation periods for property, plant and equipment
Land .......................................................................................no deprecationBuilding and constructions ..................................................... 10–40 yearsMachinery and equipment .........................................................4–17 yearsOther intangible assets ................................................................. 3–5 yearsAdvance payments and assets under construction ......no deprecation
Consolidated financial statements (IFRS)
78 / 127
Suominen Corporation Annual Report 2015

Suominen in brief / How we create value / Year 2015 / Business / Sustainability / Governance / Financial Statements
LandBuildings and constructions
Machinery and equipment Other tangible assets
Advance payments and assets under
construction Total 2015
Acquisition cost 1 January 3,977 43,473 149,417 471 1,149 198,488
Exchange difference -498 159 5,764 -4 121 5,544
Additions − 766 1,997 − 17,806 20,570
Capitalized borrowing costs − − − − 72 72
Capitalized cash flow hedges − − − − 91 91
Decreases and disposals − -1 -89 − − -90
Reclassifications − 421 2,237 − -2,658 −
Acquisition cost 31 December 3,479 44,819 159,327 467 16,581 224,675
Accumulated depreciation and impairment losses 1 January − -26,327 -83,008 -431 − -109,767
Exchange difference − 143 -1,780 1 -4 -1,640
Decreases and disposals − 1 89 − − 90
Reclassifications − -11 11 − − −
Depreciation for the reporting period − -1,627 -14,139 -8 − -15,774
Impairment losses for the reporting period − − − − -183 -183
Reversals of impairment losses for the reporting period − − 530 − − 530
Accumulated depreciation and impairment losses 31 December − -27,822 -98,297 -437 -187 -126,743
Carrying amount 31 December 3,479 16,997 61,028 31 16,395 97,931
LandBuildings and constructions
Machinery and equipment Other tangible assets
Advance payments and assets under
construction Total 2014
Acquisition cost 1 January 2,343 57,509 182,107 524 1,272 243,755
Exchange difference 160 1,150 7,872 2 -81 9,103
Additions − − 1,035 2 3,613 4,650
Decreases and disposals − − -9 − − -9
Business combinations 2,419 3,101 5,250 10 − 10,779
Discontinued operations -944 -18,462 -50,405 -67 87 -69,791
Reclassifications − 175 3,566 − -3,742 −
Acquisition cost 31 December 3,977 43,473 149,417 471 1,149 198,488
Accumulated depreciation and impairment losses 1 January − -35,638 -109,003 -476 − -145,117
Exchange difference − -140 -2,375 0 − -2,516
Discontinued operations − 11,035 40,487 58 − 51,580
Depreciation for the reporting period − -1,585 -12,117 -12 − -13,714
Accumulated depreciation and impairment losses 31 December − -26,327 -83,008 -431 − -109,767
Carrying amount 31 December 3,977 17,146 66,408 41 1,149 88,721
2015 2014
Carrying amount of production machinery and equipment 61,109 65,221
Due to the disposal of the Flexibles business an impairment loss of property, plant and equipment totaling to EUR 4,340 thousand was recognized in 2014. This impairment loss was recognized in the statement of profit or loss in loss from discontinued operations.
Contractual commitments to acquire property, plant and equipment are presented in Note 37.
Consolidated financial statements (IFRS)
79 / 127
Suominen Corporation Annual Report 2015

Suominen in brief / How we create value / Year 2015 / Business / Sustainability / Governance / Financial Statements
9. INVENTORIESEUR thousand
Cost of inventories is measured using the FIFO (first-in-first-out) princi-ple or weighted average cost. The value of inventory includes all direct and indirect costs associated with purchase. The cost of manufactured products includes the cost of materials, direct labour and other direct costs, including general manufacturing overheads. The cost of inven-tories excludes sales, administration and financing costs. Borrowing costs are not capitalized in inventory.
Inventories are valued at lower of cost or the probable net realizable value. Net realizable value is the estimated selling price in the ordinary course of business less the estimated costs of completion and estimated costs necessary to make the sale.
Obsolete items in inventories are written down.
Changes in group structure in 2015The Finnish company Flexmer Oy merged into its parent company Suominen Corporation on 31 December 2015.
8. GROUP COMPANIES
Company Domicile Ownership, %
Owned by parent company
Suominen Corporation Helsinki, Finland
Suominen Nonwovens Ltd. Nakkila, Finland 100% x
Suominen Italy Holding, s.r.l. Mozzate, Italy 100% x
Cressa Nonwovens s.r.l. Mozzate, Italy 100%
Mozzate Nonwovens s.r.l. Mozzate, Italy 100%
Suominen Spain Holding, S.A.U. Alicante, Spain 100% x
Alicante Nonwovens S.A.U. Alicante, Spain 100%
Suominen US Holding, Inc. Delaware, USA 100%
Bethune Nonwovens, Inc. Bethune, South Carolina, USA 100%
Green Bay Nonwovens, Inc. Green Bay, Wisconsin, USA 100%
Windsor Locks Nonwovens, Inc. Windsor Locks, Connecticut, USA 100%
Suominen Brasil Indústria e Comercio de Não-Tecidos Ltda. Paulinia, Brazil 100% x
Inventories 2015 2014
Raw materials and consumables 16,354 17,001
Work in progress 2,218 1,394
Finished goods 13,985 13,985
Total inventories 32,557 32,380
Write-down of inventory -622 -399
Reversals of write-down of inventory 142 −
Inventories recognized as expense during the period -326,183 -300,631
Inventories recognized as expense during the period are included in cost of goods sold in the statement of profit or loss.
Consolidated financial statements (IFRS)
80 / 127
Suominen Corporation Annual Report 2015

Suominen in brief / How we create value / Year 2015 / Business / Sustainability / Governance / Financial Statements
Loan receivablesAt the disposal of the Flexibles business in 2014 Suominen Corporation granted two loans to Bright Maze Oy, the acquiree: Vendor Loan Note (EUR 6,255 thousand) and Subordinated Loan Note (EUR 2,277 thousand). The accrued interests of both loans are capitalized annually in December.
The interest rate of the Vendor Loan Note is 6 percent p.a. and it is paid semiannually as from June 2015. The loan matures on 31 December 2018. The interest rate ot the Subordinated Loan Note is 9 percent p.a. and it is fully repaid at its maturity on 31 July 2024. The security for the loan includes some receivables of Bright Maze Oy, shares in Suominen Joustopakkaukset Oy as well as a mortgage over Bright Maze Oy.
Should the ownership structure of Bright Maze Group change materially, both loan receivables with the accrued and capitalized interest will be repaid prematurely. The debtor may repay the loans at any time.
The Subordinated Loan is not secured and it is the last in the ranking order. Prior to the maturity, Suominen has the right to convert the loan into equity at its sole discretion.
Each loan receivable is individually analyzed for a possible impairment loss. These analyses are based on the financial position and future cash flows of the debtor. Debtors have no external credit rating.
These loan receivables are measured at amortized cost, and at the end of the reporting period the carrying amounts of both loan receivables equal their fair values.
Trade receivablesMeasurement of trade receivables is described in Note 12 of the consolidated financial statements.
Suominen had a program to sell trade receivables. This program ended in 2014. In 2014 Suominen started with a “selected supplier” status a Supply Chain Financing Program where trade receivables are sold so that the contractual rights to receive the cash flows from the trade receivables cease. Both programs released capital employed.
Prepaid expenses and accrued income consist mainly of accruals of financial items, accruals related to sales and other accruals.
Other receivables, both non-current and current, include, among others, receivables related to indirect taxes.
Prepaid expenses and accrued income related to derivative instruments are disclosed in more detail in Note 19 of the consolidated financial statements.
Credit quality of other receivables is based on the debtors’ payment history. Other receivables are not past due nor impaired.
At the disposal of the Flexibles business in 2014 it was agreed, that part of the consideration depends on the result of the sold business incurred after the disposal. This receivable is presented in other non-current receivables and it is measured at fair value through profit or loss.
11. RECEIVABLESEUR thousand
Available-for-sale assets consist of unlisted shares. At the disposal of its Flexibles business unit Suominen acquired shares in Bright Maze Oy. The ownership represents 19.9 percent of shares and votes Bright Maze Oy.
In 2015 Suominen sold shares in a real estate company which were classified as available-for-sale.
Reclassification includes assets previously classified as held-to-maturity.
Definition of available-for-sale assets is disclosed in Note 12 of the consolidated financial statements.
10. AVAILABLE-FOR-SALE ASSETSEUR thousand
2015 2014
Carrying amount 1 January 1,124 939
Additions − 347
Reclassification 421 −
Fair value changes recognized in other comprehensive income -318 -145
Decreases -450 -17
Carrying amount 31 December 777 1,124
Non-current receivables 2015 2014
Loan receivables 7,793 8,202
Other non-current receivables 2,402 2,614
Total non-current receivables 10,195 10,816
Current receivables
Trade receivables 51,547 52,269
Loan receivables 1,000 600
Other current receivables 1,567 1,192
Prepaid expenses and accrued income 5,470 3,425
Total current receivables 59,584 57,487
Consolidated financial statements (IFRS)
81 / 127
Suominen Corporation Annual Report 2015

Suominen in brief / How we create value / Year 2015 / Business / Sustainability / Governance / Financial Statements
Ageing analysis of trade receivables 2015 2014
Not due 44,854 48,378
Overdue
Less than 5 days 2,647 1,759
5–30 days 3,196 1,912
31–120 days 763 222
More than 120 days 172 83
Total overdue 6,777 3,976
Total trade receivables 51,631 52,354
Allowance account -85 -85
Carrying amount of trade receivables 51,547 52,269
Impairment losses of trade receivables and changes in allowance account of trade receivables
Allowance account 1 January -85 -317
Exchange difference − 1
Charge for the year − -7
Discontinued operations − 238
Allowance account 31 December -85 -85
Credit losses during the period -2 -7
Currency analysis of trade receivables
EUR 30,227 28,452
USD 18,605 21,576
BRL 2,172 2,225
Other currencies 543 17
Total 51,547 52,269
12. FINANCIAL ASSETSEUR thousand
Fair value through profit
or loss
Held-to-maturity
investmentsLoans and
receivablesAvailable-for-
sale assets
Derivatives, hedge
accounting applied
Carrying amount Fair value
Available-for-sale assets − − − 777 − 777 777
Other non-current receivables 813 − 1,512 − − 2,326 2,326
Loan receivables − − 8,793 − − 8,793 8,793
Trade receivables − − 51,547 − − 51,547 51,547
Interest and other financial receivables − − 1,297 − − 1,297 1,297
Cash and cash equivalents − − 55,570 − − 55,570 55,570
Total 31 December 2015 813 − 118,719 777 − 120,309 120,309
Other non-current receivables include a contingent consideration of EUR 813 thousand (EUR 980 thousand) arising from the disposal of the Flexibles business in 2014.
Fair value through profit
or loss
Held-to-maturity
investmentsLoans and
receivablesAvailable-for-
sale assets
Derivatives, hedge
accounting applied
Carrying amount Fair value
Available-for-sale assets − − − 1,124 − 1,124 1,124
Held-to-maturity investments − 450 − − − 450 450
Other non-current receivables 980 − 1,634 − − 2,614 2,614
Loan receivables − − 8,802 − − 8,802 8,802
Trade receivables − − 52,269 − − 52,269 52,269
Derivatives − − − − 12 12 12
Other current receivables − − 1,011 − − 1,011 1,011
Interest and other financial receivables − − 1,725 − − 1,725 1,725
Cash and cash equivalents − − 38,430 − − 38,430 38,430
Total 31 December 2014 980 450 103,871 1,124 12 106,437 106,437
Financial assets have been classified as financial assets at fair value through profit or loss, loans and receivables, held-to-maturity investments and available-for-sale assets. The classification depends on the purpose for which the financial assets were acquired. Management determines the classification of the financial assets at initial recognition of the asset.
Trade day accounting is applied to regular purchases and sales of financial assets. Financial assets, which are not measured at fair value through profit or loss are initially recognized at fair value with transaction costs.
Financial assets at fair value through profit or loss are initially recognized at fair value and transaction costs are recognized as expenses in the statement of profit or loss. Financial assets are derecognized when the rights to receive cash flows from the assets have expired or have been transferred to an external party and the group has transferred substantially all the risks and rewards related to the ownership of the assets to an external party. Available-for-sale assets and assets at fair value through profit or loss are subsequently mesured at fair value. Loans and receivables are measured at amortized cost using the effective interest method.
Consolidated financial statements (IFRS)
82 / 127
Suominen Corporation Annual Report 2015
Suominen in brief / How we create value / Year 2015 / Business / Sustainability / Governance / Financial Statements
for the asset or if the securities are unlisted, the Group measures fair value with valuation techniques. If there is no asset-specific data available from transactions between independent parties, the fair values used for the asset are either the present value of discounted cash flows arising from the asset or fair values other instruments which are substantially identical than the asset. Some unlisted equity instruments are presented in the statement of financial position at acquisition cost less impairment losses, if any.
DerivativesDisclosure information on derivative instruments is presented in Note 19 of the consolidated financial statements.
carrying amount of the trade receivables. Due to the short maturity the trade receivables are not discounted.
Cash and cash equivalents comprise cash and other financial assets, if any. Other financial assets are highly liquid investments with remaining maturities at the date of acquisition of three months or less. Bank overdrafts are included in current interest-bearing liabilities.
The carrying amounts of other receivables and cash and cash equivalents equal their fair values.
Held-to-maturity investmentsHeld-to-maturity investments are non-derivatives which have fixed payments maturing on a fixed date and where the Group has a firm intent and ability to hold the instrument until maturity. They are carried at amortized cost using the effective interest method and they are included in non-current assets. At the end of the reporting period, Suominen had no investments classified as held-to-maturity.
Available-for-sale assetsAvailable-for-sale assets are non-derivatives which are either designated in this category or not classified in any of the other categories. They are included in non-current assets unless management intends to dispose them within 12 months from the end of the reporting period. At the end of the reporting period Suominen held only non-current available-for-sale assets.
Changes in the fair value of available-for-sale assets, net of tax, are recognized in other comprehensive income. When available-for-sale assets are sold or an impairment loss is recognized, the cumulative fair value changes recognized in other comprehensive income are reclassified from equity to statement of profit or loss. Interest income on available-for-sale assets, calculated with the effective interest method, is recognized in financial items in the statement of profit or loss.
The Group assesses at the end of the reporting period whether there is objective evidence that an asset or a group of assets classified as available-for-sale is impaired. If the fair value of equity instruments classified as available-for-sale is significantly or has been for a prolonged period lower than the acquisition cost, it is considered as an indicator of impairment. The impairment loss is measured as the difference between the acquisition cost and the fair value, less any impairment loss on the asset previously recognized in profit or loss. The impairment loss is recognized in the statement of profit or loss.
The fair values of quoted securities are based on closing prices of the securities at the end of the reporting period. If there is no active market
Financial assets at fair value through profit or lossFinancial assets at fair value through profit or loss are financial assets held for trading or assets which are initially classified as assets at fair value through profit of loss. A financial asset is classified at fair value through profit or loss if it has been acquired principally for the purpose of selling it in the near future. Derivatives for which hedge accounting is not applied are classified as held for trading.
Other non-current receivables measured at fair value through profit or loss are contingent sales considerations. The fair value of the receivables is based on estimated repayments in accordance with the terms of the agreement.
Gains or losses arising from changes in the fair value of assets at fair value through profit or loss are recognized in the statement of profit or loss either in other operative income and expenses or in financial items, depending on the nature of the asset.
Loans and other receivablesLoans and receivables are non-derivative financial assets with fixed or determinable payments and which are not quoted in an active market. They are included in current assets, except if they mature after more than 12 months after the end of the reporting period, in which case they are classified as non-current assets. The Group’s loans and receivables include loan receivables, trade and other receivables and cash and cash equivalents.
Each loan receivable is individually analyzed for a possible impairment loss. These analyses are based on the financial position and future cash flows of the debtor. Loan receivables are measured at amortized cost, and at the end of the reporting period the carrying amounts of loan receivables equal their fair values.
Trade receivables are carried at the original invoice amount less an estimate made for doubtful receivables. Estimate made for doubtful receivables is based on a periodic review of all outstanding amounts. For example payment defaults or late payments are considered as indications of impairment of the receivable. Impairment losses of trade receivables are recorded in a separate allowance account within trade receivables, and the impairment losses are recognized in profit or loss as other operating expenses. If the impairment loss is final, the trade receivable is derecognized from the allowance account. If a payment is later received from the impaired receivable, the received amount is recognized in profit or loss as a deduction of other operating expenses. If no impairment loss has been recognized in the allowance account and the impairment loss of the trade receivable is found to be final, impairment loss is recognized directly as deduction of trade receivables. The maximum credit risk arising from trade receivables equals the
Consolidated financial statements (IFRS)
83 / 127
Suominen Corporation Annual Report 2015

Suominen in brief / How we create value / Year 2015 / Business / Sustainability / Governance / Financial Statements
Items recognized in profit or loss have been recognized in financial items.
There were no transfers in the fair value measurement hierachy levels during the reporting periods. An asset classified previously as held-to-maturity was reclassified to Level 3.
Fair values in Level 1 are based on quoted prices (unadjusted) in active markets for identifical assets or liabilities.
The fair value for financial instruments that are not traded in an active market is determined by using valuation techniques. These valuation techniques maximize the use of observable market data where it is applicable and rely as little as possible on entity specific estimates. If all significant inputs required to measure the fair value of an instrument are observable, the instrument is included in Level 2.
Fair values for electricity forward contracts are determined by using the quoted forward prices in Nordpool for the same period and discounting them with relevant interest rates to the end of the reporting period.
Fair values for currency forward contracts are determined by using the spot rates and relevant swap points based on interest rate differences at the end of the reporting period.
The fair values of financial instruments on Level 3 are based on related inputs, which are not based on observable market information but significantly on management estimates which are used in generally accepted valuation methods.
The fair value of the shares in the real estate company classified as available-for-sale and presented in Level 3 in the fair value hierarchy was calculated by discounting the probable future cash flows to the end of the reporting period. The fair value of the shares in Bright Maze Oy, also on Level 3, is measured using an EBITDA multiplier and a comparable data analysis. The fair valued of other available-for-sale assets is the acquisition cost less impairment losses, if any.
13. FAIR VALUE HIERARCHYEUR thousand
Fair value hierarchy in 2015
Financial assets at fair value Level 1 Level 2 Level 3
Other non-current receivables − − 813
Available-for-sale assets − − 777
Currency derivatives − − −
Total in 2015 − − 1,590
Financial liabilities at fair value
Other non-current liabilities − − 368
Other current liabilities − − 262
Currency derivatives − 297 −
Electricity derivatives − 242 −
Total in 2015 − 539 630
Fair value hierarchy in 2014
Financial assets at fair value
Other non-current receivables − − 980
Available-for-sale assets − − 1,124
Electricity derivatives − 12 −
Total in 2014 − 12 2,104
Financial liabilities at fair value
Other non-current liabilities − − 350
Other current liabilities − − 729
Currency derivatives − 236 −
Electricity derivatives − 82 −
Total in 2014 − 318 1,079
Fair value changes in Level 3
Financial assets at fair value
Total 1 January 2014 1,450
Issues 1,327
Settlements -528
Fair value changes recognized in other comprehensive income -145
Total 31 December 2014 2,104
Settlements -167
Disposal -450
Fair value changes recognized in other comprehensive income -318
Reclassification from held-to-maturity assets 421
Total 31 December 2015 1,590
Financial liabilities at fair value
Total 1 January 2014 −
Issues 1,064
Recognized in profit or loss 15
Total 31 December 2014 1,079
Settlements -405
Recognized in profit or loss -44
Total 31 December 2015 630
Consolidated financial statements (IFRS)
84 / 127
Suominen Corporation Annual Report 2015

Suominen in brief / How we create value / Year 2015 / Business / Sustainability / Governance / Financial Statements
14. OTHER COMPREHENSIVE INCOMEEUR thousand
2015 Exchange differences
Fair value and other reserves
Retained earnings Total
Profit for the period − − 17,020 17,020
Exchange differences 2,356 − − 2,356
Income tax on exchange differences -626 − − -626
Fair value changes, cash flow hedges − -652 − -652
Fair value changes, cash flow hedges, income taxes − 65 − 65
Fair value changes, available-for-sale assets − -318 − -318
Fair value changes, available-for-sale assets, income taxes − 64 − 64
Cash flow hedges, reclassified to profit or loss − 206 − 206
Cash flow hedges, reclassified to profit or loss, income taxes − -41 − -41
Available-for-sale assets, reclassified to profit or loss − 463 − 463
Available-for-sale assets, reclassified to profit or loss, income taxes − -93 − -93
Cash flow hedges, reclassified to property, plant and equipment − 91 − 91
Defined benefit plans, remeasurements − − -26 -26
Defined benefit plans, remeasurement, income taxes − − 8 8
Total comprehensive income 1,730 -216 17,002 18,516
2014 Exchange differences
Fair value and other reserves
Retained earnings Total
Profit for the period − − 4 973 4 973
Exchange differences 6,863 − − 6,863
Income tax on exchange differences -423 − − -423
Fair value changes, cash flow hedges − -102 − -102
Fair value changes, cash flow hedges, income taxes − 20 − 20
Fair value changes, available-for-sale assets − 183 − 183
Fair value changes, available-for-sale assets, income taxes − -37 − -37
Cash flow hedges, reclassified to profit or loss − 1,287 − 1,287
Cash flow hedges, reclassified to profit or loss, income taxes − -257 − -257
Defined benefit plans, remeasurements − − -150 -150
Defined benefit plans, remeasurement, income taxes − − 50 50
Total comprehensive income 6,440 1,094 4,873 12,307
Exchange differencesThe exchange differences arising from translating the statements of profit or loss, statements of comprehensive income and statements of financial position into euro using the different exchange rates are recognized as other comprehensive income and included in equity as cumulative exchange difference. Exchange differences arising from the translation of the net investments in foreign subsidiaries in non-euro area are also recognized in other comprehensive income and included in equity as cumulative exchange difference.
Some loans granted to the subsidiaries are in substance part of a net investment in the subsidiary, as settlement of the loan is not likely to occur in the foreseeable future. The exchange differences arising from those loans are recognized in other comprehensive income and exchange differences in equity. In connection of the sale of the Flexibles business, their loans classified as net investments were derecognized and the exchange differences were reclassified to profit or loss into the result from discontinued operations.
Suominen has been hedging the net investment in the US operations. The net investment in the US operations was hedged with a USD 39 million currency forward contract until 24 September 2015. In 2014, the net investment in the US operations was hedged until September with an external loan of USD 39.4 million and after that with a currency forward contract. The exchange differences arising from the hedging instruments are recognized in other comprehensive income and in exchange differences in equity.
Consolidated financial statements (IFRS)
85 / 127
Suominen Corporation Annual Report 2015

Suominen in brief / How we create value / Year 2015 / Business / Sustainability / Governance / Financial Statements
weighted average price EUR 1.01 (EUR 0.58). The closing price at the end of reporting period was EUR 1.24 (EUR 0.81). The market capitalization (excluding treasury shares) was EUR 311.9 million on 31 December 2015 (EUR 199.4 million).
Share trading and priceThe number of Suominen Corporation shares traded on Nasdaq Helsinki from 1 January to 31 December 2015 was 97,512,750 shares (97,735,300 shares), accounting for 38.8 (39.7) percent of the average number of shares (excluding treasury shares). The highest price was EUR 1.33 (EUR 0.82), the lowest EUR 0.75 (EUR 0.47) and the volume-
15. INFORMATION OF SUOMINEN SHARE
Share capitalThe registered share capital of Suominen Corporation totals EUR 11,860,056. The number of registered shares at the end of the reporting period was 252,425,616. The number of shares increased in the reporting period in total by 4,491,494 shares, of which 3,984,106 were attributable to the share conversions of the hybrid bond notes and accrued interests; and 507,388 to the directed share issue subject to payment for the management, implemented in accordance with the share-based incentive program. Both the conversion of the hybrid bond to equity and the share issue subject to payment have been recorded into the reserve for invested unrestricted equity.
Suominen has one series of shares. Each share has one vote in the general meeting of the shareholders and all the shares have equal rights to dividend or other distribution of equity. Suominen share has no nominal value. Suominen Corporation shares are listed on Nasdaq Helsinki Ltd.
Treasury sharesThe treasury shares acquired by Suominen and the related costs are presented as deductions of equity. At disposal of acquired treasury shares the consideration received is recognized in equity.
At the end of the reporting period Suominen held 913,886 treasury shares. In total 802,644 treasury shares were transferred during the reporting period to key employees of the Group in a directed share-issue without consideration as a reward of the 2012–2014 share-based incentive plan. In addition, in accordance with the resolution by the Annual General Meeting, 86,989 shares were transferred on 5 June 2015 to the members of the Board of Directors as their remuneration payable in shares.
The share ownership of related parties in Suominen are disclosed in Note 36 of the consolidated financial statements.
Share-based plansThe share-based incentive plans are described in Note 33 of the consolidated financial statements.
Suominen has no option plans.
Number of shares
Changes in number of shares
Number of shares 1 January 2014 247,934,122
Number of shares 31 December 2014 247,934,122
Conversions of the hybrid bond 3,984,106
Share issue subject to payment 507,388
Number of shares 31 December 2015 252,425,616
Changes in treasury shares
Number of treasury shares 1 January 2014 1,924,367
Conveyance of treasury shares, reward for the Board of Directors -120,848
Number of treasury shares 31 December 2014 1,803,519
Conveyance of treasury shares, share-based incentive plan -802,644
Conveyance of treasury shares, reward for the Board of Directors -86,989
Number of shares 31 December 2015 913,886
Number of shares 31 December 2015 31 December 2014
Number of shares excluding treasury shares 251,511,730 246,130,603
Share-issue adjusted number of shares excluding treasury shares 251,511,730 248,065,234
Average number of shares excluding treasury shares 250,597,155 246,078,953
Average share-issue adjusted number of shares excluding treasury shares 250,943,177 248,013,178
Average diluted share-issue adjusted number of shares excluding treasury shares 291,044,343 284,764,016
Consolidated financial statements (IFRS)
86 / 127
Suominen Corporation Annual Report 2015

Suominen in brief / How we create value / Year 2015 / Business / Sustainability / Governance / Financial Statements
On 10 July 2015, GMT Capital Corp notified that it has on 9 July 2015 acquired Suominen shares and consequently reached the threshold of 5% of all shares and votes in Suominen Corporation. After the transaction, GMT Capital Corp holds in total 12,623,280 Suominen shares, corresponding to 5.00% of all shares and votes.
0107638-1), notified that it has on 19 March 2015 divested Suominen shares and consequently crossed the threshold of 10% of all shares and votes in Suominen Corporation. In its previous notification, Ilmarinen stated it held 27,111,992 Suominen shares, corresponding to 11.02% of shares and votes in Suominen Corporation. After the transaction, Ilmarinen holds in total 18,422,103 Suominen shares, corresponding to 7.33% of all shares and votes.
Notifications in 2015 under chapter 9, section 5 of the Securities Market ActOn 29 January 2015, Mandatum Life Insurance Company Limited (business identity code 0641130-2) notified that it has divested Suominen Corporation shares through a transaction made on 23 January 2015, and consequently, its ownership in Suominen decreased below the threshold of 5%. After the transaction, Mandatum holds in total 12,318,243 shares and votes (4.97% of all shares and votes). In its previous notification, the number of shares held by Mandatum was 22,322,222, which accounted for 9.1% of all shares and votes in Suominen.
On 29 January 2015, Mandatum Life Insurance Company Limited (business identity code 0641130-2) notified that it had on 5 February 2014 subscribed the convertible hybrid bond issued by Suominen, which entitles Mandatum to subscribe a maximum of 3,714,000 new Suominen shares during the conversion period of 11 February 2014–10 February 2018. If Mandatum decided to subscribe these shares, its shareholding in Suominen would exceed the threshold of 5%. After the subscription, Mandatum would hold 16,032,243 shares and votes (6.37% of all shares and votes). In its previous notification, the number of Suominen shares held by Mandatum was 12,318,243, which accounted for 4.97% of all shares and votes.
On 18 February 2015, Mandatum Life Insurance Company Limited (business identity code 0641130-2) notified that it has divested Suominen Corporation shares through a transaction made on 17 February 2015. Following the transaction, Mandatum’s ownership in Suominen would remain below the threshold of 5% even if Mandatum would convert all notes of the hybrid bond it subscribed in February 2014 into Suominen shares.
On 16 March 2015, Finnish Industry Investment Ltd (Suomen Teollisuussijoitus Oy, business identity code 1007806-3) notified that it has divested Suominen shares and thus its shareholding has fallen below the threshold of 5% of all shares and votes in Suominen. In its previous notification, Finnish Industry Investment Ltd stated it held 22,222,222 Suominen shares, corresponding to 9.04% of shares and votes in Suominen Corporation. Before the transaction made on 16 March 2015, Finnish Industry Investment Ltd held 14,009,604 shares, corresponding to 5.57% of all shares and votes. After the transaction made on 16 March 2015, Finnish Industry Investment Ltd holds in total 7,009,604 Suominen shares, corresponding to 2.78% of all shares and votes.
On 20 March 2015, Ilmarinen Mutual Pension Insurance Company (Keskinäinen Eläkevakuutusyhtiö Ilmarinen, business identity code
Largest shareholders 31 December 2015
Shareholder Number of shares % of shares and votes
AC Invest Two B.V. 67,724,176 26.83%
Varma Mutual Pension Insurance Company 22,500,000 8.91%
Ilmarinen Mutual Pension Insurance Company 16,259,056 6.44%
Pension Insurance Company Elo 14,123,255 5.60%
Euroclear Bank SA/NV 12,288,186 4.87%
Oy Etra Invest Ab 12,223,320 4.84%
Skandinaviska Enskilda Banken, Helsinki Branch 7,844,085 3.11%
Nordea Nordic Small Cap Fund 7,685,763 3.04%
OP Delta Fund 5,715,373 2.26%
Nordea Pankki Suomi Oyj 5,085,841 2.01%
Nissi Evald and Hilda Foundation 5,000,000 1.98%
Heikki Bergholm 4,635,562 1.84%
Juhani Maijala 3,286,743 1.30%
Mikko Maijala 3,017,337 1.20%
Svenska Handelsbanken AB 2,633,348 1.04%
Investment fund Alfred Berg Finland 2,479,497 0.98%
Danske Invest Small Cap Fund 2,329,000 0.92%
FIM Fenno SEK Fund 2,191,115 0.87%
Eeva Maijala 1,793,635 0.71%
OP-Suomi Arvo 1,659,853 0.66%
20 largest total 200,475,145 79.42%
Other shareholders 22,701,648 8.99%
Nominee registered 28,314,669 11.22%
Treasury shares 913,886 0.36%
In joint account (not in the book-entry securities system) 20,268 0.01%
Total 252,425,616 100.00%
Consolidated financial statements (IFRS)
87 / 127
Suominen Corporation Annual Report 2015

Suominen in brief / How we create value / Year 2015 / Business / Sustainability / Governance / Financial Statements
Ownership distribution 31 December 2015
Number of shareholders % of total Number of shares % of shares and votes
Corporations 209 4.3% 26,139,597 10.36%
Financial and insurance corporations 19 0.4% 25,091,930 9.94%
General government 7 0.1% 55,081,788 21.82%
Non-profit institutions 26 0.5% 10,156,696 4.02%
Households 4,523 94.1% 38,399,339 15.21%
Foreign countries 25 0.5% 68,307,443 27.06%
Total 4,809 100.0% 223,176,793 88.41%
Nominee registered 8 28,314,669 11.22%
In joint account (not in the book-entry securities system) 20,268 0.01%
Treasury shares 1 913,886 0.36%
Total 4,818 252,425,616 100.00%
Shareholders by share ownership 31 December 2015
Number of shares Number of shareholders % of total Number of shares % of shares and votes
1 - 100 439 9.1% 25,729 0.01%
101 - 500 948 19.7% 293,504 0.12%
501 - 1,000 820 17.0% 697,377 0.28%
1,001 - 5,000 1,588 33.0% 4,116,446 1.63%
5,001 - 10,000 448 9.3% 3,514,443 1.39%
10,001 - 50,000 416 8.6% 8,783,712 3.48%
50,001 - 100,000 65 1.3% 4,781,740 1.89%
100,001 - 500,000 56 1.2% 12,861,195 5.10%
more than 500,000 37 0.8% 216,417,316 85.74%
Total 4,817 100.0% 251,491,462 99.63%
In joint account (not in the book-entry securities system) 20,268 0.01%
Treasury shares 1 913,886 0.36%
Total 4,818 252,425,616 100.00%
Consolidated financial statements (IFRS)
88 / 127
Suominen Corporation Annual Report 2015

Suominen in brief / How we create value / Year 2015 / Business / Sustainability / Governance / Financial Statements
In accordance with IAS 32, a hybrid bond can be classified as an equity instrument instead of a financial liability if the interest and loan payments are fully controlled by the company and payments are not connected to any other loans. The hybrid bond is initially recognized at amortized cost. The hybrid bond of Suominen is classified as equity. The accrued interests are capitalized and recognized in the retained earnings.
If Suominen distributes dividend before 10 February 2018, the bondholders are entitled to a compensation equaling to the dividend. The compensation will be paid the same date as the dividend, and the paid compensation will be deducted from the interests accrued or to be accrued. The compensation deducted from interests accrued or to be accrued will decrease the amount of interests capitalized as principal of the bond and thus the number of shares to be converted with the bond.
16. HYBRID BOND EUR thousand
Suominen issued on 10 February 2014 a convertible hybrid bond of EUR 17,500,000, which is classified as an equity instrument, to finance the acquisition of the nonwovens operations in Brazil. The bond consisted of 175 bond notes, each having the nominal value of EUR 100,000. The bond does not have a guarantee or other collateral.
The principal of the bond has a fixed annual interest of 5.95 percent until 10 February 2018, and after that a fixed annual interest of 6.95 percent until 10 February 2019. After 10 February 2019, the principal of the bond will have a fixed annual interest of 7.95 percent. The interest accrued for the bond will be capitalized to the principal of the bond annually on 10 February until 10 February 2018. Thereafter, commencing on 10 May 2018, the interest is payable in the discretion of the Board of Directors quarterly on 10 February, 10 May, 10 August and 10 November. No interest shall be paid on the capitalized interest until 10 February 2018. After that date, the capitalized interest shall be a part of the principal of the bond and annual interest shall be paid to the whole amount of the principal in accordance with the terms of the bond.
Suominen has the right to redeem the bond in whole or in part on 10 February 2018 or thereafter, on each interest payment date, at the nominal value of the bond with the accrued interest.
A bond note entitles the bondholder to convert the bond note and the potential capitalized interest for shares in Suominen at the conversion rate of EUR 0.50 per share. The period for converting started on 11 February 2014 and ends on 10 February 2018. The number of shares to be received through the conversion must always be at least 200,000. In 2015 in total EUR 1.9 million of the bond principal as well as EUR 0.09 million of accrued interests were converted in shares. The number of shares in Suominen increased through the conversion by 3,984,106 shares.
If the total remaining value of the hybrid bond including accrued interest at the end of the reporting period were converted in new shares through a share issue, the number of shares in Suominen would increase by 38,625,600 shares.
The value of the shares issued through conversion of the hybrid bond is recognized in the reserve for invested unrestricted equity, which increased in 2015 thanks to the conversion by EUR 1.9 million.
Changes in hybrid bond
Hybrid bond 1 January 2014 −
Issue 17,500
Hybrid bond 31 December 2014 17,500
Capitalization of interests 1,332
Conversion into shares -1,992
Hybrid bond 31 December 2015 16,840
Consolidated financial statements (IFRS)
89 / 127
Suominen Corporation Annual Report 2015

Suominen in brief / How we create value / Year 2015 / Business / Sustainability / Governance / Financial Statements
Interest-bearing liabilitiesInterest-bearing financial liabilities are recognized initially at fair value. Interest-bearing financial liabitilies are subsequently recognized at amortized cost.
Fees paid on loan facilities are recognized as transaction costs of the loan to the extent that it is probable that the facility will be drawn down. In this case, the fee is recognized in the statement of financial position until the draw-down of the loan occurs, and it is recognized in profit or loss over the loan period. If it is not probable that the loan facility will be utilized, the fee will be immediately recognized in profit or loss.
Listed debentures are initially recognized at fair value, net of transaction costs. Debentures are subsequently recognized at amortized cost using the effective interest method. The fair value of a listed debenture is measured using the market price at the end of the reporting period.
Fair values for fixed-interest-bearing financial liabilities are measured by discounting future cash flows at the appropriate interest rate prevailing on the closing date (2.95–4.45 percent). Pension loans repaid in 2014 had fixed interest rates.
17. INTEREST-BEARING LIABILITIESEUR thousand
2015 2014
Carrying amount Fair value Carrying amount Fair value
Non-current interest-bearing liabilities
Loans from financial institutions 18,498 18,498 6,667 6,667
Debentures 75,000 77,175 75,000 75,150
Total 93,498 95,673 81,667 81,817
Current interest-bearing liabilities
Current part of non-current loans from financial institutions _ _ 3,333 3,333
Current loans from financial institutions 3,363 3,363 − −
Finance lease liabilities − − 14 14
Total 3,363 3,363 3,347 3,347
Total 96,862 99,037 85,014 85,164
Consolidated financial statements (IFRS)
90 / 127
Suominen Corporation Annual Report 2015

Suominen in brief / How we create value / Year 2015 / Business / Sustainability / Governance / Financial Statements
In December 2015 Suominen converted its loans from financial institutions from EUR to USD. At the same time Suominen drew down a new USD denominated loan, which corresponded EUR 15 million at the date of the drawdown.
Suominen renewed its financing in September 2014. The syndicated loan drawn down in 2011 was fully repaid and the mortgages held as collaterals were released. To replace the syndicate loan, Suominen issued a debenture bond of EUR 75 million and entered into a EUR 55 million syndicated credit facilities agreement. The new loans from financial institutions include leverage ratio and gearing as financial covenants. The loans from financial institutions have floating interest rates.
The debentures are listed on Nasdaq Helsinki Ltd. The fair value of the debentures is based on its market value at the end of the reporting period. The bond has a maturity of five years and the principal of the bond is repaid in full at the end of the loan period. The debentures constitute direct and unsecured obligations of Suominen and they are guaranteed as for own debt by certain subsidiaries of Suominen Corporation. The bond carries a fixed coupon with an interest rate of 4.375 percent per annum and the interest is paid semiannually.
Change in interest-bearing liabilities
2015 2014
Total interest-bearing liabilities at the beginning of the period 85,014 94,471
Current liabilities at the beginning of the period 3,347 24,071
Discontinued operations − -502
Repayment of current liabilities -3,347 -20,222
Drawdown of current liabilities 3,363 −
Current liabilities at the end of the period 3,363 3,347
Non-current liabilities at the beginning of the period 6,667 70,399
Discontinued operations − -4,283
Repayment of non-current liabilities -6,667 -66,116
Drawdown of non-current liabilities 18,498 6,667
Non-current liabilities at the end of the period 18,498 6,667
Debentures at the beginning of the period 75,000 −
Issue of debentures − 75,000
Debentures at the end of the period 75,000 75,000
Total interest-bearing liabilities at the end of the period 96,862 85,014
Maturity of interest-bearing liabilities
2016 (2015) 3,363 3,347
2017 (2016) 7,904 3,333
2018 (2017) 10,595 3,334
2019 (2018) 75,000 −
2020 - (2019 -) − 75,000
Total 96,862 85,014
Interest-bearing liabilities by currency
EUR 75,000 85,014
USD 21,862 −
Total 96,862 85,014
Consolidated financial statements (IFRS)
91 / 127
Suominen Corporation Annual Report 2015

Suominen in brief / How we create value / Year 2015 / Business / Sustainability / Governance / Financial Statements
Fair value through profit
or lossAt amoritized
cost
Derivatives, hedge
accounting applied
Carrying amount Fair value
Loans from financial institutions − 21,862 − 21,862 21,862
Debentures − 75,000 − 75,000 77,175
Other non-current liabilities 368 − − 368 368
Derivatives, no hedge accounting applied 30 − − 30 30
Derivatives, hedge accounting applied − − 509 509 509
Interest accruals − 914 − 914 914
Other current liabilities 262 − − 262 262
Trade payables − 44,682 − 44,682 44,682
Total 31 December 2015 660 142,458 509 143,627 145,802
Fair value through profit
or lossAt amoritized
cost
Derivatives, hedge
accounting applied
Carrying amount Fair value
Loans from financial institutions − 10,000 − 10,000 10,000
Debentures − 75,000 − 75,000 75,150
Other non-current liabilities 350 − − 350 350
Finance lease liabilities − 14 − 14 14
Derivatives, no hedge accounting applied 121 − − 121 121
Derivatives, hedge accounting applied − − 197 197 197
Interest accruals − 902 − 902 902
Other current liabilities 729 − − 729 729
Trade payables − 47,403 − 47,403 47,403
Total 31 December 2014 1,200 133,319 197 134,716 134,866
Financial liabilities are classified as current liabilities if they mature within 12 months from the end of the reporting period.
A financial liability or a part of a financial liability is removed from the statement of financial position when the liability is extinguished, i.e. when the obligation specified in the contract is discharged or cancelled or expired.
Derivative instruments are presented in Note 19 of the consolidated financial statements.
Interest-bearing liabilities are presented in Note 17 of the consolidated financial statements.
Trade payablesTrade payables are measured at amortized cost. The carrying amount of trade payables equals to fair value based on their short maturity.
Other financial liabilitiesFinancial liabilities at fair value through profit or loss which arose from acquisition of certain intangible assets. Their fair values are calculated by discounting the probable future cash flows to the end of the reporting period.
18. CLASSIFICATION OF FINANCIAL LIABILITIESEUR thousand
Consolidated financial statements (IFRS)
92 / 127
Suominen Corporation Annual Report 2015

Suominen in brief / How we create value / Year 2015 / Business / Sustainability / Governance / Financial Statements
Derivatives are initially recognized at fair value on the date a derivative contract is entered into and are subsequently re-measured at fair value. The method of recognizing the resulting gain or loss depends on whether the derivative is designated as a hedging instrument, and if so, on the nature of the item being hedged. Suominen designates derivatives as hedges of a particular risk associated with a recognized asset or liability or a highly probable forecasted transaction (cash flow hedge). The full fair value of a hedging derivative is classified as a current asset or liability. Trading derivatives are classified as a current assets or liabilities
Hedge accounting
The effective portion of changes in the fair value of derivatives that are designated and qualified as cash flow hedges is recognized in other comprehensive income and presented in fair value reserve in equity. Both the gain or loss relating to the realized interest rate swaps hedging variable rate loans and the ineffective portion of the hedging are recognized though profit or loss in financial items. Suominen had no interest rate swaps in 2015. Both the realized gain or loss of the electricity derivatives as well as the ineffective portion of the hedging are recognized through profit or loss as an adjustment of electricity expenses.
Currency forward contracts designated to hedge forecasted cash flows related to acquisition of certain assets in property, plant and equipment are classified as hedging instruments and thus hedge accounting is
19. DERIVATIVE INSTRUMENTSEUR thousand
applied. The effective portion of changes in the fair value of these derivatives is recognized in other comprehensive income and presentd in fair value reserve equity until the liabilility related to acquisition of the asset is recognized in the statement of financial position. When the liability is recognized in the statement of financial position, the portion of the fair value of the derivative recognized in fair value reserve is reclassified to adjust the acquisition cost of the asset, and future changes in fair value of the derivative are recognized in profit or loss in financial items.
The effective portion of currency hedges to hedge net investments in foreign operations (equity hedge) is recognized in exchange differences in other comprehensive income and the ineffective portion in the exchange differences in financial items. On the disposal of the foreign operation the exchange differences recognized in equity are reclassified in profit or loss.
When a hedging instrument expires or is sold, or when a hedge no longer meets the hedge accounting criteria, any cumulative gain or loss existing in equity at that time remains in equity and is recognized in profit or loss when the forecasted transaction is ultimately recognized in profit or loss. If a forecast transaction is no longer expected to incur, the cumulative gain or loss recognized in equity is immediately recognized in profit or loss in the same line item in statemen of profit or loss where the forecasted transaction would have been recognized.
Derivative receivables and liabilities in statement of financial position 2015 2014
Receivables
Derivatives, hedge accounting applied − 12
Liabilities
Derivatives, hedge accounting applied 509 121
Derivatives, hedge accounting not applied 30 197
At the inception of hedge accounting, Suominen documents the relationship between the hedged item and the hedging instrument as well as the aim for the risk management and the hedging strategy. At the inception of the hedge the Group tests and documents the effectiveness of the hedging relationship by assessing the ability of the hedging instrument to offset the fair value changes arising from the hedged item. The Group tests effectiveness retrospectively also at the end of each reporting period.
Derivative instruments at fair value through profit or loss
Some of the Group’s derivative transactions, while providing economic hedges, do not qualify for hedge accounting under IAS 39, and therefore changes in the fair values of these derivative instruments are recognized immediately in profit or loss.
Nominal and fair values of derivative contracts 2015 2014
Nominal valueFair value,
netFair value,
positiveFair value,
negative Nominal valueFair value,
netFair value,
positiveFair value,
negative
Currency forward contracts
Hedge accounting applied 16,114 -267 − -267 32,310 -114 − -114
Hedge accounting not applied 3,196 -30 − -30 3,997 -121 − -121
Electricity forward contracts
Hedge accounting applied 1,229 -242 − -242 1,031 -71 12 -83
Consolidated financial statements (IFRS)
93 / 127
Suominen Corporation Annual Report 2015

Suominen in brief / How we create value / Year 2015 / Business / Sustainability / Governance / Financial Statements
Derivative instruments in profit or loss 2015 2014
Cost of goods sold
Currency derivatives, hedge accounting not applied -6 −
Ineffective part of cash flow hedging, electricity derivatives -73 180
Cash flow hedging, electricity derivatives, realized -206 -356
Other operating income
Currency derivatives, hedge accounting not applied − 89
Ineffective part of cash flow hedging, electricity derivatives − 52
Other operating expenses
Currency derivatives, hedge accounting not applied -525 -205
Net financial expenses
Currency derivatives, ineffective part of hedging net investment in foreign entity -143 −
Currency derivatives, hedge accounting not applied 72 −
Cash flow hedging, interest rate swaps, effective − 46
Cash flow hedging, interest rate swaps, discontinuing of hedge accounting − -949
Interest rate differences of currency derivatives -51 −
Derivative instruments recognized in 2014 in other operating income and expenses are described in Note 24.
Derivative instruments in other comprehensive income
Exchange differences, hedging of net investment in foreign entity -2,724 -1,882
Fair value changes of cash flow hedges, electricity derivatives -324 -115
Fair value changes of cash flow hedges, currency derivatives -328 −
Cash flow hedges, fair value changes of interest rate hedges − 13
Cash flow hedges, electricity derivatives, amounts reclassified to profit or loss 206 356
Cash flow hedges, interest derivatives, amounts reclassified to profit or loss − 930
Cash flow hedges, currency derivatives, amounts reclassified to property, plant and equipment 91 −
Total -3,079 -698
The fair values of derivatives are recognized in the statement of financial position as gross amounts and they can be offset with each other only in case of breach of contractual terms or bankruptcy. If offset, the derivative receivables from counterparty would be EUR 0 thousand and liabilities EUR 539 thousand.
Fair values for electricity forward contracts are determined by using the quoted forward prices in Nordpool for the same period and discounting them with relevant interest rates to the end of the reporting period.
Fair values for currency forward contracts are determined by using the spot rates and relevant swap points based on interest rate differences at the end of the reporting period.
Consolidated financial statements (IFRS)
94 / 127
Suominen Corporation Annual Report 2015

Suominen in brief / How we create value / Year 2015 / Business / Sustainability / Governance / Financial Statements
2015 2014
Defined benefit liabilities in the statement of financial position
Present value of unfunded obligations 1,105 1,151Deficit 1,105 1,151
Change in defined benefit obligation
Present value of defined benefit obligation 1 January 1,151 1,024Charged to profit or loss:Past service cost - plan amendments -34 −Interest expenses 21 33Recognized in profit or loss -14 33Remeasurements:Actuarial gain (-) / loss (+) from change in demographic assumptions − 0Actuarial gain (-) / loss (+) from change in financial assumptions 26 150Total remeasurments 26 150Benefits paid -59 -57Present value of defined benefit obligation 31 December 1,105 1,151
Changes in plan assets
Plan assets 1 January − −Employer contributions 59 57Benefits paid -59 -57Plan assets 31 December − −
Remeasurements recognized in other comprehensive income
Recognized in other comprehensive income 1 January (gain - / loss +) 379 229Actuarial (gain) / loss on defined benefit obligation during the reporting period 26 150Recognized in other comprehensive income 31 December (gain - / loss +) 405 379
Significant actuarial assumptions
Discount rate (%) 2.00 2.20Rate of future price inflation (%) 1.80 1.80Average remaining service period (years) 15.7 15.7
Sensitivity analysis of actuarial assumptions
Decrease in discount rate by 0.25 percentage points Effect on defined benefit obligation 37 40Increase in discount rate by 0.25 percentage points Effect on defined benefit obligation -37 -37
Expected payments to plan participants in the future years from the defined benefit obligation
Within 1 year 28 27Between 1–2 years 56 56Between 3–5 years 68 51Between 6–10 years 367 329Total 520 463
20. DEFINED BENEFIT PLANSEUR thousand
Suominen has a defined benefit termination plan in Italy (TFR, Trattamento di Fine Rapporto). The plan is unfunded and closed for new entrants. The benefits paid are based, among other things, on service years and end salary of the participants. The obligation is determined based on calculation made by independent actuaries.
The defined benefit obligations are measured as the present value of the estimated future cash flows using interest rates of government securities that have maturity terms approximating the terms of related liabilities or similar long-term interests. Plan assets, if any, are recognized at fair value at the end of the reporting period.
For the defined benefit plans, costs are assessed using the projected unit credit method. Under this method the cost is charged to profit or loss so as to spread over the service lives of employees.
Only current and past service costs as well as net interest on net defined benefit liability can be recognized in profit or loss. Service costs are recognized in profit or loss as employee benefits and net interest in financial items. Remeasurements of net defined benefit liability, such as actuarial gains and losses, are recognized in other comprehensive income in the period in which they occur with no subsequent recycling to profit or loss.
Consolidated financial statements (IFRS)
95 / 127
Suominen Corporation Annual Report 2015

Suominen in brief / How we create value / Year 2015 / Business / Sustainability / Governance / Financial Statements
21. PROVISIONSEUR thousand
A provision is recognized when there is a present legal or constructive obligation arising from past events and it is probable, that fulfillment of the obligation requires payment and generates outflow of economic benefits from the company, and when the amount of the obligation can be measure reliably. Provisions are recognized as liabilities in the statement of financial position. The amount recognized as a provision is the best estimate of the expenditure required to settle the present obligation at the end of the reporting period. If the time value of money is material, provisions are discounted.
A restructuring provision is recognized only when a detailed and fully compliant plan has been prepared for it and implementation of the plan has been started or notification of it has been made known to those whom the arrangement concerns.
Contingent liabilities are not recognized as liabilities in the statement of financial position. They are possible obligations which have not yet been confirmed and are reported separately in Note 37 of the consolidated financial statements.
22. TRADE PAYABLES AND OTHER LIABILITIESEUR thousand
23. ENTITY-WIDE DISCLOSURESEUR thousand
The net sales of Suominen Group consist entirely of sales of non-wovens. Sales to two customers exceed each 10 percent of total net sales. Net sales to one of these customers amounted to EUR 85.6 (75.9) million and to the other EUR 65.2 (42.9) million.
2015 2014
Provisions 1 January − 132
Used during the reporting period − -132
Provisions 31 December − −
Other non-current liabilities 2015 2014
Liability from acquisition of intangible assets 368 350
Accrued expenses and deferred income 283 228
Total other non-current liabilities 651 578
Liability from acquisition of intangible assets is disclosed in Note 18.
Current liabilities
Trade payables 44,682 47,403
Advances received 596 628
Other liabilities 1,474 2,023
Accrued expenses and deferred income 9,727 10,042
Total trade payables and other current liabilities 56,479 60,096
Accrued expenses and deferred income include, among others, accrued interest expenses, accruals for annual and other discounts, accrued personnel expenses and other accruals.
Other liabilities include, among others, liabilities from indirect taxes and current portion of the liability from acquisition of intangible assets (Note 18).
Net sales by geographical destination 2015 2014
Finland 2,724 2,516
Rest of Europe 159,854 139,738
USA 234,304 233,309
Rest of North and South America 37,331 15,633
Rest of the world 9,830 10,565
Total 444,042 401,762
Net sales by business area
Convenience 411,542 369,396
Care 32,427 32,318
Unallocated exchange differences of sales 74 48
Total 444,042 401,762
Property, plant and equipment and intangible assets by geographical location
Finland 14,431 13,192
Rest of Europe 26,512 26,598
USA 77,543 66,869
Brazil 8,215 10,068
Total 126,702 116,727
Currency analysis of trade payables
EUR 23,585 22,141
USD 20,901 25,081
BRL 154 163
Other currencies 43 18
Total 44,682 47,403
A provision of EUR 132 thousand was recognized in 2013 for restructuring costs of the Flexibles business unit. The provision was derecognized in 2014 in connection with the disposal of the Flexibles business unit.
Consolidated financial statements (IFRS)
96 / 127
Suominen Corporation Annual Report 2015

Suominen in brief / How we create value / Year 2015 / Business / Sustainability / Governance / Financial Statements
24. OTHER OPERATING INCOME AND EXPENSESEUR thousand
Gains from the disposal of property, plant and equipment and intangible assets, insurance compensations and revenues other than from product sales, such as rental income and proceeds from sale of recycled products, are recognized as other operating income. In 2014 also gains from currency derivatives hedging cash flows from operations as well as gains from the ineffective portion of electricity derivatives, for which hedge accounting is applied, were recognized as other operating income. In 2015 these gains have been recognized in the statement of profit or loss in the same line item as the hedged item. Comparative information has not been restated as the effect of the items was immaterial.
Losses from the sales of assets as well other expenses not associated with ordinary operations are recognized as other operating expenses. In 2014 also losses on the ineffective portion of electricity derivatives, for which hedge accounting is applied, and losses from currency derivatives hedging cash flows from operations were recognized as other operating expenses. In 2015 these losses have been recognized in the statement of profit or loss in the same line item as the hedged item. Comparative information has not been restated as the effect of the items was immaterial.
25. FEES PAID TO AUDITORSEUR thousand
Fees paid to auditors are included in administration expenses.
PricewaterhouseCoopers Oy has been acting as the principal auditor of the Group and the parent company until the Annual General Meeting held on 19 March 2015, and Ernst & Young Oy has been acting as the principal auditor of the Group and the parent company since the Annual General Meeting.
Other operating income 2015 2014
Gains from disposal of intangible assets and property, plant and equipment − 19
Indemnities 293 154
Rental income 349 393
Sales of recycled products 1,806 1,599
Currency derivatives, hedge accounting not applied − 89
Ineffective part of cash flow hedging (electricity derivatives) − 52
Other operating income 189 350
Total 2,637 2,655
Recycled products consist of waste generated in the manufacturing process as well as products which do not fulfill quality requirments. These products are sold for recycling.
The future non-cancellable minimun lease payments (rental income) are disclosed in Note 37 of the consolidated financial statements.
Other operating expenses
Credit losses -2 -7
Currency derivatives, hedge accounting not applied -525 -205
Other operating expenses -335 -1,644
Total -862 -1,857
Fees paid to auditors 2015 2014
Fees for statutory audit, EY -329 −
Fees for statutory audit, PWC -96 -397
Official statements, EY -3 −
Other services, principal auditor (EY 2015 / PWC 2014) -26 -227
Total -453 -624
Consolidated financial statements (IFRS)
97 / 127
Suominen Corporation Annual Report 2015

Suominen in brief / How we create value / Year 2015 / Business / Sustainability / Governance / Financial Statements
26. EMPLOYEE BENEFITSEUR thousand
2015 2014
Wages and salaries -34,778 -32,276
Share-based payments -1,238 -198
Defined benefit plans 34 −
Pensions, defined contribution plans -1,914 -1,364
Other personnel expenses -16,154 -11,085
Total -54,050 -44,923
Average number of personnel, continuing operations 614 591
Average number of personnel 614 826
Number of personnel, end of reporting period 636 587
in Finland 124 99
Management remuneration is disclosed in detail in Note 36 of the consolidated financial statements.
Share-based payments are disclosed in more detail in Note 33 of the consolidated financial statements.
Defined benefit plans are disclosed in more detail in Note 20 of the consolidated financial statements.
Pension benefits
The Group has several pension plans in accordance with local conditions and practices where it operates. The plans are generally funded through premium payments to insurance companies or similar entities. The pension schemes are in accordance with local legislation and based on established local practice. Pension schemes may include additional pension benefits, options for early retirement, or compensation for disability.
Pension schemes are classified either as defined contribution pension plans or defined benefit pension plans. A defined contribution pension plan is a plan under which the Group pays fixed contributions into a separate entity and has no obligation to pay further contributions if the separate entity has no sufficient assets to pay all employee benefits. The contributions to defined contribution plans are charged to profit or loss in the period to which the contributions relate.
Suominen has a defined benefit termination plan in Italy (TFR) (Note 20). In other countries Suominen has defined contribution pension plans.
Consolidated financial statements (IFRS)
98 / 127
Suominen Corporation Annual Report 2015

Suominen in brief / How we create value / Year 2015 / Business / Sustainability / Governance / Financial Statements
Depreciation, amortization and impairment losses by function 2015 2014
Depreciation and amortization Cost of goods sold -15,476 -13,257Sales and marketing expenses -643 -592Research and development -922 -899Administration expenses -934 -828Total continuing operations -17,975 -15,576
Impairment losses and reversals of impairment lossesCost of goods sold 530 −Administration expenses -238 −Total continuing operations 291 −
Total by functionCost of goods sold -14,946 -13,257Sales and marketing expenses -643 -592Research and development -922 -899Administration expenses -1,173 -828Total continuing operations -17,684 -15,576
Discontinued operations − -1,340Total -17,684 -16,916
Depreciation, amortization and impairment losses by asset category
Depreciation and amortization by asset categoryIntangible rights -1,559 -1,241Other intangible assets -643 -621Buildings and constructions -1,627 -1,585Machinery and equipment -14,139 -12,117Other tangible assets -8 -12Total continuing operations -17,975 -15,576
Impairment losses and reversals of impairment lossesMachinery and equipment 530 −Property, plant and equipment, advance payments and assets under construction -183 −Intangible assets, advance payments and assets under construction -56Total continuing operations 291 −
Total by asset categoryIntangible rights -1,559 -1,241Other intangible assets -643 -621Intangible assets, advance payments and assets under construction -56 −Buildings and constructions -1,627 -1,585Machinery and equipment -13,609 -12,117Other tangible assets -8 -12Property, plant and equipment, advance payments and assets under construction -183 −Total continuing operations -17,684 -15,576Discontinued operations − -1,340Total -17,684 -16,916
27. DEPRECIATION, AMORTIZATION AND IMPAIRMENT LOSSESEUR thousand
The carrying amounts of property, plant and equipment as well as of intangible assets are assessed to determine whether there are any indications that the carrying amounts of the assets exceed their recoverable amounts and an impairment loss should be recognized. Indications of the assets’ possible impairment can be a significant decline in an asset’s market value, adverse changes in the business environment, adverse changes in the extent to which or manner in which an asset is used or expected to be used, or a deterioration in financial performance below what was expected.
If such indications of impairment exist, the recoverable amounts are measured for those assets for which there are indications of impairment. Recoverable amount is the higher of fair value of the asset less costs of disposal and value in use. When measuring an asset’s value in use, the future cash flows derived from the asset are discounted by using discount rates which reflect the average cost of capital before taxes of the asset or, if the asset belongs to a cash generating unit, of that cash generating unit. The risk inherent in the value in use is captured by analysing variations in the amount or timing of cash flows.
An impairment loss of an asset can be reversed if a positive change in the estimates of the recoverable amount has occured. The impairment loss made in prior years is reversed no more than up to the value which would have been determined for the asset, net of amortization or depreciation, had no impairment loss been recognized in prior years. In 2015 a reversal of an impairment loss on a production line in Nakkila plant in Finland was made as the line was re-opened and taken into production use.
The impairment losses recognized in connection of disposal of Flexibles business in 2014 were recognized in the statement of profit or loss in loss from discontinued operations.
Impairment testing of goodwill is presented in Note 5.
Consolidated financial statements (IFRS)
99 / 127
Suominen Corporation Annual Report 2015

Suominen in brief / How we create value / Year 2015 / Business / Sustainability / Governance / Financial Statements
28. FINANCIAL INCOME AND EXPENSESEUR thousand
29. NON-RECURRING ITEMSEUR thousand
Financial income 2015 2014
Interest income from loans and receivables 716 712
Other interest income 7 −
Cash flow hedging, interest rate swaps, effective − 46
Available-for-sale assets, disposal 11 159
Fair value changes of liabilities at fair value through profit or loss 44 −
Total 778 917
Financial expenses
Interest expenses on liabilities at amortized cost -3,361 -3,432
Interest expenses on defined benefit plans -21 -33
Other interest expenses -19 −
Currency derivatives, interest rate difference -51 −
Cash flow hedging, interest rate swaps, discontinuing of hedge accounting − -949
Transaction costs recognized in refinancing − -1,999
Fair value changes of liabilities at fair value through profit or loss − -15
Financial expenses on sale of trade receivables -112 -166
Other financial expenses -954 -1,482
Available-for-sale assets, disposal -364 −
Total -4,882 -8,076
Net exchange rate differences -1,199 -916
Total financial income and expenses -5,302 -8,075
Interest expenses are accrued for and mainly recognized in profit or loss for each period. If an asset is a qualifying asset as defined in IAS 23 Borrowing Costs, the borrowing costs that are directly attributable to the acquisition, construction or production of a qualifying asset are capitalized to the acquisition cost of the asset. The capitalization applies mainly to property, plant and equipment and intangible assets.
Capitalized borrowing costs during the reporting period were EUR 74 thousand. The capitalization rate used was 4.71 percent until 30 November and 5.12 percent from there on.
Non-recurring items are significant transactions which are unusual or infrequent in nature, like impairment losses or reversals of impairment losses, gains or losses from the sales of property, plant and equipment or intangible assets or other assets and restructuring costs.
Non-recurring items in 2015, EUR +0.5 million, consisted of reversal of previously made impairment losses of the re-opened production line in Nakkila plant in Finland.
Non-recurring items in 2014 totaled EUR -1.0 million, of which EUR -1.2 million were costs related to restructuring measures and to the acquisition of the Brazilian unit and EUR 0.2 million were items related to the closing down of the fiber production in Nakkila plant in Finland in 2012.
Currency differences in operating profit
Net sales 794 234
Cost of goods sold -401 -132
Other operating income − 104
Other operating expenses 212 -208
By function 2015 2014
Cost of goods sold 530 −
Administration expenses − -1,274
Other operating expenses − 320
Total 530 -954
By expense category
Restructuring costs − -653
Other non-recurring items − -301
Reversal of impairment losses 530 −
Total 530 -954
Consolidated financial statements (IFRS)
100 / 127
Suominen Corporation Annual Report 2015

Suominen in brief / How we create value / Year 2015 / Business / Sustainability / Governance / Financial Statements
30. INCOME TAXESEUR thousand
The consolidated financial statements include current taxes, which are based on the taxable results of the group companies for the reporting period together with tax adjustments for previous reporting periods, calculated in accordance with the local tax rules, and the change in deferred tax liabilities and assets.
Income taxes which relate to items recognized in other comprehensive income are also recognized in other comprehensive income.
The Group’s deferred tax liabilities and assets have been calculated for temporary differences, which have been obtained by comparing the carrying amount of each asset or liability item with their tax bases. Deferred tax assets are recognized for deductible temporary differences and tax losses to the extent that it is probable that taxable profit will be available, against which tax credits and deductible temporary differences can be utilized. In calculating deferred tax liabilities and assets, the tax rate used is the tax rate in force at the time of preparing the financial statements or which has been enacted by end of the reporting period.
Principal temporary differences arise from depreciation and amortization of property, plant and equipment and intangible assets, defined benefit plans, recognition of net assets of acquired companies at fair value, measuring available-for-sale assets and derivative instruments at fair value, share-based payments and confirmed tax losses.
Income tax charge in statement of profit or loss 2015 2014
Current income tax charge -7,331 -7,572
Adjustments in respect of current income tax of previous years -530 199
Change in deferred tax assets 143 233
Change in deferred tax liabilities -1,602 -505
Other income taxes -137 −
Total income tax charge -9,456 -7,645
Income taxes for discontinued operations − -197
Total -9,456 -7,842
Income taxes recognized in other comprehensive income
Exchange differences -626 -427
Cash flow hedges, fair value changes 65 20
Cash flow hedges, reclassified to profit or loss -41 -257
Available-for-sale assets, fair value changes 64 -37
Available-for-sale assets, reclassified to profit or loss -93 −
Defined benefit plans, remeasurements 8 50
Total taxes recognized in other comprehensive income -624 -650
Income taxes recognized in other equity
Retained earnings, adjustment of interest expense on hybrid bond 228 185
Total recognized in other equity 228 185
Consolidated financial statements (IFRS)
101 / 127
Suominen Corporation Annual Report 2015

Suominen in brief / How we create value / Year 2015 / Business / Sustainability / Governance / Financial Statements
The Group companies have tax losses, totalling EUR 26.3 (32.7) million, which can be applied against future taxable income. A deferred tax asset has not been recognized for all tax losses, due to the uncertainty regarding the extent to which they can be used. When preparing 2015 financial statements, the management has estimated that Suominen is able to utilize the unused tax losses for which deferred tax asset has been recognized. In addition, there are several years before the tax losses expire or there is no expiry date for the losses.
Deferred tax assets are recognized for deductible temporary differences and tax losses to the extent that it is probable that taxable profit will be available, against which tax credits and deductible temporary differences can be utilized. Changes in tax rates have been taken into account when calculating deferred taxes. Corporate income tax rate in Finland is 20 (20) percent.
Deferred tax liability has not been recognized in 2015 or 2014 of the undistributed earnings of Finnish or foreign subsidiaries, as the majority of such earnings can be transferred to the owner without any tax consequences.
Reconciliation of income tax expense calculated at statutory tax rates with income tax expense in the statement of profit or loss 2015 2014
Profit before income taxes 26,476 17,821
Income taxes at the tax rate applicable to the parent -5,295 -3,564
Difference due to different tax rates of foreign subsidiaries -3,291 -2,003
Tax exempt income and non-deductible expenses 39 -1,837
Effect of changes in tax rates and tax laws -19 −
Losses, for which no deferred tax asset is recognized -262 −
Deferred taxes recognized during the reporting period in respect of previous years' temporary differences 545 −
Deferred taxes reversed during the reporting period -902
Withholding taxes and adjustments in respect of current income tax of previous periods -666 199
Use of losses, for which no deferred tax asset has been recognized 204 −
Eliminations 191 -440
Income taxes in the statement of profit or loss -9,456 -7,645
Effective tax rate, percent 35.7 42.9
Tax assets and liabilities in the statement of financial position
Deferred tax assets 4,491 5,516
Assets for current tax 1,874 1,682
Deferred tax liabilities 10,890 8,789
Liabilities for current tax 47 246
Consolidated financial statements (IFRS)
102 / 127
Suominen Corporation Annual Report 2015

Suominen in brief / How we create value / Year 2015 / Business / Sustainability / Governance / Financial Statements
Reconciliation of deferred tax assets1 January 2015
Exchange difference
Discontinued operations
Business combinations
Recognized in profit or loss
Recognized in other
comprehensive income or in
equity Reclassifications31 December
2015
Employee benefits 244 − − − -15 8 -2 235
Cash flow hedging -7 − − − 30 24 − 47
Available-for-sale assets -37 − − − 37 − −
Property, plant and equipment and intangible assets 1,930 -288 − − -106 − -284 1,252
Tax losses 2,693 − − − -1,165 − 460 1,988
Other temporary differences 693 -5 − − 1,399 -943 -173 970
Total 5,516 -293 − − 143 -875 − 4,491
1 January 201431 December
2014
Employee benefits 154 − − − 40 50 − 244
Cash flow hedging 250 − − − -20 -237 − -7
Available-for-sale assets − − − − − -37 − -37
Property, plant and equipment and intangible assets 1,037 5 − 1,153 -266 − − 1,930
Tax losses 2,975 − -629 − 347 − − 2,693
Other temporary differences 1,362 26 -1,068 241 132 − − 693
Total 5,778 31 -1,697 1,394 233 -224 − 5,516
Reconciliation of deferred tax liabilities1 January 2015
Exchange difference
Discontinued operations
Business combinations
Recognized in profit or loss
Recognized in other
comprehensive income or in
equity Reclassifications31 December
2015
Property, plant and equipment and intangible assets 7,725 861 − − -461 − -227 8,821
Other temporary differences 1,064 117 − − -596 − 227 2,004
Available-for-sale assets − − − − − 65 − 65
Exchange differences and hedging of net investment in foreign entities − − − − -545 -545 − −
Total 8,789 978 − − -1,602 -479 − 10,890
1 January 201431 December
2014
Property, plant and equipment and intangible assets 7,126 876 -235 − 43 − − 7,725
Other temporary differences 57 89 -57 − -975 − − 1,064
Exchange differences and hedging of net investment in foreign entities − − − − 427 -427 − −
Total 7,183 965 -292 − -505 -427 − 8,789
Consolidated financial statements (IFRS)
103 / 127
Suominen Corporation Annual Report 2015

Suominen in brief / How we create value / Year 2015 / Business / Sustainability / Governance / Financial Statements
31. DISCONTINUED OPERATIONSEUR thousand
A discontinued operation is a segment or a unit representing a significant geographical area, which has been disposed of or is classified as held for sale. The profit for the period attributable to the discontinued operation is presented separately in the consolidated statement of profit or loss. Also post-tax gains and losses recognized on the measurement to fair value less costs to sell or on the disposal of the asset or disposal group are presented in the statement of profit or loss as the result of discontinued operations.
Suominen had no discontinued operations in 2015.
Suominen divested in July 2014 its Flexibles business unit, which focused on flexible packaging manufacturing. In the consolidated financial statements of 2014, the result of the Flexibles business unit until the date of divestment, impairment losses recognized due to the divestment as well as the loss arising from the divestment are reported as loss of discontinued operations. In total the loss arising from discontinued operations in 2014 due to the divestment was EUR 5.2 million.
Discontinued operations 2014
Net sales 32,521
Expenses -31,608
Pre-tax profit of discontinued operations 913
Income taxes -197
Post-tax profit of discontinued operations 717
Impairment losses and costs to sell -5,921
Loss of discontinued operations for the reporting period -5,204
Cash flow from discontinued operations
Cash flow from operations 774
Cash flow from investments -376
Cash flow from financing -1,800
Change in cash and cash equivalents -1,402
The effect of divestment of Flexibles business unit on the Group's financial position
Property, plant and equipment and intangible assets -17,942
Non-current receivables -1,511
Inventories -7,340
Trade and other current receivables -9,004
Cash and cash equivalents -997
Non-current interest-bearing liabilities 4,642
Trade payables and other current liabilities 10,157
Net assets -21,995
Effect on cash flow
Cash consideration 5,733
Cash and cash equivalents of discontinued operations -997
Net effect on cash flow 4,736
Unpaid part of the consideration, EUR 0.8 million (EUR 1.0 million on 31 December 2014) is recognized in the statement of financial position as a non-current receivable (Note 11).
32. BUSINESS COMBINATIONSEUR thousand
Suominen had no business combinations in 2015.
Suominen acquired the Brazilian unit of the Ahlstrom Home and Personal nonwovens business on 10 February 2014. The main parts of the Home and Personal nonwovens business were acquired already in 2011, but due to delays in receiveing certain licenses and authorizations the acquisition of the Brazilian unit was prolonged. Thanks to the acquisition, Suominen’s nonwovens business currently covers also the South American markets.
The statement of financial position and of profit or loss of the Brazilian company were consolidated into Suominen’s consolidated financial statements as from 1 February 2014. The acquisition consisted of acquisition of the shares in the local company. The enterprise value of the acquisition was EUR 17.5 million and the final consideration EUR 19.6 million.
If the transaction would have taken place in the beginning of 2014 and the transaction costs incurred in 2013, Suominen Group’s net sales would have been EUR 403.3 million and operating profit EUR 26.3 million in 2014.
Purchase consideration Fair value
Cash and cash equivalents 19,558
Total purchase consideration 19,558
Initial amounts of assets acquired and liabilities assumed
Fair values of acquired
net assets
Property, plant and equipment 10,779
Intangible assets 20
Other non-current receivables 2,737
Inventories 3,195
Trade and other receivables 3,423
Cash and cash equivalents 297
Total assets 20,452
Financial liabilities 416
Other liabilities 478
Total liabilities 894
Net assets 19,558
Transaction costs arising from the acquisition, EUR 0.2 million, are recognized as non-recurring items in 2014.
Consolidated financial statements (IFRS)
104 / 127
Suominen Corporation Annual Report 2015

Suominen in brief / How we create value / Year 2015 / Business / Sustainability / Governance / Financial Statements
33. SHARE-BASED PAYMENTS
Suominen has share-based incentive plans targeted to the key employees of the Group. In accordance with the terms of the plans, shares of Suominen Corporation are granted to the participants if vesting conditions are met. The rewards are partly settled in cash.
The granted amount of the incentive plans settled in shares is measured at fair value at the grant date, and the cash-settled part of the plans is measured at fair value at the reporting or payment date.
The expenses arising from the incentive plans have been recognized in profit or loss during the vesting period. The cash-settled portion of the incentive plans is recorded as a liability in the statement of financial position, if it has not been paid, and the portion settled in shares has been recorded in retained earnings in equity. Suominen has recognized other personnel costs arising from the share-based incentive plans to the extent it is liable to pay them.
Share-based incentive plan 2012–2014The share-based incentive plan was targeted to the key personnel of the Group. The program was aiming at combining the targets of the owners and the key personnel to increase the value of the company and to increase commitment of the key personnel by offering them a long-term incentive plan based on the ownership of the company. The share-based incentive plan was settled in March 2015. In accordance with the terms and conditions of the plan, in total 802,644 shares in Suominen were transferred to seven key employees. The total expense in 2015 was EUR 828 thousand, of which EUR 153 thousand was settled in shares and EUR 675 thousand in cash.
At the end of the reporting period 2014, the liability arising from the cash-settled part was in total EUR 228 thousand and the part to be settled in shares and recognized in equity was in total EUR 184 thousand. The total expense in 2014 was EUR 198 thousand.
Share-based incentive plans 2015–2017The Board of Directors of Suominen Corporation approved on 4 December 2014 two new share-based incentive plans for the Group management and key employees. The aim of the new plans is to combine the objectives of the shareholders and the persons participating in the plans in order to increase the value of the company in the long-term, to bind the participants to the company, and to offer them competitive reward plans based on earning and accumulating the company s shares.
Performance share plan 2015–2017
The new performance share plan includes one vesting period, calendar years 2015–2017. The Board of Directors of Suominen Corporation will decide on further vesting periods. The Board of Directors will decide on the plan’s vesting conditions and required performance levels for
each condition at the beginning of a vesting period. The rewards to be paid on the basis of the vesting period 2015-2017 correspond to the value of an approximate maximum total of 2,300,000 Suominen Corporation shares (including also the portion to be settled in cash). The Board of Directors is entitled to reduce the rewards agreed in the performance share plan if the limits set by the Board of Directors for the share price are reached.
Matching share plan 2015–2017
The new matching share plan includes one three-year vesting period, calendar years 2015–2017. The prerequisite for receiving reward on the basis of this plan is that a person participating in the plan owns or acquires the company s shares up to the number determined by the Board of Directors. Furthermore, receiving of reward is tied to the continuance of participant s employment or service upon reward payment.
The members of the Corporate Executive Team and the Corporate Leadership Team belong to the target group of the matching share plan. The rewards to be paid on the basis of the matching share plan correspond to the value of an approximate maximum total of 550,000 Suominen Corporation shares (including also the portion to be settled in cash).
Reward payment and ownership obligation for the management
The potential rewards from the vesting periods 2015–2017 will be settled partly in the company’s shares and partly in cash in 2018. The cash portion is intended to cover income taxes and tax-related costs arising from the reward to the participant. No reward will be paid, if a participant s employment or service ends before the reward payment.A member of the Corporate Executive Team must hold 50 percent of the net number of shares given on the basis of the plans, as long as his or her shareholding in total corresponds to the value of half of his or her annual gross salary. The President & CEO must hold 50 percent of the net number of shares given on the basis of the plans until his or her shareholding in total corresponds to the value of his or her annual gross salary. Such number of shares must be held as long as the participant’s employment or service in a group company continues
Share-based incentive plan 2016–2018The Board of Directors of Suominen Corporation approved on 8 December 2015 a new vesting period in the share-based incentive plan (performance share plan) for the Group management and key employees. The new vesting period includes calendar years 2016–2018. The aim of the plan is to combine the objectives of the shareholders and the persons participating in the plan in order to increase the value of the company in the long-term, to bind the participants to the company, and to offer them competitive reward plan based on earning and accumulating the company s shares.
The rewards to be paid on the basis of the vesting period 2016–2018 correspond to the value of an approximate maximum total of 1,225,000
Suominen Corporation shares (including also the portion to be settled in cash). The Board of Directors will decide separately on new vesting periods. The Board of Directors will decide on the plan’s vesting conditions and required performance levels for each condition at the beginning of a vesting period. The Board of Directors will be entitled to reduce the rewards agreed in the performance share plan if the limits set by the Board of Directors for the share price are reached.
Reward payment and ownership obligation for the management
The potential rewards from the vesting periods 2016–2018 will be settled partly in the company’s shares and partly in cash in 2019. The cash portion is intended to cover income taxes and tax-related costs arising from the reward to the participant. No reward will be paid, if a participant s employment or service ends before the reward payment.
A member of the Corporate Executive Team must hold 50 percent of the net number of shares given on the basis of the plan, as long as his or her shareholding in total corresponds to the value of half of his or her annual gross salary. The President & CEO must hold 50 percent of the net number of shares given on the basis of the plan until his or her shareholding in total corresponds to the value of his or her annual gross salary. Such number of shares must be held as long as the participant’s employment or service in a group company continues.
Measurement of instruments granted during the reporting period
Share price at grant date, EUR 1,11
Expected annual dividends, EUR 0,01
Share price at the end of the reporting period, EUR 1,24
Matching share plan, finance cost per share, EUR 0,17
Fair value at the end of the reporting period, EUR 2,318,619
Consolidated financial statements (IFRS)
105 / 127
Suominen Corporation Annual Report 2015

Suominen in brief / How we create value / Year 2015 / Business / Sustainability / Governance / Financial Statements
Information on share-based incentive plans
Share-based incentive plan
2012–2014
Matching share plan 2015–2017
Share-based incentive plan
2015–2017
Share-based incentive plan
2016–2018
Total / weighted
average
Maximum number of shares, including the portion to be settled in cash 2,383,333 550,000 2,300,000 1,225,000 6,458,333
Initial grant date 17 February 2012 30 January 2015 30 January 2015 8 December 2015
Vesting date 30 April 2015 31 May 2018 31 May 2018 31 May 2019
Vesting conditions
Employment precondition until
reward payment
Employment precondition until
reward payment
Employment precondition until
reward payment
Employment precondition until
reward payment
Cumulative EBITDA, cumulative cash flow
Share ownership
Net sales growth, EBIT %, ROI %
Net sales growth, EBIT %, ROI %
Maximum contractual life, years 3.2 3.3 3.3 3.5
Remaining contractual life, years − 2.4 2.4 3.4 2.7
Number or persons at the end of reporting period − 13 13 13
Payment method Shares and cash Shares and cash Shares and cash Shares and cash
Changes in 2015Share-based incentive
plan 2012–2014Matching share plan 2015–2017
Share-based incentive plan 2015–2017
Share-based incentive plan 2016–2018 Total
Outstanding at the beginning of the period 2,383,333 − − − 2,383,333
Granted − 577,388 2,392,500 1,225,000 4,194,888
Forfeited -722,150 -50,000 -250,000 − -1,022,150
Exercised -1,661,183 − − − -1,661,183
Outstanding at the end of the period − 527,388 2,142,500 1,225,000 3,894,888
Effect on the profit for the period and on financial position in 2015
EUR thousandShare-based incentive
plan 2012–2014
Share-based incentive plans
2015–2017
Share-based incentive plan
2016–2018 Total
Expense for the reporting period -828 -431 -15 -1,274
Recognized in equity 153 156 7 316
Recognized as liability − 275 8 283
Consolidated financial statements (IFRS)
106 / 127
Suominen Corporation Annual Report 2015

Suominen in brief / How we create value / Year 2015 / Business / Sustainability / Governance / Financial Statements
34. EARNINGS PER SHARE
Basic earnings per share are calculated by dividing the net result attributable to owners of the parent adjusted with interest on hybrid bond, net of tax by the weighted share-issue adjusted average number of shares outstanding during the reporting period, excluding shares acquired by the Group and held as treasury shares.
When calculating diluted earnings per share, the weighted share-issue adjusted average number of shares outstanding during the year is adjusted by the effect of the hybrid bond on the number of shares.
The dilutive effect of the hybrid bond on the number of shares is calculated by assuming that the remaining amount of the bond is fully converted into shares at the issuance date. In addition, the cumulative accrued interest during the whole loan period on the remaining loan amount is assumed to have been converted into shares at the issuance date.
When calculating diluted earnings per share the number of shares is adjusted also with the effects of the share-based incentive plans.
Earnings per share arising from continuing and discontinued operations are presented separately.
Profit for the period
EUR thousand 2015 2014
Profit for the period from continuing operations 17,020 10,177
Loss for the period from discontinued operations, total − -5,204
Profit for the period 17,020 4,973
Interest on hybrid bond net of tax -986 -739
Total 16,034 4,234
Number of shares
Average share-issue adjusted number of shares 250,943,177 248,013,178
Average diluted share-issue adjusted number of shares excluding treasury shares 291,044,343 284,764,016
Earnings per share
EUR
Continuing operations 0.06 0.04
Discontinued operations − -0.02
Total basic 0.06 0.02
Total diluted 0.06 0.02
Consolidated financial statements (IFRS)
107 / 127
Suominen Corporation Annual Report 2015

Suominen in brief / How we create value / Year 2015 / Business / Sustainability / Governance / Financial Statements
Adjustments to cash flow from operations 2015 2014
Adjustments to profit for the period
Income taxes 9,456 7,645
Financial income and expenses 5,302 8,075
Depreciation, amortization and impairment losses 17,684 15,576
Gains and losses from disposal of property, plant and equipment and intangible assets − -19
Changes in provisions − -132
Other non-cash flow items in profit for the period 428 8,807
Total 32,870 39,953
Cash flow statement in 2014 includes discontinued operations.
35. ADJUSTMENTS TO STATEMENT OF CASH FLOWSEUR thousand
36. RELATED PARTIES
Parties are considered to be related parties if a party is able to exercise control over the other or substantially influence its decision-making concerning its finances and business operations.
Suominen Group’s related parties include the parent of the Group (Suominen Corporation) and subsidiaries. In addition, the related parties of Suominen include the members of the Board of Directors, President & CEO and the members of the Corporate Executive Team as well as their family members and their controlled companies. In addition, shareholders who have a significant influence in Suominen through share ownership are included in related parties. Ahlstrom Corporation, including its subsidiaries and associated companies, was a related party through share ownership until 7 October 2014. Suominen has no associated companies.
The Annual General Meeting held on 19 March 2015 resolved that 40 percent of the annual remuneration for the Board of Directors is paid in Suominen Corporation’s shares. The number of shares transferred to the members of the Board of Directors as their remuneration payable in shares for 2015 was 86,989 shares. The shares were transferred on 5 June 2015 and the value of the transferred shares totaled EUR 79,800, or approximately EUR 0.91736 per share.
In its transactions with related parties Suominen follows the same commercial terms as in transactions with third parties.
During the review period in total 751,193 shares in Suominen were transferred to related parties in accordance with the terms of the vested share-based incentive plan. In total 325,861 shares were transferred to the President & CEO and 425,332 shares to other members of the Corporate Executive Team. In accordance with the terms of plan, part of the reward was a cash payment to cover related income taxes. The fair value of the shares and the cash part of the reward was EUR 1,637 thousand at the date when the shares were transferred.
No loans, guarantees or other collaterals have been given on behalf of related parties, with the exception of subsidiaries.
The members of the Board of Directors have no pension arrangements with Suominen.
The members of the Board of Directors have no specific agreements related to termination of the membership in the Board due to a public tender offer.
Remuneration of Board of Directors
2015 2014
EUR annual fee meeting fee annual fee meeting fee
Jorma Eloranta, Chair of the Board of Directors 50,000 5,500 50,000 5,000
Risto Anttonen, Deputy Chair of the Board 37,500 5,500 37,500 5,000
Hannu Kasurinen 28,000 5,500 28,000 4,000
Jaana Tuominen 28,000 5,500 28,000 −
Suvi Hintsanen (member of the Board of Directors until 19 March 2015) − 5,500 28,000 5,000
Andreas Ahlström (member of the Board of Directors from 19 March 2015) 28,000 − − −
Laura Raitio (member of the Board of Directors from 19 March 2015) 28,000 − − −
Heikki Mairinoja − − − 5,000
Total 199,500 27,500 171,500 24,000
Management remuneration
Consolidated financial statements (IFRS)
108 / 127
Suominen Corporation Annual Report 2015

Suominen in brief / How we create value / Year 2015 / Business / Sustainability / Governance / Financial Statements
Remuneration of the President & CEO as paid
EUR 2015 2014
Salaries 328,820 295,311
Bonuses 109,693 62,000
Share-based incentive plan 741,959 −
Total salaries 1,180,471 357,311
Fringe benefits 17,203 12,180
Total 1,197,674 369,491
Statutory pensions 53,275 63,368
Supplementary pensions 57,772 35,186
A written contract has been made with the President & CEO, under which she has a six-month period of notice. Should the company terminate the contract, additional compensation corresponding to the 12 months’ salary will also be paid. The President & CEO has a supplementary pension plan, with a cost of 11.5 percent of her annual salary as defined in the Finnish Pension Law. The complementary pension arrangement grants pension benefits at the age of 63. The President & CEO has no specific agreement related to termination of employment due to a public tender offer.
Remuneration of other members of the Corporate Executive Teamas paid
EUR
Salaries 1,099,843 915,135
Bonuses 310,205 118,891
Share-based incentive plan 891,355 −
Total salaries 2,301,403 1,034,026
Fringe benefits 35,884 48,606
Total 2,337,287 1,082,632
Statutory pensions 75,840 106,404
Supplementary pensions 60,150 21,021
The members of the Corporate Executive Team have normally no other pension arrangements than statutory pensions. Supplementary pension arrangements are arrangements in countries without statutory pensions. The retirement age of other members of the Corporate Executive Team is according to the normal local legislation.
Share-based incentives plan are disclosed in Note 33 of the consolidated financial statements. The accrual based on the new share-based incentive plan for the related parties was EUR 333 thousand at the end of the reporting period.
Managements' share ownership
number of shares
Board of Directors31 December
201531 December
2014
Jorma Eloranta, Chair of the Board of Directors 174,236 152,434
Risto Anttonen, Deputy Chair of the Board 124,604 108,253
Hannu Kasurinen 81,462 69,253
Jaana Tuominen 31,939 19,730
Suvi Hintsanen (member of the Board of Directors until 19 March 2015) − 94,586
Andreas Ahlström (member of the Board of Directors from 19 March 2015) 12,209 −
Laura Raitio (member of the Board of Directors from 19 March 2015) 12,209 −
Total 436,659 444,256
Total % of shares and votes 0.17% 0.18%
Corporate Executive Team
Nina Kopola, President & CEO 425,861 −
Tapio Engström 156,333 −
Timo Hiekkaranta (member of Corporate Executive Team until 31 August 2015) − −
Larry L. Kinn 61,742 −
Lynda A. Kelly 50,000 −
Ernesto Levy (member of Corporate Executive Team from 20 October 2015) 60,000 −
Mimoun Saïm 107,625 −
Hannu Sivula 146,729 −
Total 1,008,290 −
Total % of shares and votes 0.40% −
Other related party transactions
EUR thousand 2015 2014
Sales of goods and services − 5,083
Purchases of goods and services − 58,487
Other related-party transactions were transactions with Ahlstrom Corporation and its subsidiaries and associated companies.
Consolidated financial statements (IFRS)
109 / 127
Suominen Corporation Annual Report 2015

Suominen in brief / How we create value / Year 2015 / Business / Sustainability / Governance / Financial Statements
Guarantees 2015 2014
On own committments 18,487 11,025
On behalf of others 4,134 4,017
Total 22,621 15,042
Other contingencies
Contractual commitments to acquire property, plant and equipment 16,083 −
Total 16,083 −
Guarantees on own commitments are guarantees given to suppliers. Guarantees on behalf of others are guarantees given on behalf of the Flexibles business unit disposed in 2014.
Some subsidiaries of Suominen have guaranteed the external loans of Suominen Corporation. The maximum guaranteed amount is the unpaid principal of the loans and unpaid accrued interest expenses at the end of the reporting period.
Rental and leasing expenses
Suominen Group has entered into various operating leases, the payments under which are treated as rentals and charged to profit or loss over the lease term.
Total rental and leasing expenses -3,611 -3,600
Minimum lease payments under non-cancellable operating leases in future periods
Within one year 4,195 3,943
Between 1–5 years 8,228 12,478
After 5 years 4,693 6,489
Total 17,116 22,910
Rental obligations include a long-term leasing contract of Nakkila plant in Finland covering the purchase of process heat from a nearby heating plant. The leasing contract is classified as an operating lease, because the majority of the energy from the heating plant is sold to third parties.
Minimum non-cancellable lease payments (rental income) in future periods
Within one year 196 277
Between 1–5 years 57 579
After 5 years − 750
Total 253 1,606
Rental income is recognized as other operating income (Note 24.)
Non-cancellable rental income has decreased compared with the previous year as Suominen sold in 2015 shares in the real estate company which were generating rental income.
37. CONTINGENT LIABILITIESEUR thousand
Consolidated financial statements (IFRS)
110 / 127
Suominen Corporation Annual Report 2015

Suominen in brief / How we create value / Year 2015 / Business / Sustainability / Governance / Financial Statements
Key ratios 2015 2014 2013
Net sales, EUR million 444.0 401.8 373.7
Operating profit excluding non-recurring items, EUR million 31.2 26.9 19.4% of net sales 7.0 6.7 5.2
Operating profit, EUR million, 31.8 25.9 18.9% of net sales 7.2 6.4 5.1
Profit before income taxes, EUR million 26.5 17.8 13.1% of net sales 6.0 4.4 3.5
Profit for the period, continuing operations, EUR million 17.0 10.2 5.7% of net sales 3.8 2.5 1.5
Loss for the period from discontinued operations, EUR million − -5.2 -21.8% of net sales − -1.3 -5.8
Profit for the period, EUR million 17.0 5.0 -16.1% of net sales 3.8 1.2 -4.3
Cash flow from operations, EUR million 27.3 37.1 21.3
Total assets, EUR million 291.7 264.6 238.9
Return on equity (ROE), % 14.4 5.1 -18.6
Return on invested capital (ROI), % 15.9 12.0 -0.7
Return on invested capital (ROI), continuing operations, % 15.9 15.7 12.4
Equity ratio, % 43.2 41.2 32.9
Interest-bearing net debt, EUR million 32.5 37.8 75.5
Capital employed, continuing operations, EUR million 222.6 193.8 154.0
Gearing, % 25.9 34.7 96.2
Gross capital expenditure, continuing operations, EUR million 23.7 7.1 4.4% of net sales 5.3 1.8 1.2
Depreciation, amortization, impairment losses and reversals of impairment losses, continuing operations, EUR million -17.7 -15.6 -16.9
Expenditure on research and development, continuing operations, EUR million 3.5 2.9 3.0as % of net sales 0.8 0.7 0.8
Average number of personnel, continuing operations 614 591 550
Consolidated financial statements (IFRS)
111 / 127
Suominen Corporation Annual Report 2015

Suominen in brief / How we create value / Year 2015 / Business / Sustainability / Governance / Financial Statements
2015 2014 2013
Earnings per share, EUR, continuing operations 0.06 0.04 0.02
Earnings per share, EUR, discontinued operations − -0.02 -0.09
Earnings per share, EUR, total, basic 0.06 0.02 -0.07
Earnings per share, EUR, total, diluted 0.06 0.02 -0.07
Cash flow from operations per share, EUR 0.11 0.15 0.09
Equity per share, EUR 0.50 0.44 0.32
Price per earnings per share (P/E) ratio 19.41 45.45 -7.35
Dividend or distributed funds per share, EUR (* 0.02 0.01 −
Dividend payout ratio/ payout ratio for distribution of funds, % 31.3 58.6 −
Dividend yield, % 1.61 1.23 −
Number of shares, end of period, excluding treasury shares 251,511,730 246,130,603 246,009,755
Average number of shares excluding treasury shares 250,597,155 246,078,953 245,931,204
Average share-issue adjusted number of shares excluding treasury shares 250,943,177 248,013,178 247,794,055
Share price, end of period, EUR 1.24 0.81 0.48
Share price, period low, EUR 0.75 0.47 0.34
Share price, period high, EUR 1.33 0.82 0.61
Volume weighted average price during the period, EUR 1.01 0.58 0.48
Market capitalization, EUR million 311.9 199.4 118.1
Number of traded shares during the period 97,512,750 97,735,300 11,340,737
Number of traded shares during the period, % of average number of shares (share turnover) 38.9 39.7 4.6
(* 2015 the proposal of the Board of Directors to Annual General Meeting of distribution of dividends. In 2014 distribution of funds.
Key ratios per share are share-issue adjusted.
Key ratios per share
Consolidated financial statements (IFRS)
112 / 127
Suominen Corporation Annual Report 2015

Suominen in brief / How we create value / Year 2015 / Business / Sustainability / Governance / Financial Statements
Basic earnings per share (EPS), continuing operations
Profit from continuing operations adjusted with interest on hybrid bond, net of taxShare-issue adjusted average number of shares excluding treasury shares
Basic earnings per share (EPS), discontinued operations
Result of discontinued operationsShare-issue adjusted average number of shares excluding treasury shares
Diluted earnings per share (EPS)Profit for the periodShare-issue adjusted average number of shares excluding treasury shares
Cash flow from operations per shareCash flow from operations Share-issue adjusted number of shares excluding treasury shares, end of reporting period
Equity Equity attributable to owners of the parent + hybrid bond
Equity per shareEquityShare-issue adjusted number of shares excluding treasury shares, end of reporting period
Dividend/distribution of funds per shareDividend paid/funds distributed for the reporting periodNumber of issued shares at end of the period
Dividend payout ratio / payout ratio for distribution of funds, %
Dividend/distribution of funds per share x 100Basic earnings per share
Dividend/cash flow from operations or distribution of funds/cash flow from operations, %
Dividend/distribution of funds per share x 100Cash flow from operations per share
Dividend yield, %Dividend/distribution of funds per share x 100Share price at end of the period
Price per earnings per share (P/E)Share price at end of the periodBasic earnings per share
Market capitalizationNumber of shares at the end of reporting period excluding treasury shares x share price at the end of period
Share turnoverThe proportion of number of shares traded during the period to weighted average number of shares excluding treasury shares
Number of shares at period end Number of issued shares – treasury shares
EBITDA Profit of continuing operations before depreciation, amortization and impairment,
Operating profit (EBIT) Profit of continuing operations after depreciation, amortization and impairment
Operating profit (EBIT) excluding non-recurring items
Profit of continuing operations after depreciation, amortization and impairment excluding non-recurring items
Cash and cash equivalents Cash + other financial assets
Interest-bearing net debt Interest-bearing liabilities - interest-bearing receivables - cash and cash equivalents
Return on equity (ROE), %Profit for the reporting period (rolling 12 months) x 100Equity (quarterly average)
Invested capital Equity + interest-bearing liabilities
Return on invested capital (ROI), %Operating profit + interest income + operating profit of discontinued operations + interest income of discontinued operations (rolling 12 months)Invested capital, quarterly average
Return on invested capital (ROI), continuing operations, %
Operating profit + interest income (rolling 12 months)Invested capital excluding discontinued operations, quarterly average
Equity ratio, % Equity x 100Total assets - advances received
Gearing, %Interest-bearing net debt x 100Equity
Definition of key ratios
Consolidated financial statements (IFRS)
113 / 127
Suominen Corporation Annual Report 2015
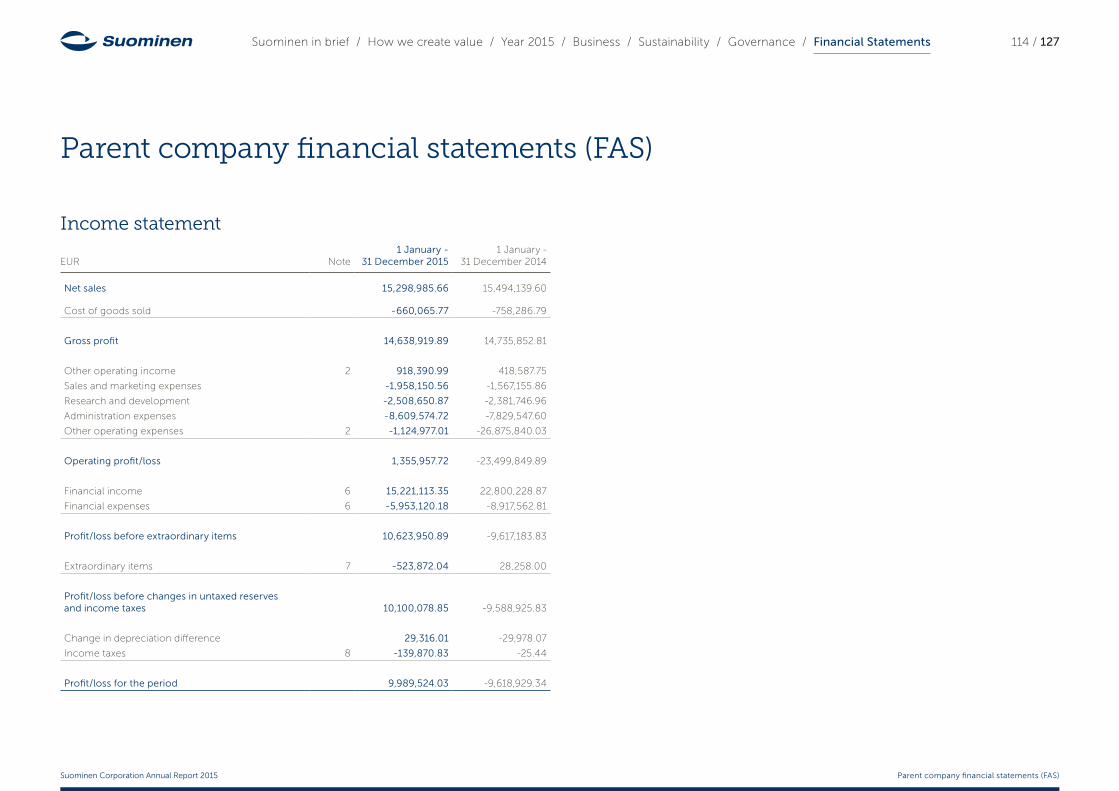
Suominen in brief / How we create value / Year 2015 / Business / Sustainability / Governance / Financial Statements
Parent company financial statements (FAS)
Income statement EUR Note
1 January - 31 December 2015
1 January - 31 December 2014
Net sales 15,298,985.66 15,494,139.60
Cost of goods sold -660,065.77 -758,286.79
Gross profit 14,638,919.89 14,735,852.81
Other operating income 2 918,390.99 418,587.75
Sales and marketing expenses -1,958,150.56 -1,567,155.86
Research and development -2,508,650.87 -2,381,746.96
Administration expenses -8,609,574.72 -7,829,547.60
Other operating expenses 2 -1,124,977.01 -26,875,840.03
Operating profit/loss 1,355,957.72 -23,499,849.89
Financial income 6 15,221,113.35 22,800,228.87
Financial expenses 6 -5,953,120.18 -8,917,562.81
Profit/loss before extraordinary items 10,623,950.89 -9,617,183.83
Extraordinary items 7 -523,872.04 28,258.00
Profit/loss before changes in untaxed reserves and income taxes 10,100,078.85 -9,588,925.83
Change in depreciation difference 29,316.01 -29,978.07
Income taxes 8 -139,870.83 -25.44
Profit/loss for the period 9,989,524.03 -9,618,929.34
Parent company financial statements (FAS)
114 / 127
Suominen Corporation Annual Report 2015

Suominen in brief / How we create value / Year 2015 / Business / Sustainability / Governance / Financial Statements
Balance sheet
EUR Note
31 December 2015
31 December 2014
ASSETS
Non-current assets
Intangible assets 5, 9 7,854,292.52 7,359,965.84
Tangible assets 5, 10 134,960.50 162,528.46
Investments
Shares in subsidiaries 11 107,945,554.70 103,840,342.89
Other investments 11 28,500.46 941,660.74
Loan receivables
Loan receivables from group companies 84,439,377.26 67,402,037.61
Loan receivables from others 7,793,257.55 8,201,564.16
Total non-current assets 208,195,942.99 187,908,099.70
Current assets
Loan receivables 1,000,000.00 600,000.00
Trade receivables 12 21,626.41 −
Other current receivables 12 16,803,528.45 28,204,425.66
Cash and cash equivalents 51,111,880.68 33,929,567.63
Total current assets 68,937,035.54 62,733,993.29
TOTAL ASSETS 277,132,978.53 250,642,092.99
EUR Note31 December
2015 31 December
2014
SHAREHOLDERS' EQUITY AND LIABILITIES
Shareholders' equity
Share capital 14 11,860,056.00 11,860,056.00
Share premium account 24,680,587.83 24,680,587.83
Reserve for invested unrestricted equity 69,652,071.98 97,191,611.31
Other equity -41,257.23 -17,872,385.25
Profit/loss for the period 9,989,524.03 -9,618,929.34
Total shareholders' equity 13 116,140,982.61 106,240,940.55
Untaxed reserves
Depreciation difference 1 341 812,00 1 371 128,01
Liabilities
Non-current liabilities
Interest-bearing liabilities
Debentures 15 75,000,000.00 75,000,000.00
Hybrid bond 15 16,840,200.00 17,500,000.00
Loans from financial institutions 15 18,498,362.13 6,666,667.00
Non-current loans from group companies 15 − 428,590.15
Other non-current liabilities 16 1,173,936.00 1,274,287.67
Total non-current liabilities 111,512,498.13 100,869,544.82
Current liabilities
Interest-bearing liabilities
Loans from financial institutions 15 3,363,338.71 3,333,333.00
Current loans from group companies 15 41,474,476.66 34,980,758.96
Trade payables and other non-current liabilities 16 3,299,870.42 3,846,387.65
Total current liabilities 48,137,685.79 42,160,479.61
Total liabilities 159,650,183.92 143,030,024.43
TOTAL SHAREHOLDERS' EQUITY AND LIABILITIES 277,132,978.53 250,642,092.99
Parent company financial statements (FAS)
115 / 127
Suominen Corporation Annual Report 2015

Suominen in brief / How we create value / Year 2015 / Business / Sustainability / Governance / Financial Statements
Cash flow statement
EUR thousand Note
1 January - 31 December 2015
1 January - 31 December 2014
Cash flow from operations
Profit/loss for the period 9,990 -9,619
Adjustments to profit/loss for the period 17 -6,340 13,558
Cash flow from operations before change in net working capital 3,650 3,939
Increase (-) or decrease (+) in trade and other receivables -3,410 1,872
Increase (+) or decrease (-) in interest-free current liabilities 6,428 -1,528
Cash flow from operations before payments of financial items and income taxes 6,668 4,283
Paid and received interests and other financial items 142 -1,106
Paid income taxes -267 -29
Cash flow from operations 6,543 3,148
Cash flow from investments
Capital expenditure 8,9,10 -2,306 -1,265
Proceeds from disposal of tangible and intangible assets 10 −
Investments in subsidiaries − -21,558
Proceeds from disposal of subsidiaries − 5,733
Dividend income from subsidiaries 4,626 15,848
Cash flow from investments -2,329 -1,242
EUR thousand Note
1 January - 31 December 2015
1 January - 31 December 2014
Cash flow from financing
Share issue 13 340 −
Repayments of non-current interest-bearing liabilities 14 -3,333 -78,220
Draw-down of non-current interest-bearing liabilities 14 15,000 10,000
Draw-down of hybrid bond 14 − 17,500
Draw-down of debentures 14 − 75,000
Change in current interest-bearing liabilities 14 -939 -10,985
Change in non-current loan receivables 600 -35,812
Change in current loan receivables -287 37,481
Distribution of funds 13 -2,504 −
Cash flow from financing 8,887 14,964
Change in cash and cash equivalents 17,749 16,869
Cash and cash equivalents 1 January 33,930 15,945
Exchange difference on cash and cash equivalents -567 1,116
Change in cash and cash equivalents 17,749 16,869
Cash and cash equivalents 31 December 51,112 33,930
Parent company financial statements (FAS)
116 / 127
Suominen Corporation Annual Report 2015

Suominen in brief / How we create value / Year 2015 / Business / Sustainability / Governance / Financial Statements
Notes to the parent company financial statements (FAS)
1. ACCOUNTING POLICIES
Suominen Corporation is a public limited liability company organized under the laws of the Republic of Finland and domiciled in Helsinki, Finland (Itämerentori 2, 00180 Helsinki, Finland). Suominen’s shares are publicly traded on Nasdaq Helsinki Ltd. Mid Cap (Small Cap until 31 December 2015) in Helsinki, Finland. Suominen Corporation is the parent company of the Group.
The financial statements of Suominen Corporation are prepared in accordance with Finnish Accounting Standards (FAS). The consolidated financial statements of Suominen Group are prepared in accordance with International Financial Reporting Standards (IFRS), and Suominen Corporation applies in its separate financial statements the same accounting principles as Suominen Group to the extent it is possible within the framework of Finnish accounting practice. The accounting principles of Suominen Group are presented in the Notes to the Consolidated Financial Statements (Note 1).
The main differences in the accounting principles between Suominen Corporation’s separate financial statements and Suominen Group’s consolidated financial statements are presented below.
Net salesNet sales consist of sales of services to group companies and of royalty income.
Financial assets and liabilities and derivative instrumentsFinancial assets and liabilities with the exception of derivative instruments are recognized at cost or at cost less impairment losses. Derivatives are recognized at fair value with the exception of electricity derivatives, which are recognized only when they are realized. Currency derivatives, if not hedging financial items, are recognized in other operating income and expenses. Fair value measurement of derivatives are presented in the accounting policies of Suominen Group.
Finance leasingLease payments are recognized as lease expenses. Leasing obligations are presented as contingent liabilities.
Extraordinary income and expensesThe parent’s extraordinary income and expenses consist mainly of group contributions received from and given to subsidiaries.
Untaxed reservesUntaxed reserves consist of a depreciation difference. This difference between scheduled depreciation and amortization and the depreciation and amortization deducted in arriving to taxable profit is presented as a separate item in the income statement and in the balance sheet.
Hybrid bondHybrid bond is presented as a liability in the separate financial statements of the parent company.
Parent company financial statements (FAS)
117 / 127
Suominen Corporation Annual Report 2015

Suominen in brief / How we create value / Year 2015 / Business / Sustainability / Governance / Financial Statements
2. OTHER OPERATING INCOME AND EXPENSESEUR thousand
1 January -
31 December 2015
1 January - 31 December
2014
Other operating income
Rental income 42 78
Gains from currency derivatives 523 194
Other operating income 353 146
Total 918 418
Other operating expenses
Losses from sale of subsidiaries − -26,245
Losses from currency derivatives -1,047 -325
Other operating expenses -78 -306
Total -1,125 -26,876
3. PERSONNEL EXPENSESEUR thousand
Salaries -3,921 -3,389
Pension expenses -538 -530
Other personnel costs -265 -617
Total -4,723 -4,536
Average number of personnel 27 24
Number of personnel, end of period 27 22
Management remuneration
Management remuneration is presented in Note 36 of the consolidated financial statements.
4. AUDIT FEESEUR thousand
Statutory audit -35 -111
Statutory audit, previous auditors -75 −
Official statements -3 −
Tax consulting -1 −
Other services -17 -199
Total -131 - 310
7. EXTRAORDINARY ITEMSEUR thousand
1 January -
31 December 2015
1 January - 31 December
2014
Received group contributions − 28
Merger loss -524 −
Total -524 28
8. INCOME TAXESEUR thousand
Withholding taxes and other direct taxes -104 −
Income taxes for the period -18 −
Income taxes from previous years -18 0
Total -140 0
5. DEPRECIATION, AMORTIZATION AND IMPAIRMENTEUR thousand
1 January -
31 December 2015
1 January - 31 December
2014
Depreciation, amortization and impairment by function
Cost of goods sold -137 -47
Sales and marketing expenses -74 -78
Research and development -1,630 -1,612
Administration expenses -471 -264
Total -2,311 -2,001
Depreciation, amortization and impairment by asset category
Machinery and equipment -37 -41
Intangible rights -2,274 -1,960
Total -2,311 -2,001
6. FINANCIAL INCOME AND EXPENSESEUR thousand
Interest income from group companies 7,616 5,462
Interest income from others 592 276
Dividend income from group companies 4,626 15,848
Other financial income from group companies 237 207
Other financial income from others 11 −
Net currency exchange differences 2,140 1,007
Interest expenses to group companies -206 -149
Interest expenses to others -4,684 -5,279
Impairment losses on investments -364 −
Other financial expenses to group companies − -4
Other financial expenses to others -698 -3,485
Total 9,268 13,883
Parent company financial statements (FAS)
118 / 127
Suominen Corporation Annual Report 2015

Suominen in brief / How we create value / Year 2015 / Business / Sustainability / Governance / Financial Statements
9. INTANGIBLE ASSETSEUR thousand
Intangible rights
Advance payments and construction
in progress Total 2015 Total 2014
Acquisition cost 1 January 11,798 604 12,403 11,130
Additions 119 2,659 2,778 2,336
Decreases and disposals -153 -56 -209 -1,064
Reclassifications 1,284 -1,284 − −
Acquisition cost 31 December 13,048 1,924 14,972 12,402
Accumulated amortization 1 January -5,043 − -5,043 -3,127
Amortization for the period -2,218 − -2,218 -1,960
Decreases and disposals 143 − 143 44
Accumulated amortization 31 December -7,118 − -7,118 -5,043
Carrying amount 31 December 5,930 1,924 7,854 7,360
10. TANGIBLE ASSETSEUR thousand
Machinery and equipment
Other tangible assets
Advance payments and construction
in progress Total 2015 Total 2014
Acquisition cost 1 January 413 18 38 469 429
Additions − − 9 9 40
Decreases and disposals − − − − −
Reclassifications 47 − -47 − −
Acquisition cost 31 December 461 18 − 478 469
Accumulated depreciation 1 January -307 − − -307 -266
Depreciation for the period -37 − − -37 -41
Decreases and disposals − − − − −
Accumulated depreciation 31 December -343 − − -343 -307
Carrying amount 31 December 117 18 − 135 163
Parent company financial statements (FAS)
119 / 127
Suominen Corporation Annual Report 2015

Suominen in brief / How we create value / Year 2015 / Business / Sustainability / Governance / Financial Statements
11. INVESTMENTSEUR thousand
Shares in group companies Other investments Total 2015 Total 2014
Carrying amount 1 January 103,841 942 104,782 116,339
Additions 5,029 − 5,029 21,578
Decreases and disposals -924 -913 -1,837 -33,135
Carrying amount 31 December 107,946 29 107,975 104,782
Share of shares and votes, %
Number of shares
Nominal value of shares, EUR
thousand
Carrying amount of
shares, EUR thousand
Equity of the company, EUR
thousand
Profit/loss in the latest
financial state-ments, EUR
thousand
Kiinteistö Oy Killinpolku, Virrat, Finland 25.0 1 8 8 101 −
Bright Maze Oy, Helsinki, Finland 19.9 19,900 20 20 -1,132 -1,431
Group companies are presented in Note 8 of the consolidated financial statements. The Finnish company Flexmer Oy merged into Suominen Corporation on 31 December 2015.
Other investmentsAll shares in the real estate company Kiinteistö Oy Virtain Inkantie 62, of which Suominen Corporation owned 100 percent of the shares, were sold in 2015.
Parent company financial statements (FAS)
120 / 127
Suominen Corporation Annual Report 2015

Suominen in brief / How we create value / Year 2015 / Business / Sustainability / Governance / Financial Statements
12. OTHER CURRENT RECEIVABLESEUR thousand
31 December 2015
31 December 2014
Trade receivables 22 −
Other receivables 647 115
Prepaid expenses and accrued income
Indirect taxes 128 210
Income taxes 127 −
Receivables from sale of subsidiary shares 813 980
Prepaid transaction costs of loans 1,297 1,725
Other 126 102
Total prepaid expenses and accrued income 2,492 3,017
Receivables from group companies
Trade receivables 3 −
Interest-bearing receivables 10,741 22,442
Interest-free receivables 2,920 2,629
Total 13,665 25,072
Total other current receivables 16,804 28,204
13. SHAREHOLDERS’ EQUITYEUR thousand
31 December 2015 31 December 2014
Share capital 1 January and 31 December 11,860 11,860
Share premium account 1 January and 31 December 24,681 24,681
Treasury shares 1 January and 31 December -44 - 44
Reserve for invested unrestricted equity 1 January 97,192 97,123
Conveyance of treasury shares 80 69
Share issue 340 −
Distribution of funds -2,504 −
Conversion of hybrid bond 1,992 −
Transfer to retained earnings -27,448 −
Reserve for invested unrestricted equity 31 December 69,653 97,192
Retained earnings 1 January -27,448 -17,829
Reversal of unpaid dividends 2 −
Transfer from reserve for invested unrestricted equity 27,448 −
Retained earnings 31 December 2 -17,829
Profit/loss for the period 9,990 -9,619
Shareholders' equity 31 December 116,142 106,241
Distributable fundsEUR 31 December 2015
Retained earnings 31 December 2,362
Reserve for invested unrestricted equity 31 December 69,652,072
Treasury shares 31 December -43,619
Profit for the period 9,989,524
Distributable funds 79,600,339
Funds available for dividend distributionEUR
Retained earnings 31 December 2,362
Treasury shares 31 December -43,619
Profit for the period 9,989,524
Funds available for dividend distribution 9,948,267
Parent company financial statements (FAS)
121 / 127
Suominen Corporation Annual Report 2015

Suominen in brief / How we create value / Year 2015 / Business / Sustainability / Governance / Financial Statements
15. INTEREST-BEARING LIABILITIESEUR thousand
31 December 2015
31 December 2014
Non-current interest-bearing liabilities
Debentures 75,000 75,000
Loans from financial institutions 18,498 6,667
Hybrid bond 16,840 17,500
Loans from group companies − 428
Total non-current interest-bearing liabilities 110,339 99,595
Current interest-bearing liabilities
Non-current interest-bearing liabilities falling due in the following year
Loans from financial institutions 3,363 3,333
Loans from group companies 41,474 34,981
Total current interest-bearing liabilities 44,838 38,314
Total interest-bearing liabilities 155,176 137,909
Hybrid bond is presented in Note 16 of the consolidated financial state-ments. Hybrid bond has no due date.
16. INTEREST-FREE LIABILITIESEUR thousand
31 December 2015
31 December 2014
Non-current interest-free liabilities
Accrued interest on hybrid bond 824 924
Other non-current liabilities 350 350
Total non-current interest-free liabilities 1,174 1,274
Current interest-free liabilities
Trade payables 681 359
Other current liabilities 515 814
Accrued expenses
Accrued interest expenses 914 902
Accrued personnel expenses 1,115 1,283
Unrealized loss from currency derivatives 25 235
Other accrued expenses 5 3
Total accrued expenses 2,059 2,424
Liabilities to group companies
Trade payables 16 −
Other liabilities to group companies 28 249
Total 44 249
Total current interest-free liabilities 3,300 3,846
Total interest-free liabilities 4,474 5,120
Other non-current liabilities include EUR 350 (350) thousand and other current liabilities EUR 309 (714) thousand liabilities related to acquisition of intangible assets,
Repayments of external non-current interest-bearing liabilities 2016 2017 2018 2019
Loans from financial institutions 3,363 7,904 10,595 –
Debentures − − − 75,000
Total 3,363 7,904 10,595 75,000
14. SHARE CAPITAL
Share capital and shares are presented in Note 15 of the consolidated financial statements.
Parent company financial statements (FAS)
122 / 127
Suominen Corporation Annual Report 2015

Suominen in brief / How we create value / Year 2015 / Business / Sustainability / Governance / Financial Statements
17. CONTINGENT LIABILITIESEUR thousand
31 December 2015
31 December 2014
Guarantees
On behalf of group companies 21,188 17,877
On behalf of others 4,135 4,017
Total 25,322 21,894
Guarantees on behalf of group companies are guarantees given to suppliers. Guarantees on behalf of other are guarantees given on behalf of the Flexibles business which was disposed in 2014.
Rental and leasing obligations
Falling due within next 12 months 189 266
Falling due later 701 116
Total 891 382
19. ADJUSTMENTS TO CASH FLOW STATEMENTEUR thousand
1 January - 31 December
2015
1 January - 31 December
2014
Adjustment to profit/loss for the period
Change in depreciation difference -29 30
Group contributions − -28
Merger loss 524 −
Financial income and expenses -9,268 -13,883
Income taxes 140 0
Depreciation and amortization 2,311 2,001
Gains and losses from disposal of fixed assets − 26,245
Other non-cash items in profit/loss for the period -17 308
Total adjustments to profit/loss for the period -6,340 14,673
18. DERIVATIVE INSTRUMENTSEUR thousand
Nominal and fair values of derivative instruments 31 December 2015
Nominal value
Fair value
Currency forward contracts
External 2,272 -25
Electricity derivatives
Electricity forward contracts 1,229 -242
Nominal and fair values of derivative instruments 31 December 2014
Nominal value
Fair value
Currency forward contracts
External 36,307 -235
Electricity derivatives
Electricity forward contracts 1,031 -71
Parent company financial statements (FAS)
123 / 127
Suominen Corporation Annual Report 2015

Suominen in brief / How we create value / Year 2015 / Business / Sustainability / Governance / Financial Statements
The profit for the financial year 2015 of Suominen Corporation, the parent company of Suominen Group, was EUR 9,989,524. The funds distributable as dividends, including the profit for the period of the parent company were EUR 9,948,267 and total distributable funds were EUR 79,600,339. There have been no significant changes in the company’s financial position after the end of the review period.
The Board of Directors proposes that a dividend of EUR 0.02 per share shall be distributed for the financial year that ended on 31 December 2015 and that the rest of the profit shall be transferred to retained earnings. On 29 January 2016 the company had 251,511,730 issued shares, excluding treasury shares. With this number of shares, the total amount of dividends to be distributed would be EUR 5,030,234.60. The record date is 18 March 2016 and the dividend will be paid on 31 March 2016.
Helsinki 29 January 2016
Jorma ElorantaChair of the Board
Risto Anttonen Andreas Ahlström
Hannu Kasurinen Jaana Tuominen Laura Raitio
Nina KopolaPresident & CEO
Proposal by the Board of Directors for distribution of dividends
124 / 127
Suominen Corporation Annual Report 2015

Suominen in brief / How we create value / Year 2015 / Business / Sustainability / Governance / Financial Statements
To the Annual General Meeting of Suominen CorporationWe have audited the accounting records, the financial statements, the report of the Board of Directors, and the administration of Suominen Corporation for the year ended 31 December, 2015. The financial statements comprise the consolidated statement of financial position, income statement, statement of comprehensive income, statement of changes in equity and statement of cash flows, and notes to the consolidated financial statements, as well as the parent company’s balance sheet, income statement, cash flow statement and notes to the financial statements.
Responsibility of the Board of Directors and the Managing DirectorThe Board of Directors and the Managing Director are responsible for the preparation of consolidated financial statements that give a true and fair view in accordance with International Financial Reporting Standards (IFRS) as adopted by the EU, as well as for the preparation of financial statements and the report of the Board of Directors that give a true and fair view in accordance with the laws and regulations governing the preparation of the financial statements and the report of the Board of Directors in Finland. The Board of Directors is responsible for the appropriate arrangement of the control of the company’s accounts and finances, and the Managing Director shall see to it that the accounts of the company are in compliance with the law and that its financial affairs have been arranged in a reliable manner.
Auditor’s ResponsibilityOur responsibility is to express an opinion on the financial statements, on the consolidated financial statements and on the report of the Board of Directors based on our audit. The Auditing Act requires that we comply with the requirements of professional ethics. We conducted our audit
in accordance with good auditing practice in Finland. Good auditing practice requires that we plan and perform the audit to obtain reasonable assurance about whether the financial statements and the report of the Board of Directors are free from material misstatement, and whether the members of the Board of Directors of the parent company or the Managing Director are guilty of an act or negligence which may result in liability in damages towards the company or have violated the Limited Liability Companies Act or the articles of association of the company.
An audit involves performing procedures to obtain audit evidence about the amounts and disclosures in the financial statements and the report of the Board of Directors. The procedures selected depend on the auditor’s judgment, including the assessment of the risks of material misstatement, whether due to fraud or error. In making those risk assessments, the auditor considers internal control relevant to the entity’s preparation of financial statements and report of the Board of Directors that give a true and fair view in order to design audit procedures that are appropriate in the circumstances, but not for the purpose of expressing an opinion on the effectiveness of the company’s internal control. An audit also includes evaluating the appropriateness of accounting policies used and the reasonableness of accounting estimates made by management, as well as evaluating the overall presentation of the financial statements and the report of the Board of Directors.
We believe that the audit evidence we have obtained is sufficient and appropriate to provide a basis for our audit opinion.
Opinion on the consolidated financial statementsIn our opinion, the consolidated financial statements give a true and fair view of the financial position, financial performance, and cash flows of the group in accordance with International Financial Reporting Standards (IFRS) as adopted by the EU.
Opinion on the company’s financial statements and the report of the Board of DirectorsIn our opinion, the financial statements and the report of the Board of Directors give a true and fair view of both the consolidated and the parent company’s financial performance and financial position in accordance with the laws and regulations governing the preparation of the financial statements and the report of the Board of Directors in Finland. The information in the report of the Board of Directors is consistent with the information in the financial statements.
Helsinki, January 29, 2016
Ernst & Young OyAuthorized Public Accountant Firm
Kristina Sandin Authorized Public Accountant
Auditor’s report
125 / 127
Suominen Corporation Annual Report 2015
Suominen in brief / How we create value / Year 2015 / Business / Sustainability / Governance / Financial Statements
Financial informationIn 2016, Suominen Corporation will publish financial reports as follows:
Interim Report January – March on Thursday 28 April 2016 Interim Report January – June on Tuesday 9 August 2016 Interim Report January – September on Thursday 27 October 2016.
Suominen’s Financial Statement Release of 2015 was published on Friday 29 January 2016.
Financial reports and other Stock Exchange Releases are published in Finnish and English and are available at www.suominen.fi immediately after their publication. The English editions are translations of the Finnish originals, which will prevail in the event of any dispute.
The Annual General MeetingNotice is given to the shareholders of Suominen Corporation to the Annual General Meeting to be held on Wednesday 16 March 2016 at 10.00 am at Finlandia Hall (Terrace Hall), at the address Mannerheimintie 13 e, 00100 Helsinki. The reception of persons registered for the meeting will commence at 9.00 am. During the coffee service after the Annual General Meeting, shareholders will have the opportunity to meet the management of the company.
Notice of the Annual General Meeting has been announced as stock exchange release on 29 January 2016. All materials to the Annual General Meeting are available at www.suominen.fi > Investors > Corporate Governance > General Meetings of Shareholders > AGM 2016.
Each shareholder who is registered on 4 March 2016 in the shareholders’ register of the company held by Euroclear Finland Ltd has the right to participate in the Annual General Meeting. A shareholder, who wishes to participate in the Annual General Meeting, shall register for the meeting no later than 11 March 2016 before 4.00 p.m. by giving a prior notice of participation, which shall be received by the company no later than on the abovementioned date and time. Such notice can be given:
a) by e-mail to [email protected]) by telephone +358 (0)10 214 3551, Monday-Friday between 8.00 a.m. and 4.00 p.m.c) by regular mail to Suominen Corporation, Itämerentori 2, FI-00180 Helsinki, Finlandd) by fax +358 (0)9 773 1109
In connection with the registration, a shareholder shall notify his/her name, personal identification number, address, telephone number and the name of a possible assistant or proxy representative and the personal identification number of the proxy representative.
Payment of the dividendThe Board of Directors proposes that a dividend of 0.02 euros per share shall be paid regarding the financial year of 2015. Calculated on the basis of the total amount of shares on 29 January 2016, a total of 5,030,234.60 euros would be paid as dividend. The record date for the payment of the dividend is 18 March 2016 and the dividend shall be paid on 31 March 2016.
Investor relationsIn all investor relations matters, please contact Anu Heinonen, Vice President, Corporate Communications & IR, tel. +358 10 214 3555.
Requests for management appointments shall be addressed to Eeva Oinonen, Executive Assistant, PA to President & CEO, tel. +358 (0)10 214 3551.
E-mail addresses follow the format [email protected].
Suominen’s closed period commences at the end of a reporting period and ends when the interim report or financial statements release concerning the financial period in question has been published. No meetings between investors and company representatives will be arranged, nor will any comments on financial performance or development be issued during the closed period.
Information for shareholders
126 / 127
Suominen Corporation Annual Report 2015

www.suominen.fi
Twitter: @SuominenCorp
LinkedIn: Suominen Corporation
Suominen Corporation
Head Office
Itämerentori 2
FI-00180 Helsinki
Finland
Tel. +358 (0)10 214 300
Detailed contact information to Suominen locations
worldwide is available at www.suominen.fi