superdosing of phytases · ip6 ip5 ip4 ip3 t) +500 ftu +1500 ftu 32% point in time measure of...
TRANSCRIPT

www.abvista.com
Superdosing of
phytases
Mike Bedford Research Director, AB Vista Feed Ingredients
Marlborough, UK

www.abvista.com
Traditional dosing of phytases –
matrix driven
y = 0.0562ln(x) - 0.1986 R² = 0.9999
0
0.02
0.04
0.06
0.08
0.1
0.12
0.14
0.16
0.18
0.2
0 200 400 600 800 1000 1200
AvP
% m
atri
x
FTU/kg feed
P matrix vs dose for a "0.15" phytase
www.abvista.com
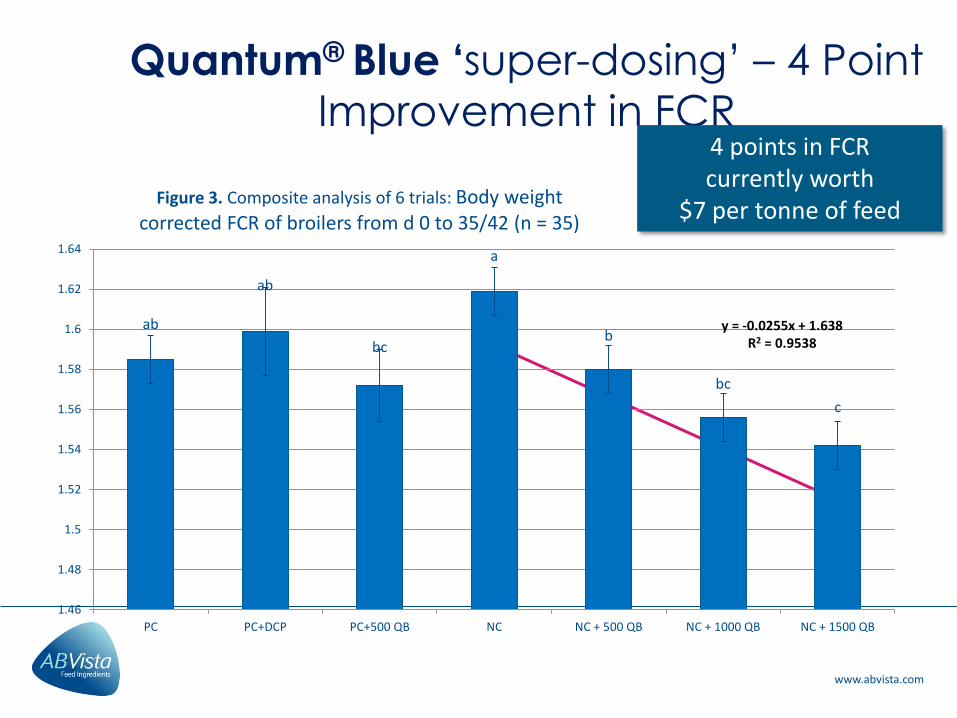
Quantum® Blue ‘super-dosing’ – 4 Point
Improvement in FCR 4 points in FCR currently worth
$7 per tonne of feed
ab
ab
bc
a
b
bc
c
1.46
1.48
1.5
1.52
1.54
1.56
1.58
1.6
1.62
1.64
PC PC+DCP PC+500 QB NC NC + 500 QB NC + 1000 QB NC + 1500 QB
Figure 3. Composite analysis of 6 trials: Body weight corrected FCR of broilers from d 0 to 35/42 (n = 35)
y = -0.0255x + 1.638 R2 = 0.9538
www.abvista.com
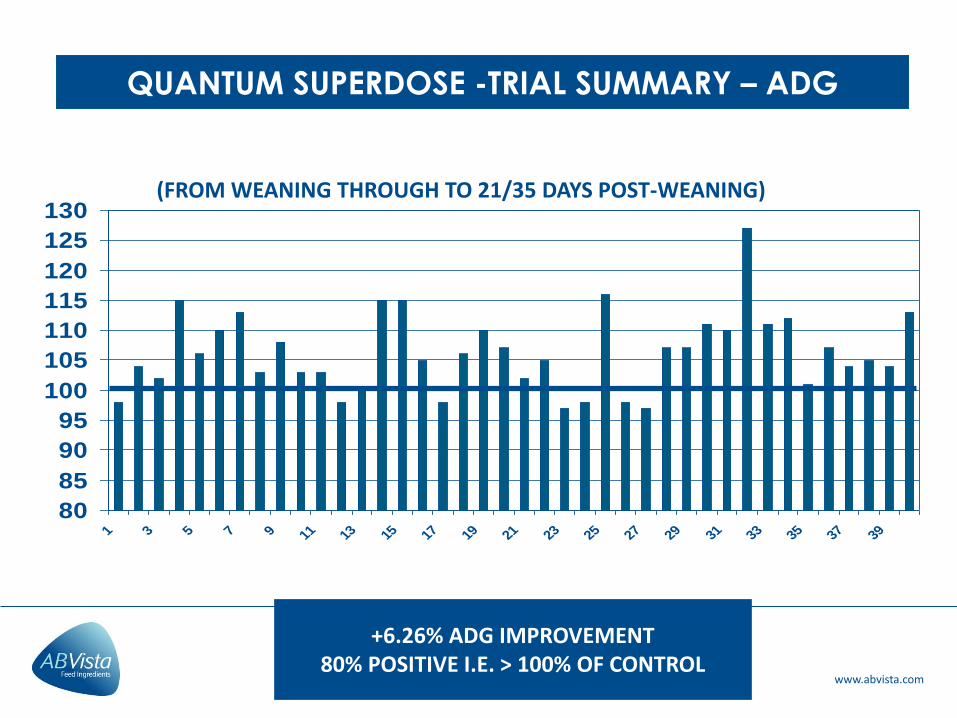
QUANTUM SUPERDOSE -TRIAL SUMMARY – ADG
(FROM WEANING THROUGH TO 21/35 DAYS POST-WEANING)
80
85
90
95
100
105
110
115
120
125
130
1 3 5 7 9 11 13 15 17 19 21 23 25 27 29 31 33 35 37 39
+6.26% ADG IMPROVEMENT 80% POSITIVE I.E. > 100% OF CONTROL
www.abvista.com
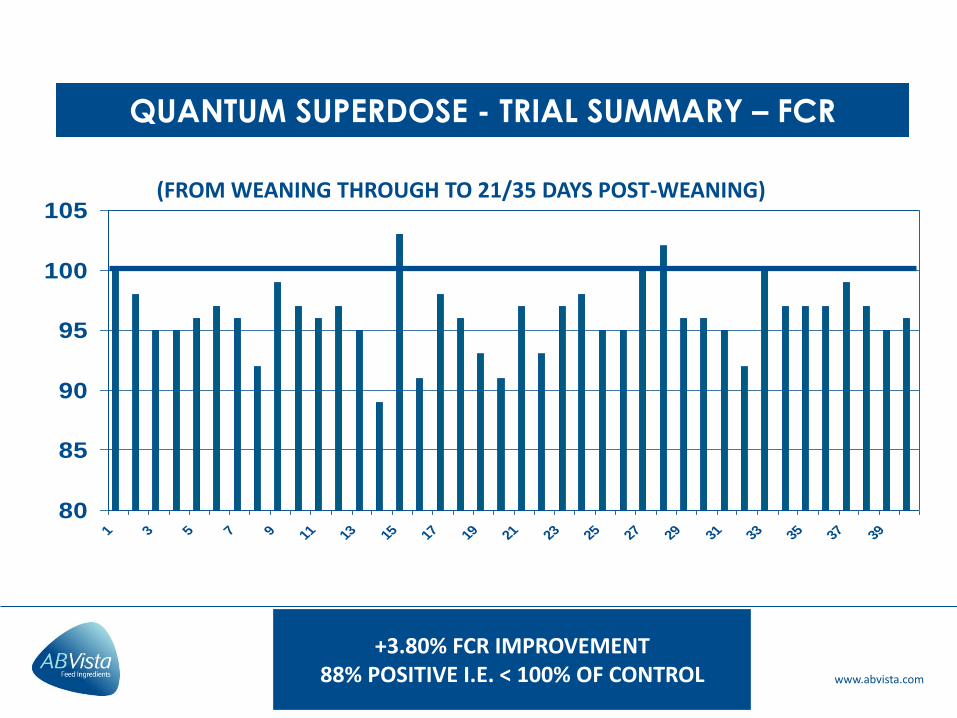
QUANTUM SUPERDOSE - TRIAL SUMMARY – FCR
(FROM WEANING THROUGH TO 21/35 DAYS POST-WEANING)
80
85
90
95
100
105
1 3 5 7 9 11 13 15 17 19 21 23 25 27 29 31 33 35 37 39
+3.80% FCR IMPROVEMENT 88% POSITIVE I.E. < 100% OF CONTROL
www.abvista.com
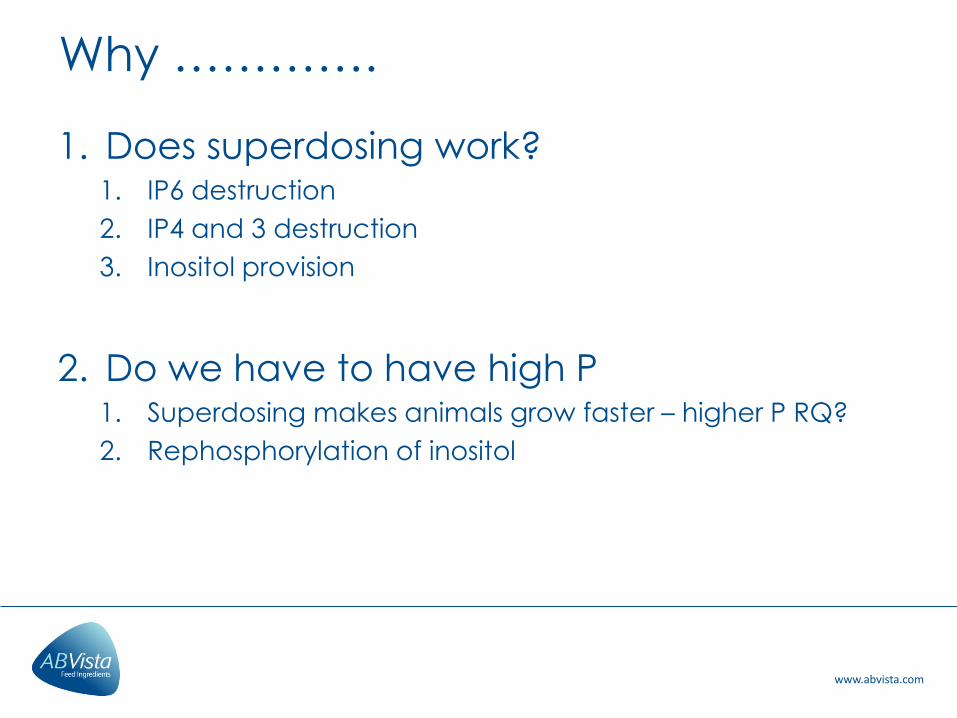
Why ………….
1. Does superdosing work? 1. IP6 destruction
2. IP4 and 3 destruction
3. Inositol provision
2. Do we have to have high P 1. Superdosing makes animals grow faster – higher P RQ?
2. Rephosphorylation of inositol
www.abvista.com
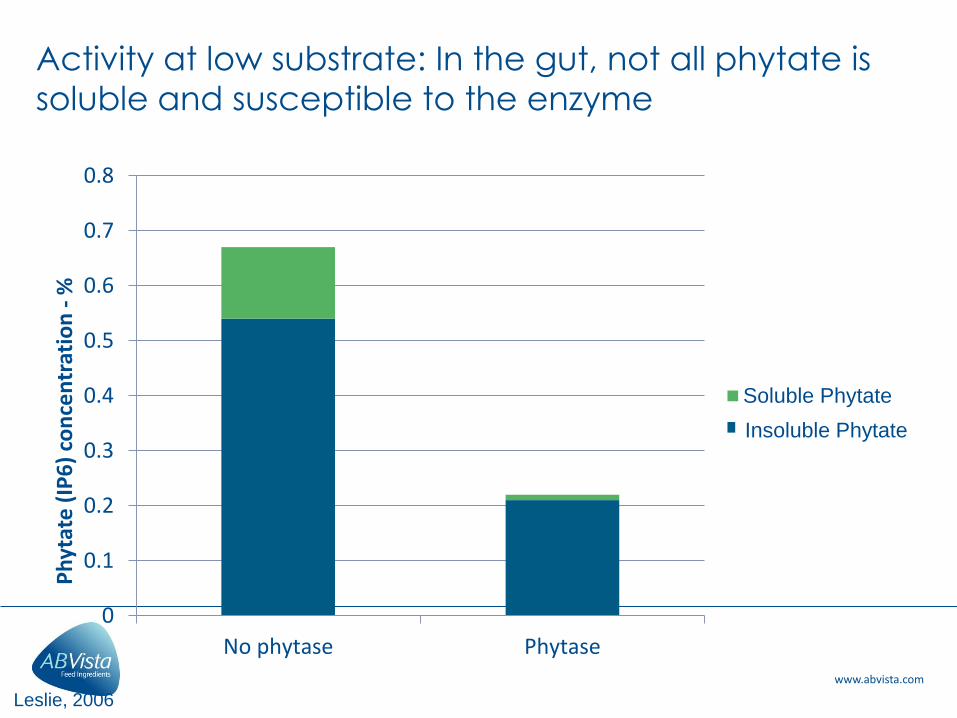
Activity at low substrate: In the gut, not all phytate is
soluble and susceptible to the enzyme
0
0.1
0.2
0.3
0.4
0.5
0.6
0.7
0.8
No phytase Phytase
Ph
ytat
e (
IP6
) co
nce
ntr
atio
n -
%
Soluble Phytate
Unsoluble Phytate
Leslie, 2006
Insoluble Phytate

www.abvista.com
Pepsin inhibited at pH 2.5 by very
little phytate
100 uM
Yu et al 2012

www.abvista.com
Protein – phytate precipitation
depends upon pH and protein
0
20
40
60
80
100
120
Casein Corn Canola meal Rice pollards SFM SBM
Pe
rce
nt
solu
ble
pro
tein
pH 2 Protein
pH 3 Protein
Kies et al 2006

www.abvista.com June 11, 2008
0
20
40
60
80
100
120
Casein Corn Canola meal Rice pollards SFM SBM
Pe
rce
nt
solu
ble
pro
tein
pH 2 Protein
pH 2 Pr+ Phyt
pH 3 Protein
pH 3 Pr+ Phyt
Protein – phytate precipitation
depends upon pH and protein

www.abvista.com June 11, 2008
0
20
40
60
80
100
120
Casein Corn Canola meal Rice pollards SFM SBM
Pe
rce
nt
solu
ble
pro
tein
pH 2 Protein
pH 2 Pr+ Phyt
pH 2 P+P+P
pH 3 Protein
pH 3 Pr+ Phyt
pH 3 P+P+P
Protein – phytate precipitation
depends upon pH and protein
www.abvista.com
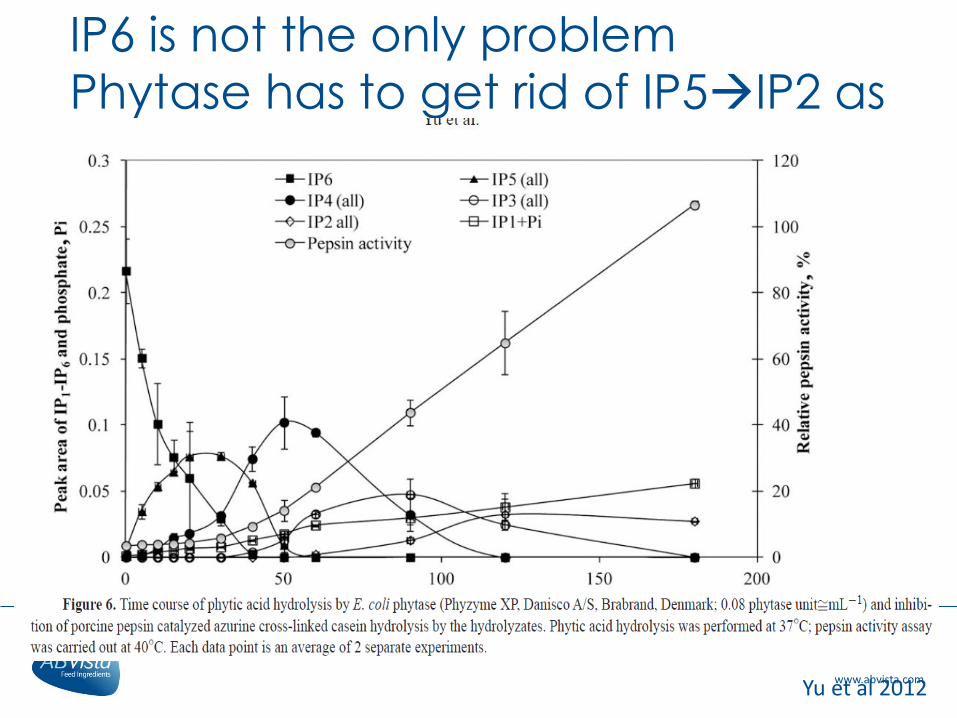
IP6 is not the only problem Phytase has to get rid of IP5IP2 as
well
Yu et al 2012
www.abvista.com
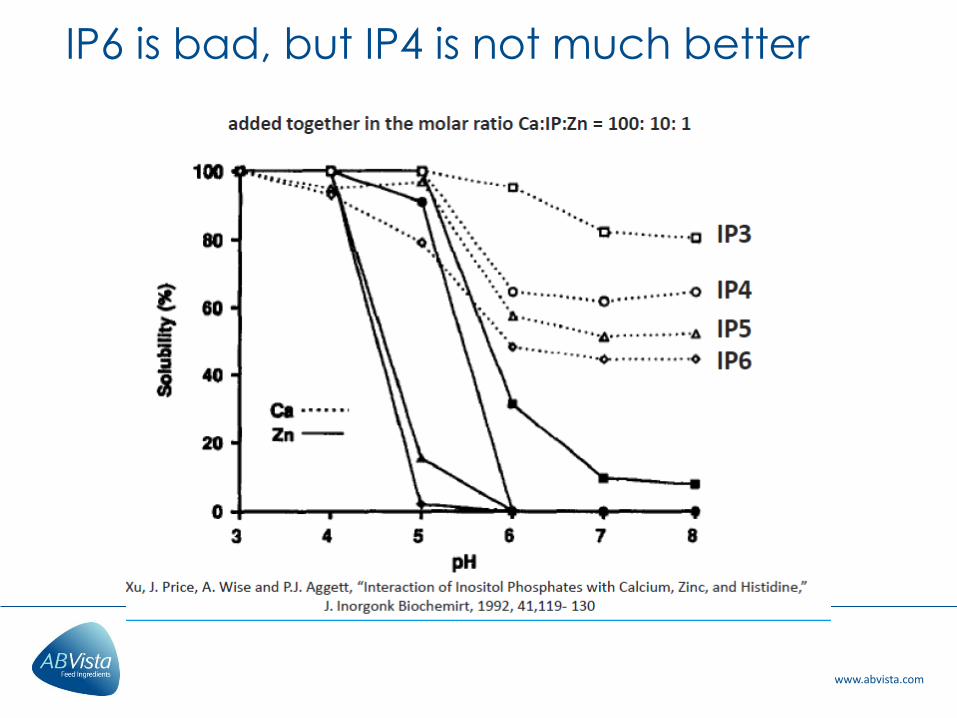
IP6 is bad, but IP4 is not much better

www.abvista.com
Supplementation with a novel C. braakii phytase:
Results in a ‘pool’ of IP4
Pontoppidan et al., 2012
No phytase Phytase (500 FTU)
Pontopiddan et al 2012. 25kg pigs fed 0 or 500 FTU HiPhos and after starving for 24hrs then fed treats for 30 mins, slaughtered 1 and 2 hours post feed. A=control, B =500FTU/kg

www.abvista.com
If it is present and soluble in the stomach, it
will ppt with something in the SI
Schlemmer 2001

www.abvista.com
If it is present and soluble in the stomach, it
will ppt with something in the SI
Schlemmer 2001

www.abvista.com
IP4 and IP3 are not innocuous
Ester Nutrient R P value n
Ileal AME, kcal -0.849 <0.0001 40
Ileal DM digestibility -0.848 <0.0001 40
Ileal N digestibility -0.693 <0.0001 40
Ileal Na digestibility -0.675 <0.0001 40
Ileal Mg digestibility -0.688 <0.0001 40
Ileal Fe digestibility -0.606 <0.0001 40
Ileal iP3
Ileal iP4
Beeson et al, 2015 submitted
www.abvista.com
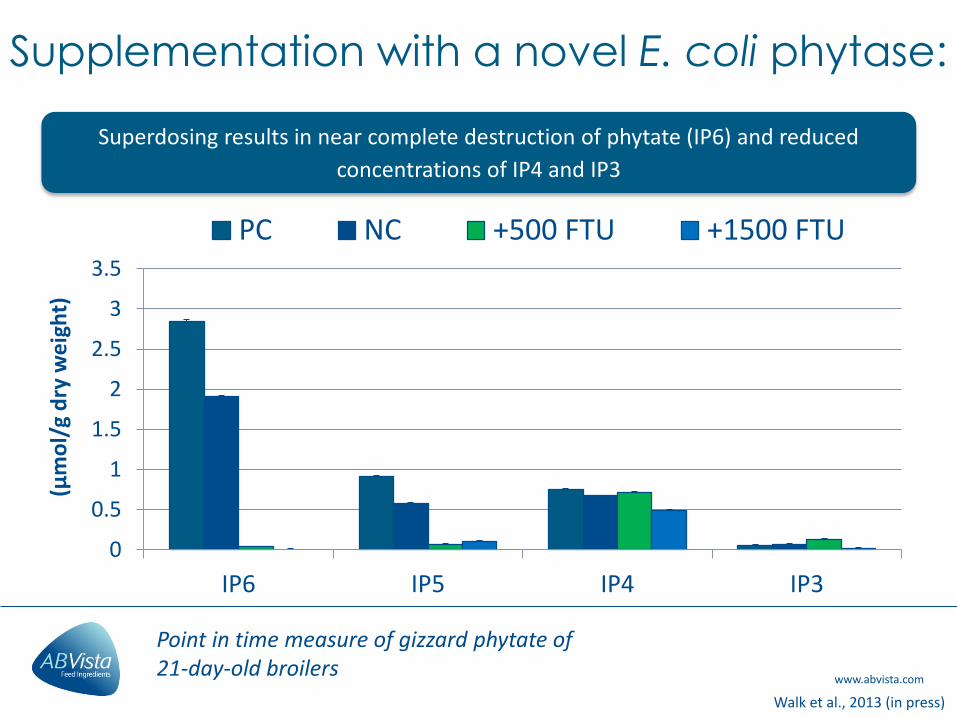
Supplementation with a novel E. coli phytase:
Superdosing results in near complete destruction of phytate (IP6) and reduced
concentrations of IP4 and IP3
Walk et al., 2013 (in press)
0
0.5
1
1.5
2
2.5
3
3.5
IP6 IP5 IP4 IP3
(µm
ol/
g d
ry w
eig
ht)
PC NC +500 FTU +1500 FTU
Point in time measure of gizzard phytate of 21-day-old broilers

www.abvista.com
Walk et al., 2013 (in press)
0
0.1
0.2
0.3
0.4
0.5
0.6
0.7
0.8
IP6 IP5 IP4 IP3
(µm
ol/
g d
ry w
eig
ht)
+500 FTU +1500 FTU
32%
Point in time measure of gizzard phytate of 21-day-old broilers
Supplementation with a novel E. coli phytase:
Superdosing results in near complete destruction of phytate (IP6) and reduced
concentrations of IP4 and IP3

www.abvista.com
Mansbridge et al., 2013 (Harper Adams University)
0
1000
2000
3000
4000
5000
6000
7000
PC +P +125 +500 +1000 +2000 +8000 +32000
Ph
yta
te e
ste
rs (
nm
ol/
g d
ry w
eig
ht)
Ileal phytate ester and inositol concentration of piglets 3 weeks post-
weaning
IP3 IP4 IP5 Inositol
Supplementation with a novel E. coli pytase:
Superdosing results in near complete destruction of phytate (IP6) and reduced
concentrations of IP4 and IP3
www.abvista.com
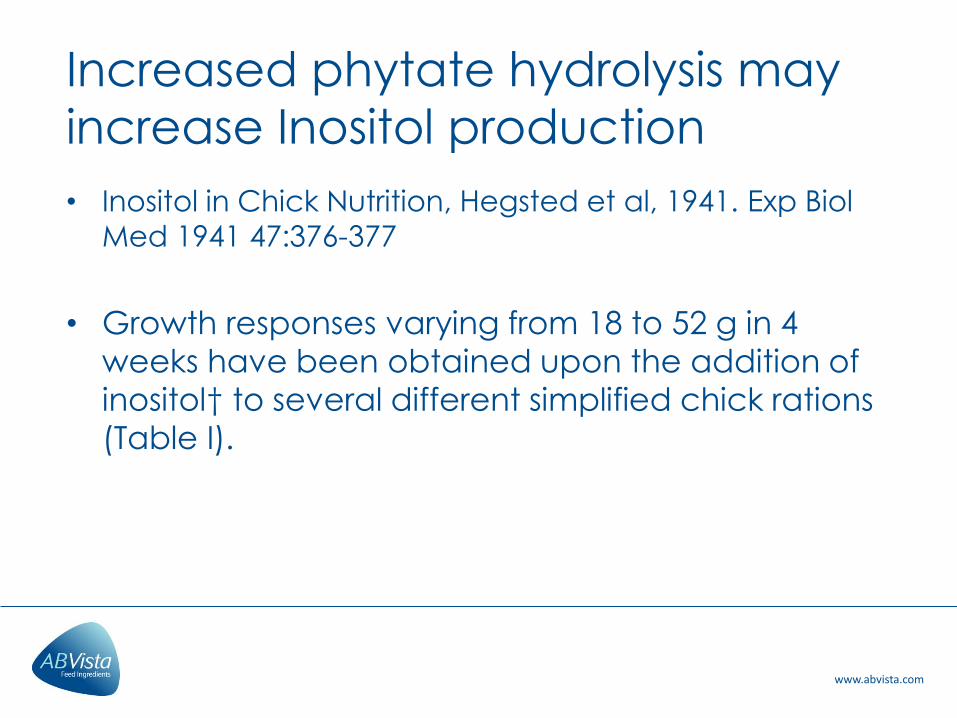
• Inositol in Chick Nutrition, Hegsted et al, 1941. Exp Biol
Med 1941 47:376-377
• Growth responses varying from 18 to 52 g in 4
weeks have been obtained upon the addition of
inositol† to several different simplified chick rations
(Table I).
Increased phytate hydrolysis may
increase Inositol production

www.abvista.com
Inositol Provision
Zyla et al 2004
Myo-inositol None 0.10% p value
Intake 838 861 NS
Gain 537 579 0.0199
FCR 1.57 1.47 0.0573
Toe ash % 11.9 12.2 NS
P retention 56 50 0.0015
Ca retention 61 59 NS
Broilers, 1-21d post hatch, main effects on 0.65/0.27 and 0.8/0.47 Ca AvP diets

www.abvista.com
Extra-phosphoric effects of phytase
Walk et al., 2013 (in press)
Broiler gizzard phytate, phytate ester and inositol concentration (d21)
Superdosing Quantum Blue decreased phytate and increased inositol concentration
Part of the superdosing response may be associated with inositol provision as well as phytate destruction
ab
a
c
b
d d d
a a
b
a
b b b c c a
bc ab c c
c c
bc bc
b
a a
0.00
0.50
1.00
1.50
2.00
2.50
3.00
3.50
4.00
PC +DCP +500 QB NC +500 QB +1000 QB +1500 QB
µm
ol/
g d
ry w
eigh
t
IP6 IP5 IP4 IP3 Inositol
Item,
µmol/g
BW gain,
kg P = FCR P =
Tibia
ash, g P =
Phytate -0.37 *** 0.46 *** -0.21 NS
Inositol 0.46 *** -0.57 *** 0.19 NS
www.abvista.com
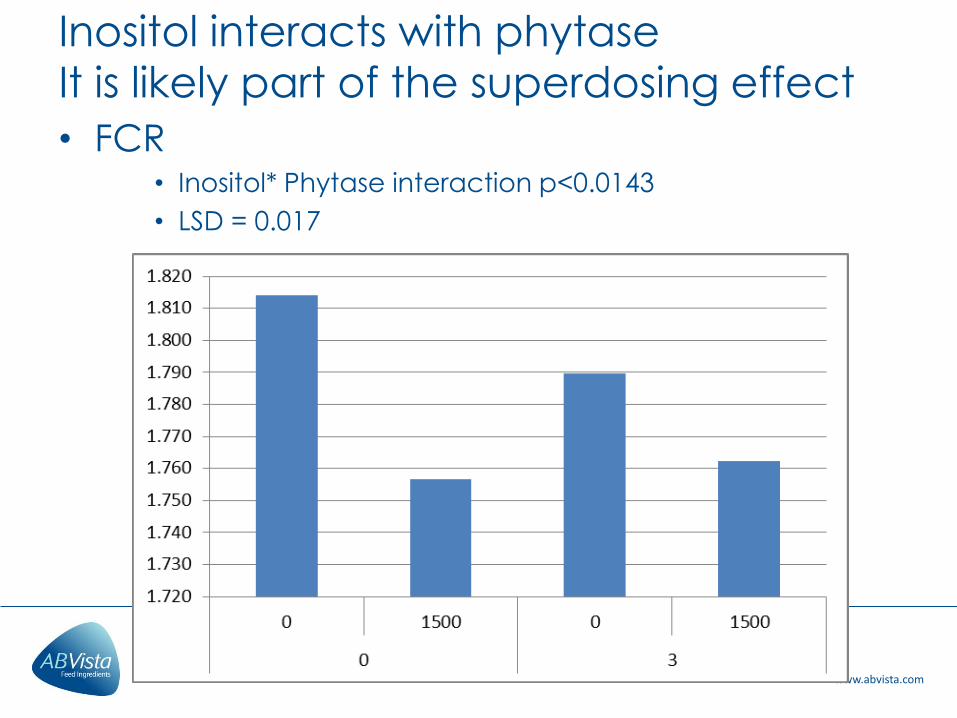
Inositol interacts with phytase
It is likely part of the superdosing effect
• FCR • Inositol* Phytase interaction p<0.0143
• LSD = 0.017

www.abvista.com
Inositol as a source of intracellular
phytate (IP6)?
0
2
4
6
8
10
12
14
16
18
20
Liver Brain Kidney Lung HumanRBC
Humanserum
Rat tissue concentration of IP6, µM
Letcher et al., 2008
Phytate (IP6) is present in tissues at various concentrations
1. Antioxidant
2. De-phosphorylated for cell signaling, Ca metabolism and inositol
production
Inositol:
1. Mammalian cell cultures
require inositol to grow
2. IP6 can be made in the
body from inositol
3. Phytate destruction may increase the
requirement for P in the
body?
25

www.abvista.com
Kinetics differ between phytases
0
0.5
1
1.5
2
2.5
3
0 5000 10000 15000 20000
Ph
ytat
e P
re
leas
ed
(g/
kg d
iet)
Dosage of phytase (FTU/kg)
P lycii A niger E coli Quantum Blue
Red line represents 85% phytate hydrolysis, differences between phytases driven largely by pH profiles and kM
www.abvista.com
0
0.1
0.2
0.3
0.4
0.5
0.6
0 20 40 60 80
Ph
osp
hate
/ m
M (
ad
juste
d w
ith
Meg
azym
e v
alu
es)
Time / minutes
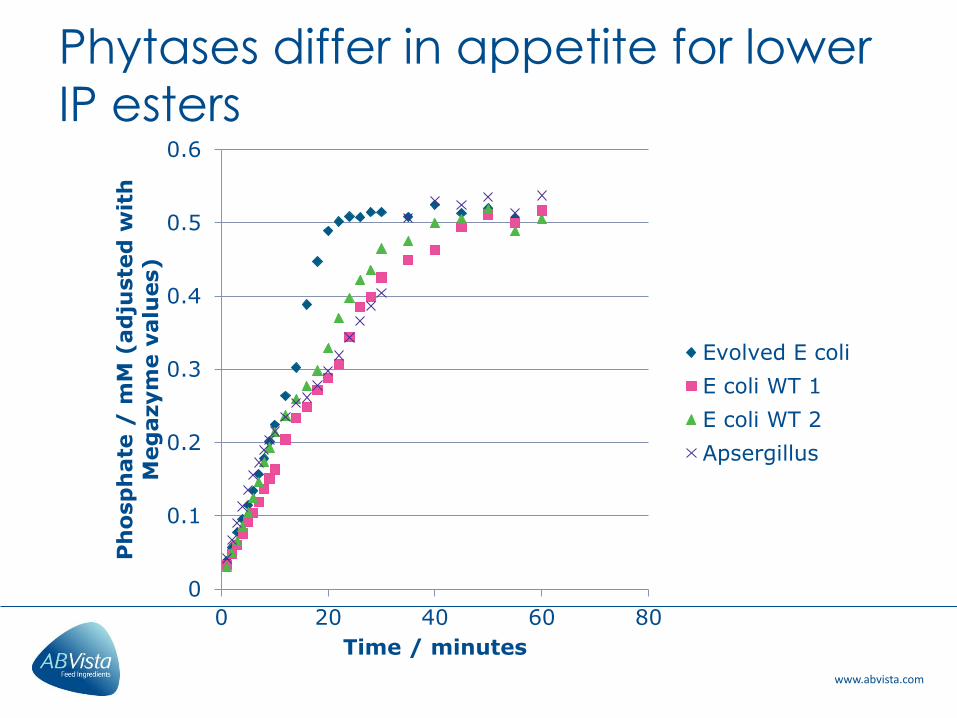
Evolved E coli
E coli WT 1
E coli WT 2
Apsergillus
Phytases differ in appetite for lower
IP esters

www.abvista.com
Equilibria to consider
Dietary Phytate
Nuisance factor
Insoluble Phytate
Substrate kM ???
Soluble Phytate IP3 and lower
Critical phytate concentration
High kM
Low kM
0
0.1
0.2
0.3
0.4
0.5
0.6
0.7
0.8
0.9
1
0 5 10 15 20 25

www.abvista.com
• Superdosing is NOT simply using a higher
dose with a matrix .. It is
1) Using a dose >=0.2% AvP matrix but applying only
0.15% matrix max
2) Using a phytase which has ability to
1) Clear all IP6
2) Clear all IP4
3) Produce inositol
3) Ranking of phytases in this application is
different compared to that of a 0.13 matrix
Conclusions
www.abvista.com
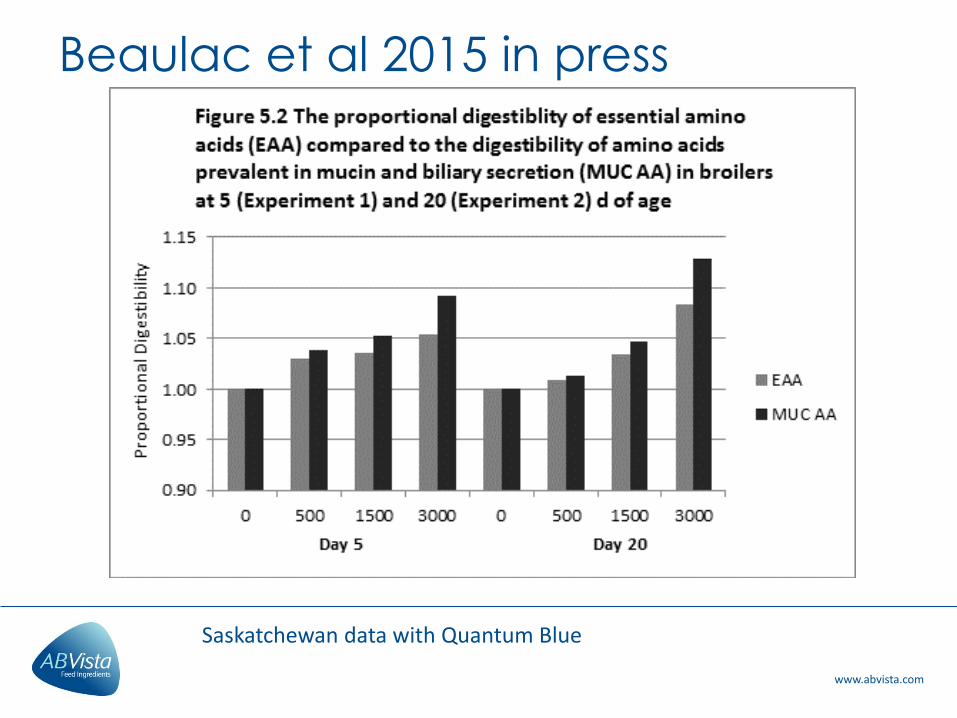
Beaulac et al 2015 in press
Saskatchewan data with Quantum Blue

www.abvista.com
Beaulac et al 2015 in press