superhero statistics - nz maths
TRANSCRIPT
1 iLLuStrating the mathematiCS StandardS “superhero stAtistics”, 2012
accessed from http://nzmaths.co.nz/
ILLUSTRATING THE MATHEMATICS STANDARDS YEAR 3
YEAR 5
YEAR 6
YEAR 7
YEAR 8
YEAR 2
YEAR 4YEAR
1
The task used in this illustration was linked to an English unit on the literary convention of the “superhero” in film and literature. The class had investigated the characteristics of superheroes and their various powers. The teacher then connected this work to the 2009 Census at School question “Which superpower would you most like to have?” The multichoice responses included: invisibility, flying ability, telepathy, ability to freeze time, or super strength. Data was available through the Census at School website, and the students were familiar with the Data Viewer tool: www.censusatschool.org.nz/2010/data-viewer
The task relates to achievement objectives for Statistics from the mathematics and statistics learning area in The New Zealand Curriculum.
The following examples of student work illustrate achievement at the mathematics standards for years 7 and 8.
Superhero Statistics
Superhero Statistics
Using the Data Viewer on the Census at Schools website, explore at least two variables within the Superpower response data. Keep track of your investigation on an Excel® spreadsheet by inserting a text pane or text boxes as you create tables and graphs. It must be clear to a reader how you followed a question through the data and what conclusion you reached from your analysis of the information in the tables and graphs.
Some features of students’ work used to make judgments in relation to the mathematics standards are described below.
Superhero image Copyright © maLChev/ShutterStoCk Copyright © new ZeaLand miniStry of eduCation 2012
2accessed from http://nzmaths.co.nz/ Copyright © new ZeaLand miniStry of eduCation 2012
ILLUSTRATING THE MATHEMATICS STANDARD YEAR 3
YEAR 5
YEAR 6
YEAR 7
YEAR 8
YEAR 2
YEAR 4YEAR
1
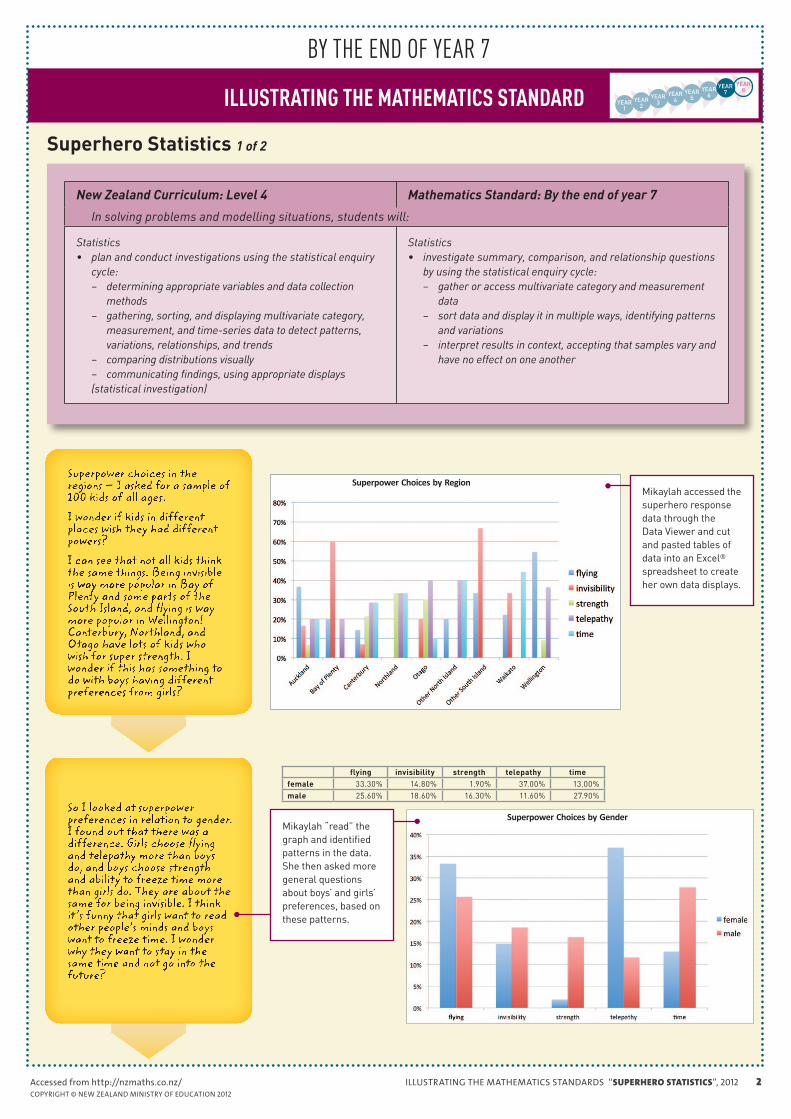
flying invisibility strength telepathy timefemale 33.30% 14.80% 1.90% 37.00% 13.00%male 25.60% 18.60% 16.30% 11.60% 27.90%
iLLuStrating the mathematiCS StandardS “superhero stAtistics”, 2012
Mikaylah accessed the superhero response data through the Data Viewer and cut and pasted tables of data into an Excel® spreadsheet to create her own data displays.
Superpower Choices by Region
Superpower Choices by GenderMikaylah “read” the graph and identified patterns in the data. She then asked more general questions about boys’ and girls’ preferences, based on these patterns.
New Zealand Curriculum: Level 4 Mathematics Standard: By the end of year 7
In solving problems and modelling situations, students will:
Statistics• plan and conduct investigations using the statistical enquiry
cycle: – determining appropriate variables and data collection
methods – gathering, sorting, and displaying multivariate category,
measurement, and time-series data to detect patterns, variations, relationships, and trends
– comparing distributions visually – communicating findings, using appropriate displays
(statistical investigation)
Statistics• investigate summary, comparison, and relationship questions
by using the statistical enquiry cycle: – gather or access multivariate category and measurement
data – sort data and display it in multiple ways, identifying patterns
and variations – interpret results in context, accepting that samples vary and
have no effect on one another
Superhero Statistics 1 of 2
BY THE End OF YEAR 7
3accessed from http://nzmaths.co.nz/ Copyright © new ZeaLand miniStry of eduCation 2012
ILLUSTRATING THE MATHEMATICS STANDARD YEAR 3
YEAR 5
YEAR 6
YEAR 7
YEAR 8
YEAR 2
YEAR 4YEAR
1
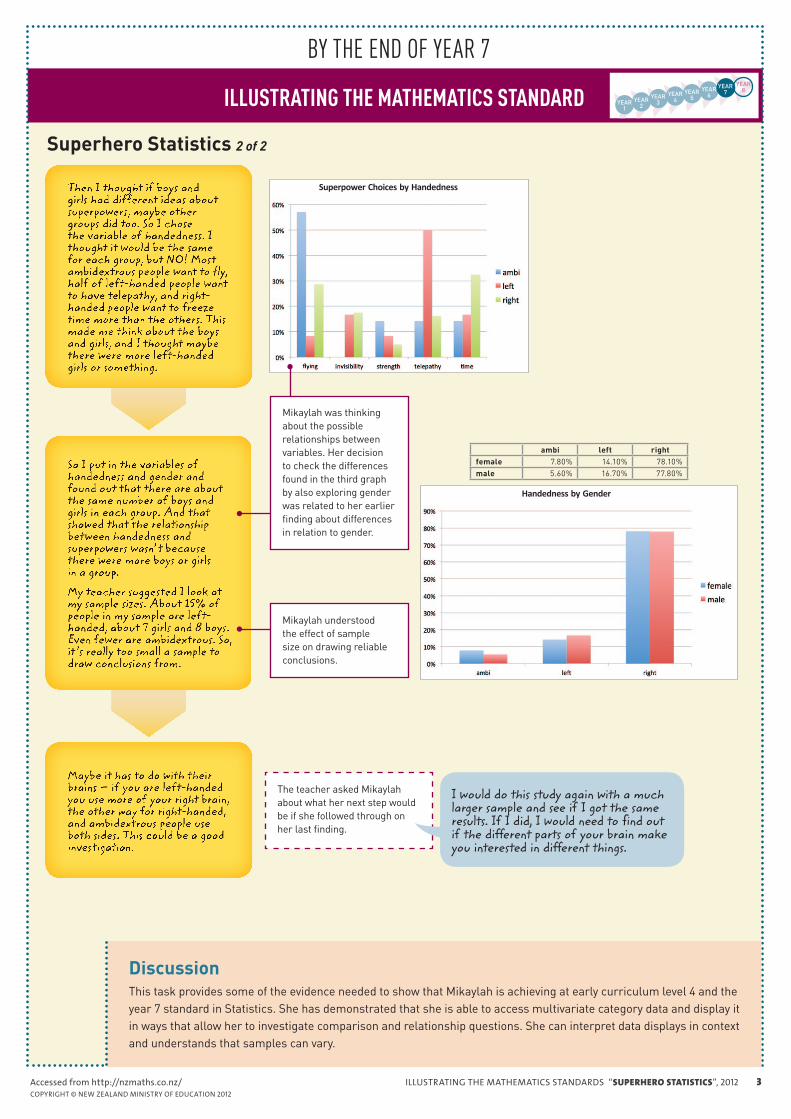
ambi left rightfemale 7.80% 14.10% 78.10%male 5.60% 16.70% 77.80%
The teacher asked Mikaylah about what her next step would be if she followed through on her last finding.
DiscussionThis task provides some of the evidence needed to show that Mikaylah is achieving at early curriculum level 4 and the year 7 standard in Statistics. She has demonstrated that she is able to access multivariate category data and display it in ways that allow her to investigate comparison and relationship questions. She can interpret data displays in context and understands that samples can vary.
iLLuStrating the mathematiCS StandardS “superhero stAtistics”, 2012
I would do this study again with a much larger sample and see if I got the same results. If I did, I would need to find out if the different parts of your brain make you interested in different things.
Superpower Choices by Handedness
Handedness by Gender
Mikaylah was thinking about the possible relationships between variables. Her decision to check the differences found in the third graph by also exploring gender was related to her earlier finding about differences in relation to gender.
Mikaylah understood the effect of sample size on drawing reliable conclusions.
Superhero Statistics 2 of 2
BY THE End OF YEAR 7
4accessed from http://nzmaths.co.nz/ Copyright © new ZeaLand miniStry of eduCation 2012
ILLUSTRATING THE MATHEMATICS STANDARD YEAR 3
YEAR 5
YEAR 6
YEAR 7
YEAR 8
YEAR 2
YEAR 4YEAR
1
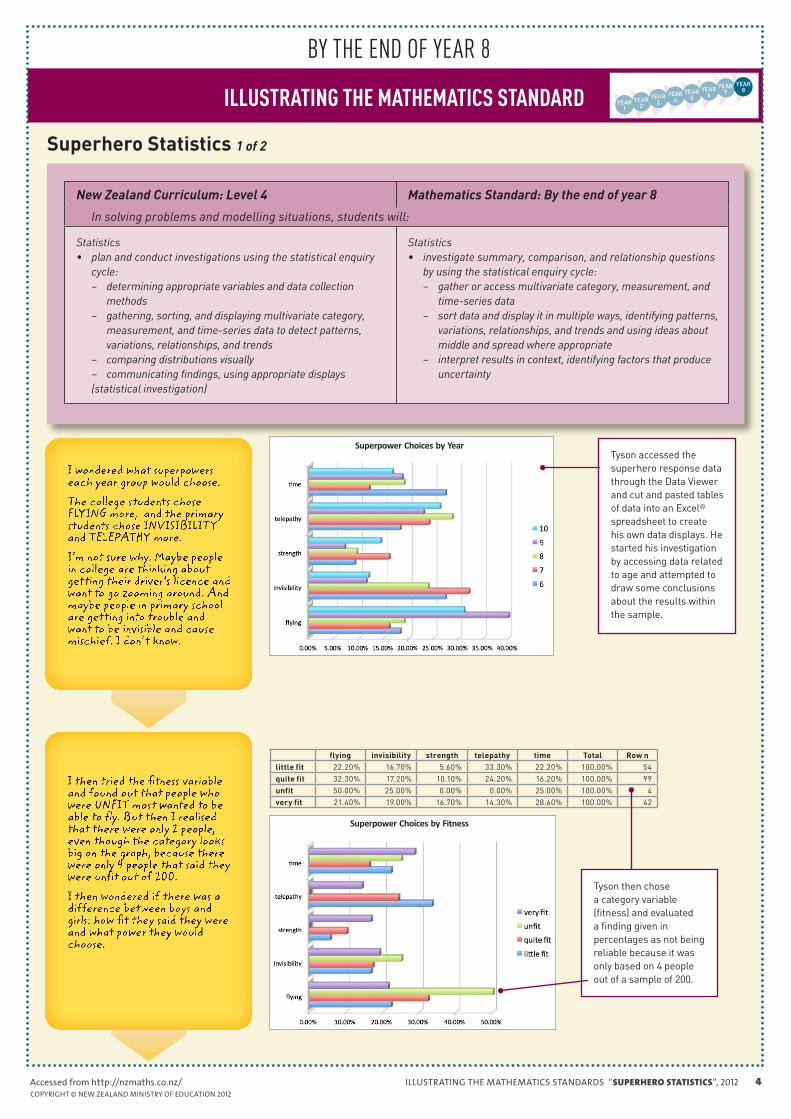
Tyson accessed the superhero response data through the Data Viewer and cut and pasted tables of data into an Excel® spreadsheet to create his own data displays. He started his investigation by accessing data related to age and attempted to draw some conclusions about the results within the sample.
flying invisibility strength telepathy time Total Row nlittle fit 22.20% 16.70% 5.60% 33.30% 22.20% 100.00% 54quite fit 32.30% 17.20% 10.10% 24.20% 16.20% 100.00% 99unfit 50.00% 25.00% 0.00% 0.00% 25.00% 100.00% 4very fit 21.40% 19.00% 16.70% 14.30% 28.60% 100.00% 42
iLLuStrating the mathematiCS StandardS “superhero stAtistics”, 2012
Superpower Choices by Year
Superpower Choices by Fitness
Tyson then chose a category variable (fitness) and evaluated a finding given in percentages as not being reliable because it was only based on 4 people out of a sample of 200.
New Zealand Curriculum: Level 4 Mathematics Standard: By the end of year 8
In solving problems and modelling situations, students will:
Statistics• plan and conduct investigations using the statistical enquiry
cycle: – determining appropriate variables and data collection
methods – gathering, sorting, and displaying multivariate category,
measurement, and time-series data to detect patterns, variations, relationships, and trends
– comparing distributions visually – communicating findings, using appropriate displays
(statistical investigation)
Statistics• investigate summary, comparison, and relationship questions
by using the statistical enquiry cycle: – gather or access multivariate category, measurement, and
time-series data – sort data and display it in multiple ways, identifying patterns,
variations, relationships, and trends and using ideas about middle and spread where appropriate
– interpret results in context, identifying factors that produce uncertainty
Superhero Statistics 1 of 2
BY THE End OF YEAR 8
5accessed from http://nzmaths.co.nz/ Copyright © new ZeaLand miniStry of eduCation 2012
ILLUSTRATING THE MATHEMATICS STANDARD YEAR 3
YEAR 5
YEAR 6
YEAR 7
YEAR 8
YEAR 2
YEAR 4YEAR
1
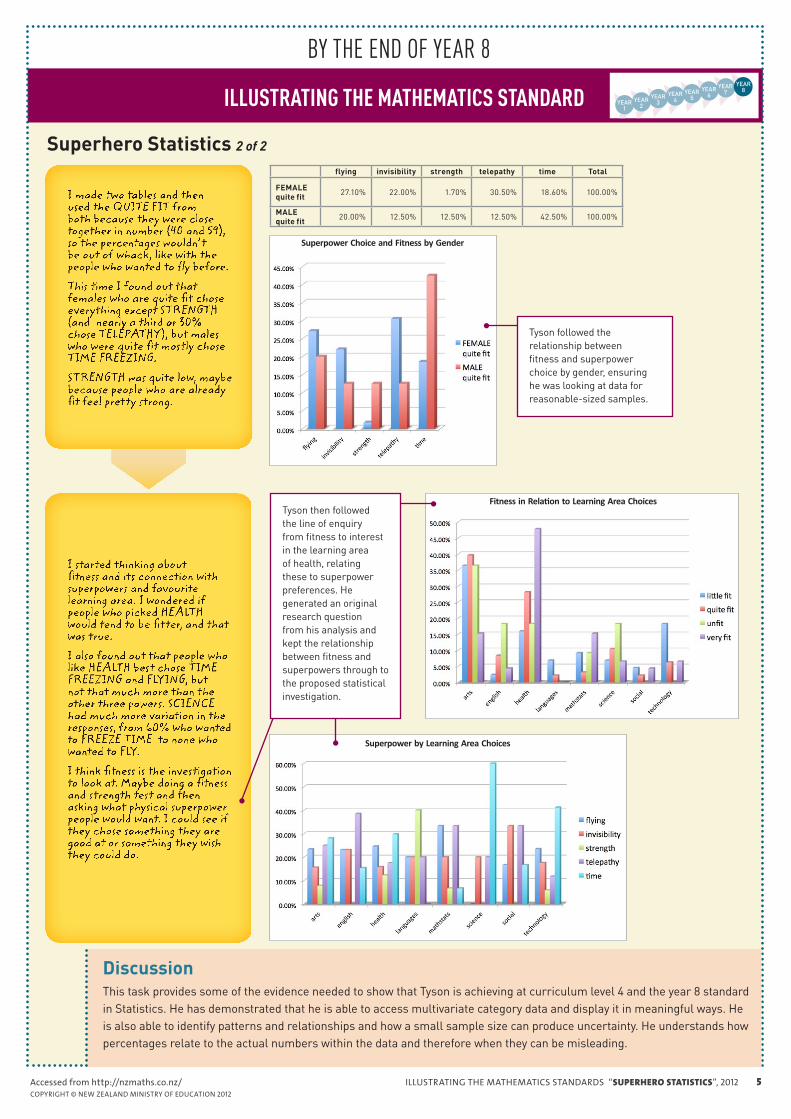
DiscussionThis task provides some of the evidence needed to show that Tyson is achieving at curriculum level 4 and the year 8 standard in Statistics. He has demonstrated that he is able to access multivariate category data and display it in meaningful ways. He is also able to identify patterns and relationships and how a small sample size can produce uncertainty. He understands how percentages relate to the actual numbers within the data and therefore when they can be misleading.
flying invisibility strength telepathy time Total
FEMALE quite fit 27.10% 22.00% 1.70% 30.50% 18.60% 100.00%
MALE quite fit 20.00% 12.50% 12.50% 12.50% 42.50% 100.00%
iLLuStrating the mathematiCS StandardS “superhero stAtistics”, 2012
Tyson followed the relationship between fitness and superpower choice by gender, ensuring he was looking at data for reasonable-sized samples.
Superpower Choice and Fitness by Gender
Fitness in Relation to Learning Area Choices
Superpower by Learning Area Choices
Tyson then followed the line of enquiry from fitness to interest in the learning area of health, relating these to superpower preferences. He generated an original research question from his analysis and kept the relationship between fitness and superpowers through to the proposed statistical investigation.
Superhero Statistics 2 of 2
BY THE End OF YEAR 8