supplemental digital content file manuscript: use of...
TRANSCRIPT
Supplemental Digital Content File
Manuscript: Use of intensive care services for Medicare beneficiaries undergoing major surgical procedures
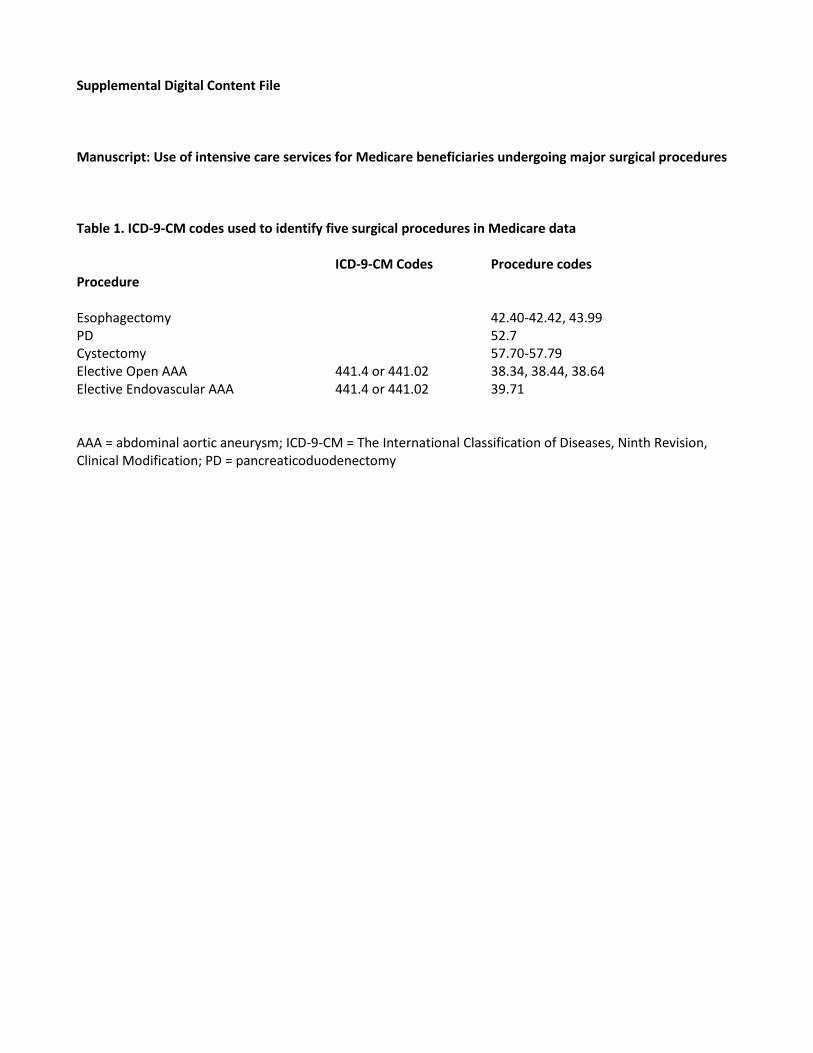
Table 1. ICD-9-CM codes used to identify five surgical procedures in Medicare data ICD-9-CM Codes Procedure codes Procedure Esophagectomy 42.40-42.42, 43.99 PD 52.7 Cystectomy 57.70-57.79 Elective Open AAA 441.4 or 441.02 38.34, 38.44, 38.64 Elective Endovascular AAA 441.4 or 441.02 39.71 AAA = abdominal aortic aneurysm; ICD-9-CM = The International Classification of Diseases, Ninth Revision, Clinical Modification; PD = pancreaticoduodenectomy
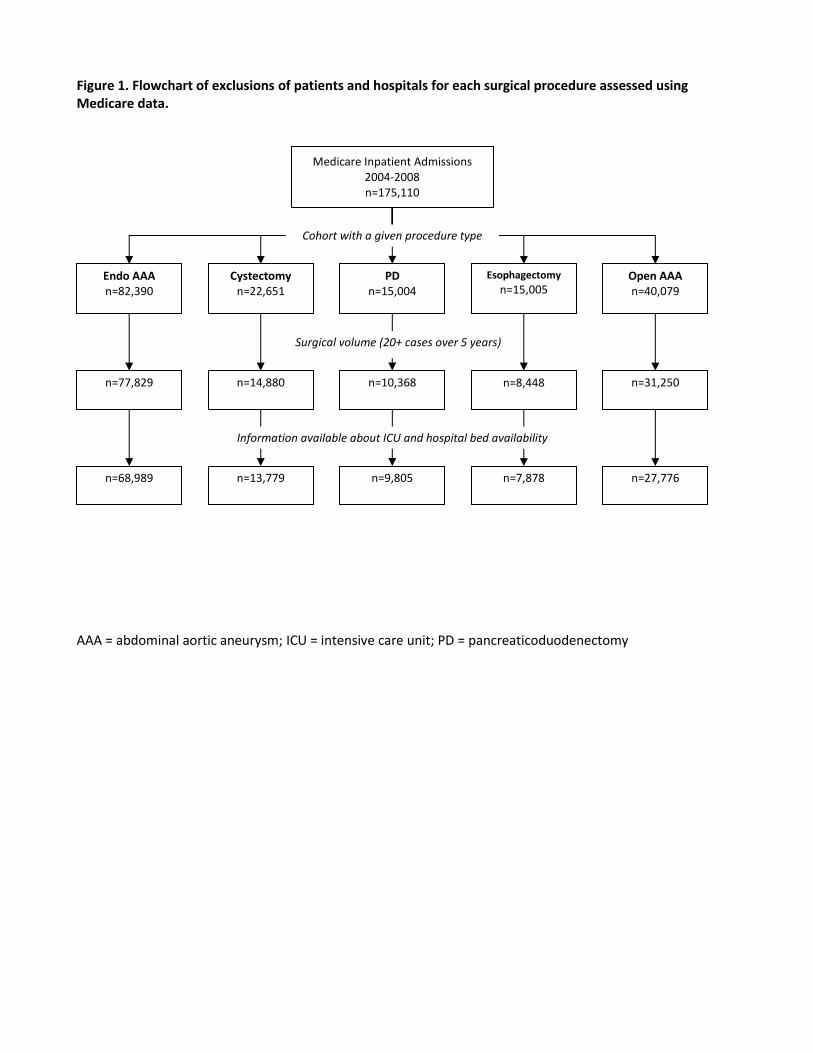
Figure 1. Flowchart of exclusions of patients and hospitals for each surgical procedure assessed using Medicare data.
AAA = abdominal aortic aneurysm; ICU = intensive care unit; PD = pancreaticoduodenectomy
Medicare Inpatient Admissions 2004-2008 n=175,110
Endo AAA n=82,390
Cystectomy n=22,651
PD n=15,004
Esophagectomy
n=15,005
Open AAA n=40,079
n=77,829
n=14,880
n=10,368
n=8,448
n=31,250
n=68,989
n=13,779
n=9,805
n=7,878
n=27,776
Surgical volume (20+ cases over 5 years)
Information available about ICU and hospital bed availability
Cohort with a given procedure type
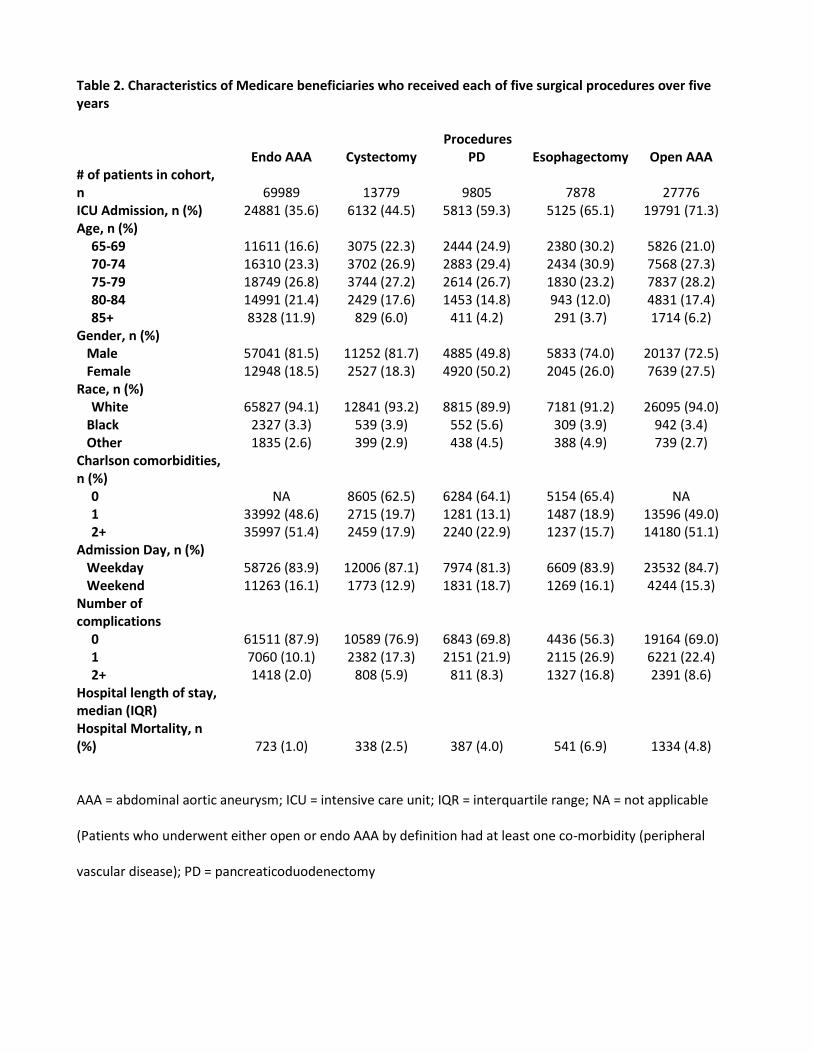
Table 2. Characteristics of Medicare beneficiaries who received each of five surgical procedures over five years
Procedures Endo AAA Cystectomy PD Esophagectomy Open AAA # of patients in cohort, n 69989 13779 9805 7878 27776 ICU Admission, n (%) 24881 (35.6) 6132 (44.5) 5813 (59.3) 5125 (65.1) 19791 (71.3) Age, n (%)
65-69 11611 (16.6) 3075 (22.3) 2444 (24.9) 2380 (30.2) 5826 (21.0) 70-74 16310 (23.3) 3702 (26.9) 2883 (29.4) 2434 (30.9) 7568 (27.3) 75-79 18749 (26.8) 3744 (27.2) 2614 (26.7) 1830 (23.2) 7837 (28.2) 80-84 14991 (21.4) 2429 (17.6) 1453 (14.8) 943 (12.0) 4831 (17.4) 85+ 8328 (11.9) 829 (6.0) 411 (4.2) 291 (3.7) 1714 (6.2)
Gender, n (%) Male 57041 (81.5) 11252 (81.7) 4885 (49.8) 5833 (74.0) 20137 (72.5) Female 12948 (18.5) 2527 (18.3) 4920 (50.2) 2045 (26.0) 7639 (27.5) Race, n (%)
White 65827 (94.1) 12841 (93.2) 8815 (89.9) 7181 (91.2) 26095 (94.0) Black 2327 (3.3) 539 (3.9) 552 (5.6) 309 (3.9) 942 (3.4) Other 1835 (2.6) 399 (2.9) 438 (4.5) 388 (4.9) 739 (2.7) Charlson comorbidities, n (%)
0 NA 8605 (62.5) 6284 (64.1) 5154 (65.4) NA 1 33992 (48.6) 2715 (19.7) 1281 (13.1) 1487 (18.9) 13596 (49.0) 2+ 35997 (51.4) 2459 (17.9) 2240 (22.9) 1237 (15.7) 14180 (51.1)
Admission Day, n (%) Weekday 58726 (83.9) 12006 (87.1) 7974 (81.3) 6609 (83.9) 23532 (84.7) Weekend 11263 (16.1) 1773 (12.9) 1831 (18.7) 1269 (16.1) 4244 (15.3) Number of complications
0 61511 (87.9) 10589 (76.9) 6843 (69.8) 4436 (56.3) 19164 (69.0) 1 7060 (10.1) 2382 (17.3) 2151 (21.9) 2115 (26.9) 6221 (22.4) 2+ 1418 (2.0) 808 (5.9) 811 (8.3) 1327 (16.8) 2391 (8.6)
Hospital length of stay, median (IQR) Hospital Mortality, n (%) 723 (1.0) 338 (2.5) 387 (4.0) 541 (6.9) 1334 (4.8)
AAA = abdominal aortic aneurysm; ICU = intensive care unit; IQR = interquartile range; NA = not applicable
(Patients who underwent either open or endo AAA by definition had at least one co-morbidity (peripheral
vascular disease); PD = pancreaticoduodenectomy
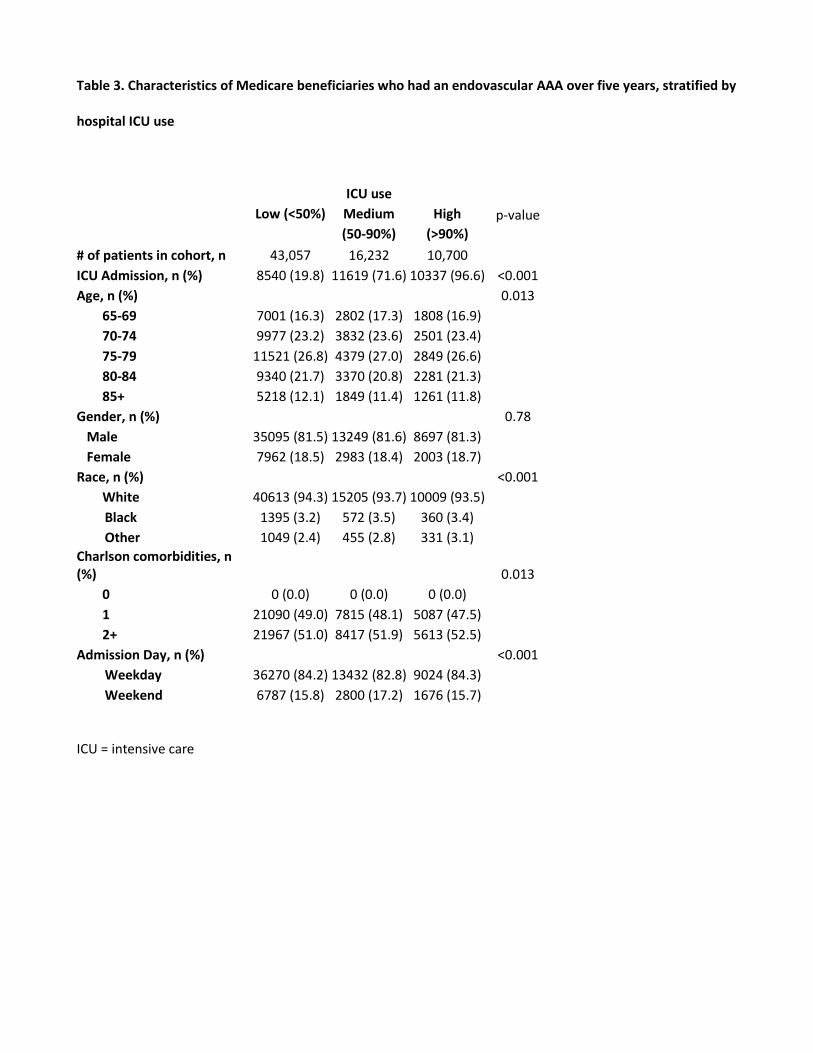
Table 3. Characteristics of Medicare beneficiaries who had an endovascular AAA over five years, stratified by
hospital ICU use
ICU use
Low (<50%) Medium High p-value
(50-90%) (>90%)
# of patients in cohort, n 43,057 16,232 10,700
ICU Admission, n (%) 8540 (19.8) 11619 (71.6) 10337 (96.6) <0.001
Age, n (%)
0.013
65-69 7001 (16.3) 2802 (17.3) 1808 (16.9)
70-74 9977 (23.2) 3832 (23.6) 2501 (23.4)
75-79 11521 (26.8) 4379 (27.0) 2849 (26.6)
80-84 9340 (21.7) 3370 (20.8) 2281 (21.3)
85+ 5218 (12.1) 1849 (11.4) 1261 (11.8)
Gender, n (%)
0.78
Male 35095 (81.5) 13249 (81.6) 8697 (81.3)
Female 7962 (18.5) 2983 (18.4) 2003 (18.7)
Race, n (%)
<0.001
White 40613 (94.3) 15205 (93.7) 10009 (93.5)
Black 1395 (3.2) 572 (3.5) 360 (3.4)
Other 1049 (2.4) 455 (2.8) 331 (3.1)
Charlson comorbidities, n (%)
0.013
0 0 (0.0) 0 (0.0) 0 (0.0)
1 21090 (49.0) 7815 (48.1) 5087 (47.5)
2+ 21967 (51.0) 8417 (51.9) 5613 (52.5)
Admission Day, n (%)
<0.001
Weekday 36270 (84.2) 13432 (82.8) 9024 (84.3)
Weekend 6787 (15.8) 2800 (17.2) 1676 (15.7)
ICU = intensive care
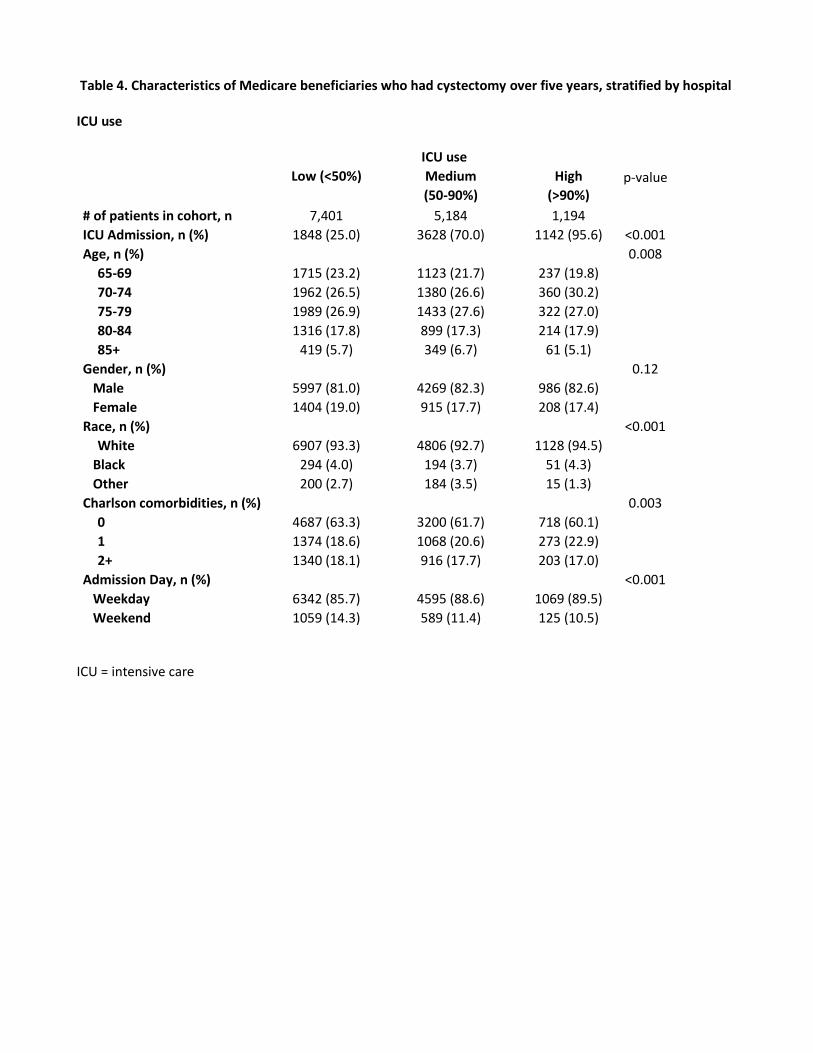
Table 4. Characteristics of Medicare beneficiaries who had cystectomy over five years, stratified by hospital
ICU use
ICU use Low (<50%) Medium High p-value
(50-90%) (>90%)
# of patients in cohort, n 7,401 5,184 1,194
ICU Admission, n (%) 1848 (25.0) 3628 (70.0) 1142 (95.6) <0.001
Age, n (%)
0.008
65-69 1715 (23.2) 1123 (21.7) 237 (19.8)
70-74 1962 (26.5) 1380 (26.6) 360 (30.2)
75-79 1989 (26.9) 1433 (27.6) 322 (27.0)
80-84 1316 (17.8) 899 (17.3) 214 (17.9)
85+ 419 (5.7) 349 (6.7) 61 (5.1)
Gender, n (%)
0.12
Male 5997 (81.0) 4269 (82.3) 986 (82.6)
Female 1404 (19.0) 915 (17.7) 208 (17.4)
Race, n (%)
<0.001
White 6907 (93.3) 4806 (92.7) 1128 (94.5)
Black 294 (4.0) 194 (3.7) 51 (4.3)
Other 200 (2.7) 184 (3.5) 15 (1.3)
Charlson comorbidities, n (%)
0.003
0 4687 (63.3) 3200 (61.7) 718 (60.1)
1 1374 (18.6) 1068 (20.6) 273 (22.9)
2+ 1340 (18.1) 916 (17.7) 203 (17.0)
Admission Day, n (%)
<0.001
Weekday 6342 (85.7) 4595 (88.6) 1069 (89.5)
Weekend 1059 (14.3) 589 (11.4) 125 (10.5)
ICU = intensive care

Table 5. Characteristics of Medicare beneficiaries who had a pancreaticoduodenectomy over five years,
stratified by hospital ICU use
ICU use
Low (<50%) Medium High p-value
(50-90%) (>90%)
# of patients in cohort, n 3,419 3,977 2,409
ICU Admission, n (%) 868 (25.4) 2882 (72.5) 2328 (96.6) <0.001
Age, n (%)
0.153
65-69 810 (23.7) 1008 (25.3) 626 (26.0)
70-74 1031 (30.2) 1168 (29.4) 684 (28.4)
75-79 919 (26.9) 1036 (26.0) 659 (27.4)
80-84 502 (14.7) 616 (15.5) 335 (13.9)
85+ 157 (4.6) 149 (3.7) 105 (4.4)
Gender, n (%)
0.802
Male 1691 (49.5) 1997 (50.2) 1197 (49.7)
Female 1728 (50.5) 1980 (49.8) 1212 (50.3)
Race, n (%)
<0.001
White 3122 (91.3) 3535 (88.9) 2158 (89.6)
Black 146 (4.3) 252 (6.3) 154 (6.4)
Other 151 (4.4) 190 (4.8) 97 (4.0)
Charlson comorbidities, n (%)
0.141
0 2238 (65.5) 2499 (62.8) 1547 (64.2)
1 421 (12.3) 532 (13.4) 328 (13.6)
2+ 760 (22.2) 946 (23.8) 534 (22.2)
Admission Day, n (%)
0.225
Weekday 2811 (82.2) 3208 (80.7) 1955 (81.2)
Weekend 608 (17.8) 769 (19.3) 454 (18.8)
ICU = intensive care

Table 6. Characteristics of Medicare beneficiaries who had an esophagectomy over five years, stratified by
hospital ICU use
ICU use Low
(<50%) Medium High p-value (50-90%) (>90%)
# of patients in cohort, n 1,621 3,786 2,471
ICU Admission, n (%) 509
(31.4) 2679 (70.8) 2354 (95.3) <0.001
Age, n (%)
0.864
65-69 513
(31.6) 1121 (29.6) 746 (30.2)
70-74 497
(30.7) 1161 (30.7) 776 (31.4)
75-79 360
(22.2) 898 (23.7) 572 (23.1)
80-84 195
(12.0) 463 (12.2) 285 (11.5)
85+ 56 (3.5) 143 (3.8) 92 (3.7)
Gender, n (%)
0.016
Male 1245 (76.8) 2782 (73.5) 1806 (73.1)
Female 376
(23.2) 1004 (26.5) 665 (26.9)
Race, n (%)
<0.001
White 1463 (90.3) 3448 (91.1) 2270 (91.9)
Black 48 (3.0) 162 (4.3) 99 (4.0)
Other 110 (6.8) 176 (4.6) 102 (4.1) Charlson comorbidities, n (%)
0.108
0 1080 (66.6) 2475 (65.4) 1599 (64.7)
1 282
(17.4) 700 (18.5) 505 (20.4)
2+ 259
(16.0) 611 (16.1) 367 (14.9)
Admission Day, n (%)
0.026
Weekday 1391 (85.8) 3176 (83.9) 2042 (82.6)
Weekend 230
(14.2) 610 (16.1) 429 (17.4)
ICU = intensive care

Table 7. Characteristics of Medicare beneficiaries who had an open AAA over five years, stratified by
hospital ICU use
ICU use Low
(<50%) Medium High p-value (50-90%) (>90%)
# of patients in cohort, n 1,990 9,725 16,061
ICU Admission, n (%) 701
(35.2) 7297 (75.0) 15547 (96.8) <0.001
Age, n (%)
0.32
65-69 424
(21.3) 2102 (21.6) 3300 (20.5)
70-74 519
(26.1) 2618 (26.9) 4431 (27.6)
75-79 565
(28.4) 2744 (28.2) 4528 (28.2)
80-84 357
(17.9) 1697 (17.4) 2777 (17.3)
85+ 125 (6.3) 564 (5.8) 1025 (6.4)
Gender, n (%)
0.60
Male 1460 (73.4) 7028 (72.3) 11649 (72.5)
Female 530
(26.6) 2697 (27.7) 4412 (27.5)
Race, n (%)
<0.001
White 1871 (94.0) 9086 (93.4) 15138 (94.3)
Black 74 (3.7) 322 (3.3) 546 (3.4)
Other 45 (2.3) 317 (3.3) 377 (2.3) Charlson comorbidities, n (%)
0.11
0 0 (0.0) 0 (0.0) 0 (0.0)
1 1008 (50.7) 4785 (49.2) 7803 (48.6)
2+ 982
(49.3) 4940 (50.8) 8258 (51.4)
Admission Day, n (%)
0.026
Weekday 1667 (83.8) 8179 (84.1) 13686 (85.2)
Weekend 323
(16.2) 1546 (15.9) 2375 (14.8)
ICU = intensive care
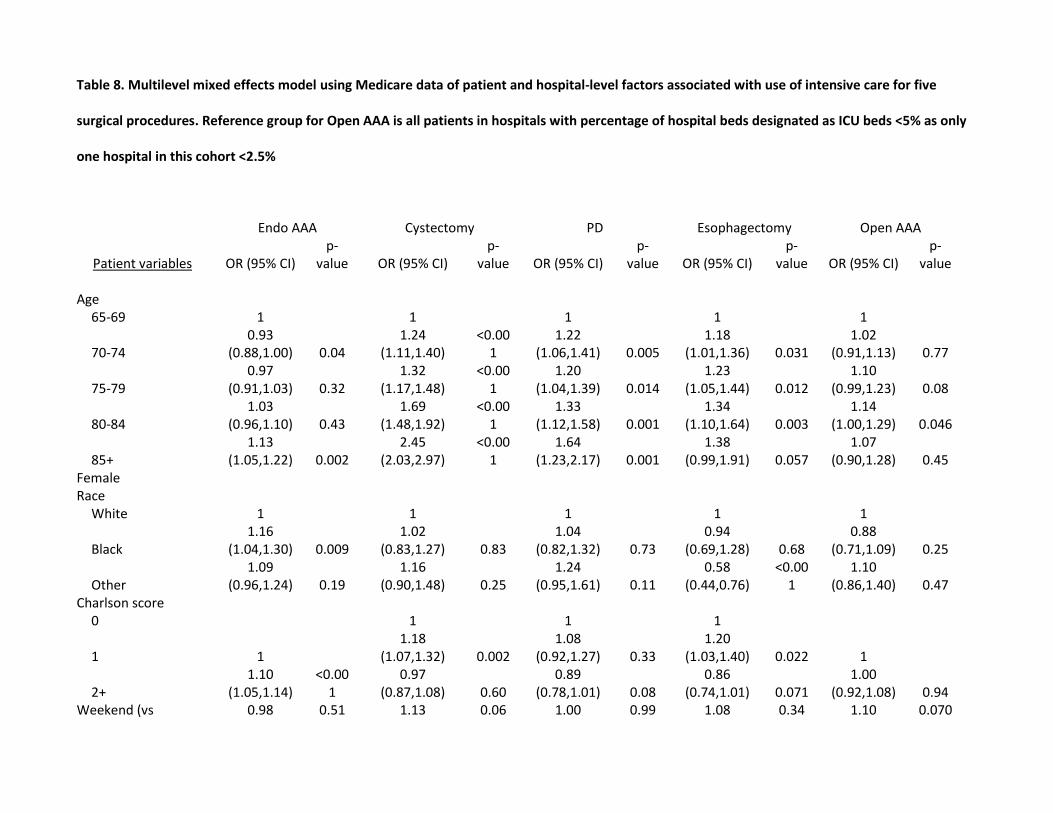
Table 8. Multilevel mixed effects model using Medicare data of patient and hospital-level factors associated with use of intensive care for five
surgical procedures. Reference group for Open AAA is all patients in hospitals with percentage of hospital beds designated as ICU beds <5% as only
one hospital in this cohort <2.5%
Endo AAA Cystectomy PD Esophagectomy Open AAA
Patient variables OR (95% CI) p-
value OR (95% CI) p-
value OR (95% CI) p-
value OR (95% CI) p-
value OR (95% CI) p-
value Age
65-69 1 1 1 1 1
70-74 0.93
(0.88,1.00) 0.04 1.24
(1.11,1.40) <0.00
1 1.22
(1.06,1.41) 0.005 1.18
(1.01,1.36) 0.031 1.02
(0.91,1.13) 0.77
75-79 0.97
(0.91,1.03) 0.32 1.32
(1.17,1.48) <0.00
1 1.20
(1.04,1.39) 0.014 1.23
(1.05,1.44) 0.012 1.10
(0.99,1.23) 0.08
80-84 1.03
(0.96,1.10) 0.43 1.69
(1.48,1.92) <0.00
1 1.33
(1.12,1.58) 0.001 1.34
(1.10,1.64) 0.003 1.14
(1.00,1.29) 0.046
85+ 1.13
(1.05,1.22) 0.002 2.45
(2.03,2.97) <0.00
1 1.64
(1.23,2.17) 0.001 1.38
(0.99,1.91) 0.057 1.07
(0.90,1.28) 0.45 Female Race
White 1 1 1 1 1
Black 1.16
(1.04,1.30) 0.009 1.02
(0.83,1.27) 0.83 1.04
(0.82,1.32) 0.73 0.94
(0.69,1.28) 0.68 0.88
(0.71,1.09) 0.25
Other 1.09
(0.96,1.24) 0.19 1.16
(0.90,1.48) 0.25 1.24
(0.95,1.61) 0.11 0.58
(0.44,0.76) <0.00
1 1.10
(0.86,1.40) 0.47 Charlson score
0 1 1 1
1 1 1.18
(1.07,1.32) 0.002 1.08
(0.92,1.27) 0.33 1.20
(1.03,1.40) 0.022 1
2+ 1.10
(1.05,1.14) <0.00
1 0.97
(0.87,1.08) 0.60 0.89
(0.78,1.01) 0.08 0.86
(0.74,1.01) 0.071 1.00
(0.92,1.08) 0.94 Weekend (vs 0.98 0.51 1.13 0.06 1.00 0.99 1.08 0.34 1.10 0.070

weekday) (0.93,1.04) (0.99,1.28) (0.87,1.15) (0.92,1.27) (0.99,1.23) Hospital variables
Median Odds Ratio 6.20
(5.62,6.87) 3.59
(3.16,4.14) 4.61
(3.81,5.74) 3.29
(2.81,3.95) 5.12
(4.50,5.90) Academic (vs non-academic)
0.89 (0.66,1.22) 0.47
1.39 (0.80,2.39) 0.24
0.16 (0.03,0.80) 0.026
1.28 (0.50,3.27) 0.60
1.04 (0.70,1.55) 0.83
Hospital beds <200 1 1 1 1 1 200-399 0.43
(0.26,0.71) 0.001 0.91
(0.34,2.43) 0.85 0.25
(0.02,2.86) 0.27 0.24
(0.04,1.41) 0.12 0.75
(0.35,1.61) 0.46 400-599 0.67
(0.34,1.31) 0.24 0.79
(0.24,2.56) 0.70 0.66
(0.05,8.51) 0.75 0.52
(0.07,3.62) 0.51 0.73
(0.29,1.87) 0.52 600-799 0.96
(0.38,2.39) 0.93 0.89
(0.24,3.35) 0.86 1.80
(0.12,27.39) 0.67 0.64
(0.08,5.10) 0.68 1.05
(0.34,3.21) 0.94 800-999 0.76
(0.17,3.52) 0.73 0.48
(0.09,2.53) 0.39 1.53
(0.07,31.29) 0.78 0.43
(0.04,4.67) 0.49 2.05
(0.40,10.60) 0.39 1000+ 0.86
(0.06,11.53) 0.91 0.03
(0.00,0.97) 0.048 0.80
(0.01,85.51) 0.93 0.95
(0.04,22.97) 0.97 0.37
(0.02,6.92) 0.51 Average daily census
<200 1 1 1 1 1 200-399 0.98
(0.66,1.44) 0.91 2.91
(1.15,7.40) 0.025 2.07
(0.23,18.72) 0.52 3.74
(0.61,23.15) 0.16 0.97
(0.57,1.66) 0.91 400-599 0.76
(0.38,1.52) 0.44 2.97
(0.97,9.03) 0.056 1.14
(0.10,13.43) 0.92 3.60
(0.48,26.83) 0.21 0.52
(0.23,1.17) 0.12 600-799 0.56
(0.17,1.83) 0.34 4.40
(1.11,17.50) 0.035 1.74
(0.12,26.17) 0.69 4.65
(0.53,41.07) 0.17 0.37
(0.11,1.30) 0.12 800-999 0.33
(0.02,5.07) 0.42 57.67
(2.26,1473.36) 0.014 1.72
(0.02,143.63) 0.81 3.65
(0.17,80.70) 0.41 0.51
(0.03,8.52) 0.64 1000+ 0.27
(0.01,5.43) 0.39 90.44
(2.59,3154.97) 0.013 1.60
(0.01,218.81) 0.85 1.77
(0.06,50.46) 0.74 0.53
(0.02,12.84) 0.70 Number of surgeries annually, median
<2500 1 1 1 1 1 2500-4999 0.70
(0.40,1.20) 0.19 1.29
(0.41,4.07) 0.66 20.88
(0.58,757.98) 0.10 16.81
(0.98,289.39) 0.052 1.53
(0.65,3.62) 0.33
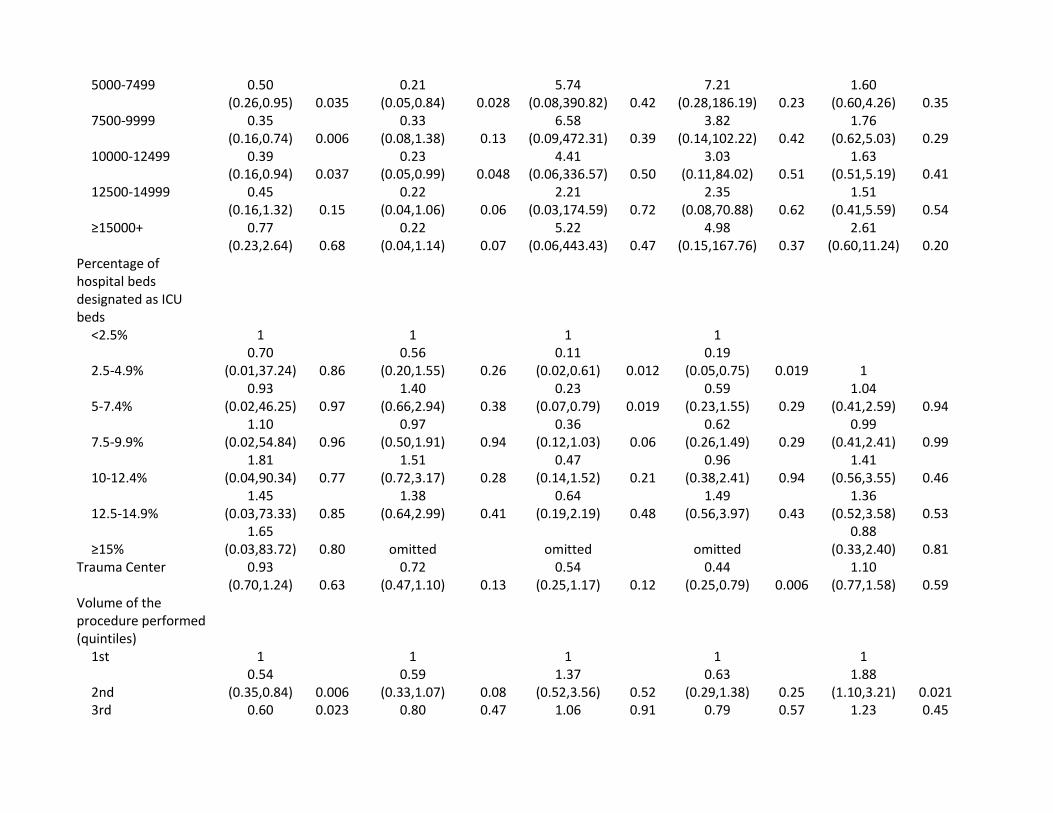
5000-7499 0.50 (0.26,0.95) 0.035
0.21 (0.05,0.84) 0.028
5.74 (0.08,390.82) 0.42
7.21 (0.28,186.19) 0.23
1.60 (0.60,4.26) 0.35
7500-9999 0.35 (0.16,0.74) 0.006
0.33 (0.08,1.38) 0.13
6.58 (0.09,472.31) 0.39
3.82 (0.14,102.22) 0.42
1.76 (0.62,5.03) 0.29
10000-12499 0.39 (0.16,0.94) 0.037
0.23 (0.05,0.99) 0.048
4.41 (0.06,336.57) 0.50
3.03 (0.11,84.02) 0.51
1.63 (0.51,5.19) 0.41
12500-14999 0.45 (0.16,1.32) 0.15
0.22 (0.04,1.06) 0.06
2.21 (0.03,174.59) 0.72
2.35 (0.08,70.88) 0.62
1.51 (0.41,5.59) 0.54
≥15000+ 0.77 (0.23,2.64) 0.68
0.22 (0.04,1.14) 0.07
5.22 (0.06,443.43) 0.47
4.98 (0.15,167.76) 0.37
2.61 (0.60,11.24) 0.20
Percentage of hospital beds designated as ICU beds
<2.5% 1 1 1 1
1 2.5-4.9% 0.70
(0.01,37.24) 0.86 0.56
(0.20,1.55) 0.26 0.11
(0.02,0.61) 0.012 0.19
(0.05,0.75) 0.019
5-7.4% 0.93
(0.02,46.25) 0.97 1.40
(0.66,2.94) 0.38 0.23
(0.07,0.79) 0.019 0.59
(0.23,1.55) 0.29 1.04
(0.41,2.59) 0.94
7.5-9.9% 1.10
(0.02,54.84) 0.96 0.97
(0.50,1.91) 0.94 0.36
(0.12,1.03) 0.06 0.62
(0.26,1.49) 0.29 0.99
(0.41,2.41) 0.99
10-12.4% 1.81
(0.04,90.34) 0.77 1.51
(0.72,3.17) 0.28 0.47
(0.14,1.52) 0.21 0.96
(0.38,2.41) 0.94 1.41
(0.56,3.55) 0.46
12.5-14.9% 1.45
(0.03,73.33) 0.85 1.38
(0.64,2.99) 0.41 0.64
(0.19,2.19) 0.48 1.49
(0.56,3.97) 0.43 1.36
(0.52,3.58) 0.53
≥15% 1.65
(0.03,83.72) 0.80 omitted omitted omitted 0.88
(0.33,2.40) 0.81 Trauma Center 0.93
(0.70,1.24) 0.63 0.72
(0.47,1.10) 0.13 0.54
(0.25,1.17) 0.12 0.44
(0.25,0.79) 0.006 1.10
(0.77,1.58) 0.59 Volume of the procedure performed (quintiles)
1st 1 1 1 1 1
2nd 0.54
(0.35,0.84) 0.006 0.59
(0.33,1.07) 0.08 1.37
(0.52,3.56) 0.52 0.63
(0.29,1.38) 0.25 1.88
(1.10,3.21) 0.021 3rd 0.60 0.023 0.80 0.47 1.06 0.91 0.79 0.57 1.23 0.45

(0.38,0.93) (0.43,1.47) (0.43,2.61) (0.34,1.81) (0.72,2.08)
4th 0.40
(0.25,0.63) <0.00
1 0.69
(0.37,1.27) 0.23 0.96
(0.37,2.52) 0.94 0.83
(0.37,1.85) 0.65 0.94
(0.55,1.61) 0.83
5th 0.17
(0.10,0.28) <0.00
1 0.50
(0.27,0.94) 0.033 0.66
(0.25,1.71) 0.39 0.36
(0.15,0.86) 0.022 1.13
(0.64,1.99) 0.68
AAA = abdominal aortic aneurysm; ICU = intensive care unit; PD = pancreaticoduodenectomy